Embed Size (px)
Citation preview
FINANCIAL RESULTS
for 2 quarter 2021
GETIN NOBLE BANK S.A.
PRESENTATION FOR INVESTORS AND ANALYSTS
August 20, 2021
1
Agenda
01 Summary
02 Business overview
03 Financial results
04 Credit risk
05 Appendix
- 246,9
- 87,9
3,5
Q2'20 Q1'21 Q2'21
266240
260
Q2'20 Q1'21 Q2'21
184167 172
Q2'20 Q1'21 Q2'21
-2,3% -6,8%
8,2% 2,9%
2nd quarter of 2021 - key financial information (1/3)
3
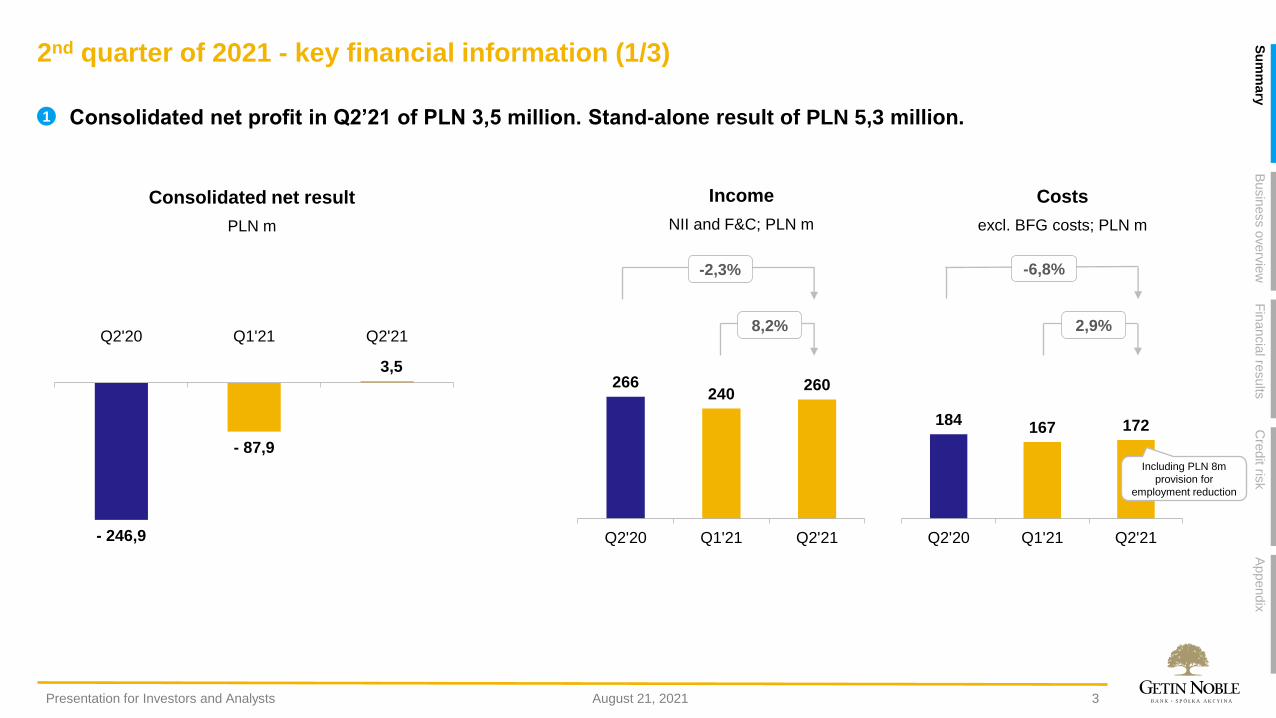
▪ Consolidated net profit in Q2’21 of PLN 3,5 million. Stand-alone result of PLN 5,3 million.1
Including PLN 8m
provision for
employment reduction
August 21, 2021Presentation for Investors and Analysts
Su
mm
ary
Busin
ess o
verv
iew
Fin
ancia
l results
Appendix
Cre
dit ris
k
Consolidated net result
PLN m
Income
NII and F&C; PLN m
Costs
excl. BFG costs; PLN m
2nd quarter of 2021 - key financial information (2/3)
4
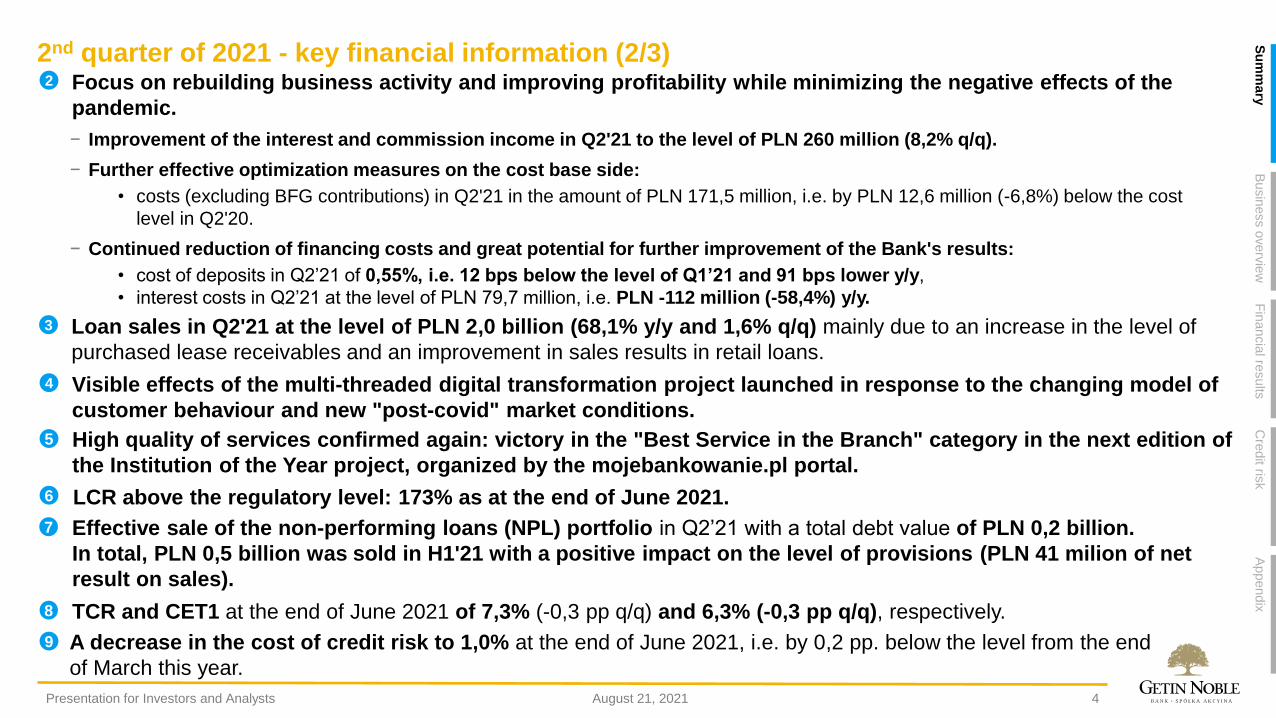
▪ LCR above the regulatory level: 173% as at the end of June 2021. 6
▪ Effective sale of the non-performing loans (NPL) portfolio in Q2’21 with a total debt value of PLN 0,2 billion.
In total, PLN 0,5 billion was sold in H1'21 with a positive impact on the level of provisions (PLN 41 milion of net
result on sales).
7
▪ TCR and CET1 at the end of June 2021 of 7,3% (-0,3 pp q/q) and 6,3% (-0,3 pp q/q), respectively.8
▪ A decrease in the cost of credit risk to 1,0% at the end of June 2021, i.e. by 0,2 pp. below the level from the end
of March this year.
9
▪ Focus on rebuilding business activity and improving profitability while minimizing the negative effects of the
pandemic.
− Improvement of the interest and commission income in Q2'21 to the level of PLN 260 million (8,2% q/q).
− Further effective optimization measures on the cost base side:
• costs (excluding BFG contributions) in Q2'21 in the amount of PLN 171,5 million, i.e. by PLN 12,6 million (-6,8%) below the cost
level in Q2'20.
− Continued reduction of financing costs and great potential for further improvement of the Bank's results:
• cost of deposits in Q2’21 of 0,55%, i.e. 12 bps below the level of Q1’21 and 91 bps lower y/y,
• interest costs in Q2’21 at the level of PLN 79,7 million, i.e. PLN -112 million (-58,4%) y/y.
2
▪ Visible effects of the multi-threaded digital transformation project launched in response to the changing model of
customer behaviour and new "post-covid" market conditions.
4
▪ Loan sales in Q2'21 at the level of PLN 2,0 billion (68,1% y/y and 1,6% q/q) mainly due to an increase in the level of
purchased lease receivables and an improvement in sales results in retail loans.
3
August 21, 2021Presentation for Investors and Analysts
Su
mm
ary
Busin
ess o
verv
iew
Fin
ancia
l results
Appendix
Cre
dit ris
k
▪ High quality of services confirmed again: victory in the "Best Service in the Branch" category in the next edition of
the Institution of the Year project, organized by the mojebankowanie.pl portal.
5
2nd quarter of 2021 - key financial information (3/3)
5
Po
dsu
mo
wan
ieR
ozw
ój b
iznesu
Wynik
i finansow
eZ
ałą
cznik
iR
yzyko k
redyto
we
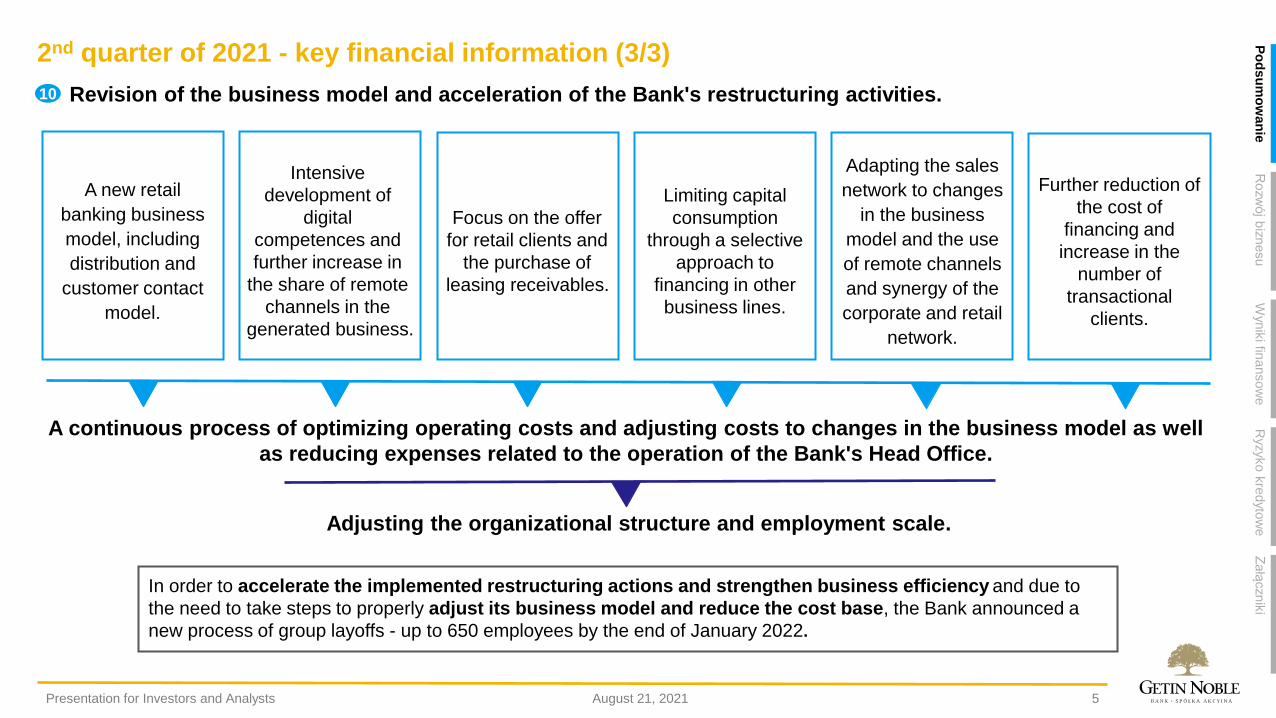
A continuous process of optimizing operating costs and adjusting costs to changes in the business model as well
as reducing expenses related to the operation of the Bank's Head Office.
Adjusting the organizational structure and employment scale.
In order to accelerate the implemented restructuring actions and strengthen business efficiency and due to
the need to take steps to properly adjust its business model and reduce the cost base, the Bank announced a
new process of group layoffs - up to 650 employees by the end of January 2022.
▪ Revision of the business model and acceleration of the Bank's restructuring activities.10
A new retail
banking business
model, including
distribution and
customer contact
model.
Intensive
development of
digital
competences and
further increase in
the share of remote
channels in the
generated business.
Focus on the offer
for retail clients and
the purchase of
leasing receivables.
Limiting capital
consumption
through a selective
approach to
financing in other
business lines.
Adapting the sales
network to changes
in the business
model and the use
of remote channels
and synergy of the
corporate and retail
network.
Further reduction of
the cost of
financing and
increase in the
number of
transactional
clients.
August 21, 2021Presentation for Investors and Analysts

Agenda
01 Summary
02 Business overview
03 Financial results
04 Credit risk
05 Appendix
74,3%
4,4%
3,9%
3,7%
3,5%
1,8%
1,5%
1,2%1,0%
5,0%
25,7%
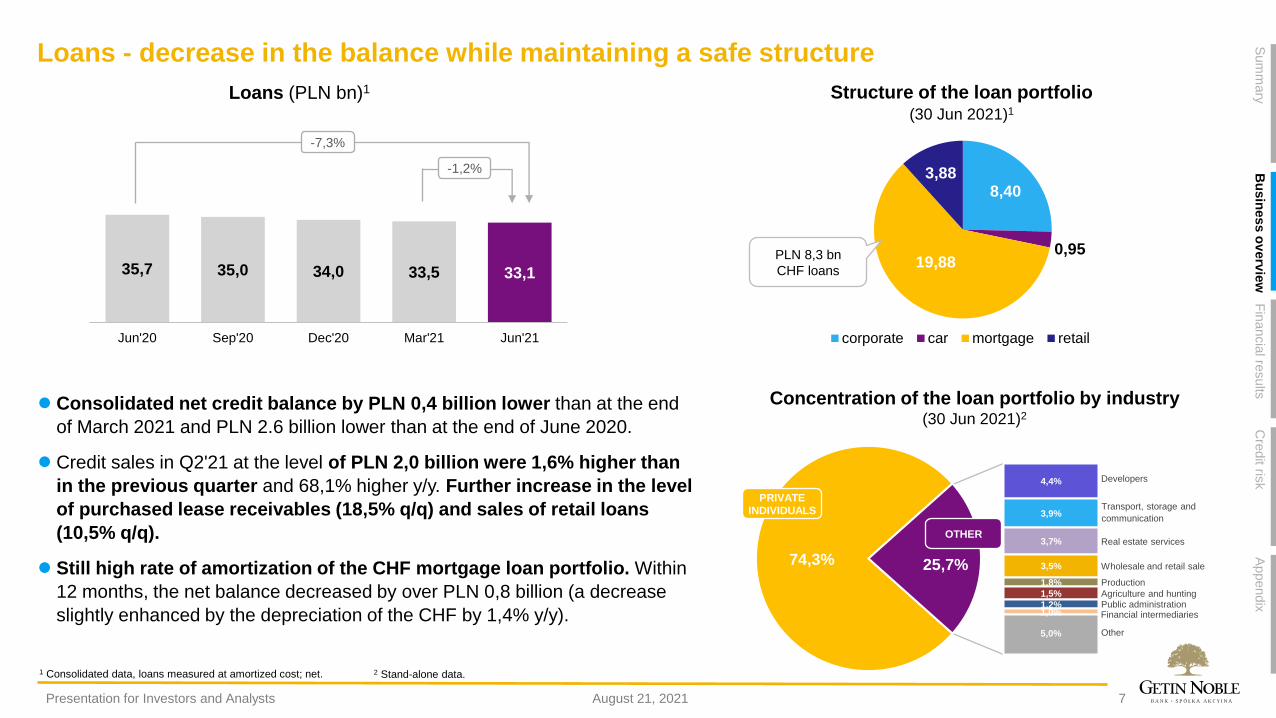
Loans - decrease in the balance while maintaining a safe structure
7
⚫ Consolidated net credit balance by PLN 0,4 billion lower than at the end
of March 2021 and PLN 2.6 billion lower than at the end of June 2020.
⚫ Credit sales in Q2'21 at the level of PLN 2,0 billion were 1,6% higher than
in the previous quarter and 68,1% higher y/y. Further increase in the level
of purchased lease receivables (18,5% q/q) and sales of retail loans
(10,5% q/q).
⚫ Still high rate of amortization of the CHF mortgage loan portfolio. Within
12 months, the net balance decreased by over PLN 0,8 billion (a decrease
slightly enhanced by the depreciation of the CHF by 1,4% y/y).
35,7 35,0 34,0 33,5 33,1
Jun'20 Sep'20 Dec'20 Mar'21 Jun'21
-1,2%
-7,3%
8,40
0,9519,88
3,88
corporate car mortgage retail
PLN 8,3 bn
CHF loans
Developers
Real estate services
Wholesale and retail sale
Transport, storage and
communication
Production
Financial intermediariesPublic administrationAgriculture and hunting
Other
PRIVATE
INDIVIDUALS
OTHER
August 21, 2021Presentation for Investors and Analysts
Sum
mary
Bu
sin
ess o
verv
iew
Fin
ancia
l results
Appendix
Cre
dit ris
k
Loans (PLN bn)1 Structure of the loan portfolio (30 Jun 2021)1
Concentration of the loan portfolio by industry(30 Jun 2021)2
1 Consolidated data, loans measured at amortized cost; net. 2 Stand-alone data.
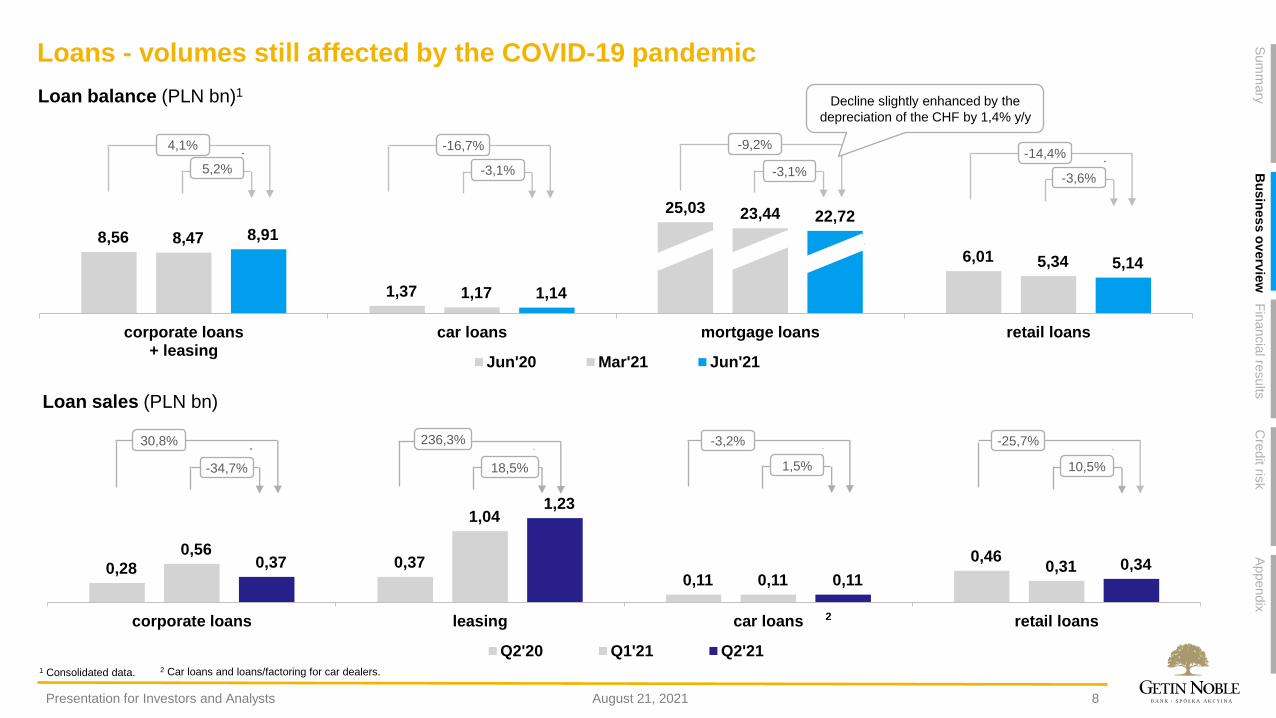
Loans - volumes still affected by the COVID-19 pandemic
8
8,56
1,37
25,03
6,01 8,47
1,17
23,44
5,34
8,91
1,14
22,72
5,14
corporate loans+ leasing
car loans mortgage loans retail loans
Jun'20 Mar'21 Jun'21
2
5,2%
4,1%
-3,1%
-9,2%
Decline slightly enhanced by the
depreciation of the CHF by 1,4% y/y
-3,6%
-14,4%
0,28 0,37 0,11
0,46 0,56
1,04
0,11 0,31 0,37
1,23
0,11 0,34
corporate loans leasing car loans retail loans
Q2'20 Q1'21 Q2'21
-34,7%
30,8%
1,5%
-3,2%
10,5%
-25,7%
18,5%
236,3%
-3,1%
-16,7%
August 21, 2021Presentation for Investors and Analysts
Sum
mary
Bu
sin
ess o
verv
iew
Fin
ancia
l results
Appendix
Cre
dit ris
k
Loan balance (PLN bn)1
Loan sales (PLN bn)
1 Consolidated data. 2 Car loans and loans/factoring for car dealers.
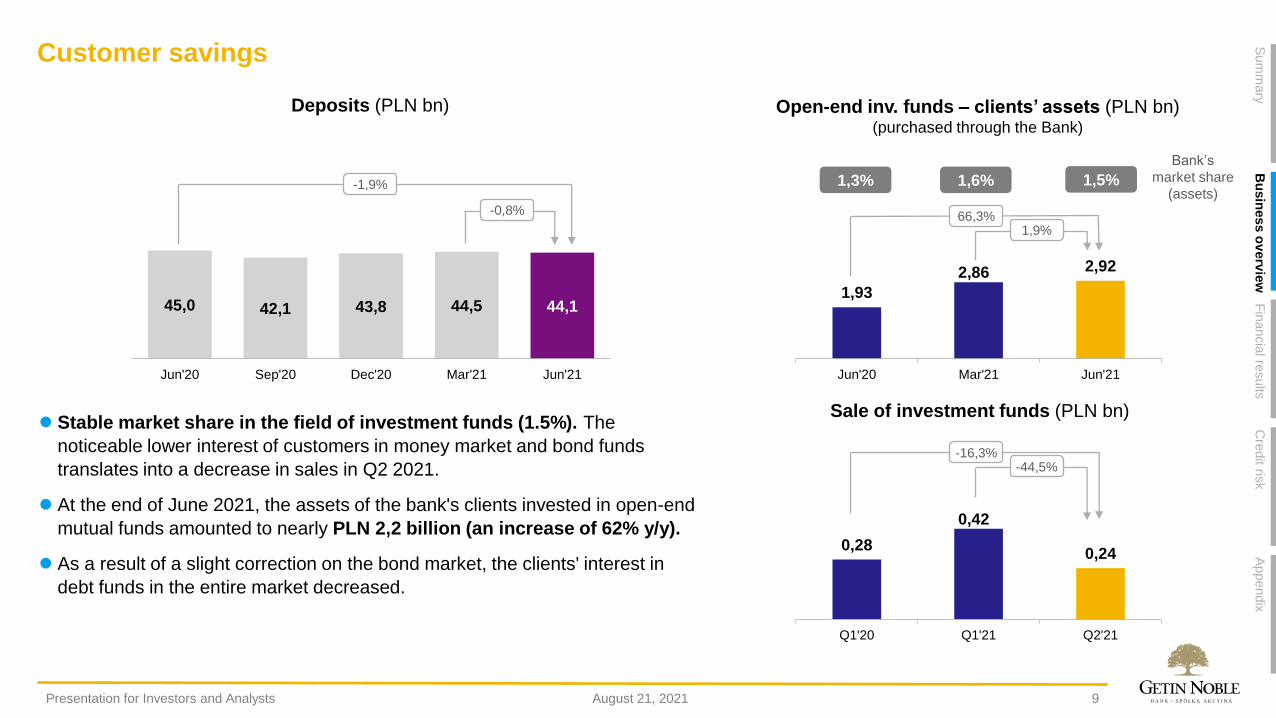
Customer savings
9
⚫ Stable market share in the field of investment funds (1.5%). The
noticeable lower interest of customers in money market and bond funds
translates into a decrease in sales in Q2 2021.
⚫ At the end of June 2021, the assets of the bank's clients invested in open-end
mutual funds amounted to nearly PLN 2,2 billion (an increase of 62% y/y).
⚫ As a result of a slight correction on the bond market, the clients' interest in
debt funds in the entire market decreased.
1,93
2,86 2,92
Jun'20 Mar'21 Jun'21
45,0 42,1 43,8 44,5 44,1
Jun'20 Sep'20 Dec'20 Mar'21 Jun'21
-0,8%
-1,9%
66,3%
1,3% 1,6% 1,5%
1,9%
0,28
0,42
0,24
Q1'20 Q1'21 Q2'21
-16,3%-44,5%
August 21, 2021Presentation for Investors and Analysts
Sum
mary
Bu
sin
ess o
verv
iew
Fin
ancia
l results
Appendix
Cre
dit ris
k
Deposits (PLN bn)
Sale of investment funds (PLN bn)
Open-end inv. funds – clients’ assets (PLN bn)(purchased through the Bank)
Bank’s
market share
(assets)
24 22 20 1914
Q2'20 Q3'20 Q4'20 Q1'21 Q2'21
Jun'18 Sep'18 Dec'18 Mar'19 Jun'19 Sep'19 Dec'19 Mar'20 Jun'20 Sep'20 Dec'20 Mar'21 Jun'21
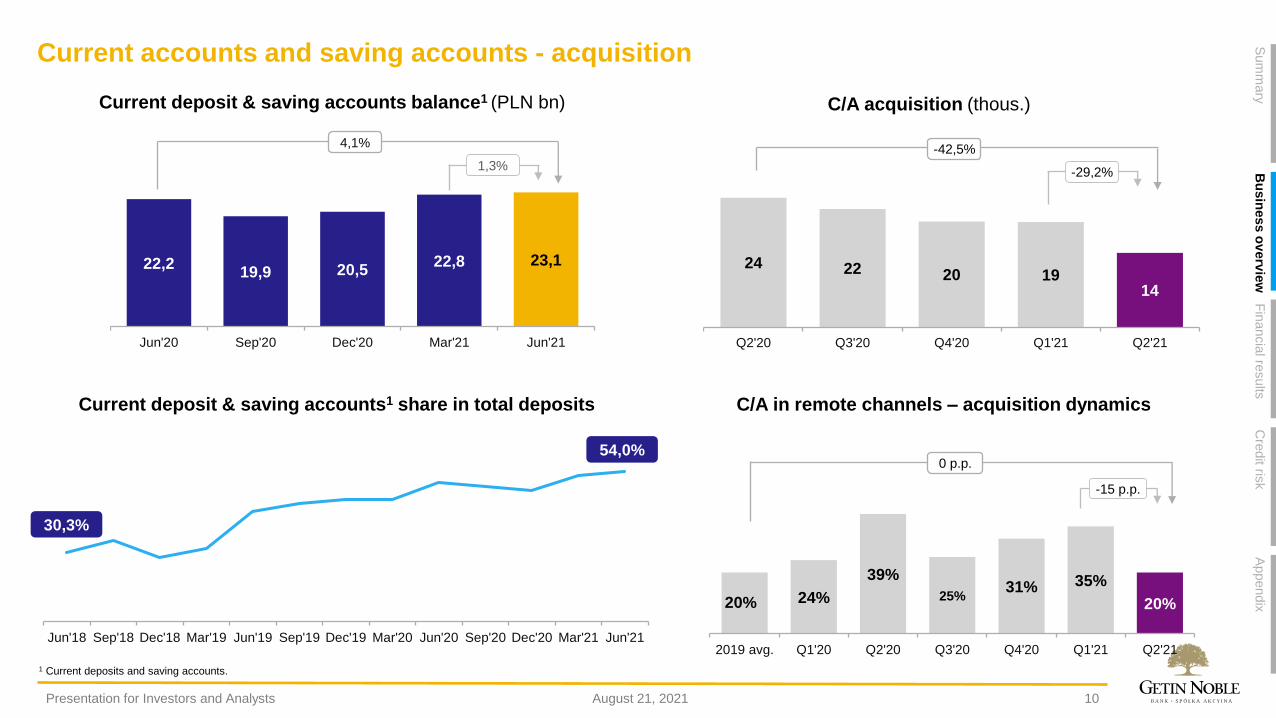
Current accounts and saving accounts - acquisition
10
22,219,9 20,5
22,8 23,1
Jun'20 Sep'20 Dec'20 Mar'21 Jun'21
1,3%
4,1%
20% 24%
39%
25%31% 35%
20%
2019 avg. Q1'20 Q2'20 Q3'20 Q4'20 Q1'21 Q2'21
-15 p.p.
0 p.p.54,0%
30,3%
-29,2%
-42,5%
August 21, 2021Presentation for Investors and Analysts
Sum
mary
Bu
sin
ess o
verv
iew
Fin
ancia
l results
Appendix
Cre
dit ris
k
Current deposit & saving accounts1 share in total deposits
1 Current deposits and saving accounts.
Current deposit & saving accounts balance1 (PLN bn)
C/A in remote channels – acquisition dynamics
C/A acquisition (thous.)
13% 16%24%
33%40%
8%10%
10%
9%
10%
Q2'20 Q3'20 Q4'20 Q1'21 Q2'21
5% 7%11%
17%22%
5%8%
8%
7%
7%
Q2'20 Q3'20 Q4'20 Q1'21 Q2'21
11
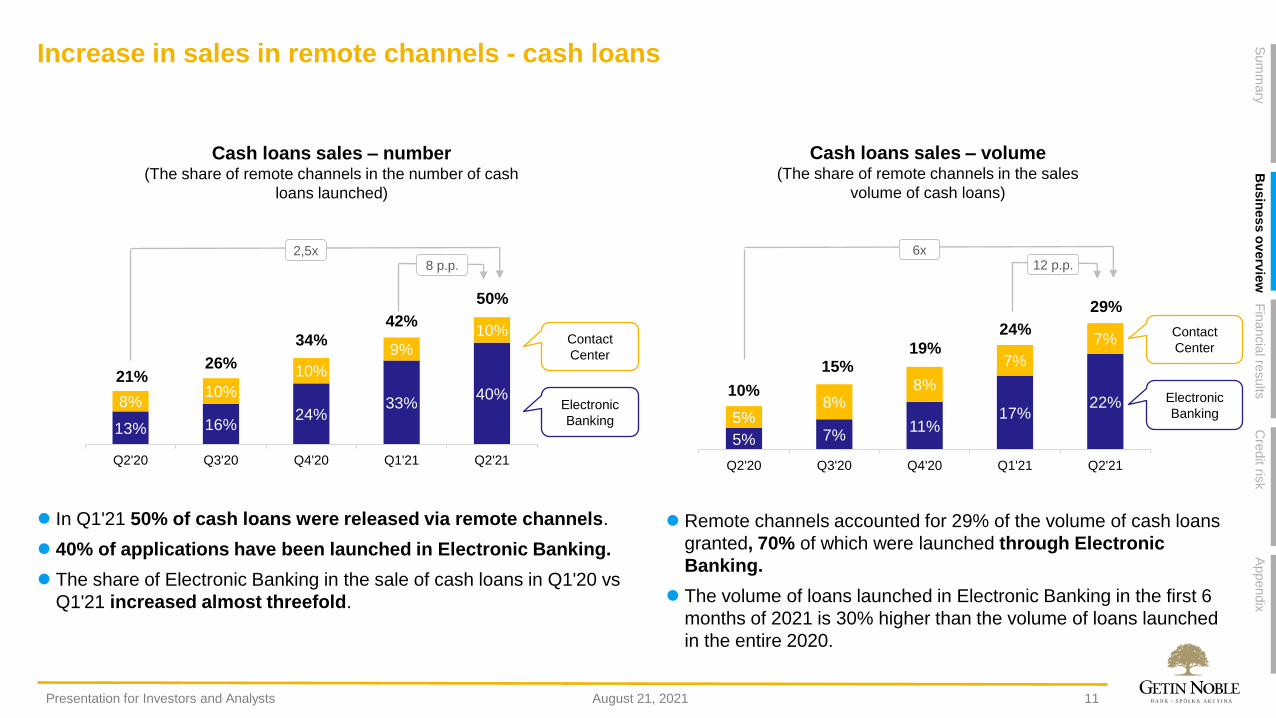
Increase in sales in remote channels - cash loans
Electronic
Banking
Contact
Center
Electronic
Banking
Contact
Center
10%
15%19%
29%
6x12 p.p.
24%
21%26%
34%
50%
42%
2,5x8 p.p.
⚫ In Q1'21 50% of cash loans were released via remote channels.
⚫ 40% of applications have been launched in Electronic Banking.
⚫ The share of Electronic Banking in the sale of cash loans in Q1'20 vs
Q1'21 increased almost threefold.
⚫ Remote channels accounted for 29% of the volume of cash loans
granted, 70% of which were launched through Electronic
Banking.
⚫ The volume of loans launched in Electronic Banking in the first 6
months of 2021 is 30% higher than the volume of loans launched
in the entire 2020.
August 21, 2021Presentation for Investors and Analysts
Sum
mary
Bu
sin
ess o
verv
iew
Fin
ancia
l results
Appendix
Cre
dit ris
k
Cash loans sales – volume(The share of remote channels in the sales
volume of cash loans)
Cash loans sales – number(The share of remote channels in the number of cash
loans launched)
21% 28%38%
30%
37%36%
2018 2019 2020 Q1'21 Q2'21
12
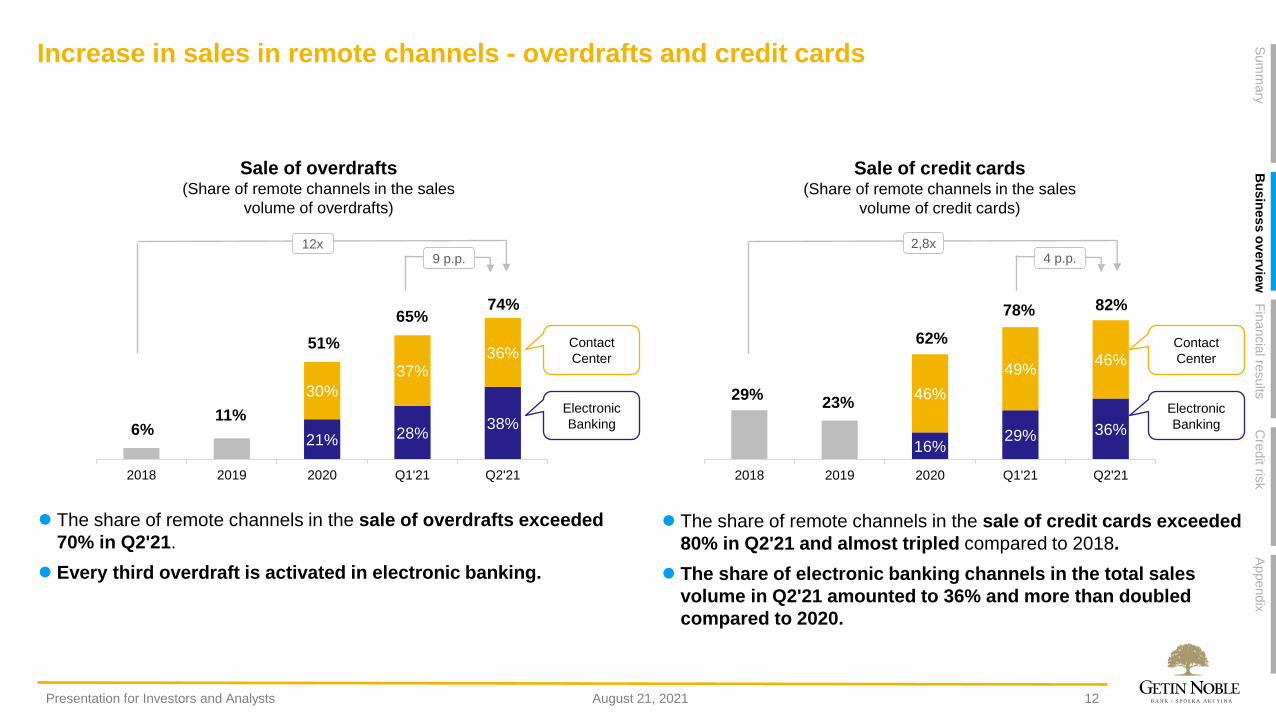
Increase in sales in remote channels - overdrafts and credit cards
16%29% 36%
46%
49%46%
2018 2019 2020 Q1'21 Q2'21
Electronic
Banking
Contact
Center
29%23%
62%
78%
Electronic
Banking
Contact
Center
6%11%
51%
65%
⚫ The share of remote channels in the sale of overdrafts exceeded
70% in Q2'21.
⚫ Every third overdraft is activated in electronic banking.
⚫ The share of remote channels in the sale of credit cards exceeded
80% in Q2'21 and almost tripled compared to 2018.
⚫ The share of electronic banking channels in the total sales
volume in Q2'21 amounted to 36% and more than doubled
compared to 2020.
74%
12x9 p.p.
82%
2,8x4 p.p.
August 21, 2021Presentation for Investors and Analysts
Sum
mary
Bu
sin
ess o
verv
iew
Fin
ancia
l results
Appendix
Cre
dit ris
k
Sale of overdrafts(Share of remote channels in the sales
volume of overdrafts)
Sale of credit cards(Share of remote channels in the sales
volume of credit cards)
13
Q2'20 Q1'21 Q2'21
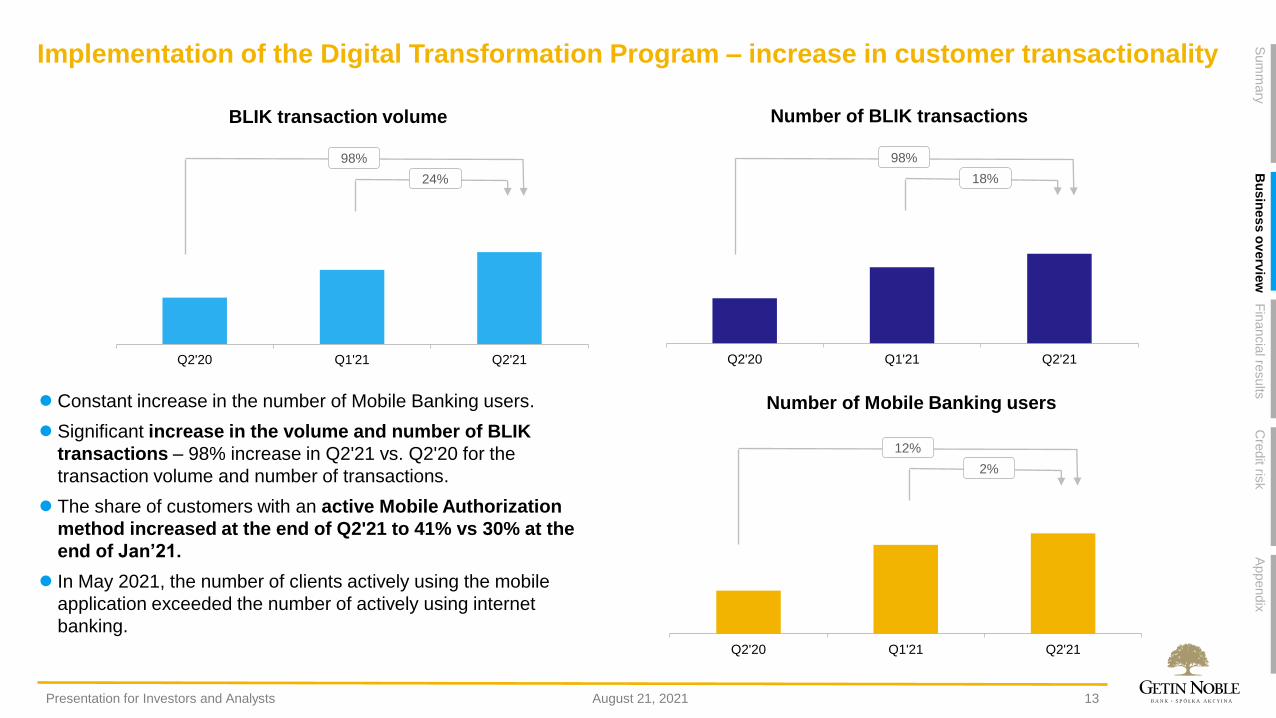
Implementation of the Digital Transformation Program – increase in customer transactionality
⚫ Constant increase in the number of Mobile Banking users.
⚫ Significant increase in the volume and number of BLIK
transactions – 98% increase in Q2'21 vs. Q2'20 for the
transaction volume and number of transactions.
⚫ The share of customers with an active Mobile Authorization
method increased at the end of Q2'21 to 41% vs 30% at the
end of Jan’21.
⚫ In May 2021, the number of clients actively using the mobile
application exceeded the number of actively using internet
banking.
24%
98%
Q2'20 Q1'21 Q2'21
18%
98%
Q2'20 Q1'21 Q2'21
2%
12%
August 21, 2021Presentation for Investors and Analysts
Sum
mary
Bu
sin
ess o
verv
iew
Fin
ancia
l results
Appendix
Cre
dit ris
k
BLIK transaction volume Number of BLIK transactions
Number of Mobile Banking users
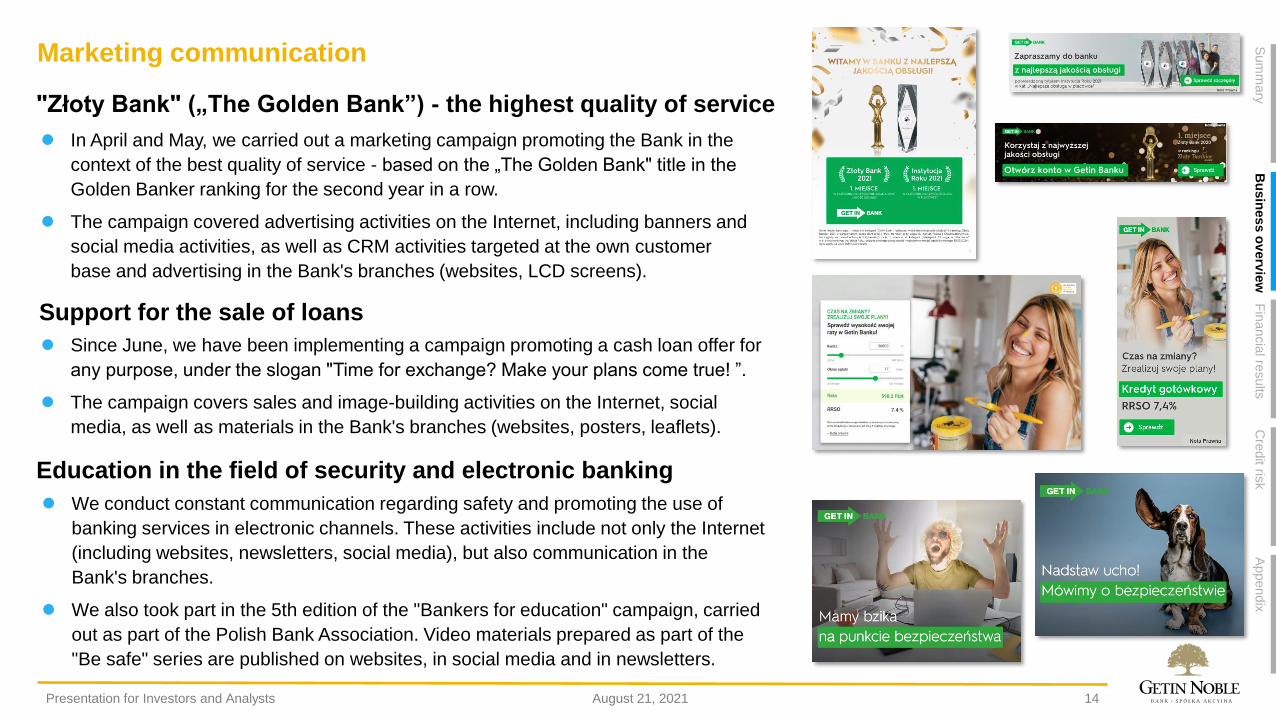
Marketing communication
⚫ In April and May, we carried out a marketing campaign promoting the Bank in the
context of the best quality of service - based on the „The Golden Bank" title in the
Golden Banker ranking for the second year in a row.
⚫ The campaign covered advertising activities on the Internet, including banners and
social media activities, as well as CRM activities targeted at the own customer
base and advertising in the Bank's branches (websites, LCD screens).
14
Education in the field of security and electronic banking
⚫ We conduct constant communication regarding safety and promoting the use of
banking services in electronic channels. These activities include not only the Internet
(including websites, newsletters, social media), but also communication in the
Bank's branches.
⚫ We also took part in the 5th edition of the "Bankers for education" campaign, carried
out as part of the Polish Bank Association. Video materials prepared as part of the
"Be safe" series are published on websites, in social media and in newsletters.
Support for the sale of loans
⚫ Since June, we have been implementing a campaign promoting a cash loan offer for
any purpose, under the slogan "Time for exchange? Make your plans come true! ”.
⚫ The campaign covers sales and image-building activities on the Internet, social
media, as well as materials in the Bank's branches (websites, posters, leaflets).
"Złoty Bank" („The Golden Bank”) - the highest quality of service
August 21, 2021Presentation for Investors and Analysts
Sum
mary
Bu
sin
ess o
verv
iew
Fin
ancia
l results
Appendix
Cre
dit ris
k

Agenda
01 Summary
02 Business overview
03 Financial results
04 Credit risk
05 Appendix
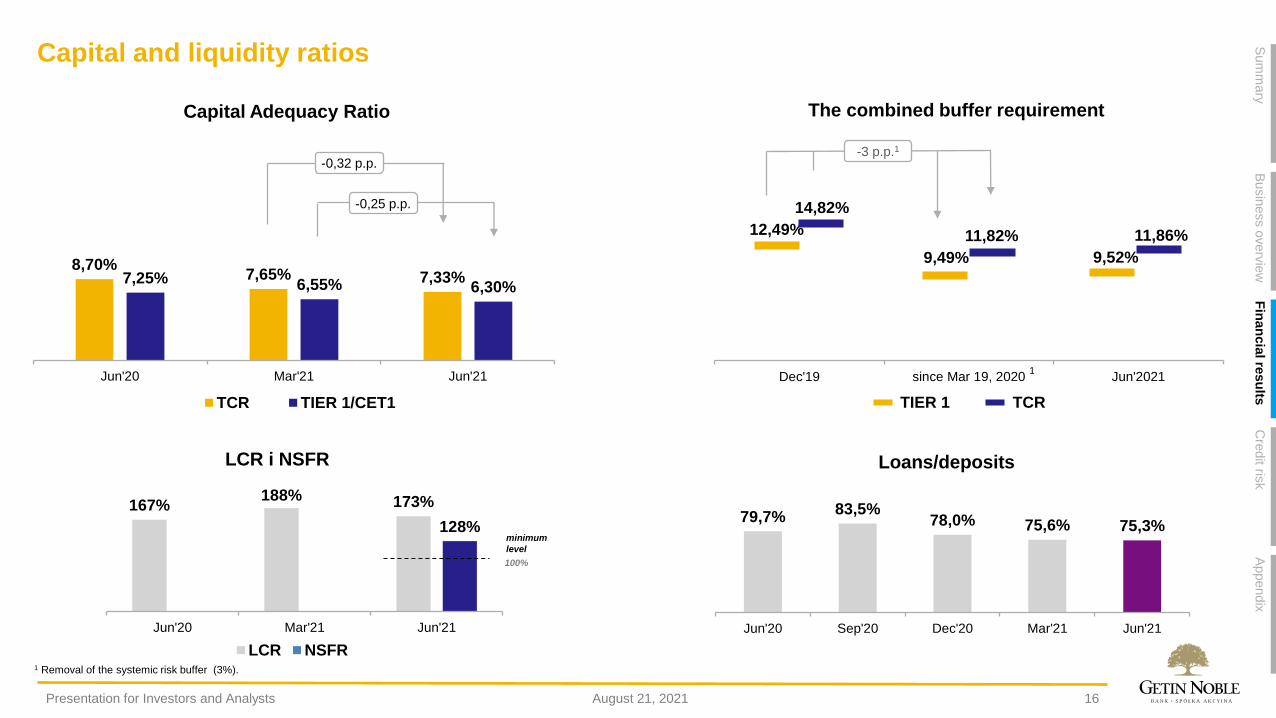
Capital and liquidity ratios
16
8,70%7,65% 7,33%7,25% 6,55% 6,30%
Jun'20 Mar'21 Jun'21
TCR TIER 1/CET1
79,7%83,5%
78,0% 75,6% 75,3%
Jun'20 Sep'20 Dec'20 Mar'21 Jun'21
-0,32 p.p.
-0,25 p.p.
12,49%
9,49% 9,52%
14,82%
11,82% 11,86%
Dec'19 since Mar 19, 2020 Jun'2021
TIER 1 TCR
-3 p.p.1
1
August 21, 2021Presentation for Investors and Analysts
Sum
mary
Busin
ess o
verv
iew
Fin
an
cia
l resu
ltsA
ppendix
Cre
dit ris
k
Capital Adequacy Ratio
Loans/deposits
The combined buffer requirement
1 Removal of the systemic risk buffer (3%).
minimum
level
167%188% 173%
128%
Jun'20 Mar'21 Jun'21
LCR NSFR
LCR i NSFR
100%
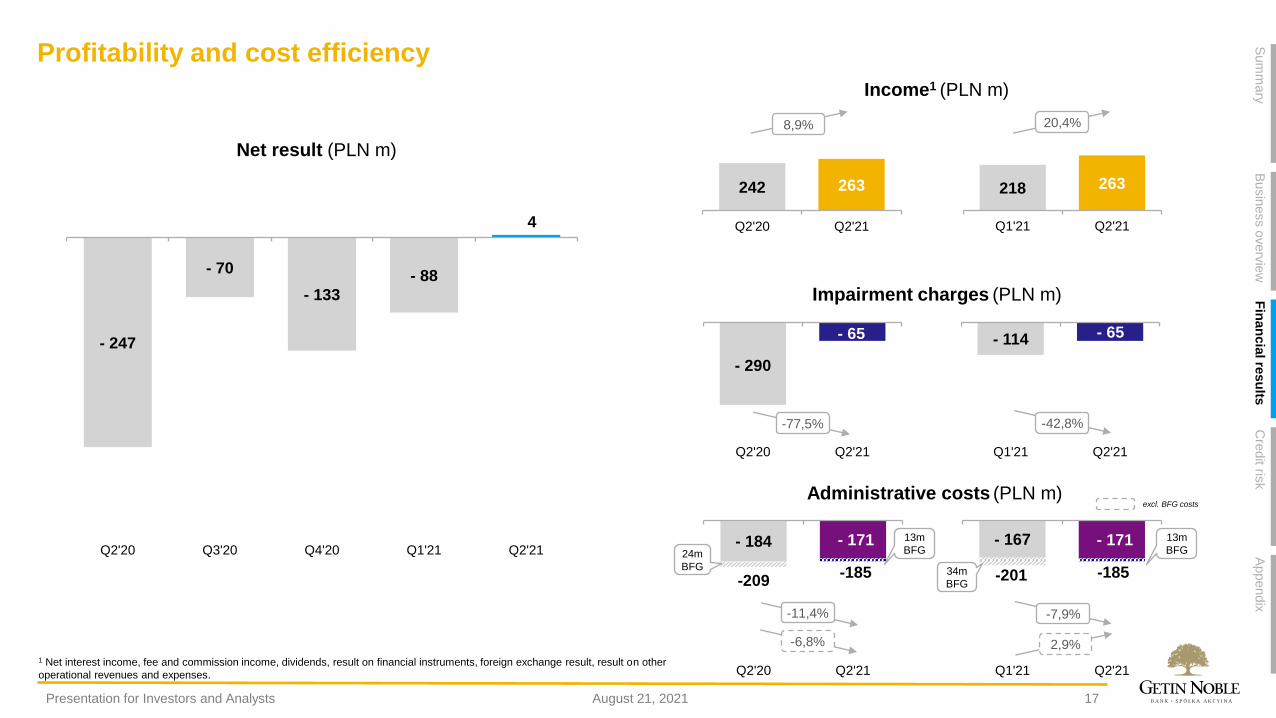
Profitability and cost efficiency
17
- 167 - 171
-201 -185
Q1'21 Q2'21
- 290
- 65
Q2'20 Q2'21
- 247
- 70
- 133
- 88
4
Q2'20 Q3'20 Q4'20 Q1'21 Q2'21- 184 - 171
-209-185
Q2'20 Q2'21
- 114 - 65
Q1'21 Q2'21
242 263
Q2'20 Q2'21
8,9% 20,4%
-42,8%
-7,9%
-77,5%
24m
BFG 34m
BFG
13m
BFG
2,9%
218 263
Q1'21 Q2'21
-11,4%
-6,8%
13m
BFG
August 21, 2021Presentation for Investors and Analysts
Sum
mary
Busin
ess o
verv
iew
Fin
an
cia
l resu
ltsA
ppendix
Cre
dit ris
k
Income1 (PLN m)
Administrative costs (PLN m)
Impairment charges (PLN m)
1 Net interest income, fee and commission income, dividends, result on financial instruments, foreign exchange result, result on other
operational revenues and expenses.
excl. BFG costs
Net result (PLN m)
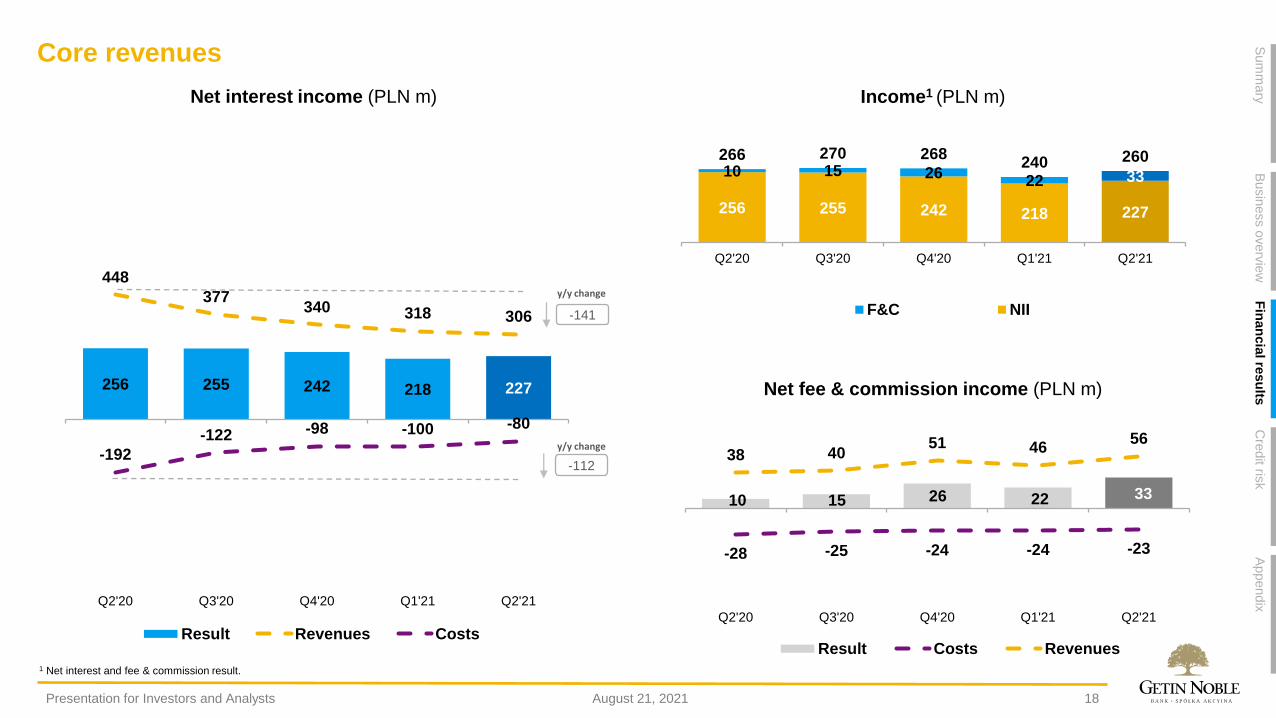
Core revenues
18
256 255 242 218 227
448
377340 318 306
-192
-122 -98 -100 -80
Q2'20 Q3'20 Q4'20 Q1'21 Q2'21
Result Revenues Costs
256 255 242 218 227
10 15 2622 33
266 270 268240 260
Q2'20 Q3'20 Q4'20 Q1'21 Q2'21
F&C NII
10 15 26 22 33
-28 -25 -24 -24 -23
38 4051 46
56
Q2'20 Q3'20 Q4'20 Q1'21 Q2'21
Result Costs Revenues
-141
y/y change
-112
y/y change
August 21, 2021Presentation for Investors and Analysts
Sum
mary
Busin
ess o
verv
iew
Fin
an
cia
l resu
ltsA
ppendix
Cre
dit ris
k
Net interest income (PLN m)
Net fee & commission income (PLN m)
Income1 (PLN m)
1 Net interest and fee & commission result.
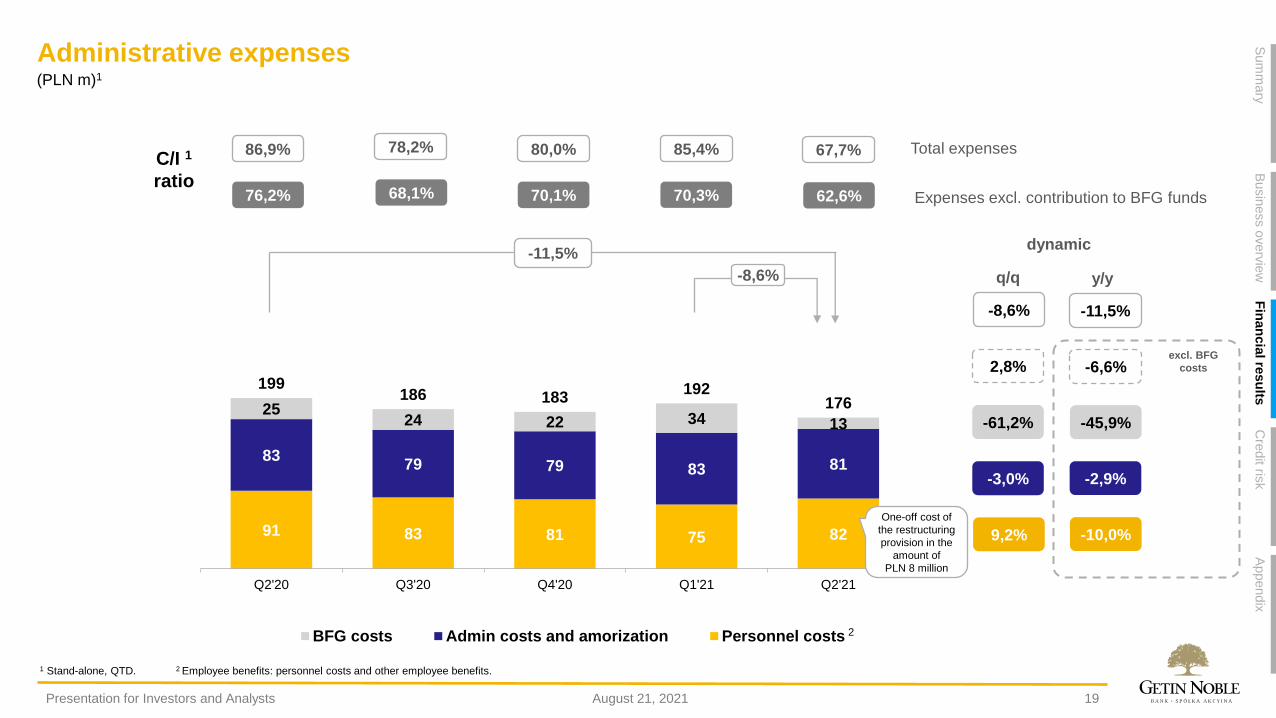
Administrative expenses
19
(PLN m)1
2,8% -6,6%
91 83 81 75 82
8379 79 83 81
2524 22 34 13
199186 183
192176
Q2'20 Q3'20 Q4'20 Q1'21 Q2'21
BFG costs Admin costs and amorization Personnel costs
-61,2%
-3,0%
9,2%
-8,6%
-11,5%
-45,9%
-2,9%
-10,0%
67,7%86,9% 78,2%
62,6%76,2% 68,1%
-8,6% -11,5%
80,0%
70,1%
2
85,4%
70,3%
One-off cost of
the restructuring
provision in the
amount of
PLN 8 million
August 21, 2021Presentation for Investors and Analysts
Sum
mary
Busin
ess o
verv
iew
Fin
an
cia
l resu
ltsA
ppendix
Cre
dit ris
k
C/I 1
ratio
dynamic
q/q y/y
Total expenses
Expenses excl. contribution to BFG funds
excl. BFG
costs
1 Stand-alone, QTD. 2 Employee benefits: personnel costs and other employee benefits.
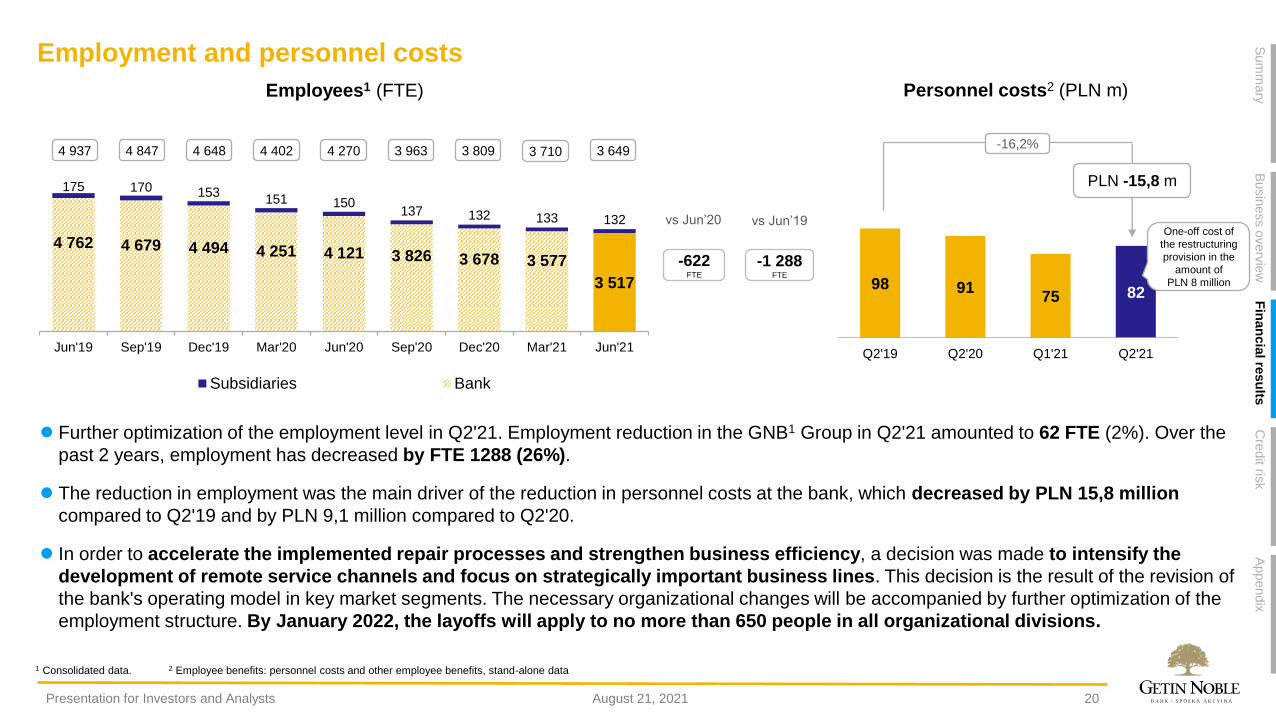
Employment and personnel costs
20
⚫ Further optimization of the employment level in Q2'21. Employment reduction in the GNB1 Group in Q2'21 amounted to 62 FTE (2%). Over the
past 2 years, employment has decreased by FTE 1288 (26%).
⚫ The reduction in employment was the main driver of the reduction in personnel costs at the bank, which decreased by PLN 15,8 million
compared to Q2'19 and by PLN 9,1 million compared to Q2'20.
⚫ In order to accelerate the implemented repair processes and strengthen business efficiency, a decision was made to intensify the
development of remote service channels and focus on strategically important business lines. This decision is the result of the revision of
the bank's operating model in key market segments. The necessary organizational changes will be accompanied by further optimization of the
employment structure. By January 2022, the layoffs will apply to no more than 650 people in all organizational divisions.
4 762 4 679 4 494 4 251 4 121 3 826 3 678 3 577
3 517
175 170 153151 150
137 132 133 132
Jun'19 Sep'19 Dec'19 Mar'20 Jun'20 Sep'20 Dec'20 Mar'21 Jun'21
Subsidiaries Bank
4 937 4 847 4 648 4 402 4 270 3 809
98 9175 82
Q2'19 Q2'20 Q1'21 Q2'21
-16,2%
PLN -15,8 m
-622 FTE
vs Jun’20 vs Jun’19
-1 288 FTE
3 963 3 710 3 649
One-off cost of
the restructuring
provision in the
amount of
PLN 8 million
August 21, 2021Presentation for Investors and Analysts
Sum
mary
Busin
ess o
verv
iew
Fin
an
cia
l resu
ltsA
ppendix
Cre
dit ris
k
Employees1 (FTE) Personnel costs2 (PLN m)
1 Consolidated data. 2 Employee benefits: personnel costs and other employee benefits, stand-alone data
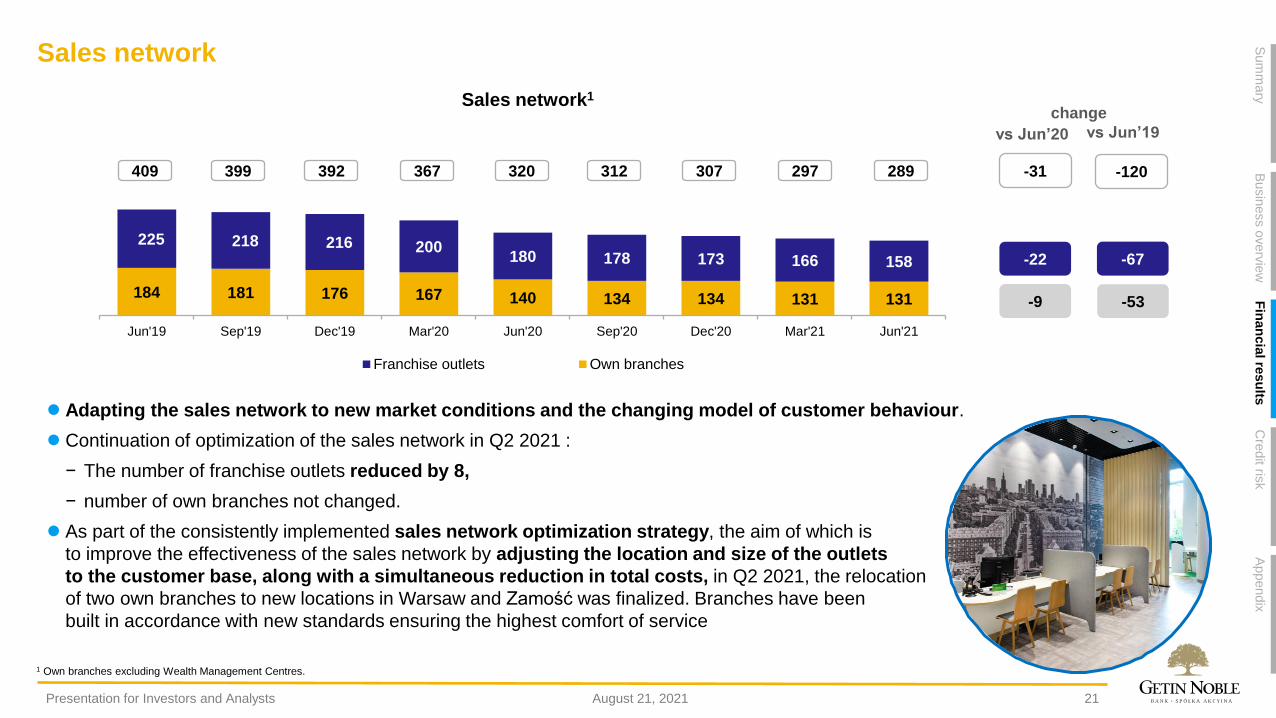
184 181 176 167 140 134 134 131 131
225 218 216 200180 178 173 166 158
Jun'19 Sep'19 Dec'19 Mar'20 Jun'20 Sep'20 Dec'20 Mar'21 Jun'21
Franchise outlets Own branches
Sales network
21
⚫ Adapting the sales network to new market conditions and the changing model of customer behaviour.
⚫ Continuation of optimization of the sales network in Q2 2021 :
− The number of franchise outlets reduced by 8,
− number of own branches not changed.
⚫ As part of the consistently implemented sales network optimization strategy, the aim of which is
to improve the effectiveness of the sales network by adjusting the location and size of the outlets
to the customer base, along with a simultaneous reduction in total costs, in Q2 2021, the relocation
of two own branches to new locations in Warsaw and Zamość was finalized. Branches have been
built in accordance with new standards ensuring the highest comfort of service
289409 399 392 367 320 312 307
-9
-22
-53
-67
-31 -120297
August 21, 2021Presentation for Investors and Analysts
Sum
mary
Busin
ess o
verv
iew
Fin
an
cia
l resu
ltsA
ppendix
Cre
dit ris
k
Sales network1
change
vs Jun’20 vs Jun’19
1 Own branches excluding Wealth Management Centres.
Jun'19 Sep'19 Dec'19 Mar'20 Jun'20 Sep'20 Dec'20 May'21
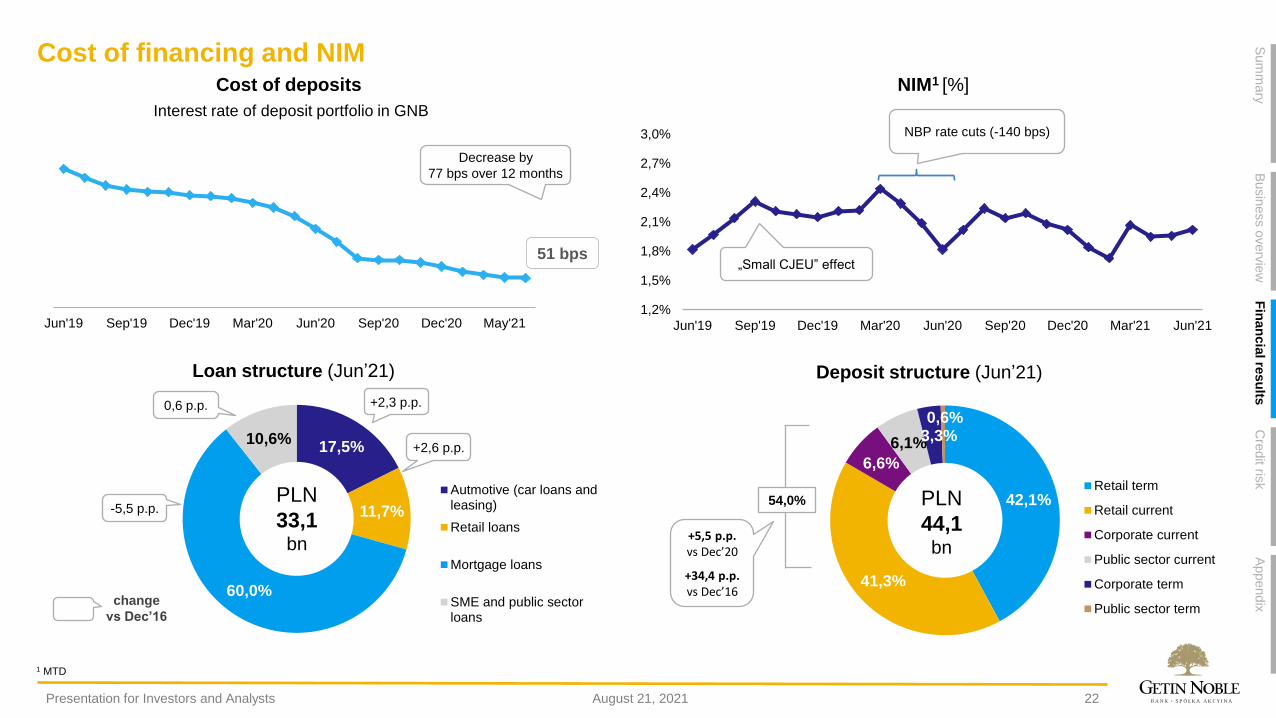
Cost of financing and NIM
22
1,2%
1,5%
1,8%
2,1%
2,4%
2,7%
3,0%
Jun'19 Sep'19 Dec'19 Mar'20 Jun'20 Sep'20 Dec'20 Mar'21 Jun'21
1 MTD
NBP rate cuts (-140 bps)
51 bps
Decrease by
77 bps over 12 months
„Small CJEU” effect
42,1%
41,3%
6,6%
6,1%3,3%0,6%
Retail term
Retail current
Corporate current
Public sector current
Corporate term
Public sector term
PLN
44,1bn
54,0%
+5,5 p.p.vs Dec’20
+34,4 p.p.vs Dec’16
17,5%
11,7%
60,0%
10,6%
Autmotive (car loans andleasing)
Retail loans
Mortgage loans
SME and public sectorloans
PLN
33,1 bn
0,6 p.p.
-5,5 p.p.
+2,3 p.p.
+2,6 p.p.
August 21, 2021Presentation for Investors and Analysts
Sum
mary
Busin
ess o
verv
iew
Fin
an
cia
l resu
ltsA
ppendix
Cre
dit ris
k
Interest rate of deposit portfolio in GNB
NIM1 [%]Cost of deposits
Deposit structure (Jun’21)Loan structure (Jun’21)
change
vs Dec’16
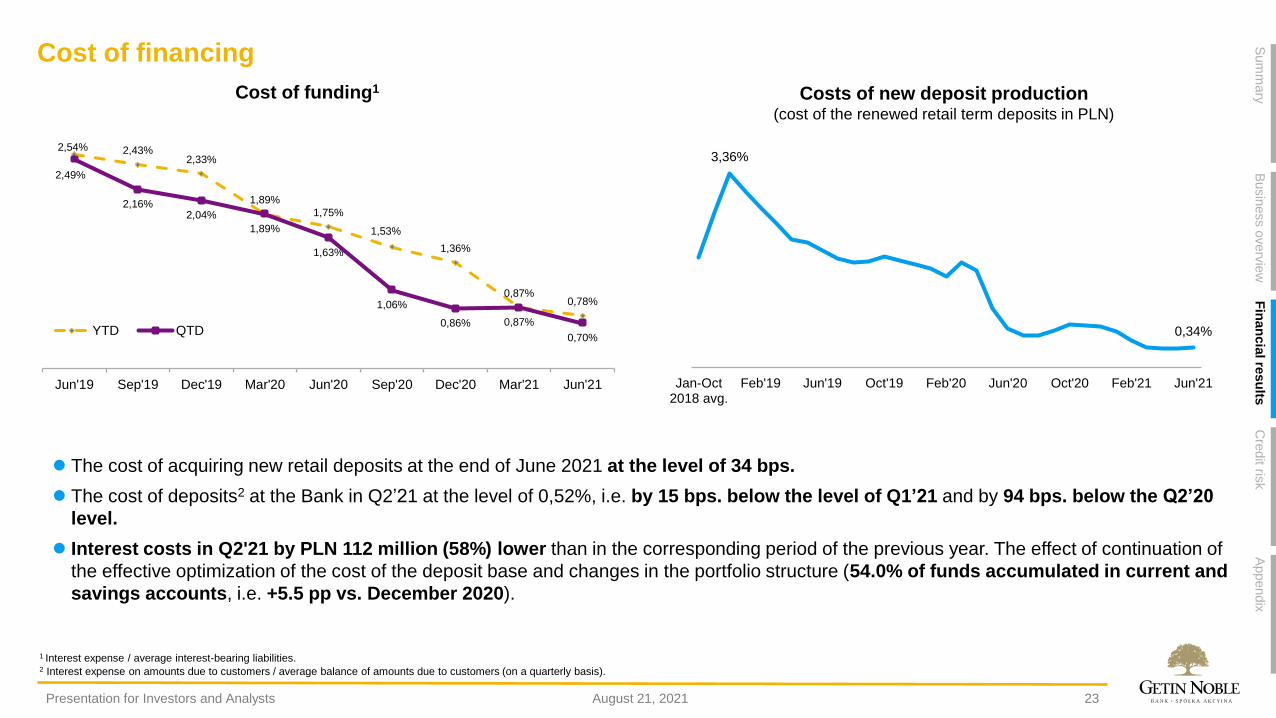
2,54% 2,43%2,33%
1,89%
1,75%
1,53%
1,36%
0,87%0,78%
2,49%
2,16%2,04%
1,89%
1,63%
1,06%
0,86% 0,87%
0,70%
Jun'19 Sep'19 Dec'19 Mar'20 Jun'20 Sep'20 Dec'20 Mar'21 Jun'21
YTD QTD
Cost of financing
23
3,36%
0,34%
Jan-Oct2018 avg.
Feb'19 Jun'19 Oct'19 Feb'20 Jun'20 Oct'20 Feb'21 Jun'21
⚫ The cost of acquiring new retail deposits at the end of June 2021 at the level of 34 bps.
⚫ The cost of deposits2 at the Bank in Q2’21 at the level of 0,52%, i.e. by 15 bps. below the level of Q1’21 and by 94 bps. below the Q2’20
level.
⚫ Interest costs in Q2'21 by PLN 112 million (58%) lower than in the corresponding period of the previous year. The effect of continuation of
the effective optimization of the cost of the deposit base and changes in the portfolio structure (54.0% of funds accumulated in current and
savings accounts, i.e. +5.5 pp vs. December 2020).
August 21, 2021Presentation for Investors and Analysts
Sum
mary
Busin
ess o
verv
iew
Fin
an
cia
l resu
ltsA
ppendix
Cre
dit ris
k
Cost of funding1 Costs of new deposit production(cost of the renewed retail term deposits in PLN)
1 Interest expense / average interest-bearing liabilities.2 Interest expense on amounts due to customers / average balance of amounts due to customers (on a quarterly basis).

Agenda
01 Summary
02 Business overview
03 Financial results
04 Credit risk
05 Appendix
30.06.2021 31.03.2021 30.06.2020change
q/q
change
y/y
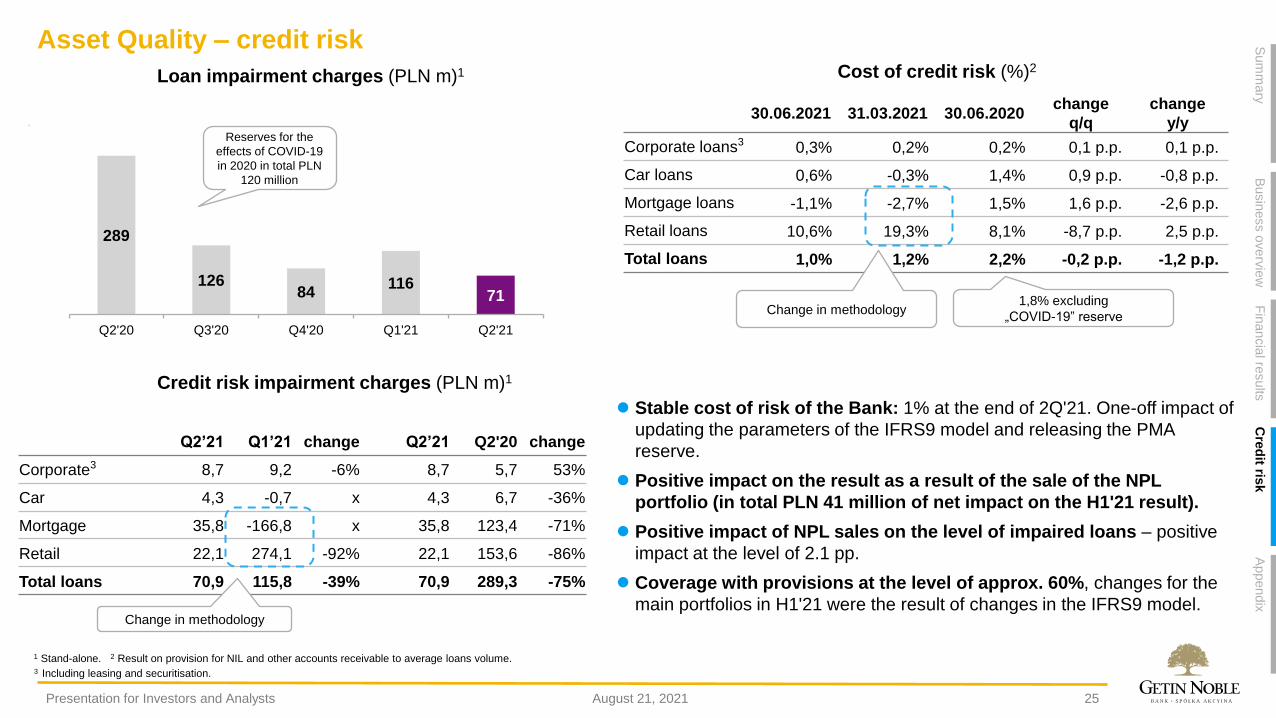
Corporate loans3 0,3% 0,2% 0,2% 0,1 p.p. 0,1 p.p.
Car loans 0,6% -0,3% 1,4% 0,9 p.p. -0,8 p.p.
Mortgage loans -1,1% -2,7% 1,5% 1,6 p.p. -2,6 p.p.
Retail loans 10,6% 19,3% 8,1% -8,7 p.p. 2,5 p.p.
Total loans 1,0% 1,2% 2,2% -0,2 p.p. -1,2 p.p.
Asset Quality – credit risk
25
Change in methodology
289
12684
11671
Q2'20 Q3'20 Q4'20 Q1'21 Q2'21
Reserves for the
effects of COVID-19
in 2020 in total PLN
120 million
⚫ Stable cost of risk of the Bank: 1% at the end of 2Q'21. One-off impact of
updating the parameters of the IFRS9 model and releasing the PMA
reserve.
⚫ Positive impact on the result as a result of the sale of the NPL
portfolio (in total PLN 41 million of net impact on the H1'21 result).
⚫ Positive impact of NPL sales on the level of impaired loans – positive
impact at the level of 2.1 pp.
⚫ Coverage with provisions at the level of approx. 60%, changes for the
main portfolios in H1'21 were the result of changes in the IFRS9 model.
Q2’21 Q1’21 change Q2’21 Q2'20 change
Corporate3 8,7 9,2 -6% 8,7 5,7 53%
Car 4,3 -0,7 x 4,3 6,7 -36%
Mortgage 35,8 -166,8 x 35,8 123,4 -71%
Retail 22,1 274,1 -92% 22,1 153,6 -86%
Total loans 70,9 115,8 -39% 70,9 289,3 -75%
Change in methodology
1,8% excluding
„COVID-19” reserve
August 21, 2021Presentation for Investors and Analysts
Sum
mary
Busin
ess o
verv
iew
Fin
ancia
l results
Appendix
Cre
dit ris
k
Credit risk impairment charges (PLN m)1
Cost of credit risk (%)2 Loan impairment charges (PLN m)1
1 Stand-alone. 2 Result on provision for NIL and other accounts receivable to average loans volume.3 Including leasing and securitisation.
26
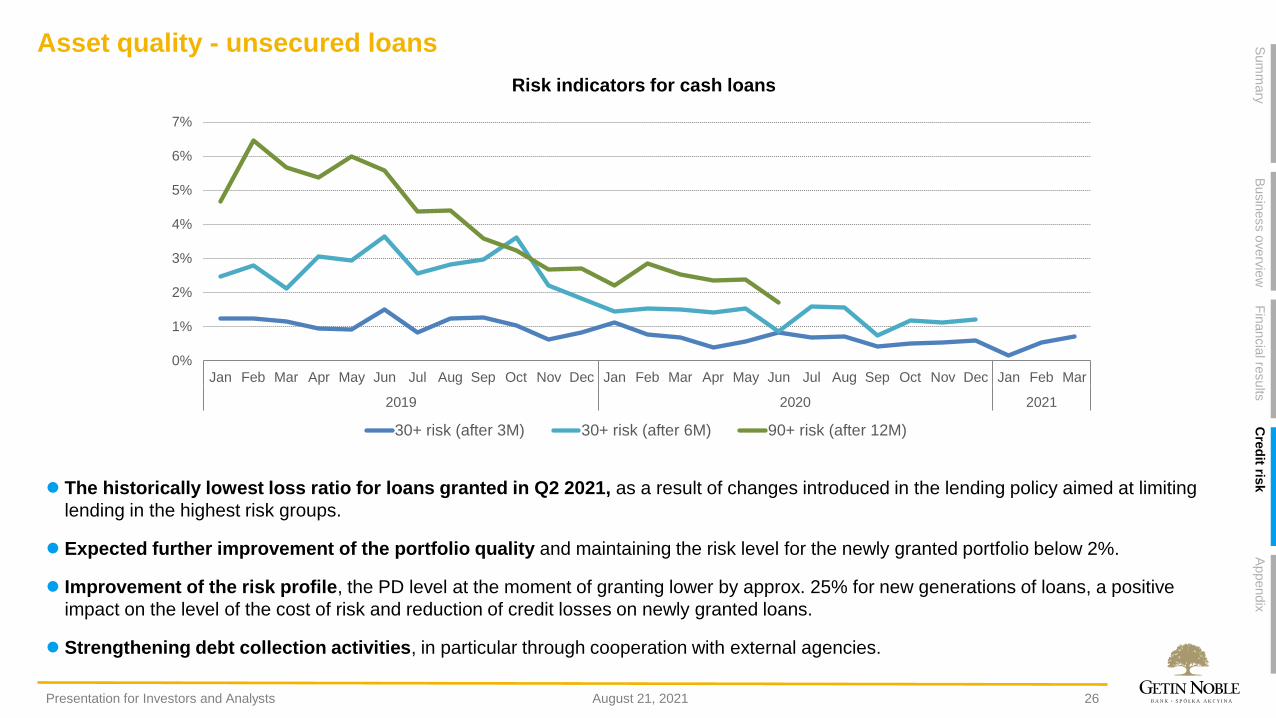
⚫ The historically lowest loss ratio for loans granted in Q2 2021, as a result of changes introduced in the lending policy aimed at limiting
lending in the highest risk groups.
⚫ Expected further improvement of the portfolio quality and maintaining the risk level for the newly granted portfolio below 2%.
⚫ Improvement of the risk profile, the PD level at the moment of granting lower by approx. 25% for new generations of loans, a positive
impact on the level of the cost of risk and reduction of credit losses on newly granted loans.
⚫ Strengthening debt collection activities, in particular through cooperation with external agencies.
Asset quality - unsecured loans
August 21, 2021Presentation for Investors and Analysts
Sum
mary
Busin
ess o
verv
iew
Fin
ancia
l results
Appendix
Cre
dit ris
k
Risk indicators for cash loans
0%
1%
2%
3%
4%
5%
6%
7%
Jan Feb Mar Apr May Jun Jul Aug Sep Oct Nov Dec Jan Feb Mar Apr May Jun Jul Aug Sep Oct Nov Dec Jan Feb Mar
2019 2020 2021
30+ risk (after 3M) 30+ risk (after 6M) 90+ risk (after 12M)
10%
20%
30%
40%
50%
60%
70%
80%
90%
Jun'17 Dec'17 Jun'18 Dec'18 Jun'19 Dec'19 Jun'20 Dec'20 Mar'21 Jun'21
retailloans
carloans
corporateloans
totalloans
mortgageloans
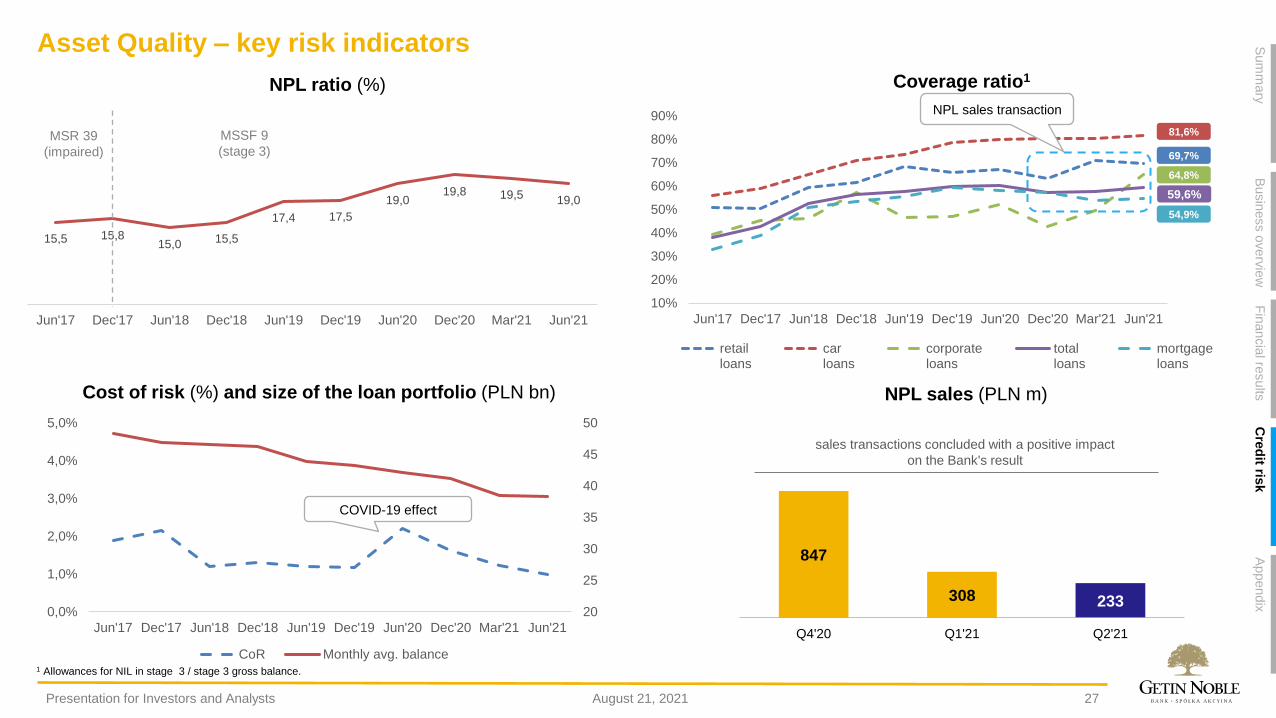
15,5 15,815,0 15,5
17,4 17,5
19,019,8 19,5 19,0
Jun'17 Dec'17 Jun'18 Dec'18 Jun'19 Dec'19 Jun'20 Dec'20 Mar'21 Jun'21
Asset Quality – key risk indicators
27
COVID-19 effect
81,6%
69,7%
54,9%
59,6%
64,8%
NPL sales (PLN m)
847
308 233
Q4'20 Q1'21 Q2'21
sales transactions concluded with a positive impact
on the Bank's result
NPL sales transaction
August 21, 2021Presentation for Investors and Analysts
Sum
mary
Busin
ess o
verv
iew
Fin
ancia
l results
Appendix
Cre
dit ris
k
Cost of risk (%) and size of the loan portfolio (PLN bn)
NPL ratio (%) Coverage ratio1
MSR 39
(impaired)
MSSF 9
(stage 3)
1 Allowances for NIL in stage 3 / stage 3 gross balance.
20
25
30
35
40
45
50
0,0%
1,0%
2,0%
3,0%
4,0%
5,0%
Jun'17 Dec'17 Jun'18 Dec'18 Jun'19 Dec'19 Jun'20 Dec'20 Mar'21 Jun'21
CoR Monthly avg. balance
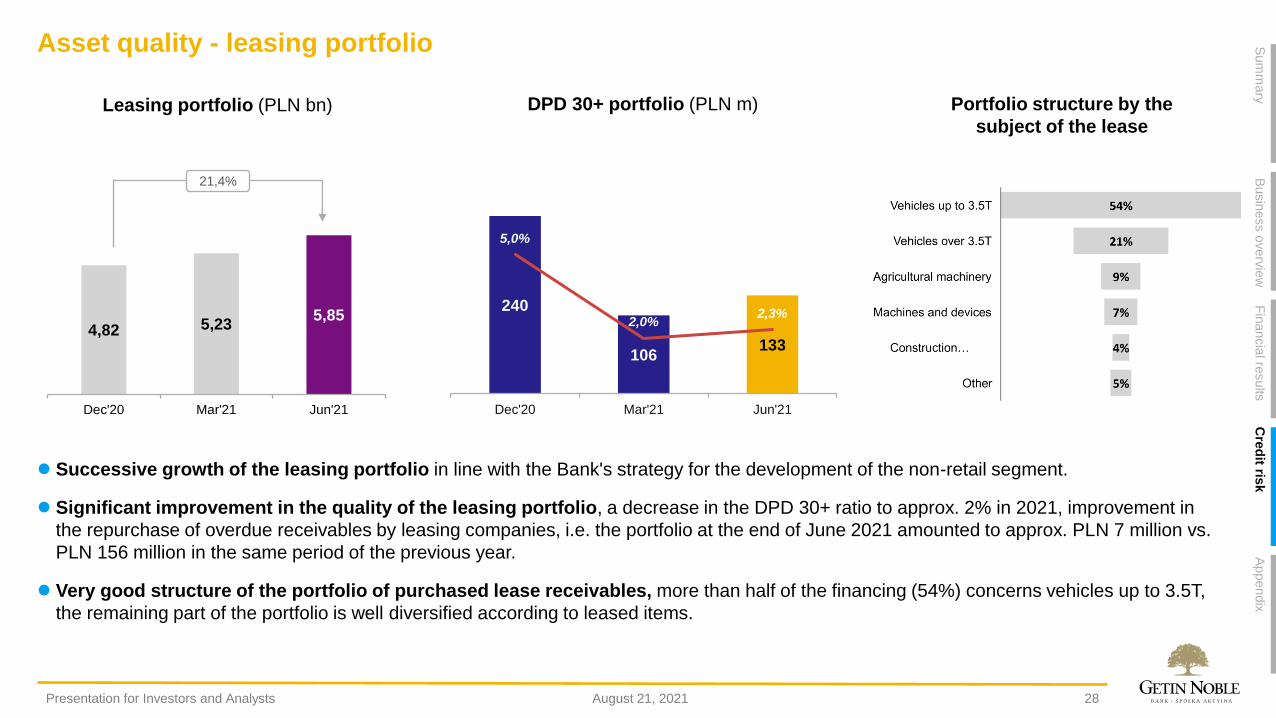
⚫ Successive growth of the leasing portfolio in line with the Bank's strategy for the development of the non-retail segment.
⚫ Significant improvement in the quality of the leasing portfolio, a decrease in the DPD 30+ ratio to approx. 2% in 2021, improvement in
the repurchase of overdue receivables by leasing companies, i.e. the portfolio at the end of June 2021 amounted to approx. PLN 7 million vs.
PLN 156 million in the same period of the previous year.
⚫ Very good structure of the portfolio of purchased lease receivables, more than half of the financing (54%) concerns vehicles up to 3.5T,
the remaining part of the portfolio is well diversified according to leased items.
Asset quality - leasing portfolio
Portfolio structure by the
subject of the lease
4,82 5,235,85
Dec'20 Mar'21 Jun'21
21,4%
240
106133
5,0%
2,0%2,3%
0%
1%
2%
3%
4%
5%
6%
7%
8%
0,0
50,0
100,0
150,0
200,0
250,0
300,0
Dec'20 Mar'21 Jun'21
DPD 30+ portfolio (PLN m)Leasing portfolio (PLN bn)
28August 21, 2021Presentation for Investors and Analysts
Sum
mary
Busin
ess o
verv
iew
Fin
ancia
l results
Appendix
Cre
dit ris
k
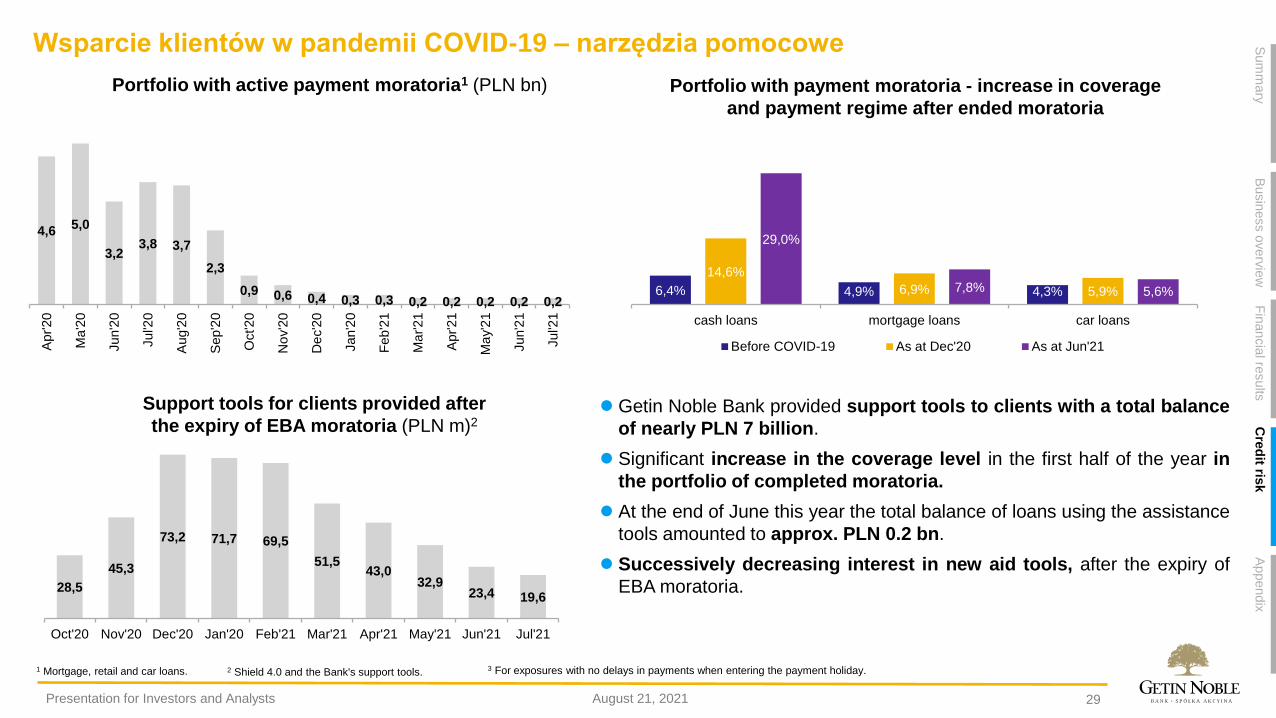
⚫ Getin Noble Bank provided support tools to clients with a total balance
of nearly PLN 7 billion.
⚫ Significant increase in the coverage level in the first half of the year in
the portfolio of completed moratoria.
⚫ At the end of June this year the total balance of loans using the assistance
tools amounted to approx. PLN 0.2 bn.
⚫ Successively decreasing interest in new aid tools, after the expiry of
EBA moratoria.
Wsparcie klientów w pandemii COVID-19 – narzędzia pomocowe
29August 21, 2021Presentation for Investors and Analysts
Sum
mary
Busin
ess o
verv
iew
Fin
ancia
l results
Appendix
Cre
dit ris
k
1 Mortgage, retail and car loans. 2 Shield 4.0 and the Bank's support tools. 3 For exposures with no delays in payments when entering the payment holiday.
Support tools for clients provided after
the expiry of EBA moratoria (PLN m)2
Portfolio with payment moratoria - increase in coverage
and payment regime after ended moratoria
Portfolio with active payment moratoria1 (PLN bn)
6,4% 4,9% 4,3%
14,6%
6,9% 5,9%
29,0%
7,8% 5,6%
cash loans mortgage loans car loans
Before COVID-19 As at Dec'20 As at Jun'21
28,5
45,3
73,2 71,7 69,5
51,543,0
32,923,4 19,6
Oct'20 Nov'20 Dec'20 Jan'20 Feb'21 Mar'21 Apr'21 May'21 Jun'21 Jul'21
4,65,0
3,23,8 3,7
2,3
0,9 0,6 0,4 0,3 0,3 0,2 0,2 0,2 0,2 0,2
Apr'20
Ma
'20
Jun'2
0
Jul'2
0
Aug'2
0
Sep'2
0
Oct'20
No
v'2
0
De
c'2
0
Jan'2
0
Feb
'21
Ma
r'2
1
Apr'21
Ma
y'2
1
Jun'2
1
Jul'2
1
Legal risk of foreign currency loans
30
5,20
2,14
'08 '09 '10 '11 '12 '13 '14 '15 '16 '17 '18 '19 '20 Jun'21
-59%
158
323
280
75
2019 2020 Jun'21
355
56 91446
7401 071
2 631
1 982
until 2015 2016 2017 2018 2019 2020 6M'21
6 846
2 114
August 21, 2021Presentation for Investors and Analysts
Sum
mary
Busin
ess o
verv
iew
Fin
ancia
l results
Appendix
Cre
dit ris
k
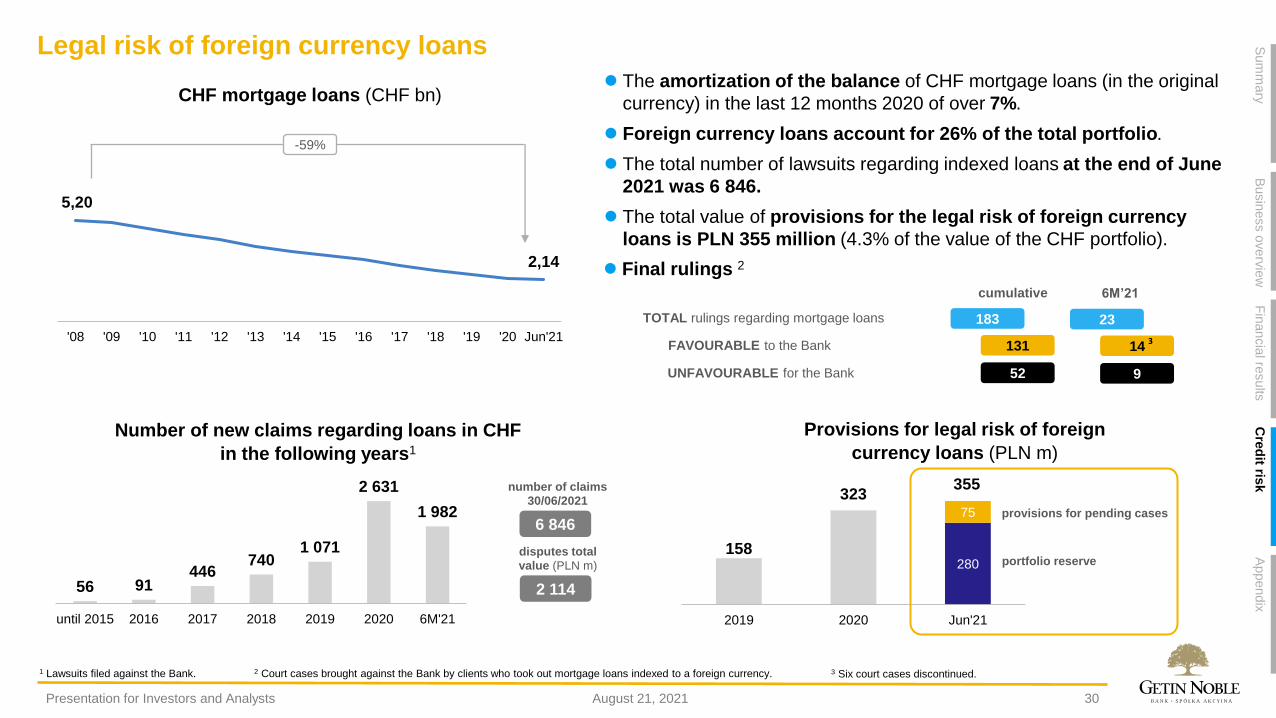
⚫ The amortization of the balance of CHF mortgage loans (in the original
currency) in the last 12 months 2020 of over 7%.
⚫ Foreign currency loans account for 26% of the total portfolio.
⚫ The total number of lawsuits regarding indexed loans at the end of June
2021 was 6 846.
⚫ The total value of provisions for the legal risk of foreign currency
loans is PLN 355 million (4.3% of the value of the CHF portfolio).
183
131
TOTAL rulings regarding mortgage loans
FAVOURABLE to the Bank
52UNFAVOURABLE for the Bank
⚫ Final rulings 2
23
14
9
cumulative
3
6M’21
CHF mortgage loans (CHF bn)
Number of new claims regarding loans in CHF
in the following years1
Provisions for legal risk of foreign
currency loans (PLN m)
provisions for pending cases
portfolio reserve
number of claims
30/06/2021
disputes total
value (PLN m)
3 Six court cases discontinued.1 Lawsuits filed against the Bank. 2 Court cases brought against the Bank by clients who took out mortgage loans indexed to a foreign currency.

Agenda
01 Summary
02 Business overview
03 Financial results
04 Credit risk
05 Appendix
Key financial information
32
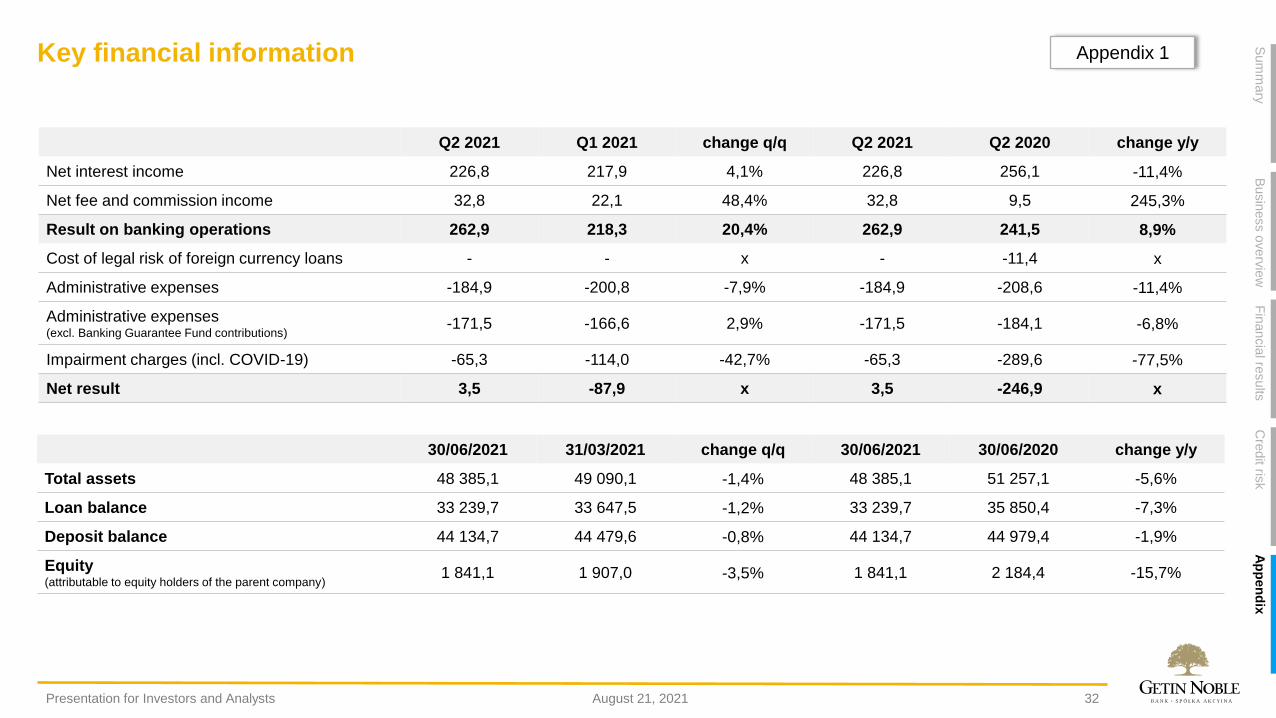
Q2 2021 Q1 2021 change q/q Q2 2021 Q2 2020 change y/y
Net interest income 226,8 217,9 4,1% 226,8 256,1 -11,4%
Net fee and commission income 32,8 22,1 48,4% 32,8 9,5 245,3%
Result on banking operations 262,9 218,3 20,4% 262,9 241,5 8,9%
Cost of legal risk of foreign currency loans - - x - -11,4 x
Administrative expenses -184,9 -200,8 -7,9% -184,9 -208,6 -11,4%
Administrative expenses(excl. Banking Guarantee Fund contributions)
-171,5 -166,6 2,9% -171,5 -184,1 -6,8%
Impairment charges (incl. COVID-19) -65,3 -114,0 -42,7% -65,3 -289,6 -77,5%
Net result 3,5 -87,9 x 3,5 -246,9 x
30/06/2021 31/03/2021 change q/q 30/06/2021 30/06/2020 change y/y
Total assets 48 385,1 49 090,1 -1,4% 48 385,1 51 257,1 -5,6%
Loan balance 33 239,7 33 647,5 -1,2% 33 239,7 35 850,4 -7,3%
Deposit balance 44 134,7 44 479,6 -0,8% 44 134,7 44 979,4 -1,9%
Equity(attributable to equity holders of the parent company)
1 841,1 1 907,0 -3,5% 1 841,1 2 184,4 -15,7%
Appendix 1
August 21, 2021Presentation for Investors and Analysts
Sum
mary
Busin
ess o
verv
iew
Fin
ancia
l results
Ap
pen
dix
Cre
dit ris
k
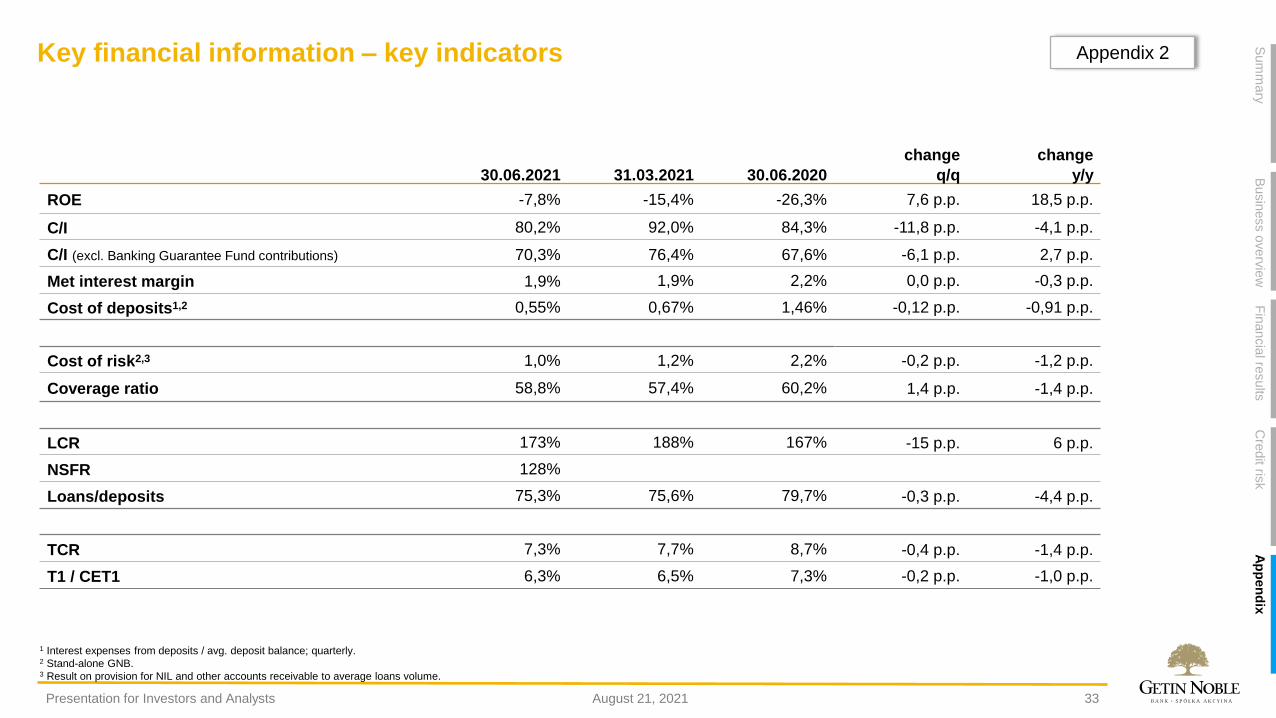
Key financial information – key indicators
33
Appendix 2
change change
30.06.2021 31.03.2021 30.06.2020 q/q y/y
ROE -7,8% -15,4% -26,3% 7,6 p.p. 18,5 p.p.
C/I 80,2% 92,0% 84,3% -11,8 p.p. -4,1 p.p.
C/I (excl. Banking Guarantee Fund contributions) 70,3% 76,4% 67,6% -6,1 p.p. 2,7 p.p.
Met interest margin 1,9% 1,9% 2,2% 0,0 p.p. -0,3 p.p.
Cost of deposits1,2 0,55% 0,67% 1,46% -0,12 p.p. -0,91 p.p.
Cost of risk2,3 1,0% 1,2% 2,2% -0,2 p.p. -1,2 p.p.
Coverage ratio 58,8% 57,4% 60,2% 1,4 p.p. -1,4 p.p.
LCR 173% 188% 167% -15 p.p. 6 p.p.
NSFR 128%
Loans/deposits 75,3% 75,6% 79,7% -0,3 p.p. -4,4 p.p.
TCR 7,3% 7,7% 8,7% -0,4 p.p. -1,4 p.p.
T1 / CET1 6,3% 6,5% 7,3% -0,2 p.p. -1,0 p.p.
1 Interest expenses from deposits / avg. deposit balance; quarterly.2 Stand-alone GNB.3 Result on provision for NIL and other accounts receivable to average loans volume.
August 21, 2021Presentation for Investors and Analysts
Sum
mary
Busin
ess o
verv
iew
Fin
ancia
l results
Ap
pen
dix
Cre
dit ris
k
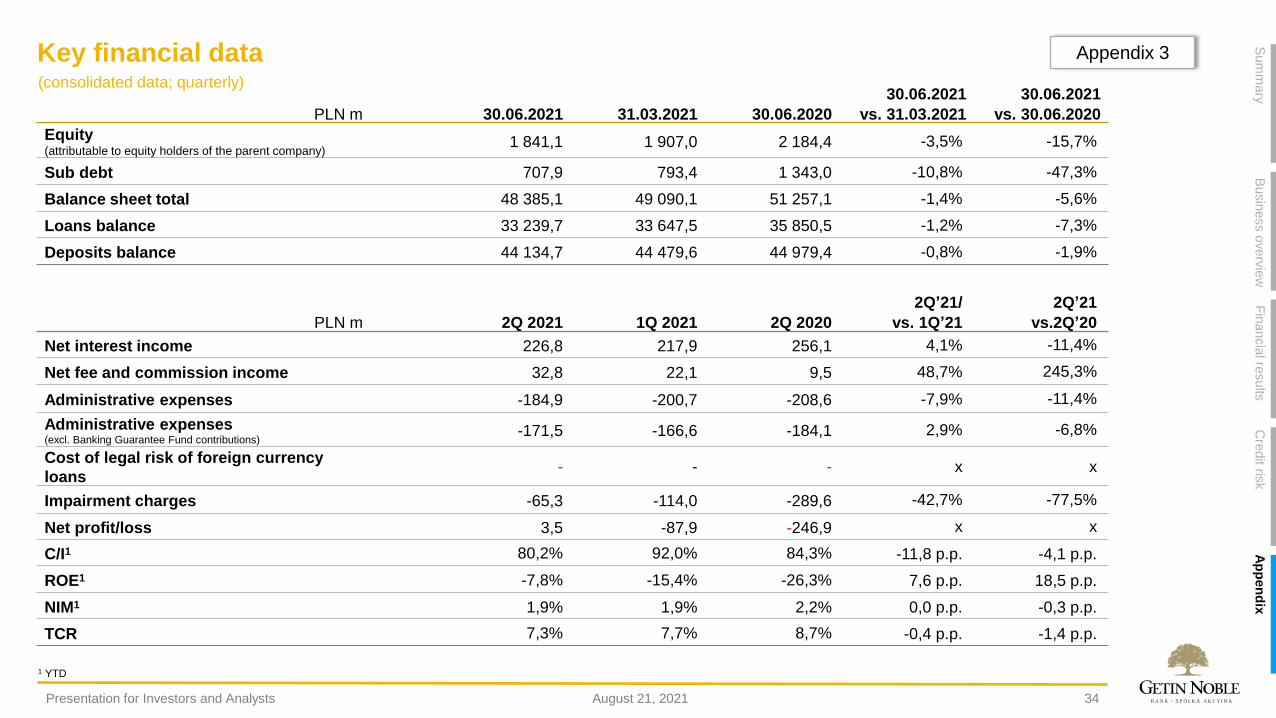
Key financial data
34
30.06.2021 30.06.2021
PLN m 30.06.2021 31.03.2021 30.06.2020 vs. 31.03.2021 vs. 30.06.2020
Equity(attributable to equity holders of the parent company)
1 841,1 1 907,0 2 184,4 -3,5% -15,7%
Sub debt 707,9 793,4 1 343,0 -10,8% -47,3%
Balance sheet total 48 385,1 49 090,1 51 257,1 -1,4% -5,6%
Loans balance 33 239,7 33 647,5 35 850,5 -1,2% -7,3%
Deposits balance 44 134,7 44 479,6 44 979,4 -0,8% -1,9%
2Q’21/ 2Q’21
PLN m 2Q 2021 1Q 2021 2Q 2020 vs. 1Q’21 vs.2Q’20
Net interest income 226,8 217,9 256,1 4,1% -11,4%
Net fee and commission income 32,8 22,1 9,5 48,7% 245,3%
Administrative expenses -184,9 -200,7 -208,6 -7,9% -11,4%
Administrative expenses(excl. Banking Guarantee Fund contributions)
-171,5 -166,6 -184,1 2,9% -6,8%
Cost of legal risk of foreign currency
loans- - - x x
Impairment charges -65,3 -114,0 -289,6 -42,7% -77,5%
Net profit/loss 3,5 -87,9 -246,9 x x
C/I1 80,2% 92,0% 84,3% -11,8 p.p. -4,1 p.p.
ROE1 -7,8% -15,4% -26,3% 7,6 p.p. 18,5 p.p.
NIM1 1,9% 1,9% 2,2% 0,0 p.p. -0,3 p.p.
TCR 7,3% 7,7% 8,7% -0,4 p.p. -1,4 p.p.
(consolidated data; quarterly)
Appendix 3
1 YTD
August 21, 2021Presentation for Investors and Analysts
Sum
mary
Busin
ess o
verv
iew
Fin
ancia
l results
Ap
pen
dix
Cre
dit ris
k
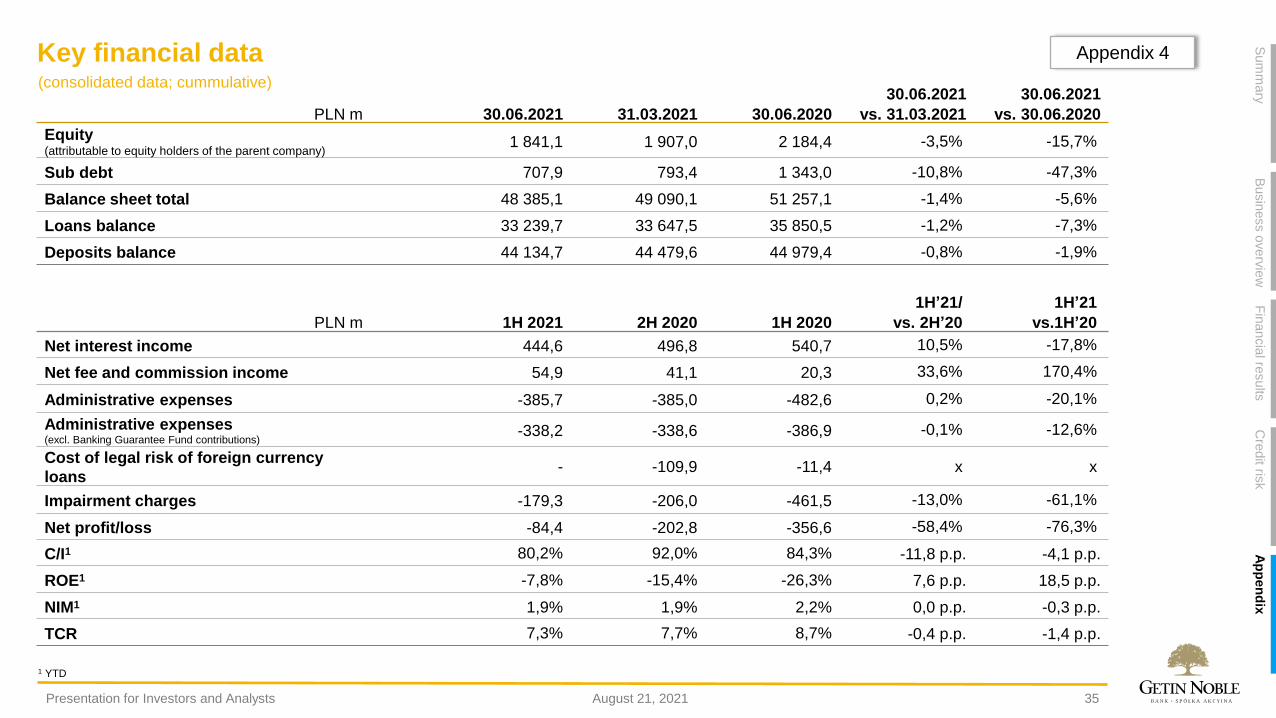
Key financial data
35
30.06.2021 30.06.2021
PLN m 30.06.2021 31.03.2021 30.06.2020 vs. 31.03.2021 vs. 30.06.2020
Equity(attributable to equity holders of the parent company)
1 841,1 1 907,0 2 184,4 -3,5% -15,7%
Sub debt 707,9 793,4 1 343,0 -10,8% -47,3%
Balance sheet total 48 385,1 49 090,1 51 257,1 -1,4% -5,6%
Loans balance 33 239,7 33 647,5 35 850,5 -1,2% -7,3%
Deposits balance 44 134,7 44 479,6 44 979,4 -0,8% -1,9%
1H’21/ 1H’21
PLN m 1H 2021 2H 2020 1H 2020 vs. 2H’20 vs.1H’20
Net interest income 444,6 496,8 540,7 10,5% -17,8%
Net fee and commission income 54,9 41,1 20,3 33,6% 170,4%
Administrative expenses -385,7 -385,0 -482,6 0,2% -20,1%
Administrative expenses(excl. Banking Guarantee Fund contributions)
-338,2 -338,6 -386,9 -0,1% -12,6%
Cost of legal risk of foreign currency
loans- -109,9 -11,4 x x
Impairment charges -179,3 -206,0 -461,5 -13,0% -61,1%
Net profit/loss -84,4 -202,8 -356,6 -58,4% -76,3%
C/I1 80,2% 92,0% 84,3% -11,8 p.p. -4,1 p.p.
ROE1 -7,8% -15,4% -26,3% 7,6 p.p. 18,5 p.p.
NIM1 1,9% 1,9% 2,2% 0,0 p.p. -0,3 p.p.
TCR 7,3% 7,7% 8,7% -0,4 p.p. -1,4 p.p.
(consolidated data; cummulative)
Appendix 4
1 YTD
August 21, 2021Presentation for Investors and Analysts
Sum
mary
Busin
ess o
verv
iew
Fin
ancia
l results
Ap
pen
dix
Cre
dit ris
k
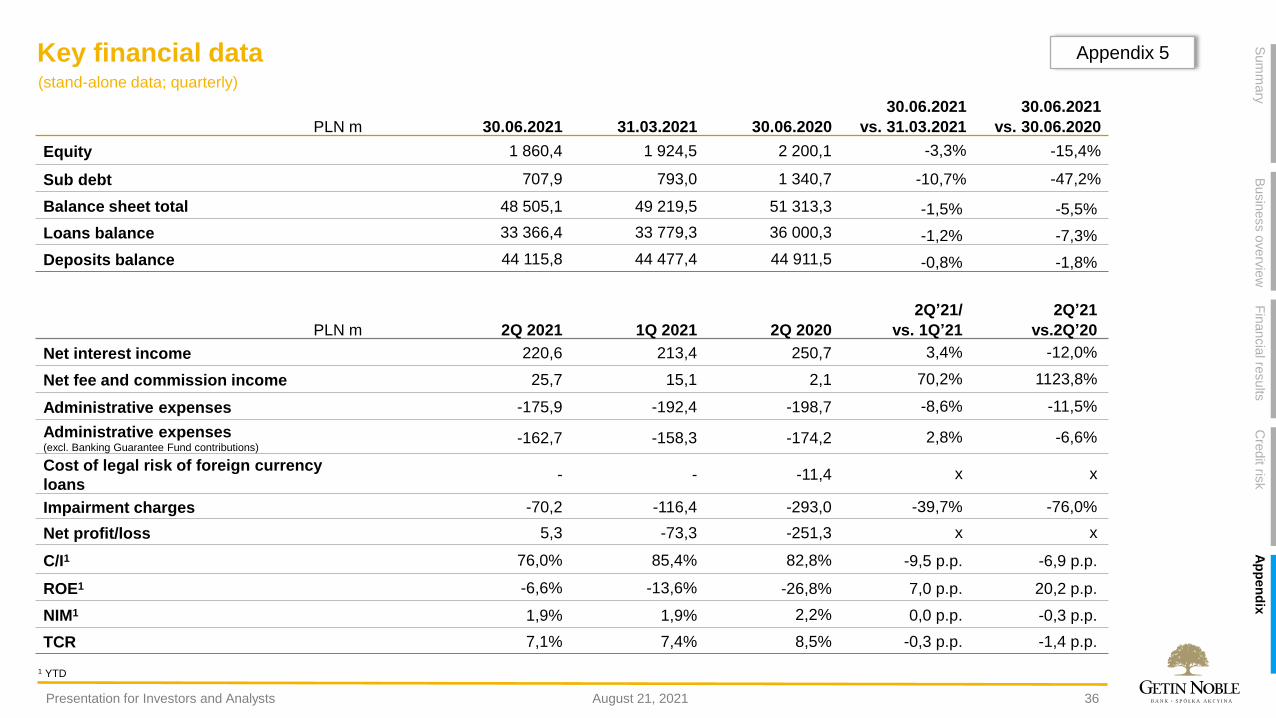
Key financial data
36
(stand-alone data; quarterly)
30.06.2021 30.06.2021
PLN m 30.06.2021 31.03.2021 30.06.2020 vs. 31.03.2021 vs. 30.06.2020
Equity 1 860,4 1 924,5 2 200,1 -3,3% -15,4%
Sub debt 707,9 793,0 1 340,7 -10,7% -47,2%
Balance sheet total 48 505,1 49 219,5 51 313,3 -1,5% -5,5%
Loans balance 33 366,4 33 779,3 36 000,3 -1,2% -7,3%
Deposits balance 44 115,8 44 477,4 44 911,5 -0,8% -1,8%
2Q’21/ 2Q’21
PLN m 2Q 2021 1Q 2021 2Q 2020 vs. 1Q’21 vs.2Q’20
Net interest income 220,6 213,4 250,7 3,4% -12,0%
Net fee and commission income 25,7 15,1 2,1 70,2% 1123,8%
Administrative expenses -175,9 -192,4 -198,7 -8,6% -11,5%
Administrative expenses(excl. Banking Guarantee Fund contributions)
-162,7 -158,3 -174,2 2,8% -6,6%
Cost of legal risk of foreign currency
loans- - -11,4 x x
Impairment charges -70,2 -116,4 -293,0 -39,7% -76,0%
Net profit/loss 5,3 -73,3 -251,3 x x
C/I1 76,0% 85,4% 82,8% -9,5 p.p. -6,9 p.p.
ROE1 -6,6% -13,6% -26,8% 7,0 p.p. 20,2 p.p.
NIM1 1,9% 1,9% 2,2% 0,0 p.p. -0,3 p.p.
TCR 7,1% 7,4% 8,5% -0,3 p.p. -1,4 p.p.
Appendix 5
1 YTD
August 21, 2021Presentation for Investors and Analysts
Sum
mary
Busin
ess o
verv
iew
Fin
ancia
l results
Ap
pen
dix
Cre
dit ris
k
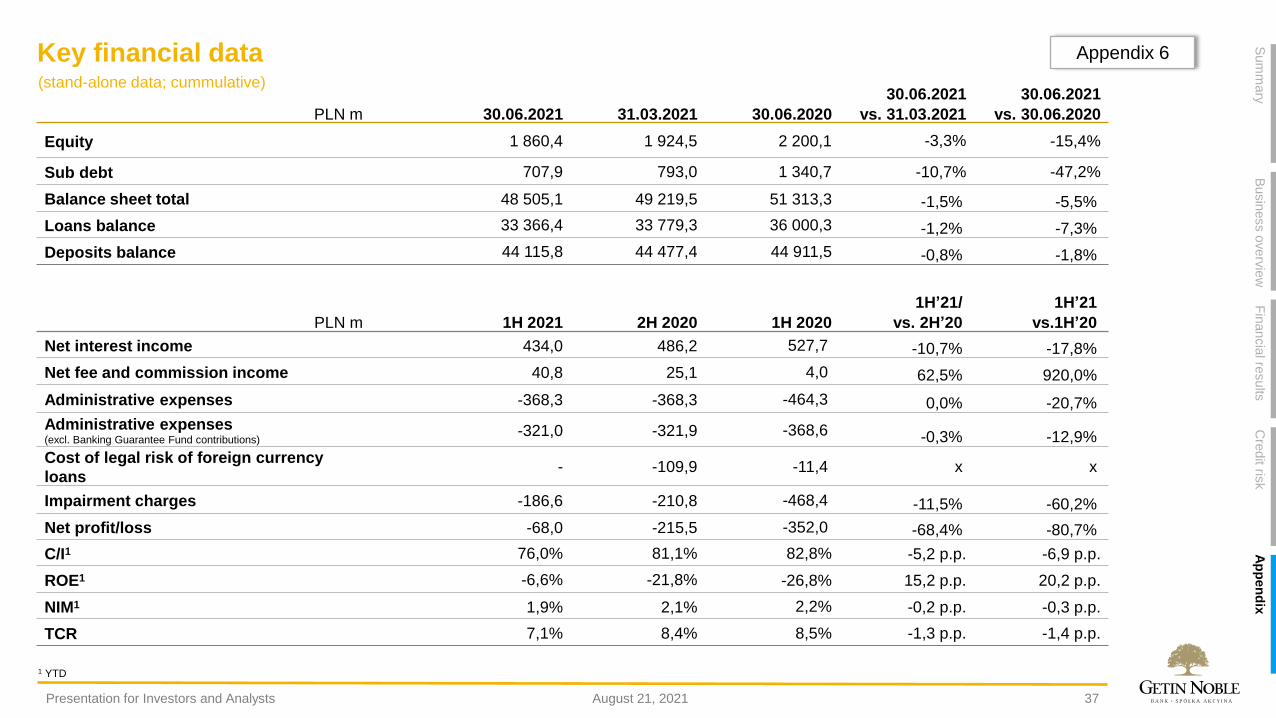
Key financial data
37
30.06.2021 30.06.2021
PLN m 30.06.2021 31.03.2021 30.06.2020 vs. 31.03.2021 vs. 30.06.2020
Equity 1 860,4 1 924,5 2 200,1 -3,3% -15,4%
Sub debt 707,9 793,0 1 340,7 -10,7% -47,2%
Balance sheet total 48 505,1 49 219,5 51 313,3 -1,5% -5,5%
Loans balance 33 366,4 33 779,3 36 000,3 -1,2% -7,3%
Deposits balance 44 115,8 44 477,4 44 911,5 -0,8% -1,8%
1H’21/ 1H’21
PLN m 1H 2021 2H 2020 1H 2020 vs. 2H’20 vs.1H’20
Net interest income 434,0 486,2 527,7 -10,7% -17,8%
Net fee and commission income 40,8 25,1 4,0 62,5% 920,0%
Administrative expenses -368,3 -368,3 -464,3 0,0% -20,7%
Administrative expenses(excl. Banking Guarantee Fund contributions)
-321,0 -321,9 -368,6 -0,3% -12,9%
Cost of legal risk of foreign currency
loans- -109,9 -11,4 x x
Impairment charges -186,6 -210,8 -468,4 -11,5% -60,2%
Net profit/loss -68,0 -215,5 -352,0 -68,4% -80,7%
C/I1 76,0% 81,1% 82,8% -5,2 p.p. -6,9 p.p.
ROE1 -6,6% -21,8% -26,8% 15,2 p.p. 20,2 p.p.
NIM1 1,9% 2,1% 2,2% -0,2 p.p. -0,3 p.p.
TCR 7,1% 8,4% 8,5% -1,3 p.p. -1,4 p.p.
(stand-alone data; cummulative)
Appendix 6
1 YTD
August 21, 2021Presentation for Investors and Analysts
Sum
mary
Busin
ess o
verv
iew
Fin
ancia
l results
Ap
pen
dix
Cre
dit ris
k
38
Disclaimer
This presentation (“Presentation”) has been prepared by Getin Noble Bank S.A. (the “Company”) for informational purposes only and may not, in any event, be considered or interpreted
as an offer and/or a recommendation to enter into any transaction. In particular, it may not be considered or interpreted as an offer to acquire any securities or as an offer, invitation or
incentive to make any acquisition offer, to make any investment or carry out any transaction involving such securities, nor may it be considered or interpreted as a recommendation to
enter into any transaction, particularly any transaction involving the Company’s securities.
You are cautioned against using this presentation as the basis for making a decision to purchase or sell securities.
You are deemed to have represented and agreed that you and any customers you represent are either (a) qualified institutional buyers (within the meaning of Regulation 144A under the
U.S. Securities Act), or (b) not a U.S. person and are outside of the United States and not acting for the account or benefit of a U.S. person (as defined in Regulation S under the U.S.
Securities Act).
Although information contained in this Presentation is based on generally available sources that the Company believes to be reliable, the Company cannot guarantee that this information
is full and complete. The Company takes no responsibility for the consequences of any decisions based on any information contained in this Presentation. The information contained in
this Presentation has never been subject to independent verification and may at any time be subject to change or modification.
The Company is not required to publicly disclose any possible modification or change to any information, data or statement contained in this Presentation if the Company changes its
strategy or intentions or if any unforeseen events or circumstances occur that affect the Company’s strategy and/or intentions.
No information contained in this Presentation may, by any means, by considered or interpreted as a forecast or any express or implied representation or warranty whatsoever made by
the Company or any person acting on behalf of the Company. In addition, neither the Company nor any person acting on its behalf shall be liable, in any way whatsoever, for any loss or
damage that may be caused as a result of negligence or otherwise in connection with the use of this Presentation or any information contained in it, or for any damage that might
otherwise arise in connection with any information contained in this Presentation.
The publication by the Company of the data contained in this Presentation is not a breach of the regulations applicable to companies whose shares are traded on a regulated market,
particularly on a regulated market of the Warsaw Stock Exchange (Giełda Papierów Wartościowych w Warszawie S.A.). The information provided in this Presentation has already been
disclosed in current or periodic reports published by the Company or constitutes an addition to those reports, and its publication does not require the Company to fulfill the obligation to
provide information as imposed on the Company as a public company.
This Presentation does not purport to be complete. Please note that the only reliable source of information on the Company is the current and periodic reports published by the Company
in performing its information obligations, available on the Company’s web site at www.gnb.pl.
The Presentation is Confidential and should be treated as such and may not be copied or given to any other person, nor may the information contained therein be disclosed to any other
person unless required by law. These materials are not intended for distribution to, or use by, any person or entity in any jurisdiction or country where such distribution or use is contrary
to local law or regulations.
August 21, 2021Presentation for Investors and Analysts
Sum
mary
Busin
ess o
verv
iew
Fin
ancia
l results
Ap
pen
dix
Cre
dit ris
k
More about Getin Noble Bank S.A.
Q3 financial results– November 10, 2021⚫
UPCOMING EVENTS :
Contact: Arkadiusz Milewski
Investor Relations Director
www.gnb.plIR website: Find us on: