Embed Size (px)
Citation preview
1July 28, 2021 Second Quarter 2021 Financial Review and Analysis
Second Quarter 2021Financial Review and Analysis(preliminary, unaudited)
July 28, 2021
Supplemental Presentation MaterialsUnless otherwise indicated, comparisons are to the same period in the prior year.
2July 28, 2021 Second Quarter 2021 Financial Review and Analysis
Safe Harbor StatementCertain statements contained in this document are "forward-looking statements" intended to qualify for the safe harbor from liability established by the Private Securities Litigation Reform Act of 1995. These forward-looking statements, and financial or other business targets, are subject to certain risks and uncertainties. Forward-looking statements also include those related to the acquisition of Vestcom, including its anticipated closing, benefits, financing and effect on our long-term targets and future financial results. We believe that the most significant risk factors that could affect our financial performance in the near-term include: (i) the impacts to underlying demand for our products and/or foreign currency fluctuations from global economic conditions, political uncertainty, changes in environmental standards and governmental regulations, including as a result of the coronavirus/COVID-19 pandemic; (ii) competitors’ actions, including pricing, expansion in key markets, and product offerings; (iii) the degree to which higher costs can be offset with productivity measures and/or passed on to customers through price increases, without a significant loss of volume; and (iv) the execution and integration of acquisitions, including the pending acquisition of Vestcom.
Actual results and trends may differ materially from historical or anticipated results depending on a variety of factors, including but are not limited to, risks and uncertainties relating to the following: ● COVID-19● The Vestcom acquisition – our ability to complete the acquisition on the proposed terms or anticipated timeline, including risks and uncertainties related to securing the necessary regulatory approvals, financing
and satisfaction of other closing conditions to complete the acquisition; the occurrence of any event, change or other circumstance that could give rise to the termination of the agreement related to the acquisition; significant transaction costs or unknown or inestimable liabilities; the risk of stockholder litigation in connection with the pending acquisition; risks related to future opportunities and plans for the combined company, including the uncertainty of expected future financial performance and results of the combined company after the acquisition closes; effects related to the announcement or completion of the acquisition on the market price of our common stock; and the possibility that, if we do not achieve the perceived benefits of the acquisition as rapidly or to the extent anticipated by financial analysts or investors, the market price of our common stock could decline
● International Operations – worldwide and local economic and market conditions; changes in political conditions; and fluctuations in foreign currency exchange rates and other risks associated with foreign operations, including in emerging markets
● Our Business – changes in our markets due to competitive conditions, technological developments, environmental standards, laws and regulations, and customer preferences; fluctuations in demand affecting sales to customers; execution and integration of acquisitions, including the pending acquisition of Vestcom; selling prices; fluctuations in the cost and availability of raw materials and energy; the impact of competitive products and pricing; customer and supplier concentrations or consolidations; financial condition of distributors; outsourced manufacturers; product and service quality; timely development and market acceptance of new products, including sustainable or sustainably-sourced products; investment in development activities and new production facilities; successful implementation of new manufacturing technologies and installation of manufacturing equipment; our ability to generate sustained productivity improvement; our ability to achieve and sustain targeted cost reductions; and collection of receivables from customers
● Income Taxes – fluctuations in tax rates; changes in tax laws and regulations, and uncertainties associated with interpretations of such laws and regulations; retention of tax incentives; outcome of tax audits; and the realization of deferred tax assets
● Information Technology – disruptions in information technology systems, including cyber-attacks or other intrusions to network security; successful installation of new or upgraded information technology systems; and data security breaches
● Human Capital – recruitment and retention of employees; fluctuations in employee benefit costs; and collective labor arrangements● Our Indebtedness – credit risks; our ability to obtain adequate financing arrangements and maintain access to capital; volatility of financial markets; fluctuations in interest rates; and compliance with our debt
covenants● Ownership of Our Stock – potential significant variability of our stock price and amounts of future dividends and share repurchases● Legal and Regulatory Matters – protection and infringement of intellectual property and impact of legal and regulatory proceedings, including with respect to environmental, health and safety, anti-corruption and
trade compliance● Other Financial Matters – fluctuations in pension costs and goodwill impairment
For a more detailed discussion of these factors, see “Risk Factors” and “Management’s Discussion and Analysis of Financial Condition and Results of Operations” in our 2020 Form 10-K, filed with the Securities and Exchange Commission on February 25, 2021, and subsequent quarterly reports on Form 10-Q.
The forward-looking statements included in this document are made only as of the date of this document, and we undertake no obligation to update these statements to reflect subsequent events or circumstances, other than as may be required by law.
3July 28, 2021 Second Quarter 2021 Financial Review and Analysis
Use of Non-GAAP Financial MeasuresThis presentation contains certain non-GAAP financial measures as defined by SEC rules. We report our financial results in conformity with accounting principles generally accepted in the United States of America, or GAAP, and also communicate with investors using certain non-GAAP financial measures. These non-GAAP financial measures are not in accordance with, nor are they a substitute for or superior to, the comparable GAAP financial measures. These non-GAAP financial measures are intended to supplement the presentation of our financial results that are prepared in accordance with GAAP. Based upon feedback from investors and financial analysts, we believe that the supplemental non-GAAP financial measures we provide are useful to their assessments of our performance and operating trends, as well as liquidity. In accordance with Regulations G and S-K, reconciliations of non-GAAP financial measures to the most directly comparable GAAP financial measures, including limitations associated with these non-GAAP financial measures, are provided in the financial schedules accompanying the earnings news release for the quarter (see Attachments A-4 through A-10 to news release dated July 28, 2021).
Our non-GAAP financial measures exclude the impact of certain events, activities or strategic decisions. The accounting effects of these events, activities or decisions, which are included in the GAAP financial measures, may make it difficult to assess our underlying performance in a single period. By excluding the accounting effects, positive or negative, of certain items (e.g., restructuring charges, outcomes of certain legal proceedings, certain effects of strategic transactions and related costs, losses from debt extinguishments, gains or losses from curtailment or settlement of pension obligations, gains or losses on sales of certain assets, gains or losses on investments, and other items), we believe that we are providing meaningful supplemental information that facilitates an understanding of our core operating results and liquidity measures. While some of the items we exclude from GAAP financial measures recur, they tend to be disparate in amount, frequency, or timing.
We use these non-GAAP financial measures internally to evaluate trends in our underlying performance, as well as to facilitate comparison to the results of competitors for a single period and full year, as applicable.
We use the non-GAAP financial measures described below in the accompanying news release and presentation.
• Sales change ex. currency refers to the increase or decrease in net sales, excluding the estimated impact of foreign currency translation, and, where applicable, the calendar shift resulting from the extra week in the prior fiscal year and currency adjustment for transitional reporting of highly inflationary economies. The estimated impact of foreign currency translation is calculated on a constant currency basis, with prior period results translated at current period average exchange rates to exclude the effect of currency fluctuations.
• Organic sales change refers to sales change ex. currency, excluding the estimated impact of product line exits, acquisitions and divestitures.
We believe that sales change ex. currency and organic sales change assist investors in evaluating the sales change from the ongoing activities of our businesses and enhance their ability to evaluate our results from period to period.
• Adjusted operating income refers to income before taxes; interest expense; other non-operating expense (income), net; and other expense (income), net.• Adjusted EBITDA refers to adjusted operating income before depreciation and amortization.• Adjusted operating margin refers to adjusted operating income as a percentage of net sales.• Adjusted EBITDA margin refers to adjusted EBITDA as a percentage of net sales.• Adjusted tax rate refers to the projected full-year GAAP tax rate, adjusted to exclude certain unusual or infrequent events that are expected to significantly impact that rate, such as effects of certain discrete tax planning actions,
impacts related to the enactment of the U.S. Tax Cuts and Jobs Act ("TCJA"), where applicable, and other items.• Adjusted net income refers to income before taxes, tax-effected at the adjusted tax rate, and adjusted for tax-effected restructuring charges and other items.• Adjusted net income per common share, assuming dilution (adjusted EPS) refers to adjusted net income divided by weighted average number of common shares outstanding, assuming dilution.
We believe that adjusted operating margin, adjusted EBITDA margin, adjusted net income, and adjusted EPS assist investors in understanding our core operating trends and comparing our results with those of our competitors.
• Net debt to adjusted EBITDA ratio refers to total debt (including finance leases) less cash and cash equivalents, divided by adjusted EBITDA for the last twelve months. We believe that the net debt to adjusted EBITDA ratio assists investors in assessing our leverage position.
• Free cash flow refers to cash flow provided by operating activities, less payments for property, plant and equipment, software and other deferred charges, plus proceeds from sales of property, plant and equipment, plus (minus) net proceeds from insurance and sales (purchases) of investments. We believe that free cash flow assists investors by showing the amount of cash we have available for debt reductions, dividends, share repurchases, and acquisitions.
This document has been furnished (not filed) on Form 8-K with the SEC and may be found on our website at www.investors.averydennison.com
4July 28, 2021 Second Quarter 2021 Financial Review and Analysis
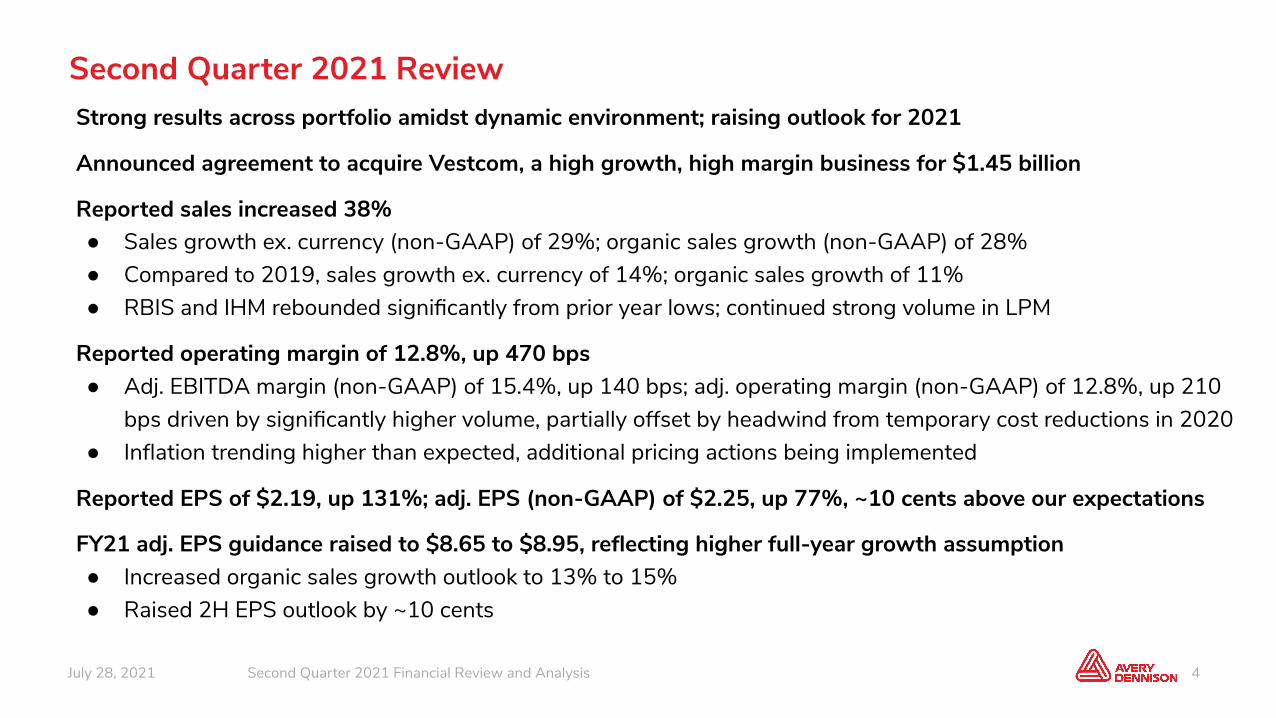
Second Quarter 2021 ReviewStrong results across portfolio amidst dynamic environment; raising outlook for 2021
Announced agreement to acquire Vestcom, a high growth, high margin business for $1.45 billion
Reported sales increased 38%● Sales growth ex. currency (non-GAAP) of 29%; organic sales growth (non-GAAP) of 28%● Compared to 2019, sales growth ex. currency of 14%; organic sales growth of 11%● RBIS and IHM rebounded significantly from prior year lows; continued strong volume in LPM
Reported operating margin of 12.8%, up 470 bps● Adj. EBITDA margin (non-GAAP) of 15.4%, up 140 bps; adj. operating margin (non-GAAP) of 12.8%, up 210
bps driven by significantly higher volume, partially offset by headwind from temporary cost reductions in 2020 ● Inflation trending higher than expected, additional pricing actions being implemented
Reported EPS of $2.19, up 131%; adj. EPS (non-GAAP) of $2.25, up 77%, ~10 cents above our expectations
FY21 adj. EPS guidance raised to $8.65 to $8.95, reflecting higher full-year growth assumption● Increased organic sales growth outlook to 13% to 15%● Raised 2H EPS outlook by ~10 cents
5July 28, 2021 Second Quarter 2021 Financial Review and Analysis
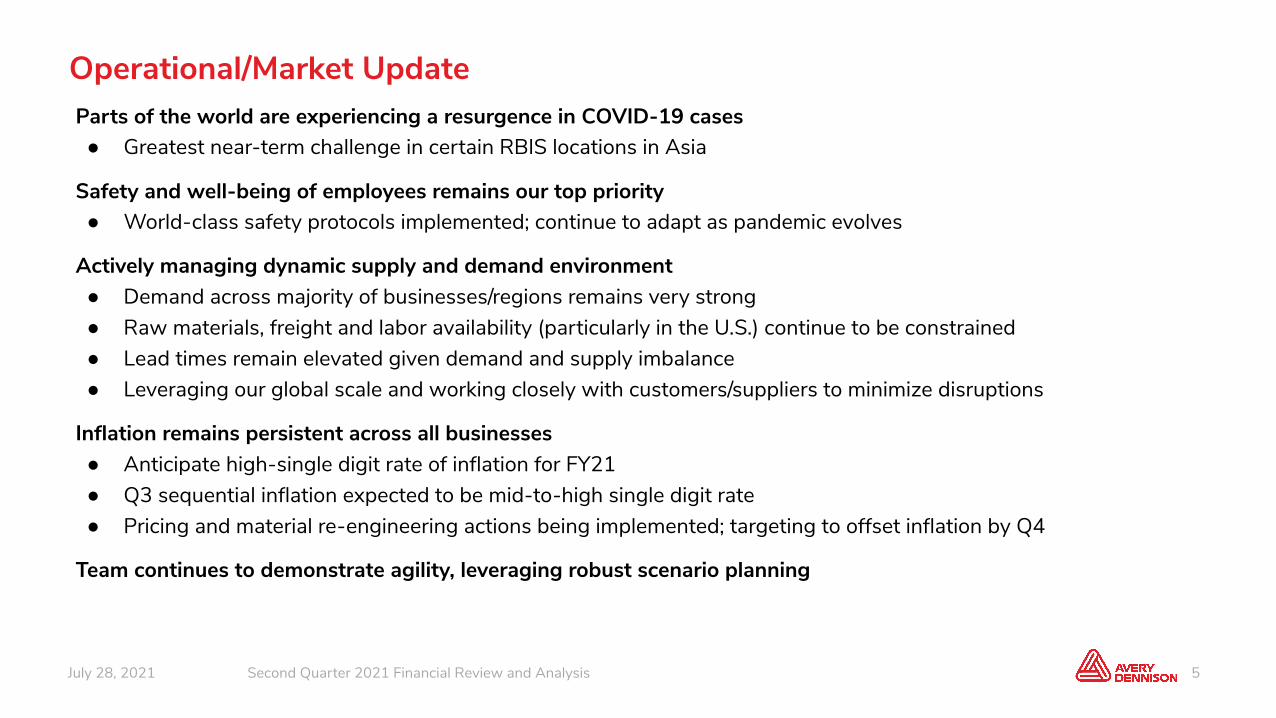
Operational/Market UpdateParts of the world are experiencing a resurgence in COVID-19 cases● Greatest near-term challenge in certain RBIS locations in Asia
Safety and well-being of employees remains our top priority ● World-class safety protocols implemented; continue to adapt as pandemic evolves
Actively managing dynamic supply and demand environment ● Demand across majority of businesses/regions remains very strong● Raw materials, freight and labor availability (particularly in the U.S.) continue to be constrained● Lead times remain elevated given demand and supply imbalance● Leveraging our global scale and working closely with customers/suppliers to minimize disruptions
Inflation remains persistent across all businesses ● Anticipate high-single digit rate of inflation for FY21● Q3 sequential inflation expected to be mid-to-high single digit rate ● Pricing and material re-engineering actions being implemented; targeting to offset inflation by Q4
Team continues to demonstrate agility, leveraging robust scenario planning
6July 28, 2021 Second Quarter 2021 Financial Review and Analysis
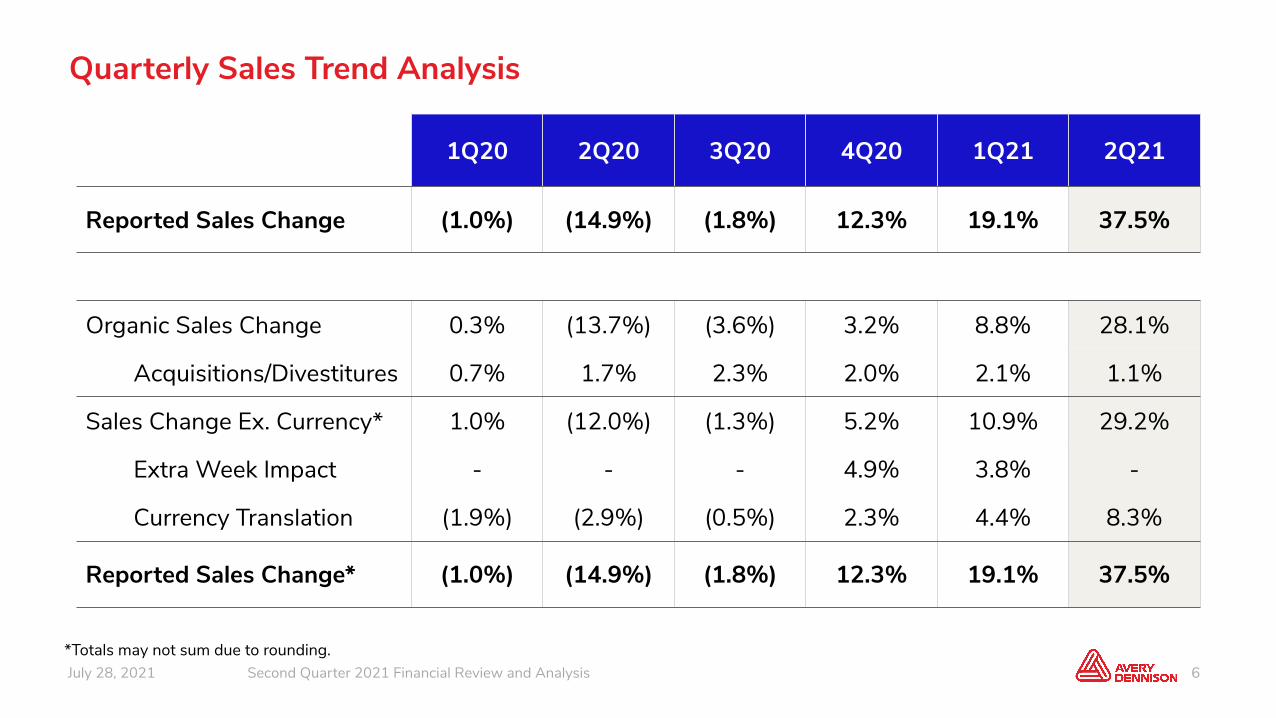
Quarterly Sales Trend Analysis
1Q20 2Q20 3Q20 4Q20 1Q21 2Q21
Reported Sales Change (1.0%) (14.9%) (1.8%) 12.3% 19.1% 37.5%
Organic Sales Change 0.3% (13.7%) (3.6%) 3.2% 8.8% 28.1%
Acquisitions/Divestitures 0.7% 1.7% 2.3% 2.0% 2.1% 1.1%
Sales Change Ex. Currency* 1.0% (12.0%) (1.3%) 5.2% 10.9% 29.2%
Extra Week Impact - - - 4.9% 3.8% -
Currency Translation (1.9%) (2.9%) (0.5%) 2.3% 4.4% 8.3%
Reported Sales Change* (1.0%) (14.9%) (1.8%) 12.3% 19.1% 37.5%
*Totals may not sum due to rounding.
7July 28, 2021 Second Quarter 2021 Financial Review and Analysis
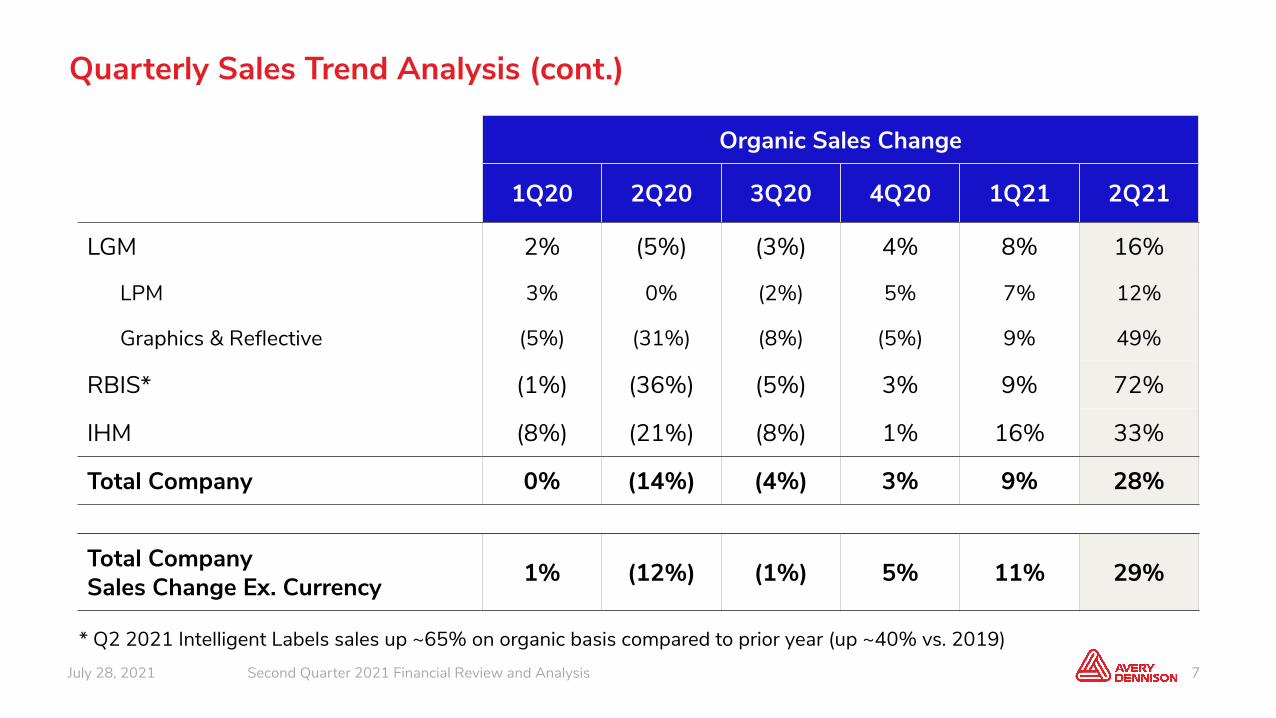
Organic Sales Change
1Q20 2Q20 3Q20 4Q20 1Q21 2Q21
LGM 2% (5%) (3%) 4% 8% 16%
LPM 3% 0% (2%) 5% 7% 12%
Graphics & Reflective (5%) (31%) (8%) (5%) 9% 49%
RBIS* (1%) (36%) (5%) 3% 9% 72%
IHM (8%) (21%) (8%) 1% 16% 33%
Total Company 0% (14%) (4%) 3% 9% 28%
Total Company Sales Change Ex. Currency 1% (12%) (1%) 5% 11% 29%
Quarterly Sales Trend Analysis (cont.)
* Q2 2021 Intelligent Labels sales up ~65% on organic basis compared to prior year (up ~40% vs. 2019)
8July 28, 2021 Second Quarter 2021 Financial Review and Analysis
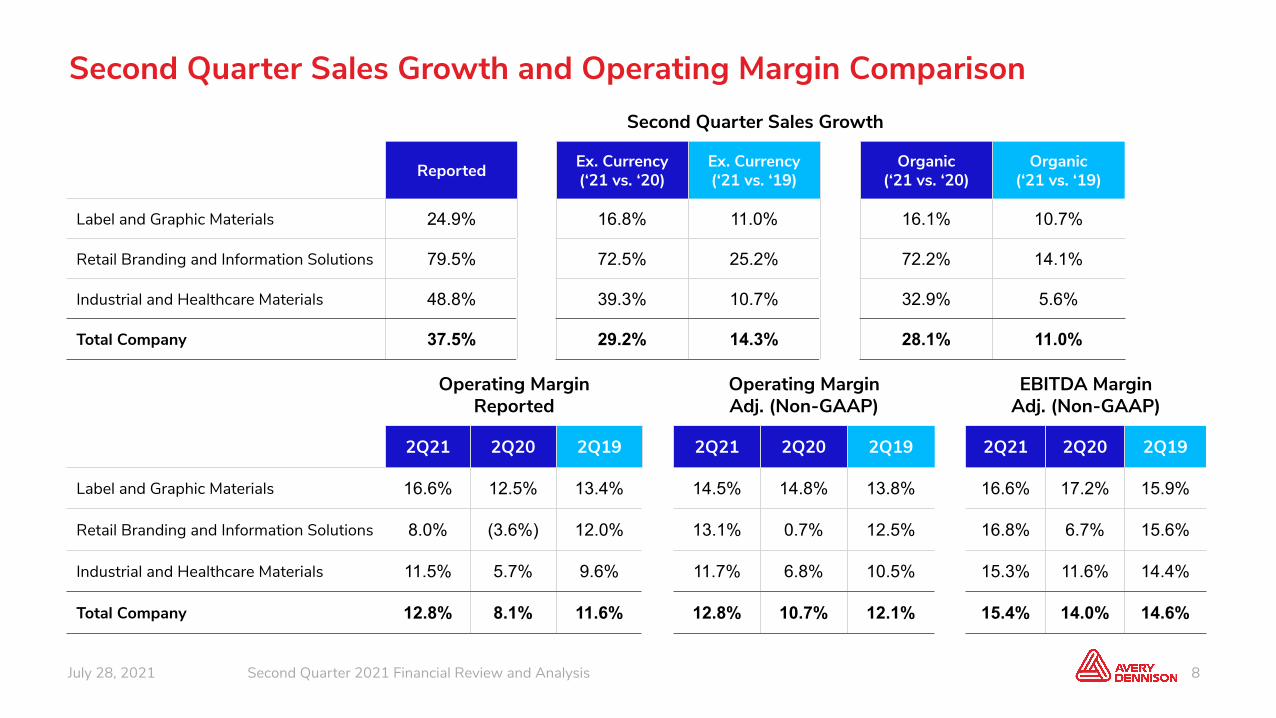
Second Quarter Sales Growth and Operating Margin Comparison
Operating MarginReported
Operating MarginAdj. (Non-GAAP)
EBITDA MarginAdj. (Non-GAAP)
2Q21 2Q20 2Q19 2Q21 2Q20 2Q19 2Q21 2Q20 2Q19
Label and Graphic Materials 16.6% 12.5% 13.4% 14.5% 14.8% 13.8% 16.6% 17.2% 15.9%
Retail Branding and Information Solutions 8.0% (3.6%) 12.0% 13.1% 0.7% 12.5% 16.8% 6.7% 15.6%
Industrial and Healthcare Materials 11.5% 5.7% 9.6% 11.7% 6.8% 10.5% 15.3% 11.6% 14.4%
Total Company 12.8% 8.1% 11.6% 12.8% 10.7% 12.1% 15.4% 14.0% 14.6%
Second Quarter Sales Growth
Reported Ex. Currency (‘21 vs. ‘20)
Ex. Currency (‘21 vs. ‘19)
Organic (‘21 vs. ‘20)
Organic (‘21 vs. ‘19)
Label and Graphic Materials 24.9% 16.8% 11.0% 16.1% 10.7%
Retail Branding and Information Solutions 79.5% 72.5% 25.2% 72.2% 14.1%
Industrial and Healthcare Materials 48.8% 39.3% 10.7% 32.9% 5.6%
Total Company 37.5% 29.2% 14.3% 28.1% 11.0%
9July 28, 2021 Second Quarter 2021 Financial Review and Analysis
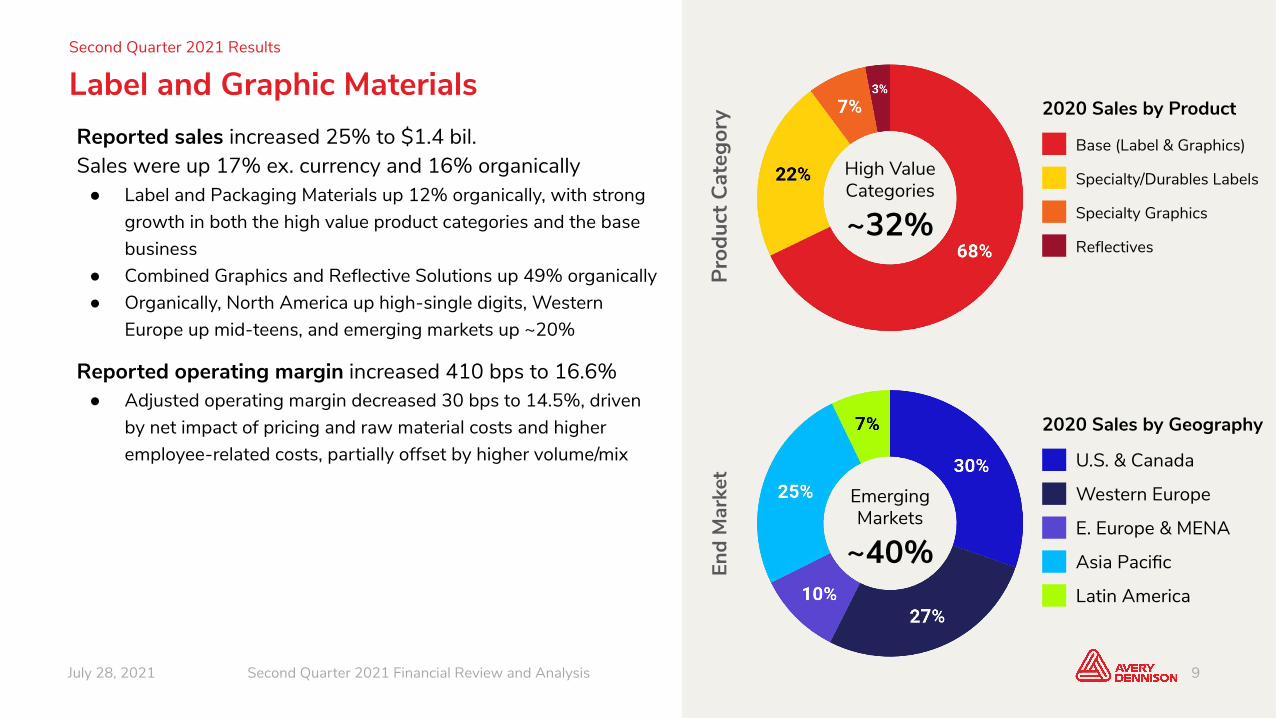
Label and Graphic MaterialsReported sales increased 25% to $1.4 bil.Sales were up 17% ex. currency and 16% organically● Label and Packaging Materials up 12% organically, with strong
growth in both the high value product categories and the base business
● Combined Graphics and Reflective Solutions up 49% organically● Organically, North America up high-single digits, Western
Europe up mid-teens, and emerging markets up ~20%
Reported operating margin increased 410 bps to 16.6%● Adjusted operating margin decreased 30 bps to 14.5%, driven
by net impact of pricing and raw material costs and higher employee-related costs, partially offset by higher volume/mix
2020 Sales by Product
Base (Label & Graphics)
Specialty/Durables Labels
Specialty Graphics
Reflectives
2020 Sales by Geography
U.S. & Canada
Western Europe
E. Europe & MENA
Asia Pacific
Latin America
9
High ValueCategories
~32%
EmergingMarkets
~40%
Second Quarter 2021 Results
End
Mar
ket
Prod
uct C
ateg
ory
10July 28, 2021 Second Quarter 2021 Financial Review and Analysis
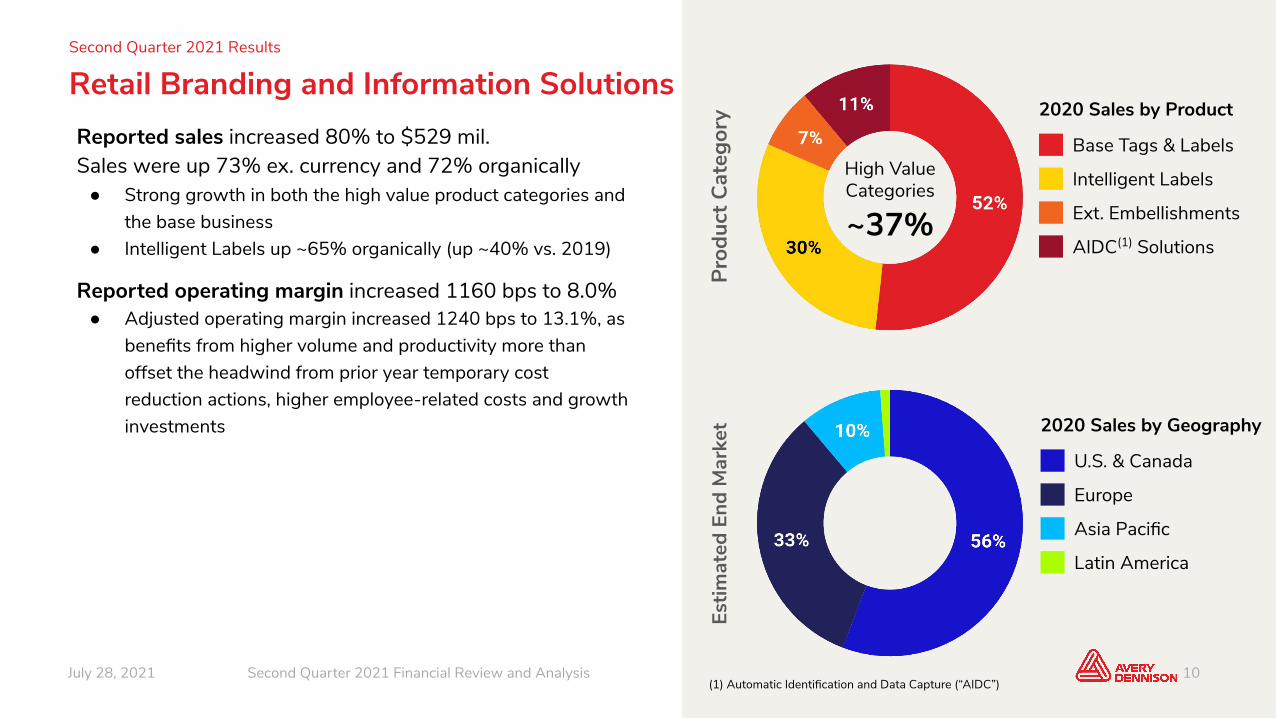
Retail Branding and Information SolutionsReported sales increased 80% to $529 mil. Sales were up 73% ex. currency and 72% organically● Strong growth in both the high value product categories and
the base business● Intelligent Labels up ~65% organically (up ~40% vs. 2019)
Reported operating margin increased 1160 bps to 8.0%● Adjusted operating margin increased 1240 bps to 13.1%, as
benefits from higher volume and productivity more than offset the headwind from prior year temporary cost reduction actions, higher employee-related costs and growth investments
2020 Sales by Product
Base Tags & Labels
Intelligent Labels
Ext. Embellishments
AIDC(1) Solutions
10
Second Quarter 2021 Results
2020 Sales by Geography
U.S. & Canada
Europe
Asia Pacific
Latin America
Estim
ated
End
Mar
ket
Prod
uct C
ateg
ory
High ValueCategories
~37%
(1) Automatic Identification and Data Capture (“AIDC”)
11July 28, 2021 Second Quarter 2021 Financial Review and Analysis
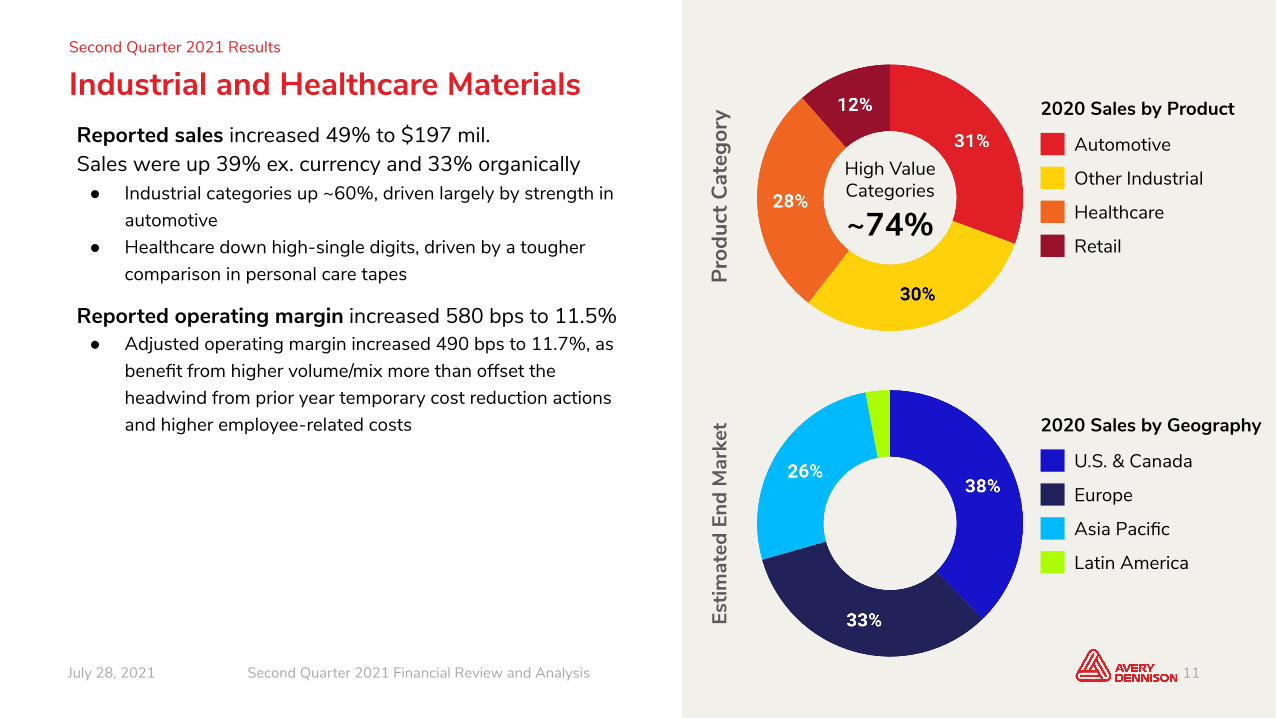
Industrial and Healthcare MaterialsReported sales increased 49% to $197 mil.Sales were up 39% ex. currency and 33% organically● Industrial categories up ~60%, driven largely by strength in
automotive● Healthcare down high-single digits, driven by a tougher
comparison in personal care tapes
Reported operating margin increased 580 bps to 11.5%● Adjusted operating margin increased 490 bps to 11.7%, as
benefit from higher volume/mix more than offset the headwind from prior year temporary cost reduction actions and higher employee-related costs
2020 Sales by Product
Automotive
Other Industrial
Healthcare
Retail
2020 Sales by Geography
U.S. & Canada
Europe
Asia Pacific
Latin America
11
Second Quarter 2021 Results
High ValueCategories
~74%
Estim
ated
End
Mar
ket
Prod
uct C
ateg
ory
12July 28, 2021 Second Quarter 2021 Financial Review and Analysis
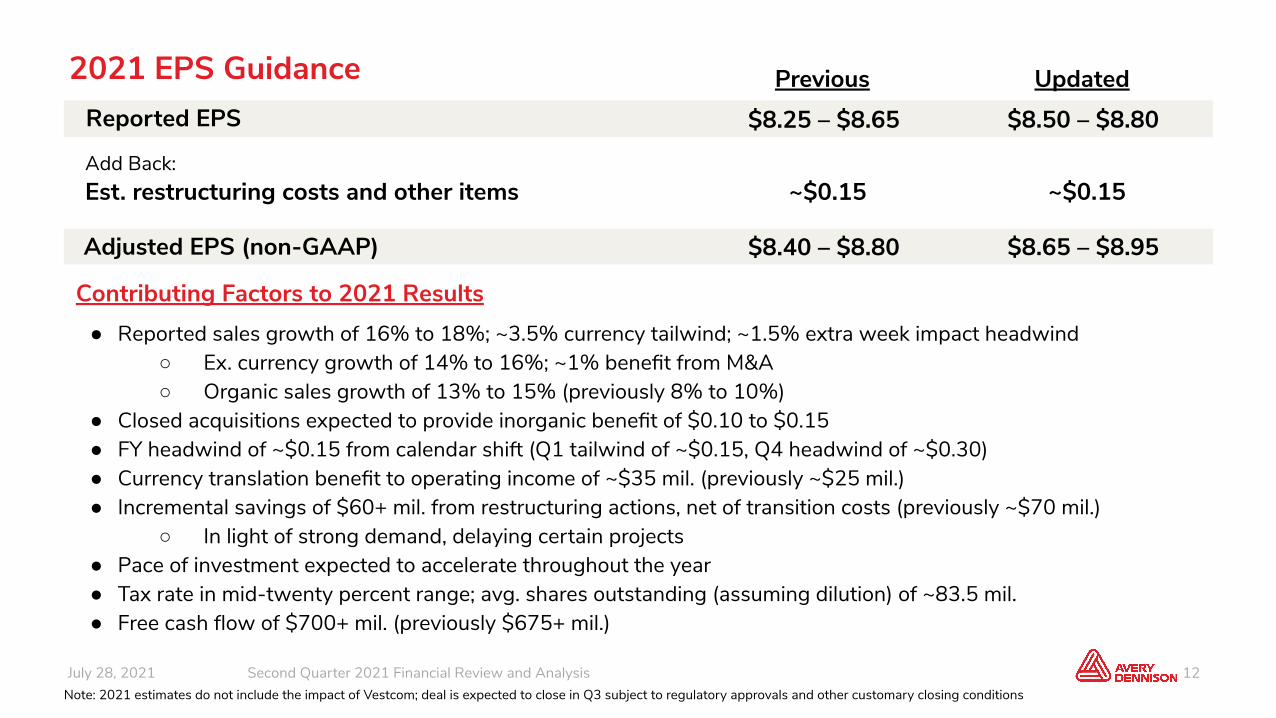
2021 EPS Guidance
Add Back:Est. restructuring costs and other items
Adjusted EPS (non-GAAP)
Reported EPS $8.50 – $8.80
$8.65 – $8.95
Contributing Factors to 2021 Results● Reported sales growth of 16% to 18%; ~3.5% currency tailwind; ~1.5% extra week impact headwind
○ Ex. currency growth of 14% to 16%; ~1% benefit from M&A○ Organic sales growth of 13% to 15% (previously 8% to 10%)
● Closed acquisitions expected to provide inorganic benefit of $0.10 to $0.15● FY headwind of ~$0.15 from calendar shift (Q1 tailwind of ~$0.15, Q4 headwind of ~$0.30)● Currency translation benefit to operating income of ~$35 mil. (previously ~$25 mil.)● Incremental savings of $60+ mil. from restructuring actions, net of transition costs (previously ~$70 mil.)
○ In light of strong demand, delaying certain projects● Pace of investment expected to accelerate throughout the year● Tax rate in mid-twenty percent range; avg. shares outstanding (assuming dilution) of ~83.5 mil.● Free cash flow of $700+ mil. (previously $675+ mil.)
~$0.15
Previous Updated
$8.25 – $8.65
$8.40 – $8.80
~$0.15
Note: 2021 estimates do not include the impact of Vestcom; deal is expected to close in Q3 subject to regulatory approvals and other customary closing conditions

13July 28, 2021 Second Quarter 2021 Financial Review and Analysis
Vestcom Acquisition Overview
14July 28, 2021 Second Quarter 2021 Financial Review and Analysis
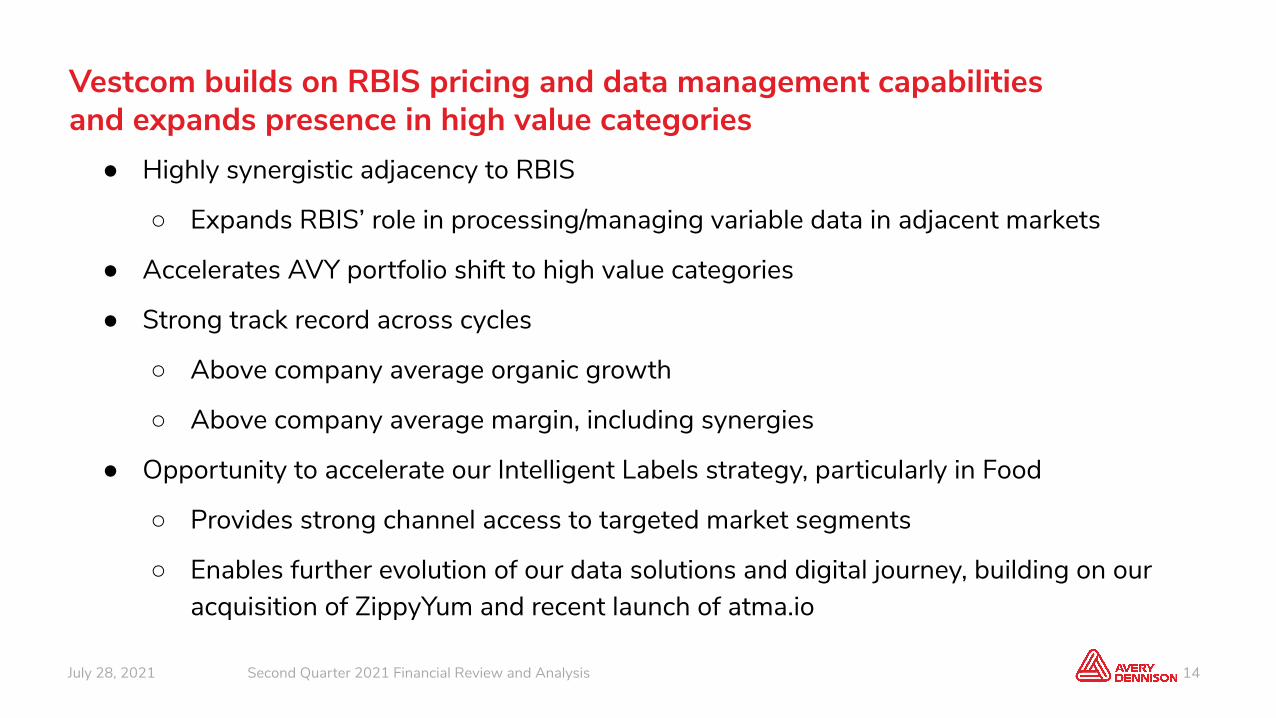
Vestcom builds on RBIS pricing and data management capabilities and expands presence in high value categories
● Highly synergistic adjacency to RBIS
○ Expands RBIS’ role in processing/managing variable data in adjacent markets
● Accelerates AVY portfolio shift to high value categories
● Strong track record across cycles
○ Above company average organic growth
○ Above company average margin, including synergies
● Opportunity to accelerate our Intelligent Labels strategy, particularly in Food
○ Provides strong channel access to targeted market segments
○ Enables further evolution of our data solutions and digital journey, building on our acquisition of ZippyYum and recent launch of atma.io
15July 28, 2021 Second Quarter 2021 Financial Review and Analysis
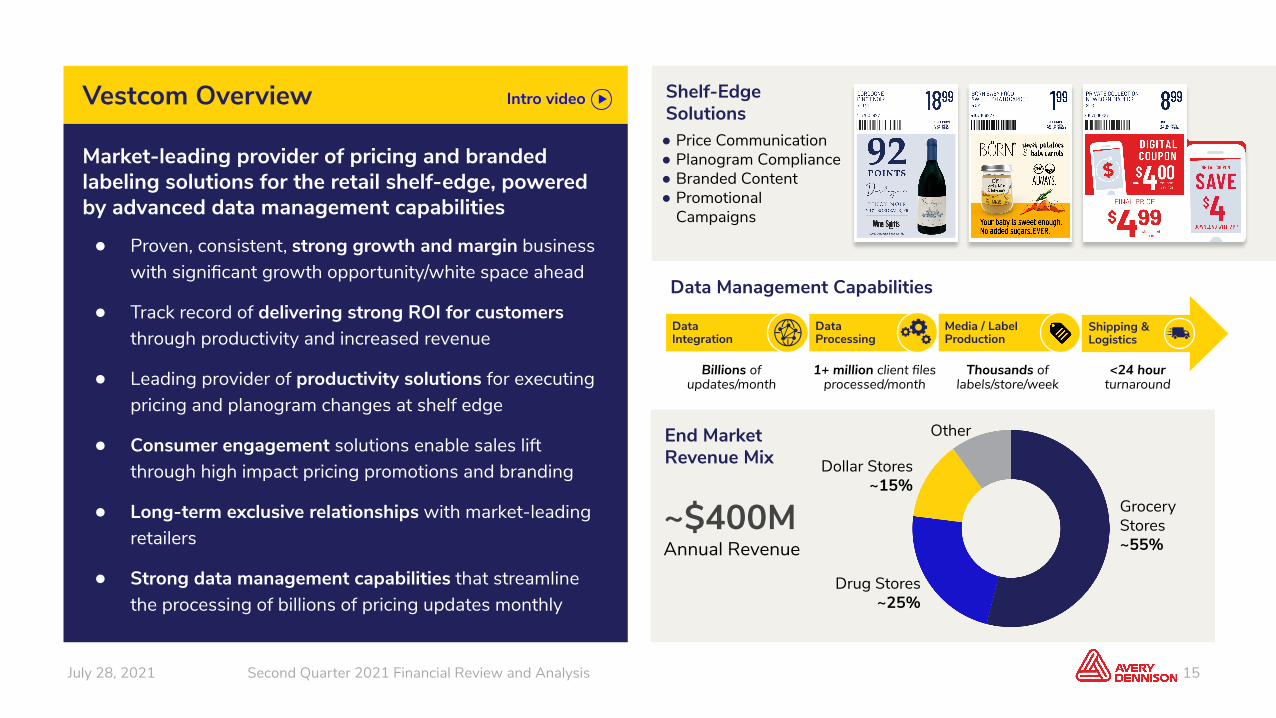
End Market Revenue Mix
Shipping & Logistics
Media / Label Production
Billions of updates/month
1+ million client files processed/month
Thousands of labels/store/week
<24 hour turnaround
Data Integration
Data Processing
Shelf-Edge Solutions
Data Management Capabilities
Vestcom Overview
Market-leading provider of pricing and branded labeling solutions for the retail shelf-edge, powered by advanced data management capabilities
● Proven, consistent, strong growth and margin business with significant growth opportunity/white space ahead
● Track record of delivering strong ROI for customers through productivity and increased revenue
● Leading provider of productivity solutions for executing pricing and planogram changes at shelf edge
● Consumer engagement solutions enable sales lift through high impact pricing promotions and branding
● Long-term exclusive relationships with market-leading retailers
● Strong data management capabilities that streamline the processing of billions of pricing updates monthly
~$400MAnnual Revenue
Grocery Stores~55%
Drug Stores~25%
Dollar Stores~15%
Other
● Price Communication● Planogram Compliance● Branded Content● Promotional
Campaigns
Intro video
16July 28, 2021 Second Quarter 2021 Financial Review and Analysis
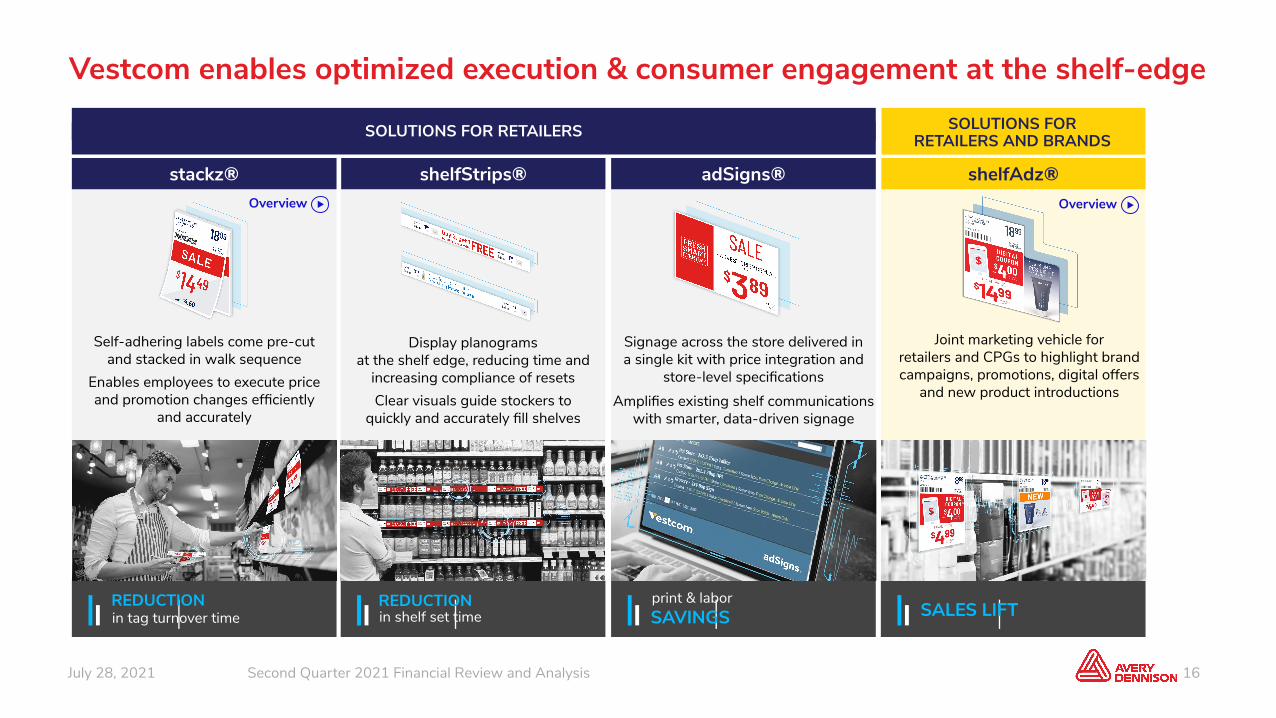
Signage across the store delivered in a single kit with price integration and
store-level specificationsAmplifies existing shelf communications
with smarter, data-driven signage
Display planograms at the shelf edge, reducing time and
increasing compliance of resetsClear visuals guide stockers to
quickly and accurately fill shelves
Self-adhering labels come pre-cut and stacked in walk sequence
Enables employees to execute price and promotion changes efficiently
and accurately
Joint marketing vehicle for retailers and CPGs to highlight brand campaigns, promotions, digital offers
and new product introductions
adSigns®shelfStrips®stackz® shelfAdz®
in tag turnover timeREDUCTION
in shelf set timeREDUCTION SALES LIFT
print & laborSAVINGS
SOLUTIONS FOR RETAILERS SOLUTIONS FOR RETAILERS AND BRANDS
Overview Overview
Vestcom enables optimized execution & consumer engagement at the shelf-edge
17July 28, 2021 Second Quarter 2021 Financial Review and Analysis
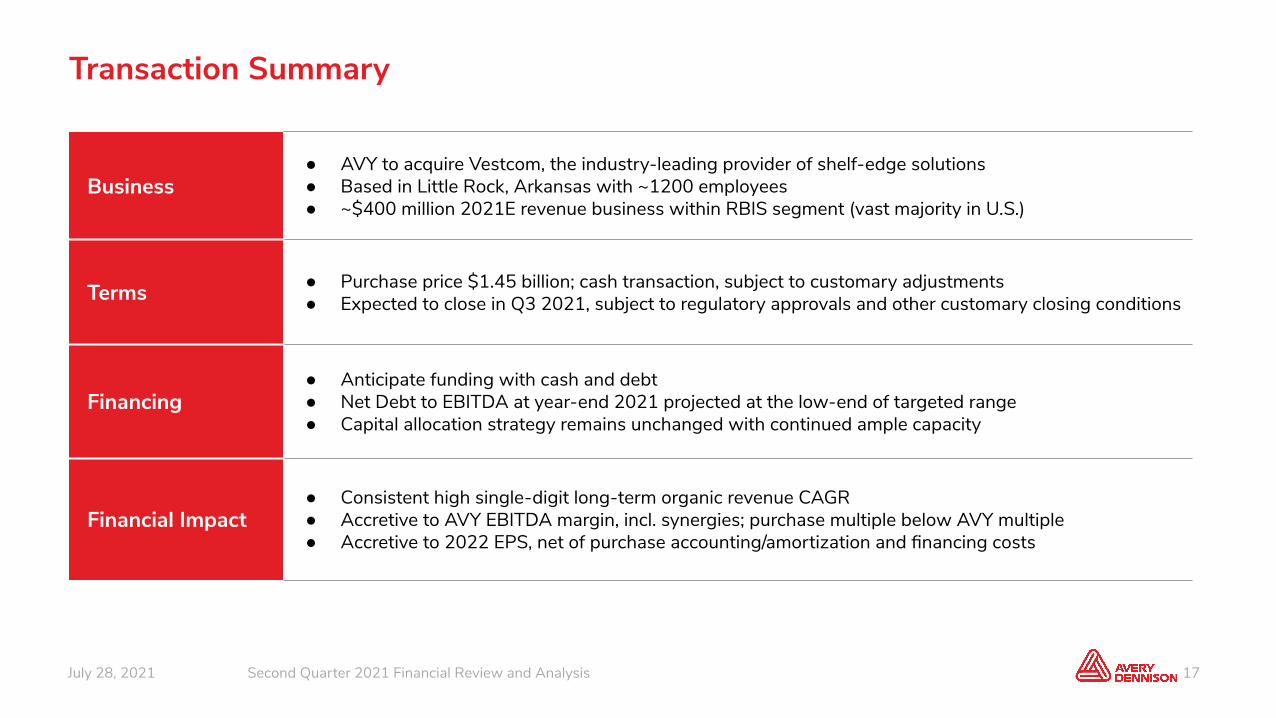
Transaction Summary
Business● AVY to acquire Vestcom, the industry-leading provider of shelf-edge solutions● Based in Little Rock, Arkansas with ~1200 employees● ~$400 million 2021E revenue business within RBIS segment (vast majority in U.S.)
Terms ● Purchase price $1.45 billion; cash transaction, subject to customary adjustments● Expected to close in Q3 2021, subject to regulatory approvals and other customary closing conditions
Financing● Anticipate funding with cash and debt● Net Debt to EBITDA at year-end 2021 projected at the low-end of targeted range● Capital allocation strategy remains unchanged with continued ample capacity
Financial Impact● Consistent high single-digit long-term organic revenue CAGR● Accretive to AVY EBITDA margin, incl. synergies; purchase multiple below AVY multiple● Accretive to 2022 EPS, net of purchase accounting/amortization and financing costs

18July 28, 2021 Second Quarter 2021 Financial Review and Analysis© 2020 Avery Dennison Corporation. All rights reserved. Avery Dennison and all other Avery Dennison brands, product names and codes are trademarks of Avery Dennison Corporation. All other brands or product names are trademarks of their respective owners. Fortune 500® is a trademark of Time, Inc. Branding and other information on any samples depicted is fictitious. Any resemblance to actual names is purely coincidental.
Thank you