Embed Size (px)
Citation preview

SECOND QUARTER 2021 FINANCIAL RESULTS
July 29, 2021
Copyrights © 2021 Garrett Motion Inc.
Forward Looking Statements This presentation contains “forward-looking statements” within the meaning of Section 21E of the Securities Exchange Act of 1934 , as amended. All
statements, other than statements of fact, that address activities, events or developments that we or our management intend, expect, project, believe or
anticipate will or may occur in the future are forward-looking statements including without limitation our statements regarding the impact of the COVID-19
pandemic on Garrett’s business, financial results and financial conditions, industry trends, Garrett’s strategy, and Garrett’s capital structure following
emergence from the Chapter 11 process. Although we believe forward-looking statements are based upon reasonable assumptions, such statements
involve known and unknown risks, uncertainties, and other factors, which may cause the actual results or performance of Garre tt to be materially
different from any future results or performance expressed or implied by such forward-looking statements. Such risks and uncertainties include but are
not limited to those described in our annual report on Form 10-K for the year ended December 31, 2020, and our quarterly report on Form 10-Q for the
three months ended June 30, 2021, as well as our other filings with the Securities and Exchange Commission, under the headings “Risk Factors” and
“Cautionary Note Regarding Forward-Looking Statements.” You are cautioned not to place undue reliance on these forward-looking statements, which
speak only as of the date of this document. Forward-looking statements are not guarantees of future performance, and actual results, developments and
business decisions may differ from those envisaged by our forward-looking statements.
Non-GAAP Financial Measures This presentation includes the following Non-GAAP financial measures which are not calculated in accordance with generally accepted accounting
principles in the United States (“GAAP”): constant currency sales growth, Adjusted Net Income, EBITDA, Adjusted EBITDA, Adjus ted EBITDA Margin,
Adjusted Free Cash Flow, Adjusted Free Cash Flow Conversion Rate and Net cash provided by operating activities less Expenditu res for property, plant
and equipment. The Non-GAAP financial measures provided herein are adjusted for certain items as presented in the Appendix conta ining Non-GAAP
Reconciliations and may not be directly comparable to similar measures used by other companies in our industry, as other comp anies may define such
measures differently. Management believes that, when considered together with reported amounts, these measures are useful to investors and
management in understanding our ongoing operations and analysis of ongoing operating trends. Garrett believes that Adjusted E BITDA and Adjusted
EBITDA Margin are important indicators of operating performance because they exclude the effects of income taxes and certain other items, as well as
the effects of financing and investing activities by eliminating the effects of interest and depreciation expenses and therefore more closely measures our
operational performance. These metrics should be considered in addition to, and not as replacements for, the most comparable GAAP measure. For
additional information with respect to our Non-GAAP financial measures, see our annual report on Form 10-K for the year ended December 31, 2020 and
our quarterly report on Form 10-Q for the period ended June 30, 2021.
Copyrights © 2021 Garrett Motion Inc.
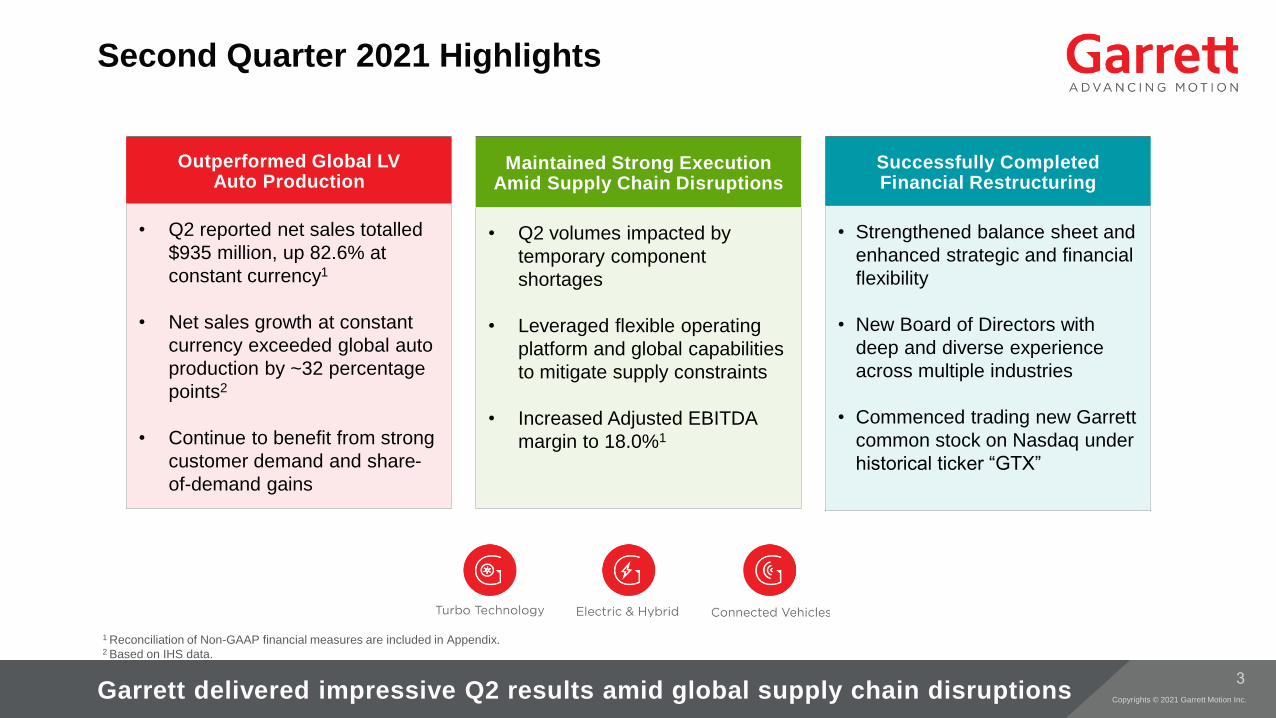
Second Quarter 2021 Highlights
Garrett delivered impressive Q2 results amid global supply chain disruptions
Maintained Strong Execution Amid Supply Chain Disruptions
• Q2 volumes impacted by
temporary component
shortages
• Leveraged flexible operating
platform and global capabilities
to mitigate supply constraints
• Increased Adjusted EBITDA
margin to 18.0%1
Successfully Completed Financial Restructuring
• Strengthened balance sheet and
enhanced strategic and financial
flexibility
• New Board of Directors with
deep and diverse experience
across multiple industries
• Commenced trading new Garrett
common stock on Nasdaq under
historical ticker “GTX”
1 Reconciliation of Non-GAAP financial measures are included in Appendix.2 Based on IHS data.
Outperformed Global LVAuto Production
• Q2 reported net sales totalled
$935 million, up 82.6% at
constant currency1
• Net sales growth at constant
currency exceeded global auto
production by ~32 percentage
points2
• Continue to benefit from strong
customer demand and share-
of-demand gains
Copyrights © 2021 Garrett Motion Inc.
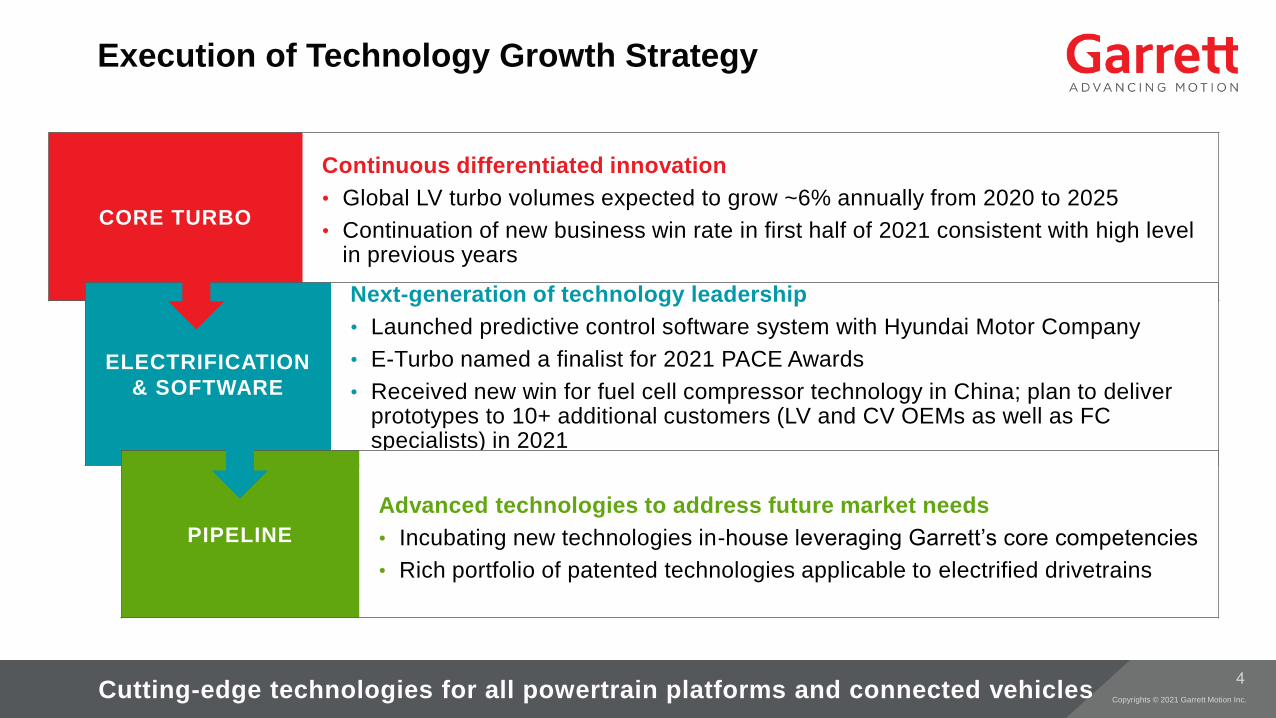
CORE TURBO
Continuous differentiated innovation
• Global LV turbo volumes expected to grow ~6% annually from 2020 to 2025
• Continuation of new business win rate in first half of 2021 consistent with high level in previous years
ELECTRIFICATION
& SOFTWARE
Next-generation of technology leadership
• Launched predictive control software system with Hyundai Motor Company
• E-Turbo named a finalist for 2021 PACE Awards
• Received new win for fuel cell compressor technology in China; plan to deliver prototypes to 10+ additional customers (LV and CV OEMs as well as FC specialists) in 2021
PIPELINE
Advanced technologies to address future market needs
• Incubating new technologies in-house leveraging Garrett’s core competencies
• Rich portfolio of patented technologies applicable to electrified drivetrains
Execution of Technology Growth Strategy
Cutting-edge technologies for all powertrain platforms and connected vehicles
Copyrights © 2021 Garrett Motion Inc.
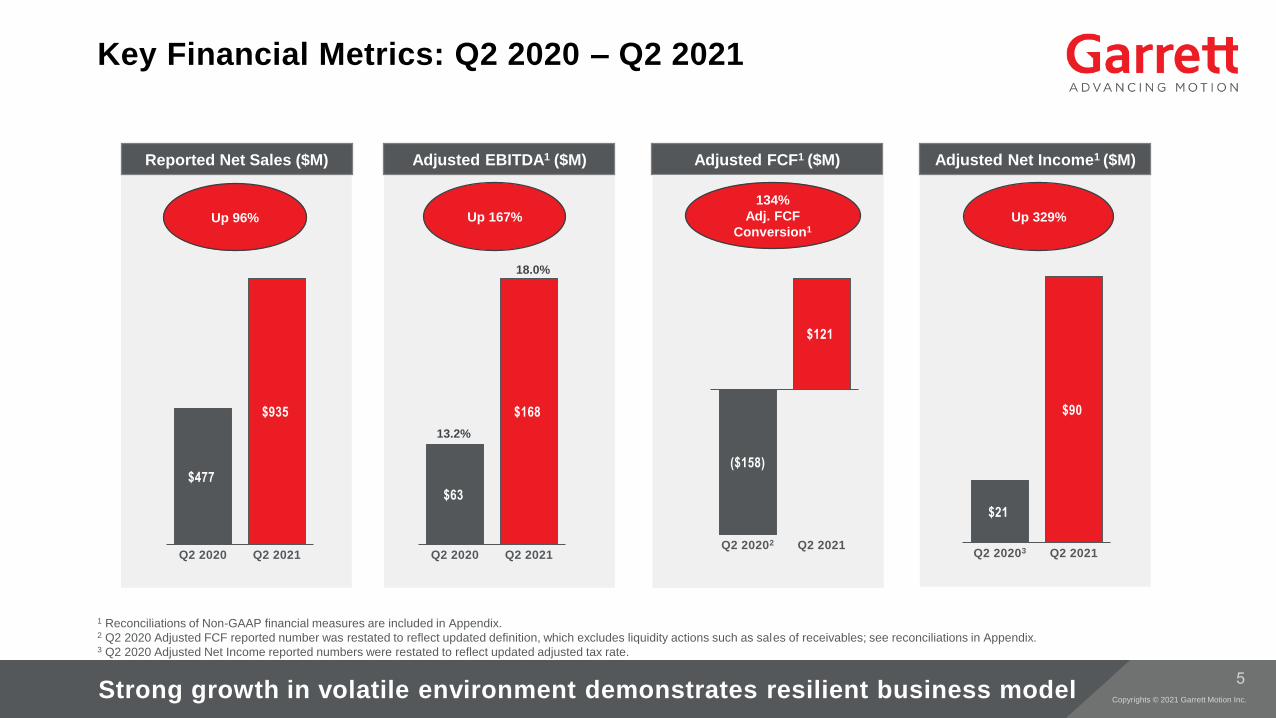
$477
$935
Q2 2020 Q2 2021
$63
$168
Q2 2020 Q2 2021
$21
$90
Q2 20203 Q2 2021
18.0%
13.2%
99%
Conversion Up 329%Up 167%
Reported Net Sales ($M) Adjusted EBITDA1 ($M) Adjusted FCF1 ($M) Adjusted Net Income1 ($M)
($158)
$121
Q2 20202 Q2 2021
134%
Adj. FCF
Conversion1Up 96%
1 Reconciliations of Non-GAAP financial measures are included in Appendix.2 Q2 2020 Adjusted FCF reported number was restated to reflect updated definition, which excludes liquidity actions such as sales of receivables; see reconciliations in Appendix.3 Q2 2020 Adjusted Net Income reported numbers were restated to reflect updated adjusted tax rate.
Key Financial Metrics: Q2 2020 – Q2 2021
Strong growth in volatile environment demonstrates resilient business model
Copyrights © 2021 Garrett Motion Inc.
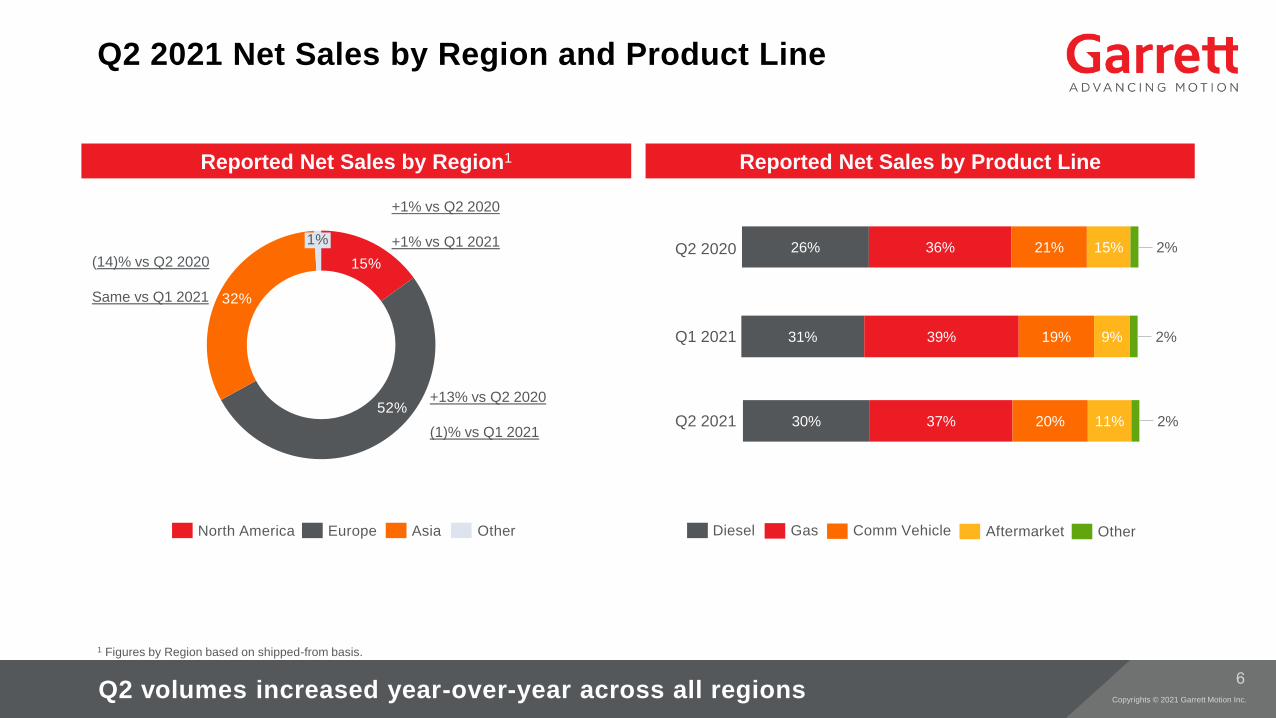
Q2 2021 Net Sales by Region and Product Line
Reported Net Sales by Product LineReported Net Sales by Region1
1 Figures by Region based on shipped-from basis.
15%
52%
32%
1%
+13% vs Q2 2020
(1)% vs Q1 2021
AsiaNorth America OtherEurope Diesel OtherAftermarketComm VehicleGas
Q2 2021
Q2 volumes increased year-over-year across all regions
26% 36% 21% 15% 2%
+1% vs Q2 2020
+1% vs Q1 2021
(14)% vs Q2 2020
Same vs Q1 2021
30% 37% 20% 11% 2%
31% 39% 19% 9% 2%Q1 2021
Q2 2020
Copyrights © 2021 Garrett Motion Inc.
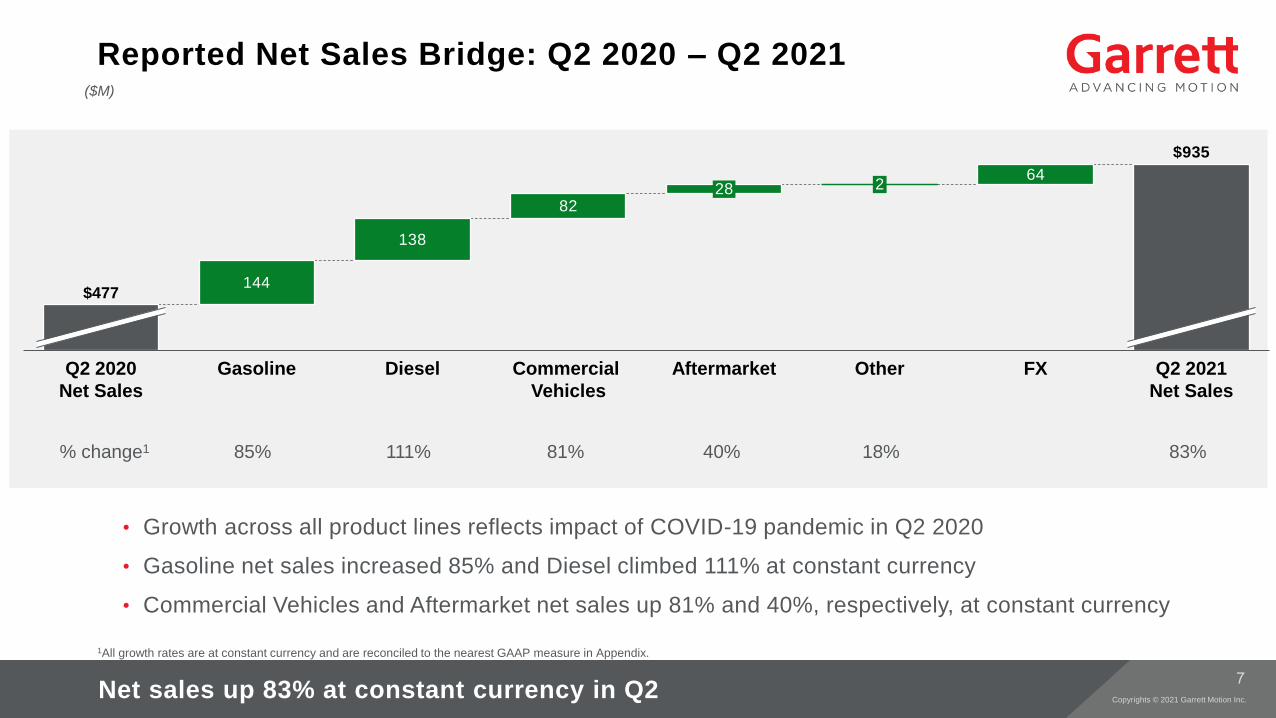
Reported Net Sales Bridge: Q2 2020 – Q2 2021
1All growth rates are at constant currency and are reconciled to the nearest GAAP measure in Appendix.
($M)
144
138
82
64
GasolineQ2 2020
Net Sales
Diesel
$477
Commercial
Vehicles
28
Aftermarket
2
Other FX Q2 2021
Net Sales
$935
% change1 85% 111% 81% 40% 18% 83%
• Growth across all product lines reflects impact of COVID-19 pandemic in Q2 2020
• Gasoline net sales increased 85% and Diesel climbed 111% at constant currency
• Commercial Vehicles and Aftermarket net sales up 81% and 40%, respectively, at constant currency
Net sales up 83% at constant currency in Q2
Copyrights © 2021 Garrett Motion Inc.
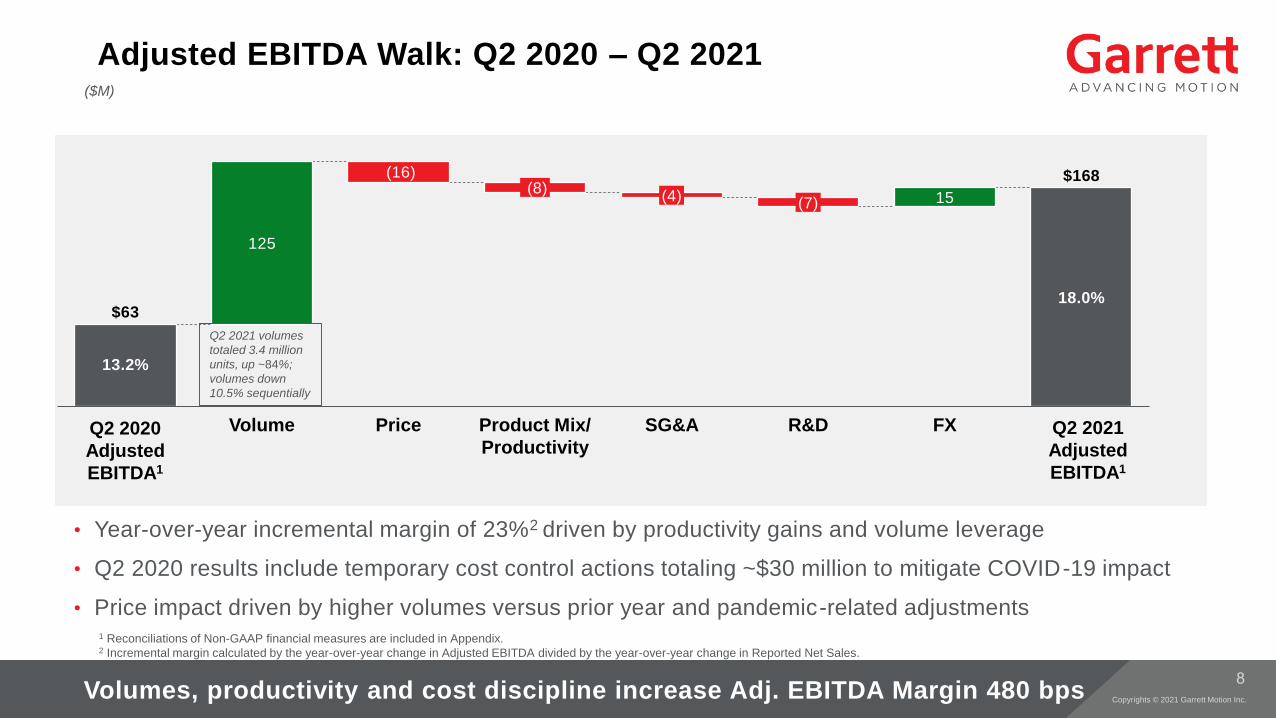
($M)
Adjusted EBITDA Walk: Q2 2020 – Q2 2021
125
(16)
15 (7)
13.2%
PriceVolume SG&AProduct Mix/
Productivity
(4)
R&D FX
18.0%$63
$168(8)
Q2 2020
Adjusted
EBITDA1
Q2 2021
Adjusted
EBITDA1
• Year-over-year incremental margin of 23%2 driven by productivity gains and volume leverage
• Q2 2020 results include temporary cost control actions totaling ~$30 million to mitigate COVID-19 impact
• Price impact driven by higher volumes versus prior year and pandemic-related adjustments
Volumes, productivity and cost discipline increase Adj. EBITDA Margin 480 bps
Q2 2021 volumes
totaled 3.4 million
units, up ~84%;
volumes down
10.5% sequentially
1 Reconciliations of Non-GAAP financial measures are included in Appendix.2 Incremental margin calculated by the year-over-year change in Adjusted EBITDA divided by the year-over-year change in Reported Net Sales.
Copyrights © 2021 Garrett Motion Inc.
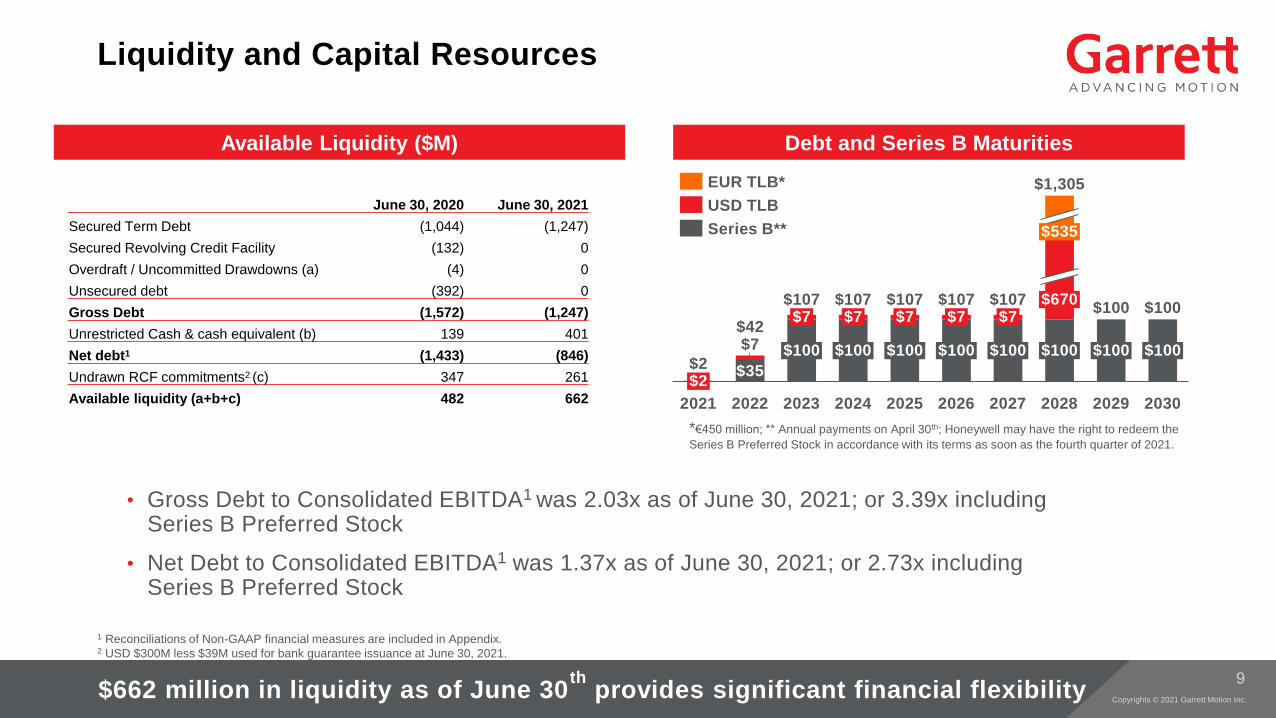
Liquidity and Capital Resources
1 Reconciliations of Non-GAAP financial measures are included in Appendix. 2 USD $300M less $39M used for bank guarantee issuance at June 30, 2021.
Debt and Series B Maturities
June 30, 2020 June 30, 2021
Secured Term Debt (1,044) (1,247)
Secured Revolving Credit Facility (132) 0
Overdraft / Uncommitted Drawdowns (a) (4) 0
Unsecured debt (392) 0
Gross Debt (1,572) (1,247)
Unrestricted Cash & cash equivalent (b) 139 401
Net debt1 (1,433) (846)
Undrawn RCF commitments2 (c) 347 261
Available liquidity (a+b+c) 482 662
$662 million in liquidity as of June 30th
provides significant financial flexibility
Available Liquidity ($M)
$35
$7
2021 2029
$1,305
$100
2030
$7
2022 2023
$7$670
$100 $100
2024
$100
$7
$100
2025
$7
$535
$100
2026
$100
2027
$100$2
$107
$42
$107 $107 $107
2028
$100
$100
$2
$7$107
• Gross Debt to Consolidated EBITDA1 was 2.03x as of June 30, 2021; or 3.39x including Series B Preferred Stock
• Net Debt to Consolidated EBITDA1 was 1.37x as of June 30, 2021; or 2.73x including Series B Preferred Stock
EUR TLB*
USD TLB
Series B**
*€450 million; ** Annual payments on April 30th; Honeywell may have the right to redeem the
Series B Preferred Stock in accordance with its terms as soon as the fourth quarter of 2021.
Copyrights © 2021 Garrett Motion Inc.
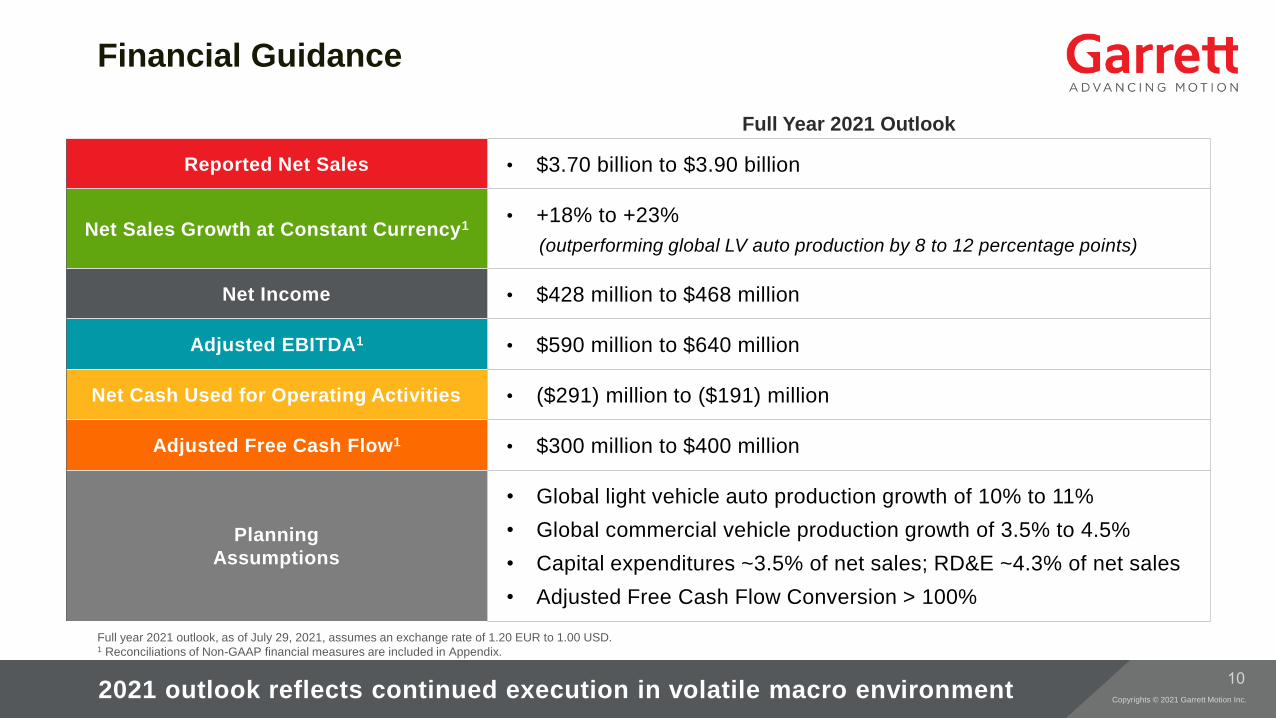
Financial Guidance
Reported Net Sales • $3.70 billion to $3.90 billion
Net Sales Growth at Constant Currency1• +18% to +23%
(outperforming global LV auto production by 8 to 12 percentage points)
Net Income • $428 million to $468 million
Adjusted EBITDA1 • $590 million to $640 million
Net Cash Used for Operating Activities • ($291) million to ($191) million
Adjusted Free Cash Flow1 • $300 million to $400 million
Planning
Assumptions
• Global light vehicle auto production growth of 10% to 11%
• Global commercial vehicle production growth of 3.5% to 4.5%
• Capital expenditures ~3.5% of net sales; RD&E ~4.3% of net sales
• Adjusted Free Cash Flow Conversion > 100%
Full Year 2021 Outlook
2021 outlook reflects continued execution in volatile macro environment
Full year 2021 outlook, as of July 29, 2021, assumes an exchange rate of 1.20 EUR to 1.00 USD. 1 Reconciliations of Non-GAAP financial measures are included in Appendix.
Copyrights © 2021 Garrett Motion Inc.
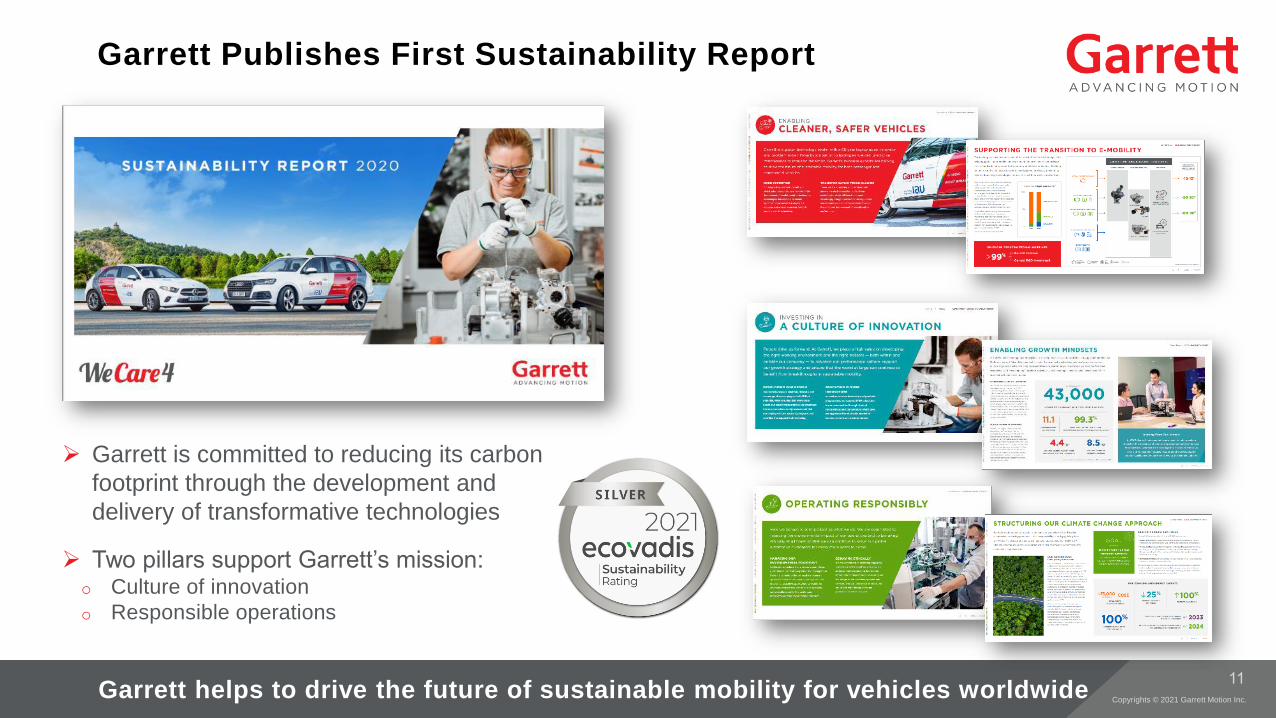
Garrett Publishes First Sustainability Report
➢ Garrett is committed to reducing its carbon
footprint through the development and
delivery of transformative technologies
➢ Two pillars support Garrett’s mission:o Culture of innovation
o Responsible operations
Garrett helps to drive the future of sustainable mobility for vehicles worldwide
Copyrights © 2021 Garrett Motion Inc.
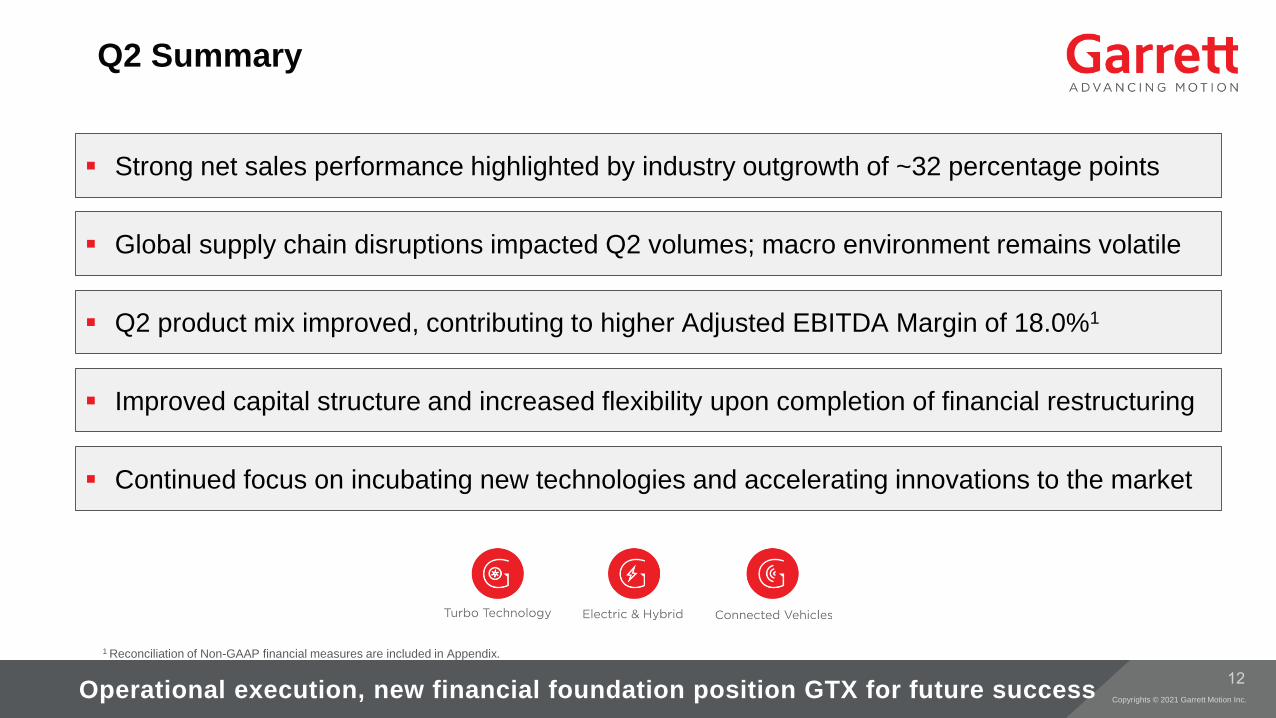
Q2 Summary
▪ Global supply chain disruptions impacted Q2 volumes; macro environment remains volatile
▪ Improved capital structure and increased flexibility upon completion of financial restructuring
▪ Strong net sales performance highlighted by industry outgrowth of ~32 percentage points
▪ Q2 product mix improved, contributing to higher Adjusted EBITDA Margin of 18.0%1
▪ Continued focus on incubating new technologies and accelerating innovations to the market
Operational execution, new financial foundation position GTX for future success
1 Reconciliation of Non-GAAP financial measures are included in Appendix.
Appendices
Copyrights © 2021 Garrett Motion Inc.
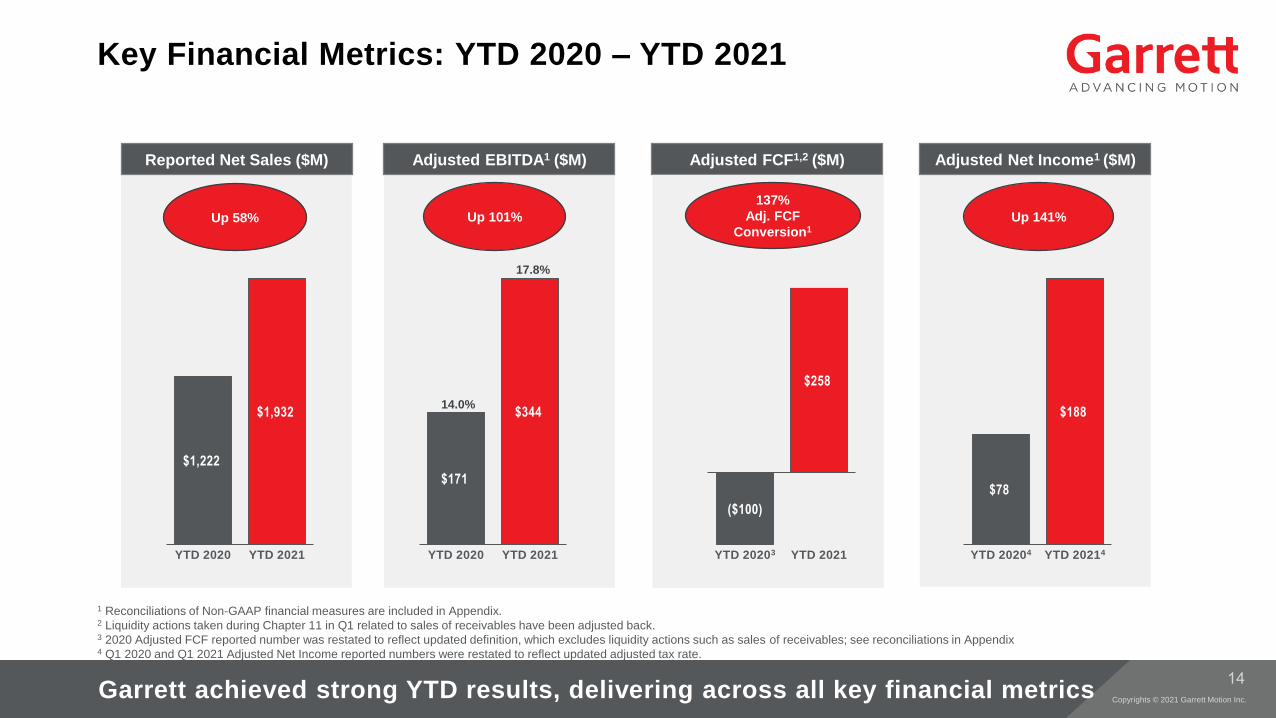
$1,222
$1,932
YTD 2020 YTD 2021
$171
$344
YTD 2020 YTD 2021
$78
$188
YTD 20204 YTD 20214
17.8%
14.0%
99%
Conversion Up 141%Up 101%
Reported Net Sales ($M) Adjusted EBITDA1 ($M) Adjusted FCF1,2 ($M) Adjusted Net Income1 ($M)
($100)
$258
YTD 20203 YTD 2021
137%
Adj. FCF
Conversion1Up 58%
1 Reconciliations of Non-GAAP financial measures are included in Appendix.2 Liquidity actions taken during Chapter 11 in Q1 related to sales of receivables have been adjusted back. 3 2020 Adjusted FCF reported number was restated to reflect updated definition, which excludes liquidity actions such as sales of receivables; see reconciliations in Appendix 4 Q1 2020 and Q1 2021 Adjusted Net Income reported numbers were restated to reflect updated adjusted tax rate.
Garrett achieved strong YTD results, delivering across all key financial metrics
Key Financial Metrics: YTD 2020 – YTD 2021
Copyrights © 2021 Garrett Motion Inc.
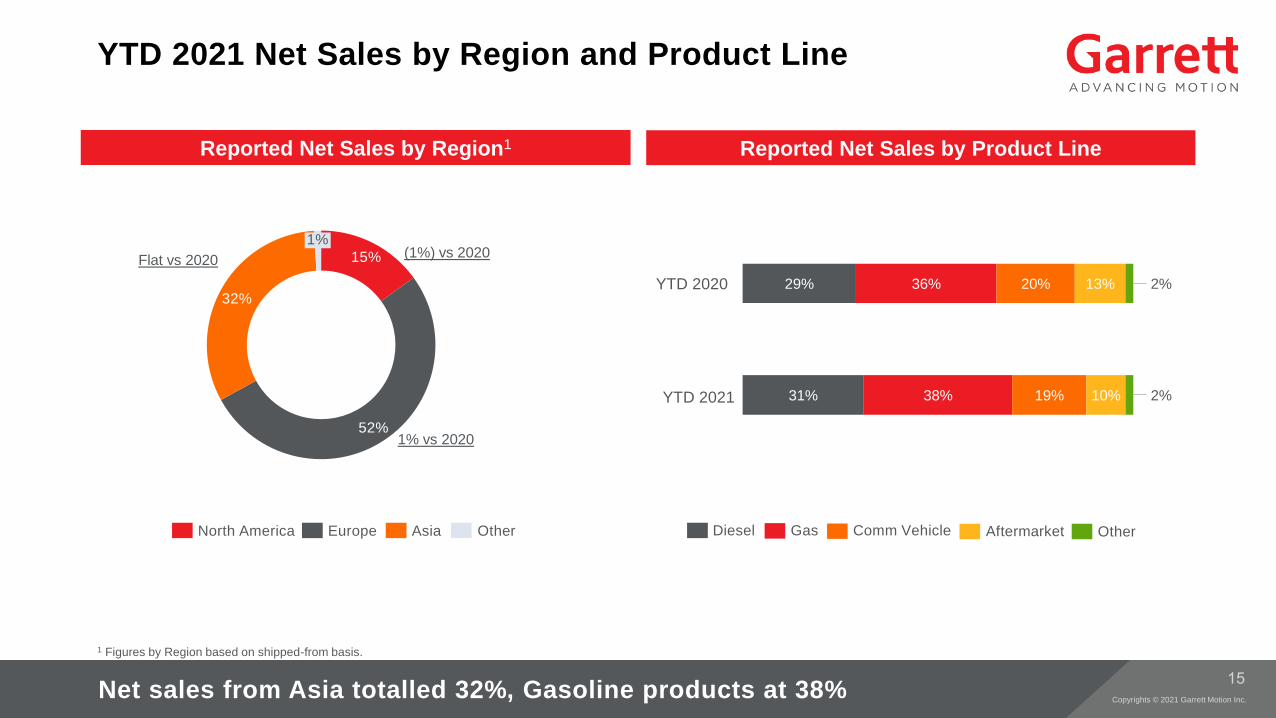
YTD 2021 Net Sales by Region and Product Line
Reported Net Sales by Product LineReported Net Sales by Region1
31% 38% 19% 10% 2%
1 Figures by Region based on shipped-from basis.
15%
52%
32%
1%(1%) vs 2020
1% vs 2020
Flat vs 2020
AsiaNorth America OtherEurope Diesel OtherAftermarketComm VehicleGas
YTD 2020
YTD 2021
29% 36% 20% 13% 2%
Net sales from Asia totalled 32%, Gasoline products at 38%
Copyrights © 2021 Garrett Motion Inc.
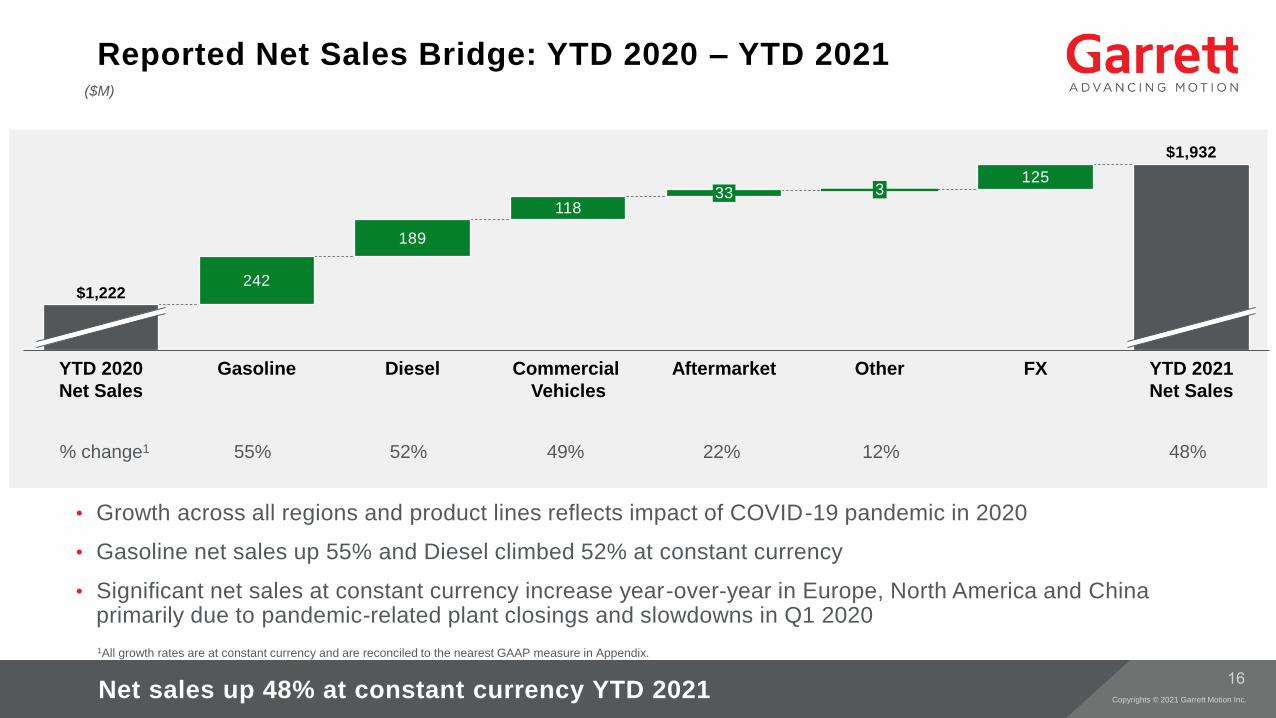
Reported Net Sales Bridge: YTD 2020 – YTD 2021
1All growth rates are at constant currency and are reconciled to the nearest GAAP measure in Appendix.
($M)
242
189
118
125
AftermarketYTD 2020
Net Sales
Gasoline Diesel Commercial
Vehicles
33 3
Other
$1,932
FX YTD 2021
Net Sales
$1,222
% change1 55% 52% 49% 22% 12% 48%
• Growth across all regions and product lines reflects impact of COVID-19 pandemic in 2020
• Gasoline net sales up 55% and Diesel climbed 52% at constant currency
• Significant net sales at constant currency increase year-over-year in Europe, North America and China primarily due to pandemic-related plant closings and slowdowns in Q1 2020
Net sales up 48% at constant currency YTD 2021
Copyrights © 2021 Garrett Motion Inc.
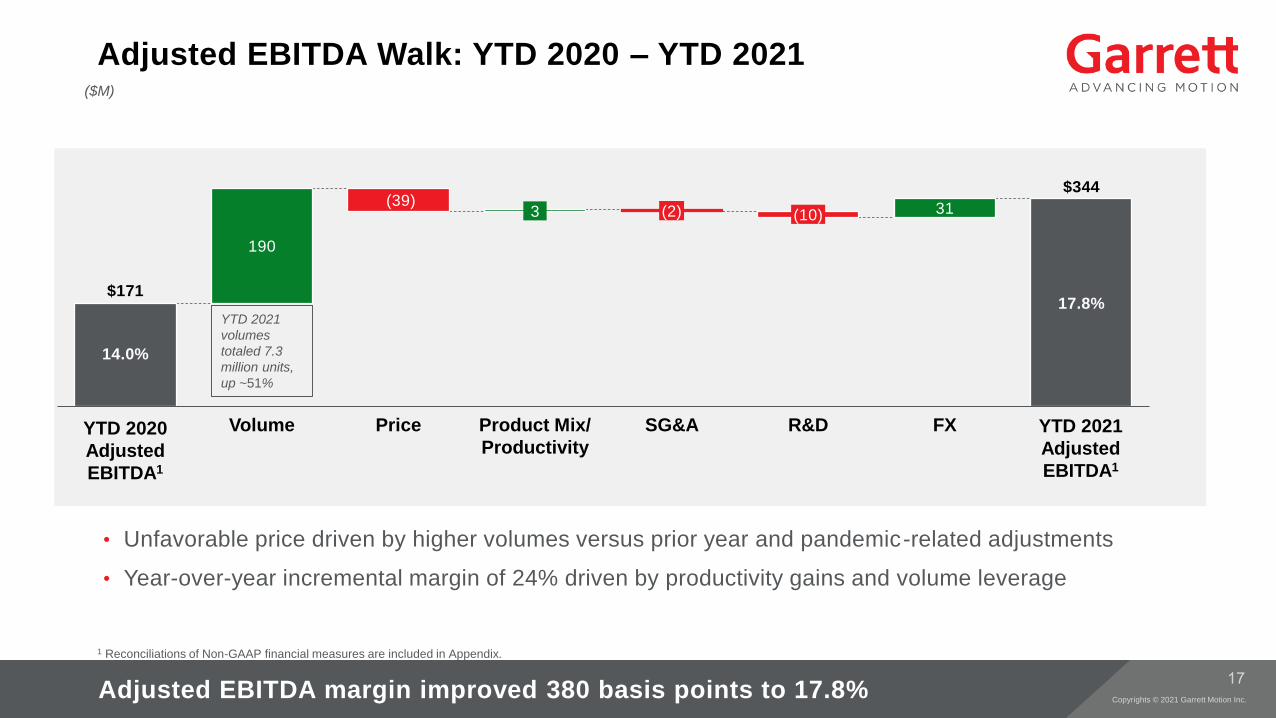
($M)
Adjusted EBITDA Walk: YTD 2020 – YTD 2021
190
(39)31 (10)
14.0%
Product Mix/
Productivity
Volume SG&APrice
3 (2)
R&D FX
17.8%$171
$344
YTD 2020
Adjusted
EBITDA1
YTD 2021
Adjusted
EBITDA1
• Unfavorable price driven by higher volumes versus prior year and pandemic-related adjustments
• Year-over-year incremental margin of 24% driven by productivity gains and volume leverage
Adjusted EBITDA margin improved 380 basis points to 17.8%
YTD 2021
volumes
totaled 7.3
million units,
up ~51%
1 Reconciliations of Non-GAAP financial measures are included in Appendix.
Copyrights © 2021 Garrett Motion Inc.
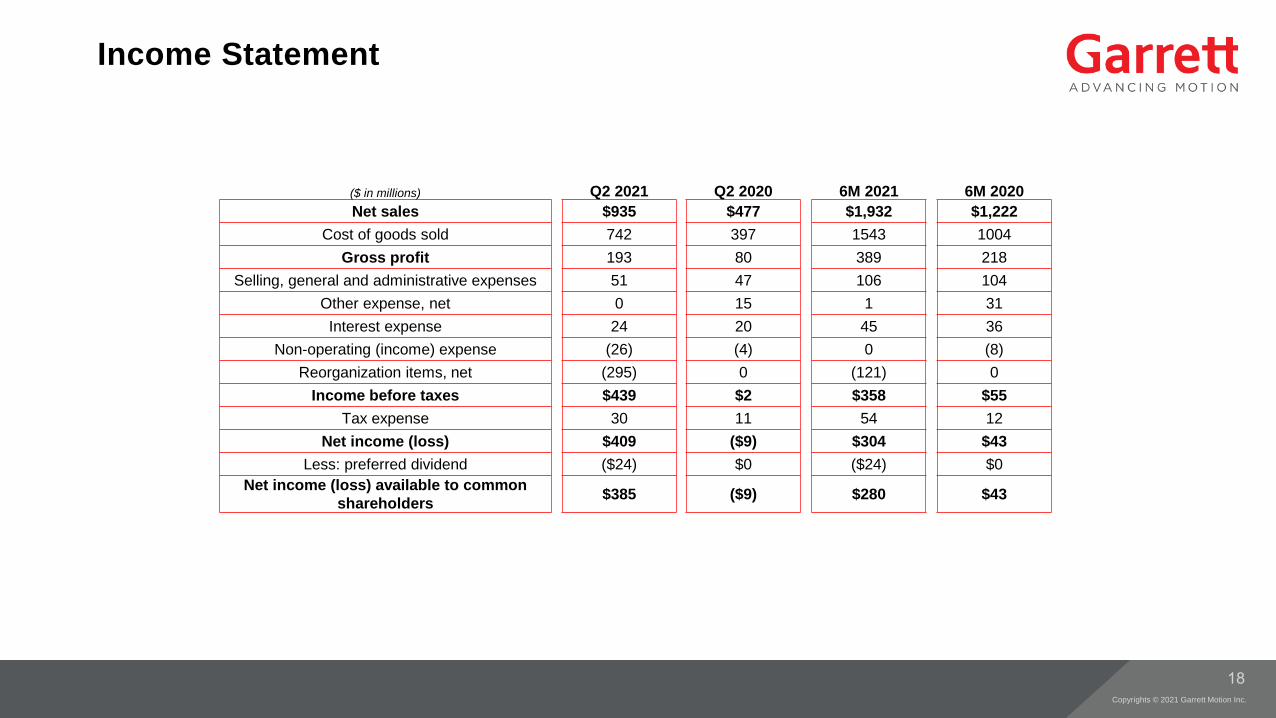
Income Statement
($ in millions) Q2 2021 Q2 2020 6M 2021 6M 2020
Net sales $935 $477 $1,932 $1,222
Cost of goods sold 742 397 1543 1004
Gross profit 193 80 389 218
Selling, general and administrative expenses 51 47 106 104
Other expense, net 0 15 1 31
Interest expense 24 20 45 36
Non-operating (income) expense (26) (4) 0 (8)
Reorganization items, net (295) 0 (121) 0
Income before taxes $439 $2 $358 $55
Tax expense 30 11 54 12
Net income (loss) $409 ($9) $304 $43
Less: preferred dividend ($24) $0 ($24) $0
Net income (loss) available to common
shareholders$385 ($9) $280 $43
Copyrights © 2021 Garrett Motion Inc.
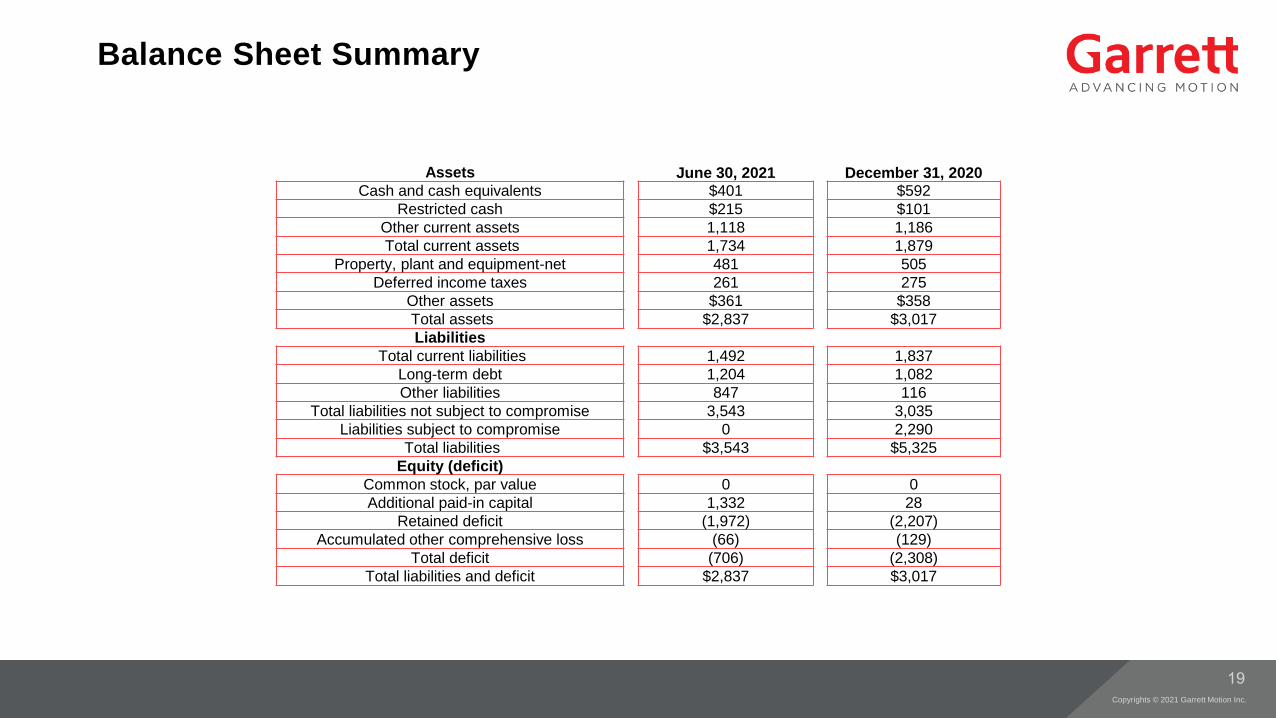
Balance Sheet Summary
Assets June 30, 2021 December 31, 2020Cash and cash equivalents $401 $592
Restricted cash $215 $101
Other current assets 1,118 1,186
Total current assets 1,734 1,879
Property, plant and equipment-net 481 505
Deferred income taxes 261 275
Other assets $361 $358
Total assets $2,837 $3,017
Liabilities
Total current liabilities 1,492 1,837
Long-term debt 1,204 1,082
Other liabilities 847 116
Total liabilities not subject to compromise 3,543 3,035
Liabilities subject to compromise 0 2,290
Total liabilities $3,543 $5,325
Equity (deficit)
Common stock, par value 0 0
Additional paid-in capital 1,332 28
Retained deficit (1,972) (2,207)
Accumulated other comprehensive loss (66) (129)
Total deficit (706) (2,308)
Total liabilities and deficit $2,837 $3,017
Copyrights © 2021 Garrett Motion Inc.
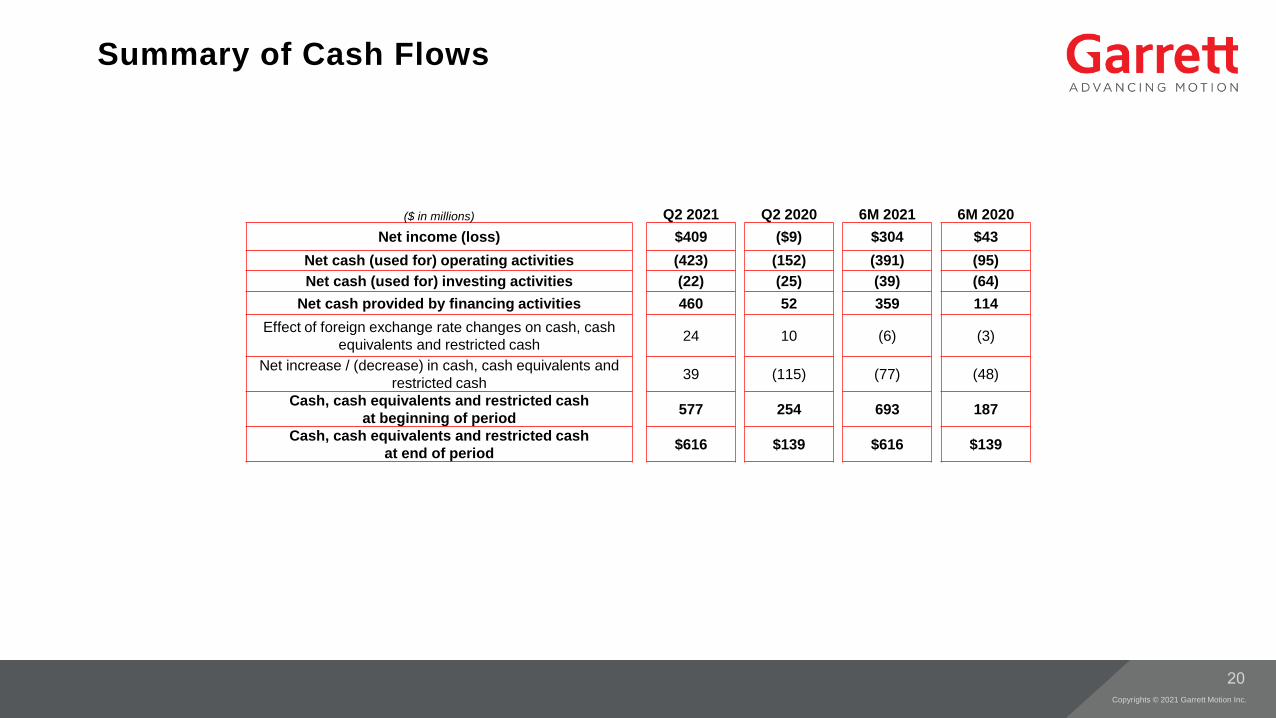
Summary of Cash Flows
($ in millions) Q2 2021 Q2 2020 6M 2021 6M 2020
Net income (loss) $409 ($9) $304 $43
Net cash (used for) operating activities (423) (152) (391) (95)
Net cash (used for) investing activities (22) (25) (39) (64)
Net cash provided by financing activities 460 52 359 114
Effect of foreign exchange rate changes on cash, cash
equivalents and restricted cash24 10 (6) (3)
Net increase / (decrease) in cash, cash equivalents and
restricted cash39 (115) (77) (48)
Cash, cash equivalents and restricted cash
at beginning of period577 254 693 187
Cash, cash equivalents and restricted cash
at end of period$616 $139 $616 $139
Copyrights © 2021 Garrett Motion Inc.
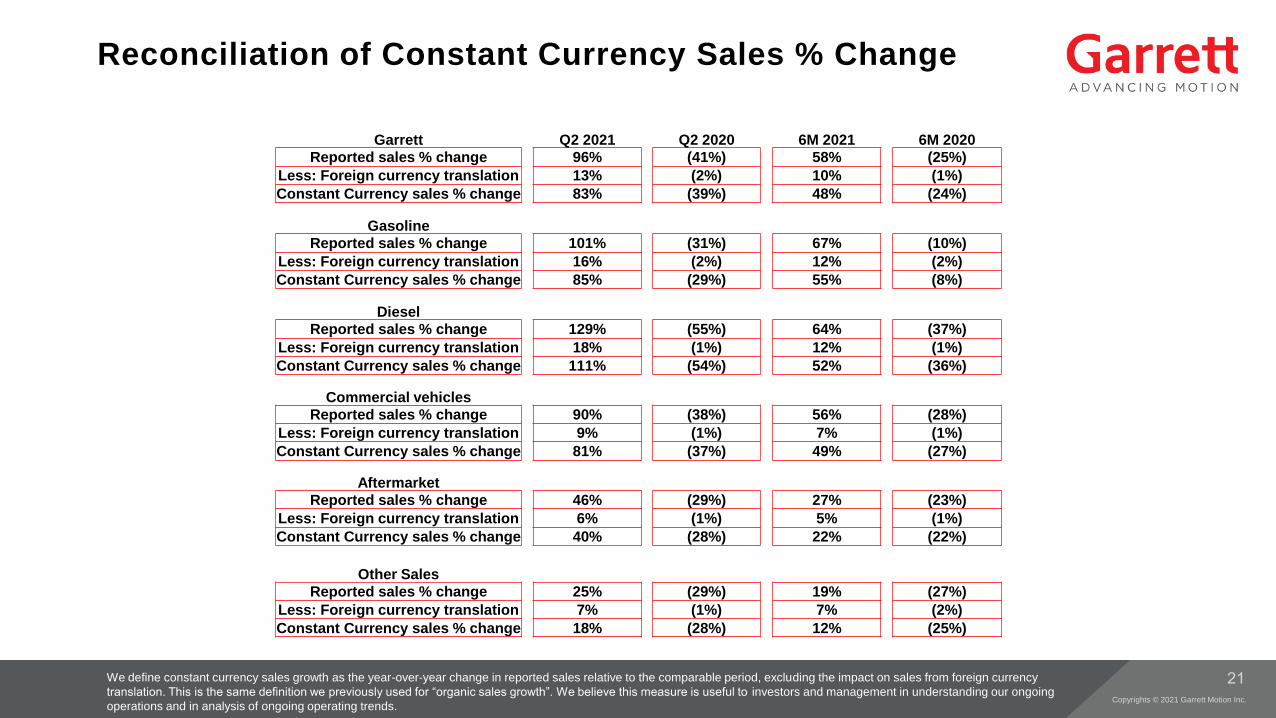
Reconciliation of Constant Currency Sales % Change
We define constant currency sales growth as the year-over-year change in reported sales relative to the comparable period, excluding the impact on sales from foreign currency
translation. This is the same definition we previously used for “organic sales growth”. We believe this measure is useful to investors and management in understanding our ongoing
operations and in analysis of ongoing operating trends.
Garrett Q2 2021 Q2 2020 6M 2021 6M 2020
Reported sales % change 96% (41%) 58% (25%)
Less: Foreign currency translation 13% (2%) 10% (1%)
Constant Currency sales % change 83% (39%) 48% (24%)
Gasoline
Reported sales % change 101% (31%) 67% (10%)
Less: Foreign currency translation 16% (2%) 12% (2%)
Constant Currency sales % change 85% (29%) 55% (8%)
Diesel
Reported sales % change 129% (55%) 64% (37%)
Less: Foreign currency translation 18% (1%) 12% (1%)
Constant Currency sales % change 111% (54%) 52% (36%)
Commercial vehicles
Reported sales % change 90% (38%) 56% (28%)
Less: Foreign currency translation 9% (1%) 7% (1%)
Constant Currency sales % change 81% (37%) 49% (27%)
Aftermarket
Reported sales % change 46% (29%) 27% (23%)
Less: Foreign currency translation 6% (1%) 5% (1%)
Constant Currency sales % change 40% (28%) 22% (22%)
Other Sales
Reported sales % change 25% (29%) 19% (27%)
Less: Foreign currency translation 7% (1%) 7% (2%)
Constant Currency sales % change 18% (28%) 12% (25%)
Copyrights © 2021 Garrett Motion Inc.
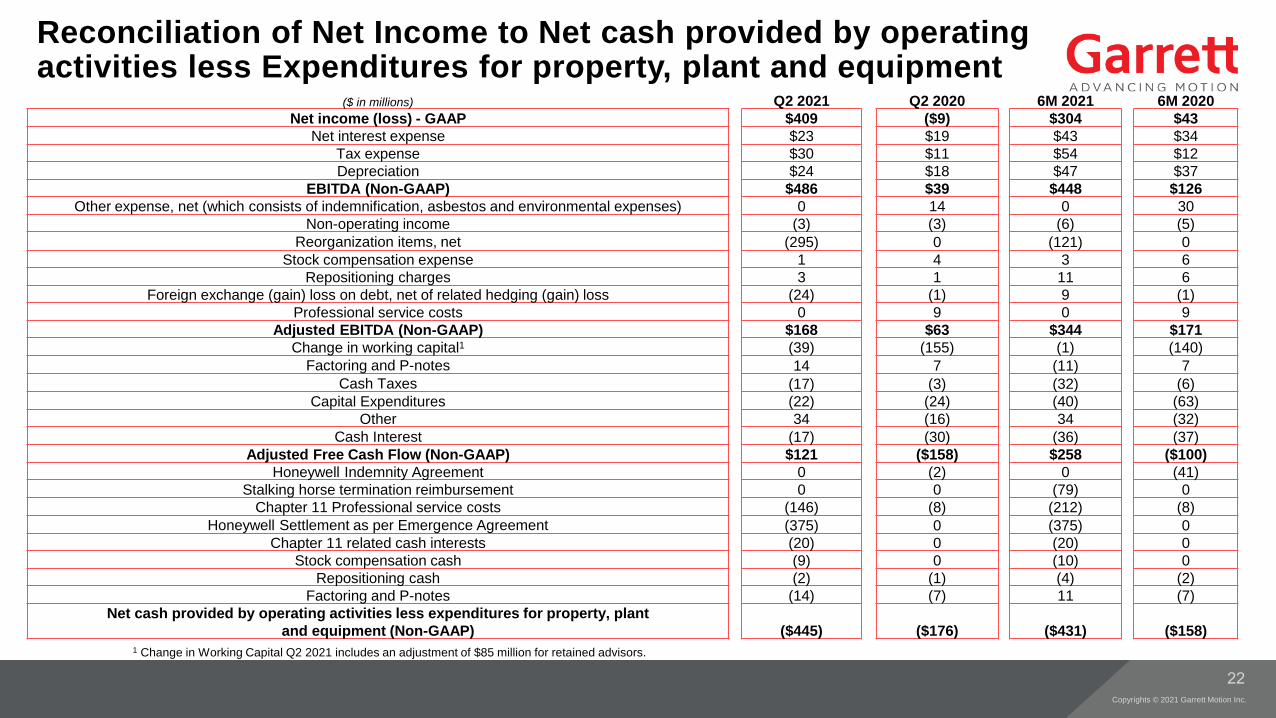
Reconciliation of Net Income to Net cash provided by operating activities less Expenditures for property, plant and equipment
($ in millions) Q2 2021 Q2 2020 6M 2021 6M 2020
Net income (loss) - GAAP $409 ($9) $304 $43
Net interest expense $23 $19 $43 $34
Tax expense $30 $11 $54 $12
Depreciation $24 $18 $47 $37
EBITDA (Non-GAAP) $486 $39 $448 $126
Other expense, net (which consists of indemnification, asbestos and environmental expenses) 0 14 0 30
Non-operating income (3) (3) (6) (5)
Reorganization items, net (295) 0 (121) 0
Stock compensation expense 1 4 3 6
Repositioning charges 3 1 11 6
Foreign exchange (gain) loss on debt, net of related hedging (gain) loss (24) (1) 9 (1)
Professional service costs 0 9 0 9
Adjusted EBITDA (Non-GAAP) $168 $63 $344 $171
Change in working capital1 (39) (155) (1) (140)
Factoring and P-notes 14 7 (11) 7
Cash Taxes (17) (3) (32) (6)
Capital Expenditures (22) (24) (40) (63)
Other 34 (16) 34 (32)
Cash Interest (17) (30) (36) (37)
Adjusted Free Cash Flow (Non-GAAP) $121 ($158) $258 ($100)
Honeywell Indemnity Agreement 0 (2) 0 (41)
Stalking horse termination reimbursement 0 0 (79) 0
Chapter 11 Professional service costs (146) (8) (212) (8)
Honeywell Settlement as per Emergence Agreement (375) 0 (375) 0
Chapter 11 related cash interests (20) 0 (20) 0
Stock compensation cash (9) 0 (10) 0
Repositioning cash (2) (1) (4) (2)
Factoring and P-notes (14) (7) 11 (7)
Net cash provided by operating activities less expenditures for property, plant
and equipment (Non-GAAP) ($445) ($176) ($431) ($158)1 Change in Working Capital Q2 2021 includes an adjustment of $85 million for retained advisors.
Copyrights © 2021 Garrett Motion Inc.
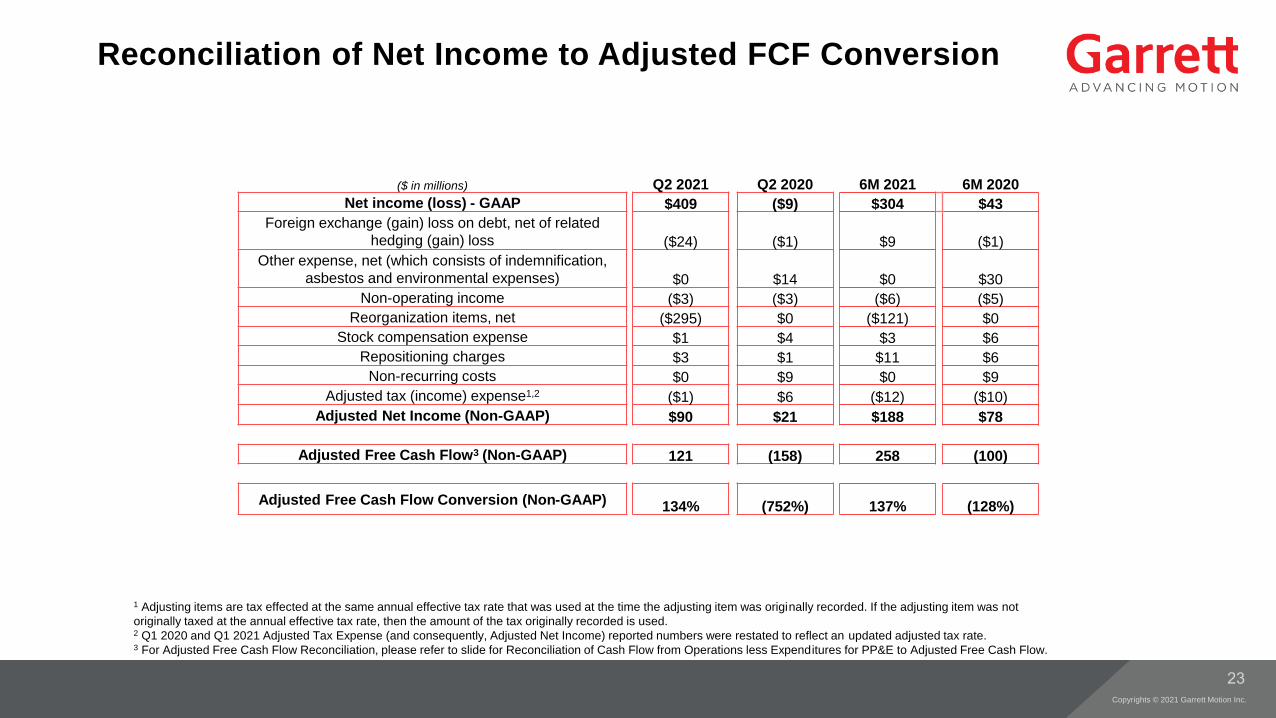
Reconciliation of Net Income to Adjusted FCF Conversion
1 Adjusting items are tax effected at the same annual effective tax rate that was used at the time the adjusting item was originally recorded. If the adjusting item was not
originally taxed at the annual effective tax rate, then the amount of the tax originally recorded is used. 2 Q1 2020 and Q1 2021 Adjusted Tax Expense (and consequently, Adjusted Net Income) reported numbers were restated to reflect an updated adjusted tax rate.3 For Adjusted Free Cash Flow Reconciliation, please refer to slide for Reconciliation of Cash Flow from Operations less Expenditures for PP&E to Adjusted Free Cash Flow.
($ in millions) Q2 2021 Q2 2020 6M 2021 6M 2020
Net income (loss) - GAAP $409 ($9) $304 $43
Foreign exchange (gain) loss on debt, net of related
hedging (gain) loss ($24) ($1) $9 ($1)
Other expense, net (which consists of indemnification,
asbestos and environmental expenses) $0 $14 $0 $30
Non-operating income ($3) ($3) ($6) ($5)
Reorganization items, net ($295) $0 ($121) $0
Stock compensation expense $1 $4 $3 $6
Repositioning charges $3 $1 $11 $6
Non-recurring costs $0 $9 $0 $9
Adjusted tax (income) expense1,2 ($1) $6 ($12) ($10)
Adjusted Net Income (Non-GAAP) $90 $21 $188 $78
Adjusted Free Cash Flow3 (Non-GAAP) 121 (158) 258 (100)
Adjusted Free Cash Flow Conversion (Non-GAAP) 134% (752%) 137% (128%)
Copyrights © 2021 Garrett Motion Inc.
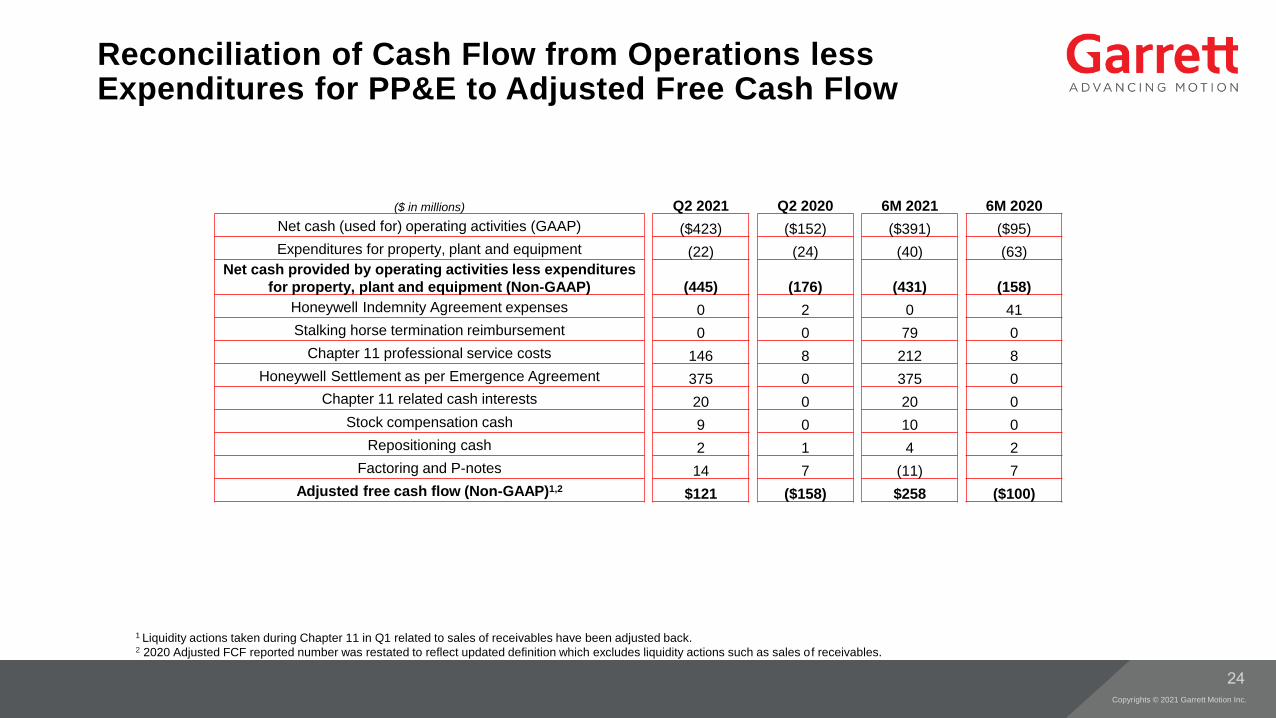
Reconciliation of Cash Flow from Operations less Expenditures for PP&E to Adjusted Free Cash Flow
($ in millions) Q2 2021 Q2 2020 6M 2021 6M 2020
Net cash (used for) operating activities (GAAP) ($423) ($152) ($391) ($95)
Expenditures for property, plant and equipment (22) (24) (40) (63)
Net cash provided by operating activities less expenditures
for property, plant and equipment (Non-GAAP) (445) (176) (431) (158)
Honeywell Indemnity Agreement expenses 0 2 0 41
Stalking horse termination reimbursement 0 0 79 0
Chapter 11 professional service costs 146 8 212 8
Honeywell Settlement as per Emergence Agreement 375 0 375 0
Chapter 11 related cash interests 20 0 20 0
Stock compensation cash 9 0 10 0
Repositioning cash 2 1 4 2
Factoring and P-notes 14 7 (11) 7
Adjusted free cash flow (Non-GAAP)1,2 $121 ($158) $258 ($100)
1 Liquidity actions taken during Chapter 11 in Q1 related to sales of receivables have been adjusted back. 2 2020 Adjusted FCF reported number was restated to reflect updated definition which excludes liquidity actions such as sales of receivables.
Copyrights © 2021 Garrett Motion Inc.
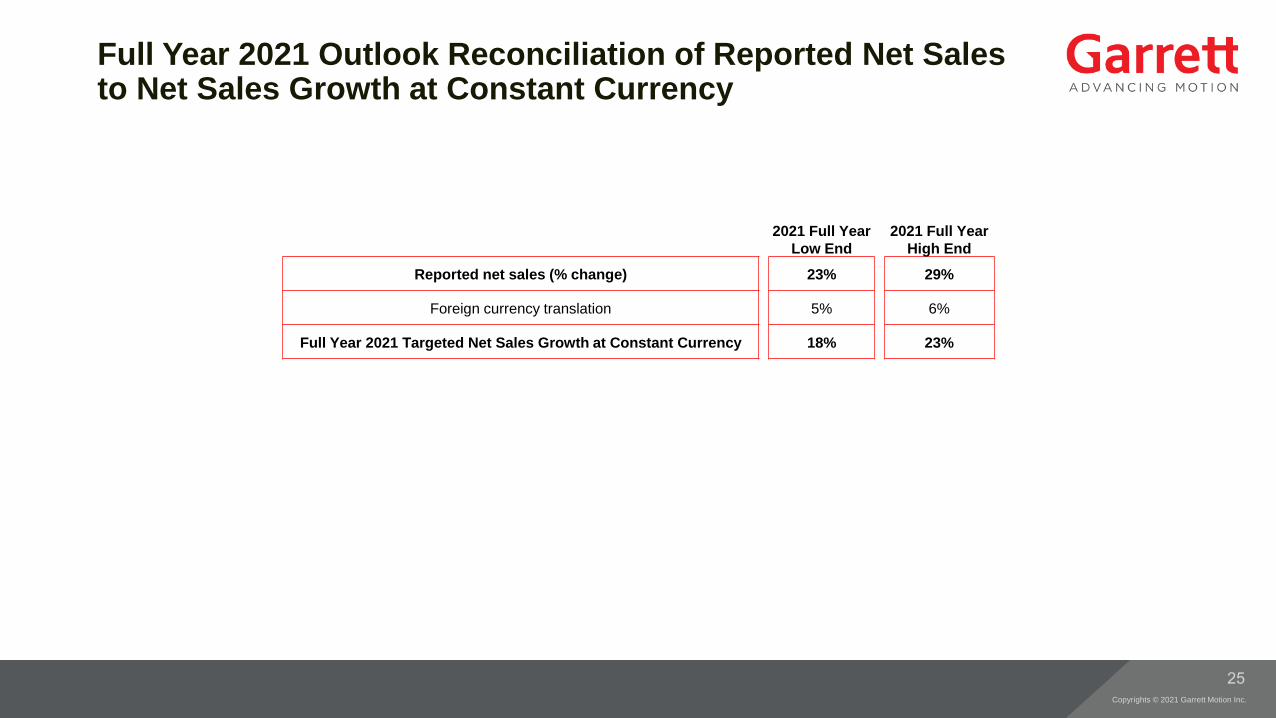
Full Year 2021 Outlook Reconciliation of Reported Net Sales to Net Sales Growth at Constant Currency
2021 Full Year
Low End
2021 Full Year
High End
Reported net sales (% change) 23% 29%
Foreign currency translation 5% 6%
Full Year 2021 Targeted Net Sales Growth at Constant Currency 18% 23%
Copyrights © 2021 Garrett Motion Inc.
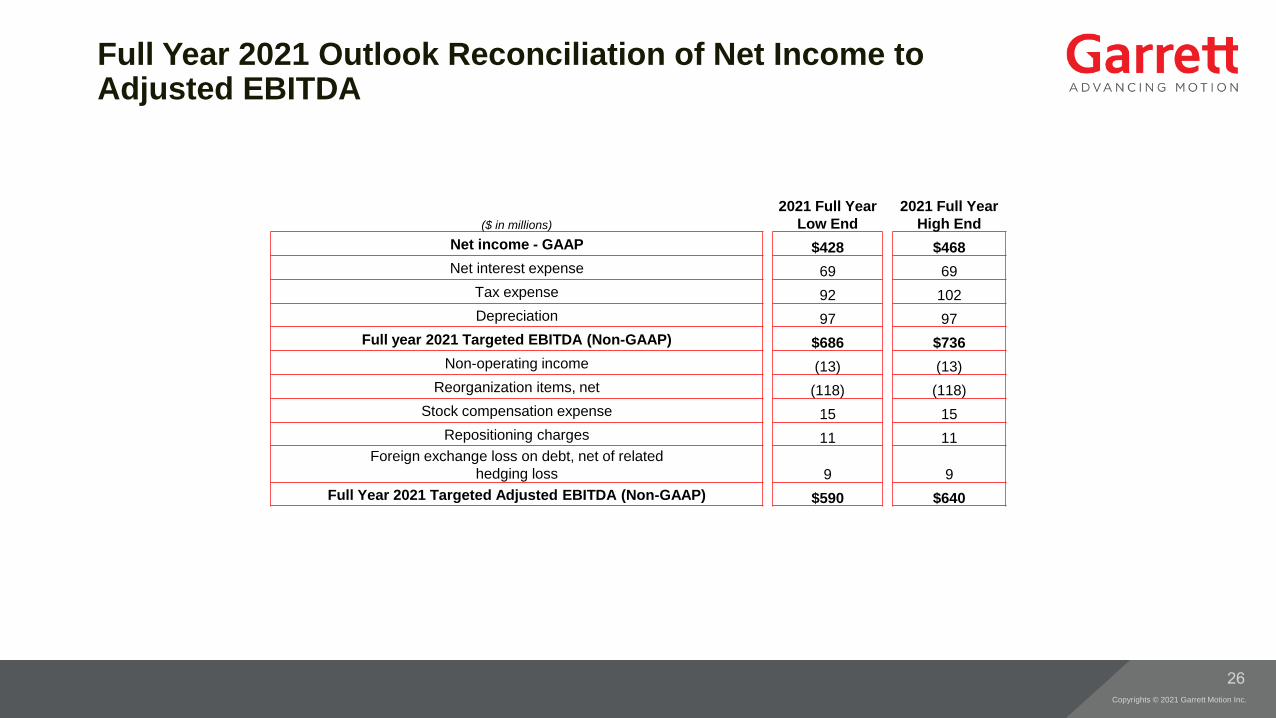
Full Year 2021 Outlook Reconciliation of Net Income to Adjusted EBITDA
($ in millions)
2021 Full Year
Low End
2021 Full Year
High End
Net income - GAAP $428 $468
Net interest expense 69 69
Tax expense 92 102
Depreciation 97 97
Full year 2021 Targeted EBITDA (Non-GAAP) $686 $736
Non-operating income (13) (13)
Reorganization items, net (118) (118)
Stock compensation expense 15 15
Repositioning charges 11 11
Foreign exchange loss on debt, net of related
hedging loss 9 9
Full Year 2021 Targeted Adjusted EBITDA (Non-GAAP) $590 $640
Copyrights © 2021 Garrett Motion Inc.
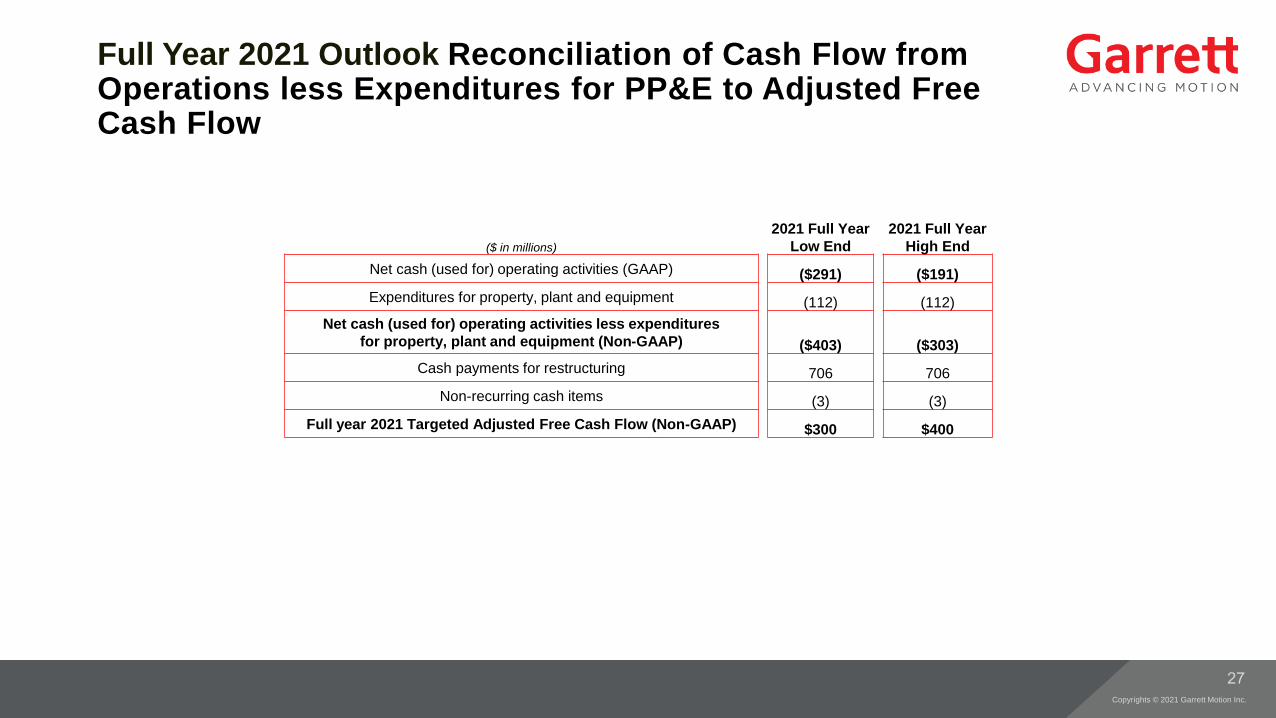
Full Year 2021 Outlook Reconciliation of Cash Flow from Operations less Expenditures for PP&E to Adjusted Free Cash Flow
($ in millions)
2021 Full Year
Low End
2021 Full Year
High End
Net cash (used for) operating activities (GAAP) ($291) ($191)
Expenditures for property, plant and equipment (112) (112)
Net cash (used for) operating activities less expenditures
for property, plant and equipment (Non-GAAP) ($403) ($303)
Cash payments for restructuring 706 706
Non-recurring cash items (3) (3)
Full year 2021 Targeted Adjusted Free Cash Flow (Non-GAAP) $300 $400
Copyrights © 2021 Garrett Motion Inc.