Embed Size (px)
Citation preview

Third Quarter Fiscal Year 2021 Financial Results

© 2
021
Toas
t, In
c. A
ll Ri
ghts
Re
serv
ed.
Disclaimer
2
This presentation includes certain “forward-looking statements" within the meaning of the Private Securities Litigation Reform Act of 1995, including statements regarding the future results of operations, financial condition, business strategy, plans and objectives of management for future operations of Toast, Inc. (“Toast”, “we” or “us”), our market opportunity and the potential growth of that market, our liquidity and capital needs and other similar matters. These forward-looking statements include, but are not limited to, plans, objectives, expectations and intentions and other statements contained in this presentation that are not historical facts and statements identified by words such as “may,” “will,” “should,” "expects," "anticipates," "intends," "plans," “could,” "believes," "seeks," "estimates," “predicts,” “potential,” “continue,” or words of similar meaning. These forward-looking statements reflect management's current expectations and assumption about future events which are inherently subject to uncertainties, risks and changes in circumstances that are difficult to predict. Actual results may differ materially from those described in the forward-looking statements and will be affected by a variety of risks and factors that are beyond our control including, without limitation, risks associated with: our ability to successfully execute our business and growth strategy; our ability to attract new customers, retain revenue from existing customers and increase sales from both new and existing customers; the effect of uncertainties related to the COVID-19 pandemic on our business and the industry; our ability to maintain the security and availability of our platform; the competitive environment in which we operate; our ability to comply with modified or new laws and regulations applying to our business; the increased expenses associated with being a public company; the price volatility of our common stock; and other risks set forth under the caption "Risk Factors" in our prospectus filed pursuant to Rule 424(b) under the Securities Act of 1933, as amended, on September 21, 2021 and our other SEC filings. We assume no obligation to update any forward-looking statements contained in this document as a result of new information, future events or otherwise.
This presentation contains statistical data, estimates and forecasts that are based on independent industry publications or other publicly available information, as well as other information based on our internal sources. This information involves many assumptions and limitations, and you are cautioned not to give undue weight to these estimates. We have not independently verified the accuracy or completeness of the data contained in these industry publications and other publicly available information. Accordingly, we make no representations as to the accuracy or completeness of that data nor do we undertake to update such date after the date of this presentation.
All third-party brand names and logos appearing in this presentation are trademarks or registered trademarks of their respective holders. Any such appearance does not necessarily imply any affiliation with or endorsement of the Company.
GAAP AND NON-GAAP RESULTS
This presentation includes non-GAAP financial measures. These non-GAAP financial measures are in addition to, and not as a substitute for or superior to measures of financial performance prepared in accordance with GAAP. There are a number of limitations related to the use of these non-GAAP financial measures. For example, other companies may calculate similarly-titled non-GAAP financial measures differently. Refer to the Appendix for a reconciliation of these non-GAAP financial measures to the most directly comparable GAAP measures.

© 2
021
Toas
t, In
c. A
ll Ri
ghts
Re
serv
ed.
Our Mission
To empower the restaurant community to delight their guests, do what they love, and thrive.
3

© 2
021
Toas
t, In
c. A
ll Ri
ghts
Re
serv
ed.
Investment Highlights
Purpose-built for restaurants, one of the largest vertical markets
Cloud-based, all-in-one technology platform with integrated payment processing
Experiencing rapid growth at scale
Differentiated and efficient go-to-market engine and customer success strategy
4

© 2
021
Toas
t, In
c. A
ll Ri
ghts
Re
serv
ed.
The Restaurant Industry Is One Of The Largest Industries In U.S. And Globally
11M+Employees in the US4
$700BAnnual U.S. Sales in 2020
(3% of GDP)3
860KLocations in the US1
22MLocations Globally2
5
1 IBISWorld.2 Euromonitor International Consumer Foodservice 2021, Foodservice Value RSP, YoY, ex rates, Current Prices, February 2021.3 National Restaurant Association, 2021 State of the Restaurant Industry, January 2021.4 U.S. Bureau of Labor Statistics, Industries at a Glance, Food Services and Drinking Places, Workforce Statistics, June 2021.

Restaurants are Complex Businesses
© 2
021
Toas
t, In
c. A
ll Ri
ghts
Re
serv
ed.
6
Takeout
Drive Thru
1st & 3rd PartyDelivery
Waitlists
Reservations
Table Management
Point of Sale
Kiosk
Time Clock
Mobile Ordering
Scan to Pay
Inventory
KitchenOperations
SupplierManagement
Reporting &Analytics
AccountingFinancial & Loans
Integrated Payments
Banking Services
Websites
Marketing
Loyalty
Gift Cards
Payroll & HR
Benefits
Scheduling
Insurance
Recruiting

© 2
021
Toas
t, In
c. A
ll Ri
ghts
Re
serv
ed.
The Toast Platform: Better Together
7
Point of Sale RestaurantOperations
Marketing &Loyalty
Digital Ordering& Delivery
Team Management
Integrated Payment Processing Financial Technology Products
Reporting & Analytics API & Partner EcosystemE-commerce
Financial Technology Solutions
Platform Services
Subscription Services

© 2
021
Toas
t, In
c. A
ll Ri
ghts
Re
serv
ed.
Better Together: We Benefit the Entire Restaurant Ecosystem
8
Higher tips, better employee experience
Improved service quality
Lower turnover, improvedoperational efficiency
Improved wage & benefits access
Greater sales,Increased loyalty
Memorable & tailored experiences
Happy Employees
HappyGuests
RestaurantSuccess

© 2
021
Toas
t, In
c. A
ll Ri
ghts
Re
serv
ed.
This Is Just The Beginning For Toast
Sources: U.S. Bureau of Labor Statistics, IBISWorld, National Restaurant Association (2021 State of the Restaurant Industry), Freedonia Group.Note: Global TAM estimate is based on an estimated 22 million restaurant locations globally with greater than $2.6 trillion in revenue (Euromonitor International Consumer Foodservice 2021 - Foodservice Value RSP, YoY ex rates, Current Prices). U.S. TAM estimate reflects the expected U.S. restaurant spend on technology in 2024.1 Payments addressable market estimated by multiplying the estimated non-cash restaurant sales for 2021 by the company's average take rate of 55 basis points measured as a percentage of GPV. Toast Capital market opportunity is estimated by multiplying an estimated $29.5B of outstanding U.S. public bank's restaurant loans as of March 31, 2020 (S&P Global Market Intelligence, US Banks Disclose Exposure to Restaurant Industry Hard-Hit by COVID-19, May 2020), by the average annual rate on small business loans of 1.4% to 7.2% (Federal Reserve Bank of Kansas City, Small Business Lending Survey, June 2021). Business Lending Survey). All subscription services opportunity estimated by multiplying the average annual subscription revenue per location per product by the estimated number of restaurant locations in the U.S.
Massive TAM
9
6%
$110B+Global TAM
$55BUS TAM
$15BSAM1
$0.5BQ3 2021 ARR

© 2
021
Toas
t, In
c. A
ll Ri
ghts
Re
serv
ed.
Our Differentiated Go-To-Market Strategy
Note: New locations from inbound channels include organic, paid, field and referral channels, as of LTM Q3-21.10
• Hyper-localized go-to-market motion
• Focus on building strong customer communities
• Improving sales productivity from increasing category position
• Strong network effect that accelerates growth
Approx. 2/3rdof new locations come through
inbound channels
Over 1/5thof new locations come from other
restaurant / partner referrals

Better Together: We Grow as our Customers Grow
© 2
021
Toas
t, In
c. A
ll Ri
ghts
Re
serv
ed.
11
Full Suite of Toast ProductsContinued Runway for Growth
3 Base Products
15+ Elective Products
Point of SaleToast GoToast Order & PayGuest Kiosk
Restaurant OperationsKitchen Display SystemMulti-Location ManagementInventory ManagementxtraCHEF by Toast
Team ManagementPayroll & Team ManagementPartner-Enabled Products (Insurance & Benefits)
Platform & InsightsReporting & AnalyticsToast Partner Connect & APIs
•Point of Sale •Toast Hardware Payment Processing
Digital Ordering & DeliveryOnline Ordering & Toast TakeOutToast Delivery ServicesToast Delivery Partners
Marketing & LoyaltyEmail MarketingGift CardsLoyalty

Restaurant Data
GuestData
Employee Data
Preparation Time
Menu Item Performance
Sales By ChannelPricing Sensitivity
Loyalty
Ratings & Reviews
Recruiting & Onboarding
Shift Productivity
Demographics
Order History
Labor AnalyticsPayroll
Comparative Reporting
HR & Benefits
Payment Processing
© 2
021
Toas
t, In
c. A
ll Ri
ghts
Re
serv
ed.
12
End-to-End Data Insights Power Innovation
PersonalizationOmnichannel engagement
Data Potential
Employee engagement and retention
Driving Future Innovation
Demand and revenue forecasting
Productivity managementData insights on payroll and benefits
Detailed reporting of expensesThird party ROI
Enhanced guest experience
Supply chain management
SMB financial technology

© 2
021
Toas
t, In
c. A
ll Ri
ghts
Re
serv
ed.
Our Growth Roadmap
Selectivelypursue inorganic growth
Fuel efficient location growth with both new and existing customers
Increaseadoption of our full suite of products
Invest in and expand our product platform
Further develop our partner ecosystem
Expand internationally
13

Third Quarter 2021 Financial Results
© 2021 Toast, Inc. All Rights Reserved.

© 2
021
Toas
t, In
c. A
ll Ri
ghts
Re
serv
ed.
Powerful Business Model
Compelling Unit Economics
Strong Retention Dynamics
Integrated Software and Payments Model
15
Rapid and Sustainable Growth at Scale

Integrated Software and Payments Model
© 2
021
Toas
t, In
c. A
ll Ri
ghts
Re
serv
ed.
16
Hardware
One-Time
Professional Services
Subscription Services Financial Technology Solutions
Recurring
$

ARR, a Core Operational Metric
© 2
021
Toas
t, In
c. A
ll Ri
ghts
Re
serv
ed.
17
Total Revenue
$1,433 MLTM 9/30/2021
Hardware
Annualized Recurring Run-Rate (ARR)
Subscription ARR
Payments ARR
$544 M as of 9/30/2021
Subscription Services
Financial Technology Solutions
COGS
Gross Profit
Financial Technology Solutions
Professional Services
Note: ARR for last twelve months ended 9/30/2021 derived in part based on historical figures presented in the Company's final prospectus filed with the SEC on September 22, 2021.

Drivers of ARR
© 2
021
Toas
t, In
c. A
ll Ri
ghts
Re
serv
ed.
DriversLocalized Field Rep Growth
Efficiency
DriversGross Payment Volume
Payment Margin
Attach Rate
Pricing
18
Locations ARPU
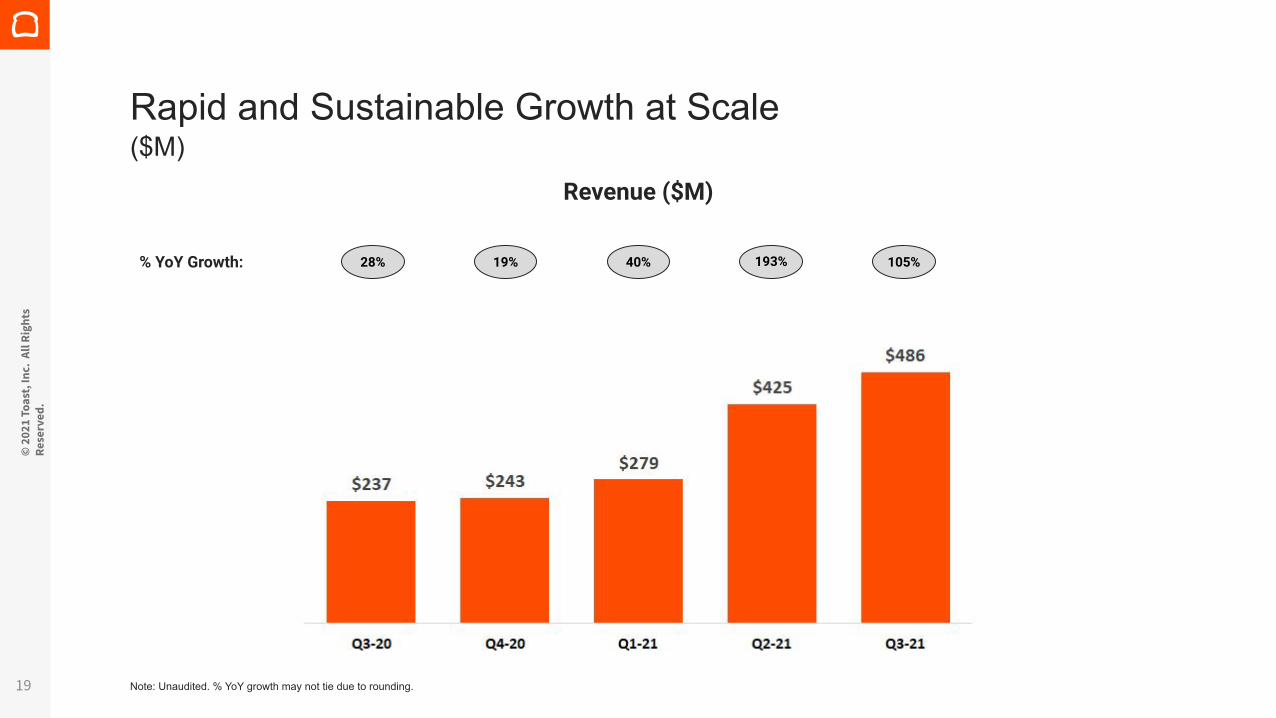
Rapid and Sustainable Growth at Scale
© 2
021
Toas
t, In
c. A
ll Ri
ghts
Re
serv
ed.
19 Note: Unaudited. % YoY growth may not tie due to rounding.
($M)Revenue ($M)
% YoY Growth: 28% 193%40%19% 105%

Rapid and Sustainable Growth at Scale($M)
© 2
021
Toas
t, In
c. A
ll Ri
ghts
Re
serv
ed.
20
Annualized Recurring Run-Rate (ARR)
Note: % YoY growth may not tie due to rounding.
% YoY Growth: 85% 118%86%77% 77%

Rapid and Sustainable Growth at Scale
© 2
021
Toas
t, In
c. A
ll Ri
ghts
Re
serv
ed.
21
Gross Payment Volume ($B)
Note: % YoY growth may not tie due to rounding.
Q3 2021 YoY Growth: 123%
% of Locations Using 4+ Elective Products
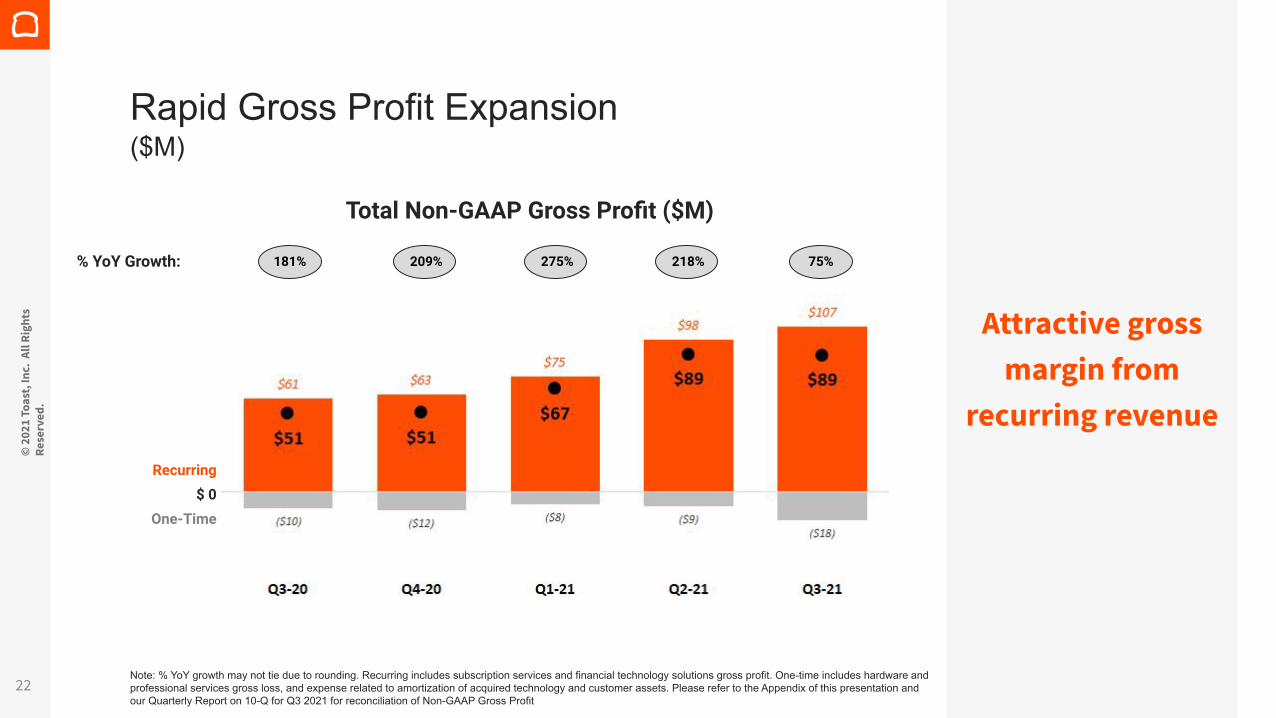
Rapid Gross Profit Expansion
© 2
021
Toas
t, In
c. A
ll Ri
ghts
Re
serv
ed.
22Note: % YoY growth may not tie due to rounding. Recurring includes subscription services and financial technology solutions gross profit. One-time includes hardware and professional services gross loss, and expense related to amortization of acquired technology and customer assets. Please refer to the Appendix of this presentation and our Quarterly Report on 10-Q for Q3 2021 for reconciliation of Non-GAAP Gross Profit
Recurring
One-Time
$ 0
Attractive gross margin from
recurring revenue
% YoY Growth:
Total Non-GAAP Gross Profit ($M)
($M)
181% 209% 275% 218% 75%

Proven Operating Leverage and Capital Efficiency
© 2
021
Toas
t, In
c. A
ll Ri
ghts
Re
serv
ed.
Adj. EBITDA ($M) $(0) $(7) $4 $11 $ (10)
23 Note: Numbers may not tie due to rounding. Please refer to the Appendix of this presentation and our Quarterly Report on 10-Q for Q3 2021 for reconciliation of Non-GAAP measures presented on this page.
Adjusted EBITDA as % of Total Revenue Free Cash Flow as % of Total Revenue
Free Cash Flow ($M) $0 $(32) $(14) $53 $ (21)

Large and Growing TAM
Proven Growth at Scale
Healthy Unit Economics
Durable Growth is a Priority
Toast in Review
© 2
021
Toas
t, In
c. A
ll Ri
ghts
Re
serv
ed.
24

Appendix
© 2021 Toast, Inc. All Rights Reserved.

© 2
021
Toas
t, In
c. A
ll Ri
ghts
Re
serv
ed.
Defining Key Terms
Gross Payment Volume (GPV)• Sum of total dollars processed through the Toast payments platform across all restaurant locations in a given period Annualized Recurring Run-Rate (ARR)• Sum of twelve times the subscription component of MRR and four times the trailing-three-month cumulative
payments component of MRRAdjusted EBITDANet income (loss), adjusted to exclude • Stock-based compensation expense and related payroll tax expense• Depreciation and amortization expense• Interest income and interest expense • Other income (expense) net• Acquisition expenses• Fair value adjustments on warrant and derivative liabilities• Expenses related to COVID-19 pandemic initiatives resulting from a reduction of workforce in 2020 and early
termination of leases• Loss on debt extinguishment• Income taxesFree Cash Flow• Calculated as net cash used in operating activities reduced by purchases of property and equipment and
capitalization of internal-use software costs
26

© 2
021
Toas
t, In
c. A
ll Ri
ghts
Re
serv
ed.
Quarterly Gross Profit GAAP to Non-GAAP Reconciliation
27 Note: Unaudited. Numbers may not tie due to rounding.

© 2
021
Toas
t, In
c. A
ll Ri
ghts
Re
serv
ed.
Quarterly Adj. EBITDA GAAP to Non-GAAP Reconciliation
28 Note: Unaudited. Numbers may not tie due to rounding.

© 2
021
Toas
t, In
c. A
ll Ri
ghts
Re
serv
ed.
Quarterly Free Cash Flow GAAP to Non-GAAP Reconciliation
29 Note: Unaudited. Numbers may not tie due to rounding.