Embed Size (px)
Citation preview

First Quarter 2013
Earnings Call
June 17, 2013
2
Forward-looking Statements
Certain statements contained in this presentation may constitute forward-looking
statements within the meaning of the Private Securities Litigation Reform Act of 1995.
Such statements include statements regarding the company’s anticipated financial and
operating performance, relate to future events and expectations and involve known and
unknown risks and uncertainties. For a summary of specific risk factors that could cause
results to differ materially from those expressed in the forward-looking statements, please
refer to the factors presented under the heading “Risk Factors” in our Form F-1 filed with
the U.S. Securities and Exchange Commission. All information in this presentation is as
of the date of the presentation. We undertake no obligation to publicly update or revise
any forward-looking statement as a result of new information, future events or otherwise,
except as required by law.
3
Non GAAP Measures
This presentation includes information regarding certain non-GAAP financial measures,
including Management Adjusted EBITDA, Adjusted EBITDA and Adjusted EBITDA per
ton. These measures are presented because management uses this information to
monitor and evaluate financial results and trends and believes this information to also be
useful for investors. Adjusted EBITDA measures are frequently used by securities
analysts, investors and other interested parties in their evaluation of Constellium and in
comparison to other companies, many of which present an adjusted EBITDA-related
performance measure when reporting their results. Management Adjusted EBITDA and
Adjusted EBITDA are not presentations made in accordance with IFRS, are not measures
of financial condition, liquidity or profitability and should not be considered as an
alternative to profit or loss for the period, revenues or operating cash flows determined in
accordance with IFRS. These measures may not be comparable to similarly titled
measures of other companies. The presentation provides a reconciliation of non-GAAP
financial measures to the most directly comparable financial measure. These non-GAAP
financial measures supplement our IFRS disclosures and should not be considered an
alternative to the IFRS measures.
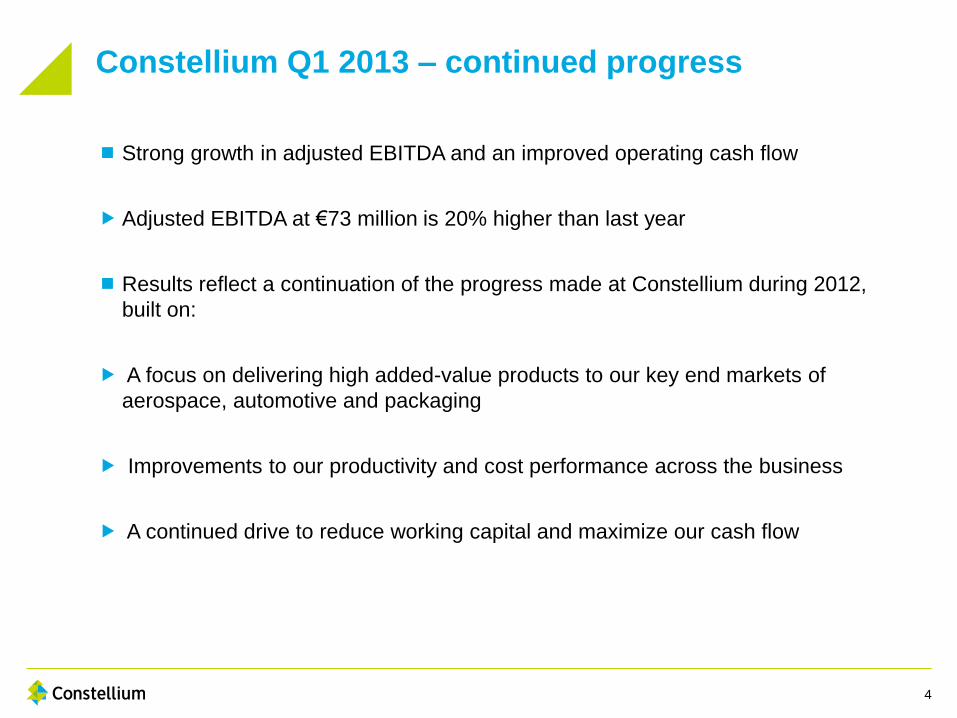
Constellium Q1 2013 – continued progress
Strong growth in adjusted EBITDA and an improved operating cash flow
Adjusted EBITDA at €73 million is 20% higher than last year
Results reflect a continuation of the progress made at Constellium during 2012,
built on:
A focus on delivering high added-value products to our key end markets of
aerospace, automotive and packaging
Improvements to our productivity and cost performance across the business
A continued drive to reduce working capital and maximize our cash flow
4
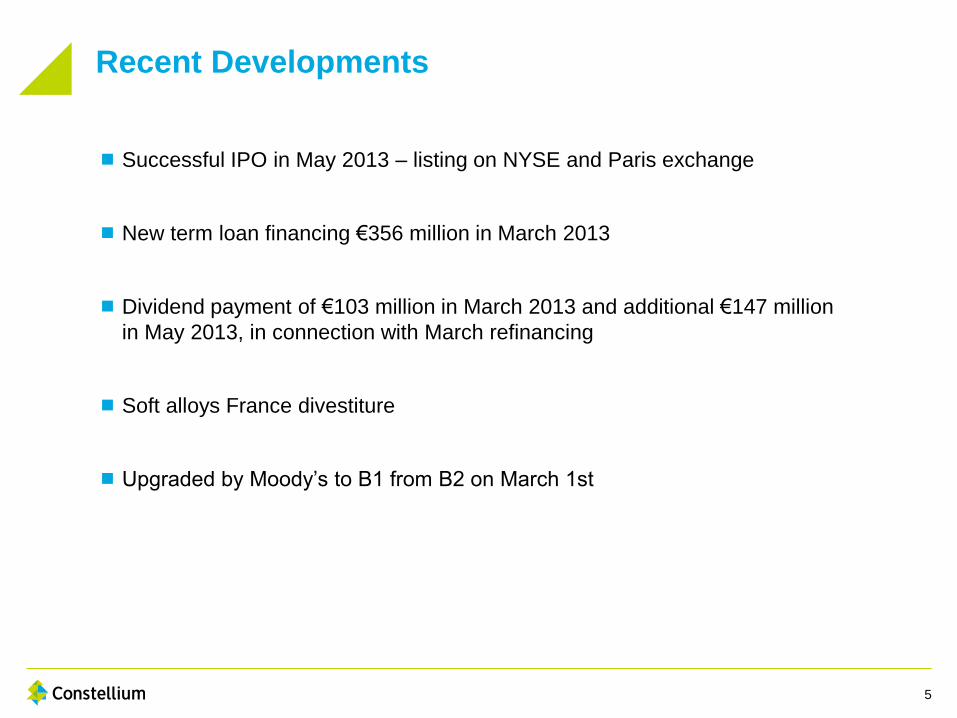
Recent Developments
Successful IPO in May 2013 – listing on NYSE and Paris exchange
New term loan financing €356 million in March 2013
Dividend payment of €103 million in March 2013 and additional €147 million
in May 2013, in connection with March refinancing
Soft alloys France divestiture
Upgraded by Moody’s to B1 from B2 on March 1st
5
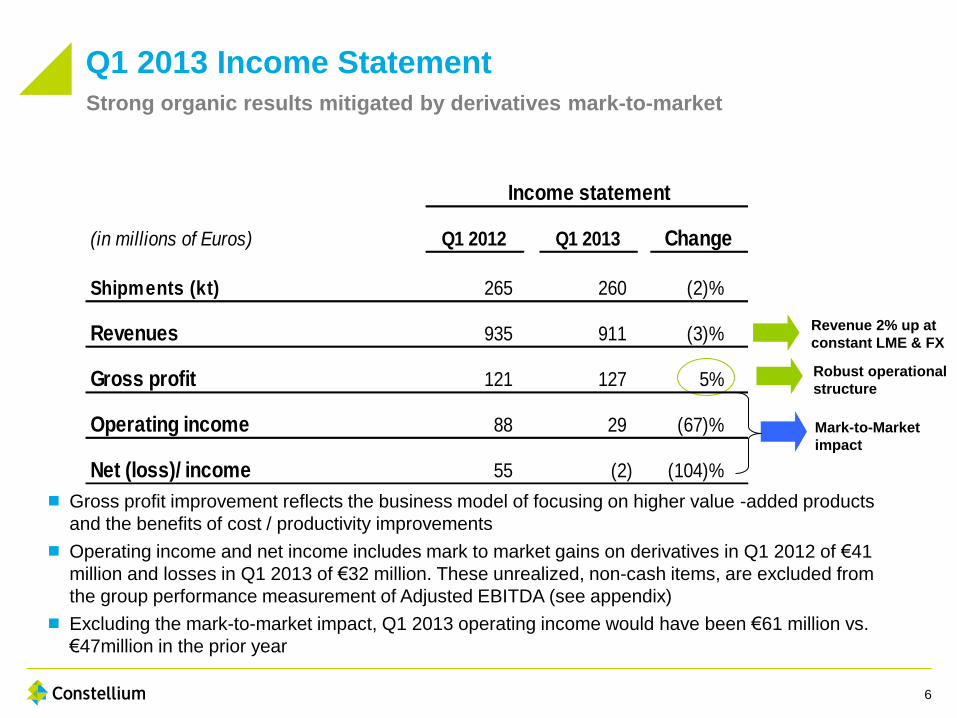
Q1 2013 Income Statement
Robust operational
structure
Strong organic results mitigated by derivatives mark-to-market
Mark-to-Market
impact
Revenue 2% up at
constant LME & FX
Gross profit improvement reflects the business model of focusing on higher value -added products
and the benefits of cost / productivity improvements
Operating income and net income includes mark to market gains on derivatives in Q1 2012 of €41
million and losses in Q1 2013 of €32 million. These unrealized, non-cash items, are excluded from
the group performance measurement of Adjusted EBITDA (see appendix)
Excluding the mark-to-market impact, Q1 2013 operating income would have been €61 million vs.
€47million in the prior year
6
Q1 2012 Q1 2013 Change
Shipments (kt) 265 260 (2)%
Revenues 935 911 (3)%
Gross profit 121 127 5%
Operating income 88 29 (67)%
Net (loss)/ income 55 (2) (104)%
(in millions of Euros)
Income statement
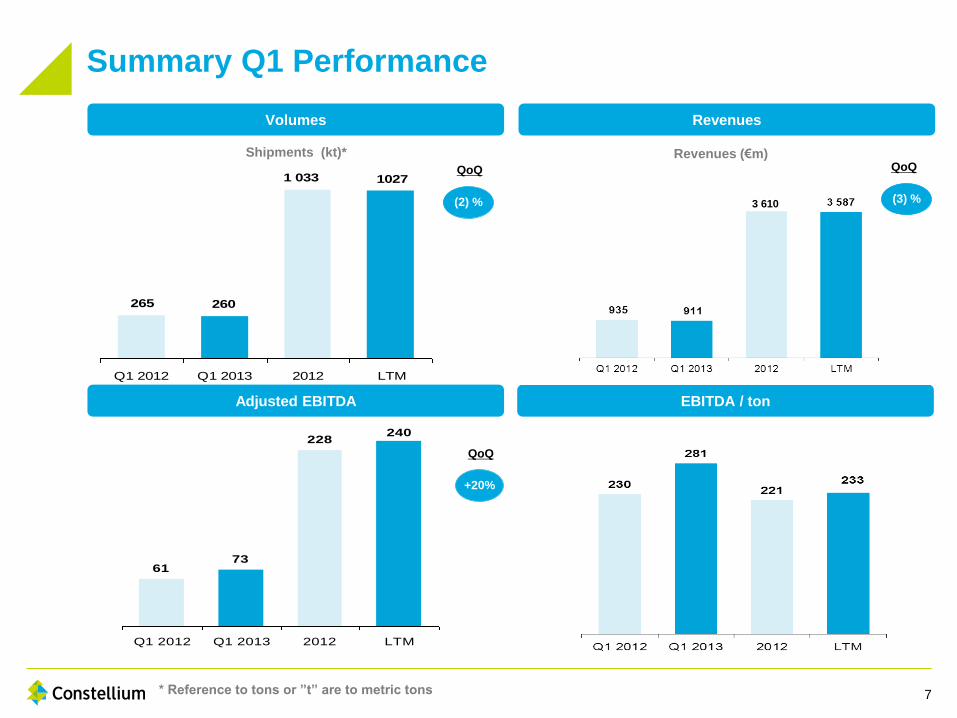
1 033
260 265
1027
Q1 2012 Q1 2013 2012 LTM
Summary Q1 Performance
Volumes Revenues
EBITDA / ton Adjusted EBITDA
QoQ
(2) %
QoQ
+20%
Shipments (kt)* Revenues (€m)
EBITDA / ton (€) Adjusted EBITDA (€m)
* Reference to tons or ”t” are to metric tons 7
6173
228240
Q1 2012 Q1 2013 2012 LTM
(3) %
QoQ
3 610
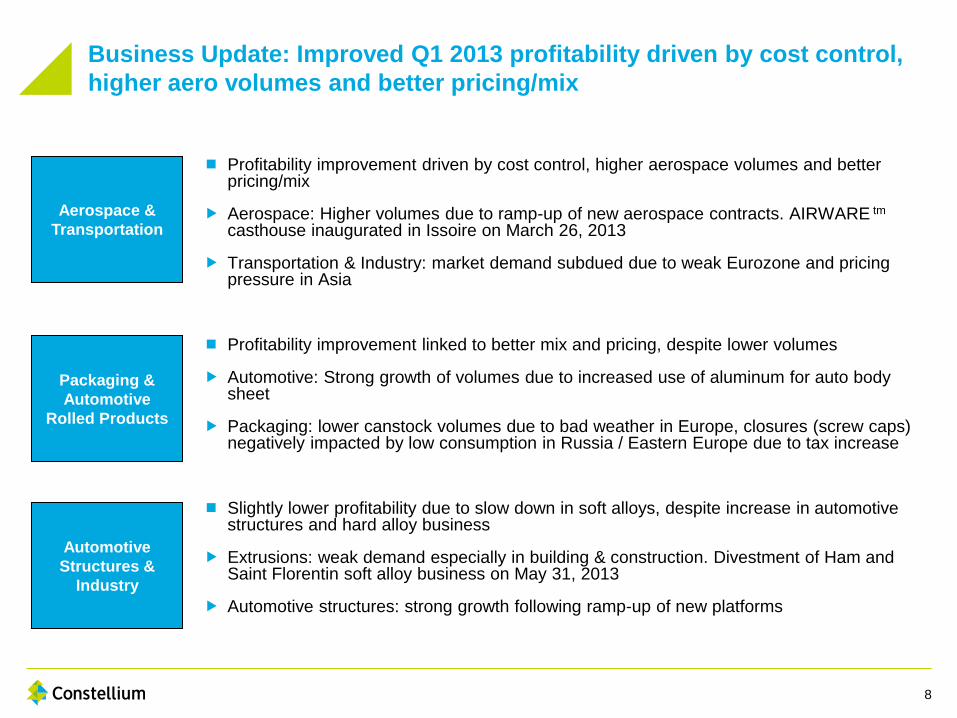
Business Update: Improved Q1 2013 profitability driven by cost control,
higher aero volumes and better pricing/mix
Profitability improvement driven by cost control, higher aerospace volumes and better pricing/mix
Aerospace: Higher volumes due to ramp-up of new aerospace contracts. AIRWARE tm
casthouse inaugurated in Issoire on March 26, 2013
Transportation & Industry: market demand subdued due to weak Eurozone and pricing pressure in Asia
Profitability improvement linked to better mix and pricing, despite lower volumes
Automotive: Strong growth of volumes due to increased use of aluminum for auto body sheet
Packaging: lower canstock volumes due to bad weather in Europe, closures (screw caps) negatively impacted by low consumption in Russia / Eastern Europe due to tax increase
Slightly lower profitability due to slow down in soft alloys, despite increase in automotive structures and hard alloy business
Extrusions: weak demand especially in building & construction. Divestment of Ham and Saint Florentin soft alloy business on May 31, 2013
Automotive structures: strong growth following ramp-up of new platforms
Aerospace &
Transportation
Packaging &
Automotive
Rolled Products
Automotive
Structures &
Industry
8
Q1 12 Q1 13
Q1 12 Q1 13
Q1 12 Q1 13
Q1 12 Q1 13
Q1 12 Q1 13
Q1 12 Q1 13
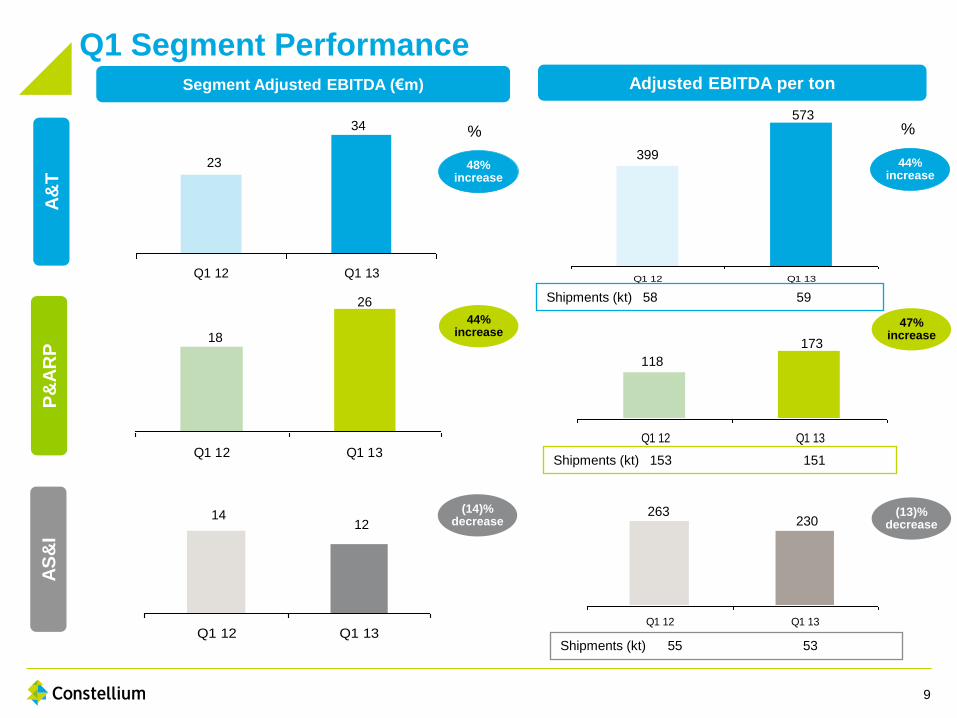
Q1 Segment Performance
Adjusted EBITDA per ton
A&
T
P&
AR
P
AS
&I
18
26
14 12
399
573
118
173
Segment Adjusted EBITDA (€m)
23
34
Shipments (kt) 58 59
Shipments (kt) 153 151
Shipments (kt) 55 53
% %
48% 48%
increase
44% increase
(14)% decrease
44% increase
47% increase
(13)% decrease
263 230
9
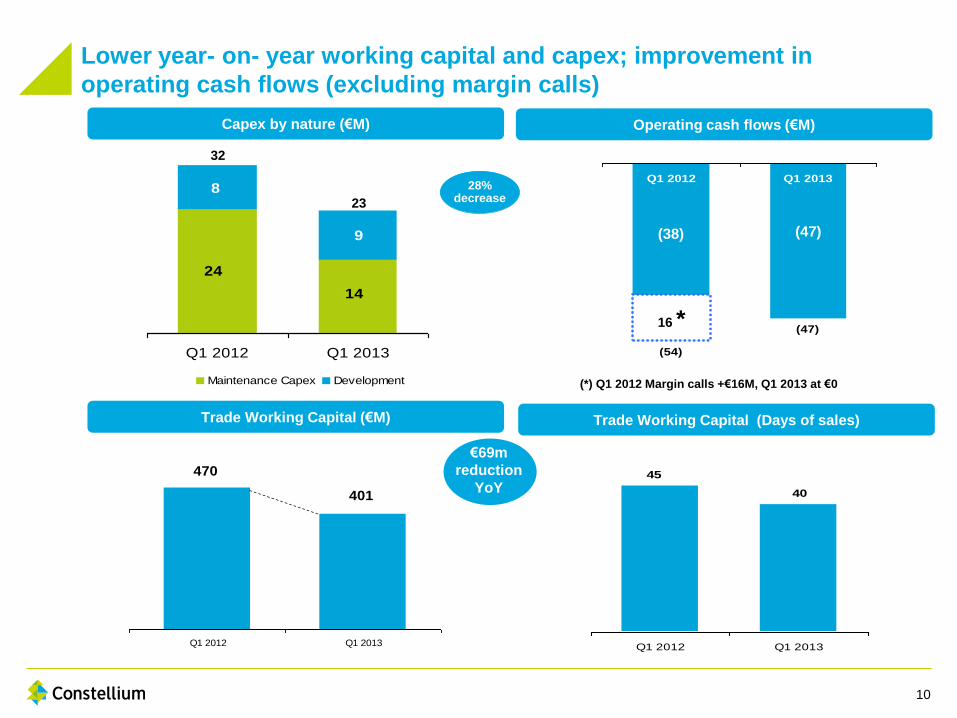
470
401
Q1 2012 Q1 2013
14
24
8
9
Q1 2012 Q1 2013
Maintenance Capex Development
Lower year- on- year working capital and capex; improvement in
operating cash flows (excluding margin calls)
Capex by nature (€M) Operating cash flows (€M)
Trade Working Capital (€M)
28% decrease
€69m
reduction
YoY
Trade Working Capital (Days of sales)
32
23
45
40
Q1 2012 Q1 2013
(47)
(54)
Q1 2012 Q1 2013
16 *
(38) (47)
(*) Q1 2012 Margin calls +€16M, Q1 2013 at €0
10
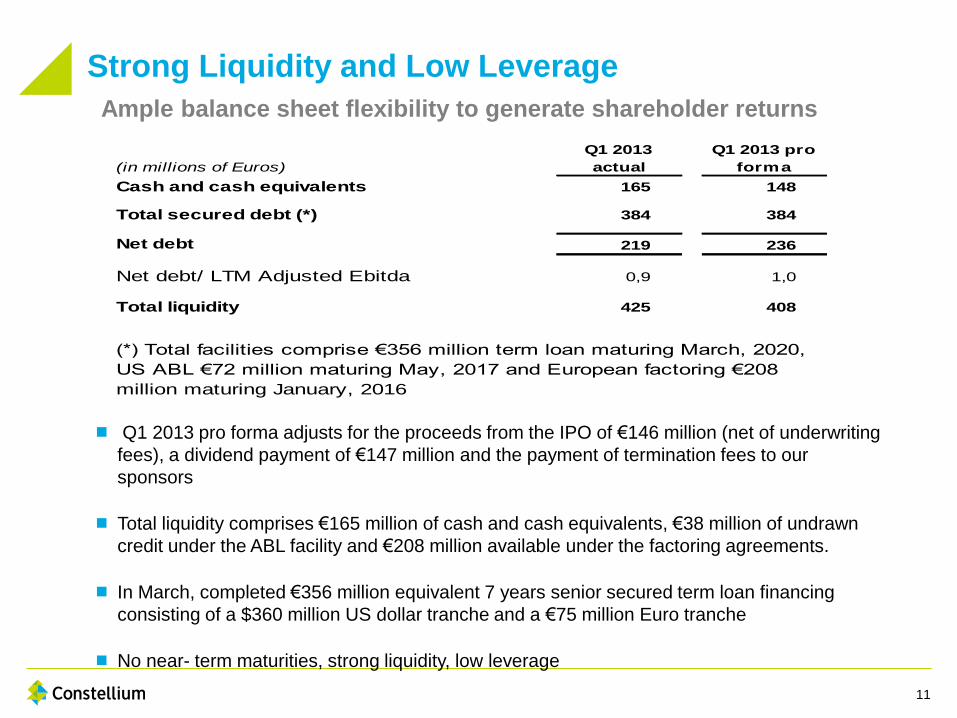
Strong Liquidity and Low Leverage
Q1 2013 pro forma adjusts for the proceeds from the IPO of €146 million (net of underwriting
fees), a dividend payment of €147 million and the payment of termination fees to our
sponsors
Total liquidity comprises €165 million of cash and cash equivalents, €38 million of undrawn
credit under the ABL facility and €208 million available under the factoring agreements.
In March, completed €356 million equivalent 7 years senior secured term loan financing
consisting of a $360 million US dollar tranche and a €75 million Euro tranche
No near- term maturities, strong liquidity, low leverage
11
Ample balance sheet flexibility to generate shareholder returns
(in millions of Euros)
Q1 2013
actual
Q1 2013 pro
forma
Cash and cash equivalents 165 148
Total secured debt (*) 384 384
Net debt 219 236
Net debt/ LTM Adjusted Ebitda 0,9 1,0
Total liquidity 425 408
(*) Total facilities comprise €356 million term loan maturing March, 2020,
US ABL €72 million maturing May, 2017 and European factoring €208
million maturing January, 2016

Business Outlook: End markets with attractive growth and positive
substitution dynamics
Aerospace
Market Growth Forecast(1): 7%
Automotive
Market Growth Forecast(1): 17%
Packaging
Market Growth Forecast(1): 3%
0
10,000
20,000
30,000
40,000
2011 airplanes 19,890
2031 airplanes39,780
Units
Fleet retained Fleet replacement Fleet growth
34,000 19,890 – 59%
14,110 – 41%
5,780
Fleet Development Driven by Passenger
Demand and Aging Fleet (units)
Aluminum in European Light
Vehicles (kg)
180
170
150
0
160
140
2020 2015
150
2012
180
140
19,890 – 59%
14,110 – 41% 5,780
CAGR 2012-2017
+3%
+5%
+3%
Can Stock Consumption (kt)
1) Source: CRU. Reflects 2012 – 2015 yearly growth in demand for aluminum. Aerospace: Aircraft for Western Europe & North America; Automotive: North America passenger cars &
Western Europe auto body, Packaging: Western & Eastern Europe can stock.
12
Attractive End Markets Lead to Bright Long-term
Outlook
Aerospace:
Stable growth supported by 8 year order backlog
Modest inventory overhang in aerospace supply chain offset by our gains in market share
Automotive:
Significant expected growth due to replacement of heavier steel in both car body and automotive structures
Packaging:
Healthy growth of European can market driven by continued substitution of steel and glass
Q2/Q3 volumes could be impacted by possible bad weather experienced across Europe
13
Appendices
14
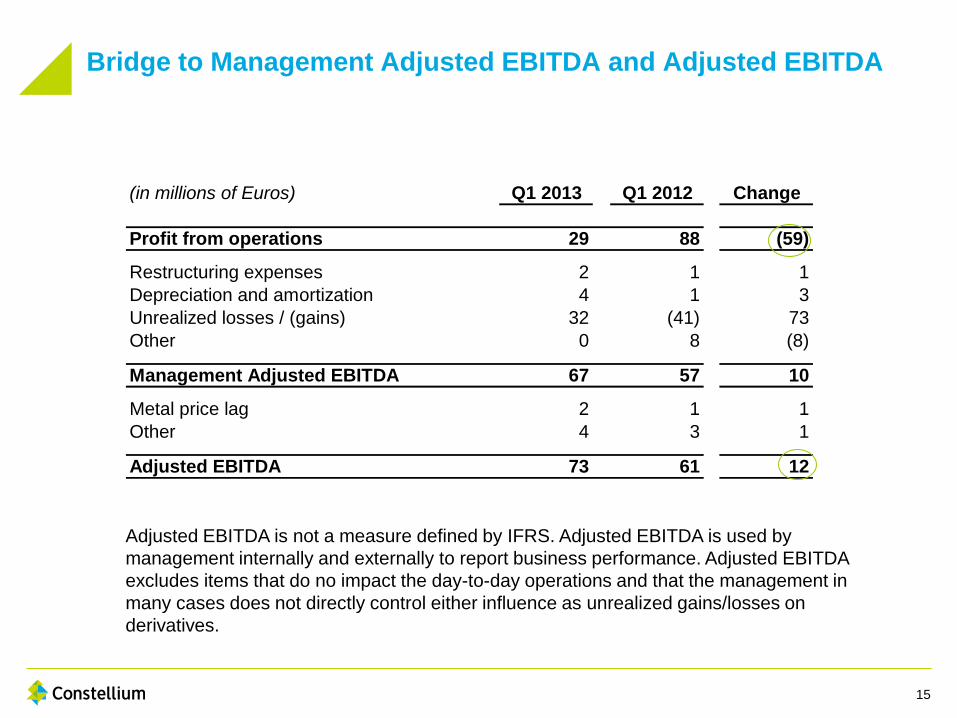
(in millions of Euros) Q1 2013 Q1 2012 Change
Profit from operations 29 88 (59)
Restructuring expenses 2 1 1
Depreciation and amortization 4 1 3
Unrealized losses / (gains) 32 (41) 73
Other 0 8 (8)
Management Adjusted EBITDA 67 57 10
Metal price lag 2 1 1
Other 4 3 1
Adjusted EBITDA 73 61 12
Bridge to Management Adjusted EBITDA and Adjusted EBITDA
Adjusted EBITDA is not a measure defined by IFRS. Adjusted EBITDA is used by
management internally and externally to report business performance. Adjusted EBITDA
excludes items that do no impact the day-to-day operations and that the management in
many cases does not directly control either influence as unrealized gains/losses on
derivatives.
15
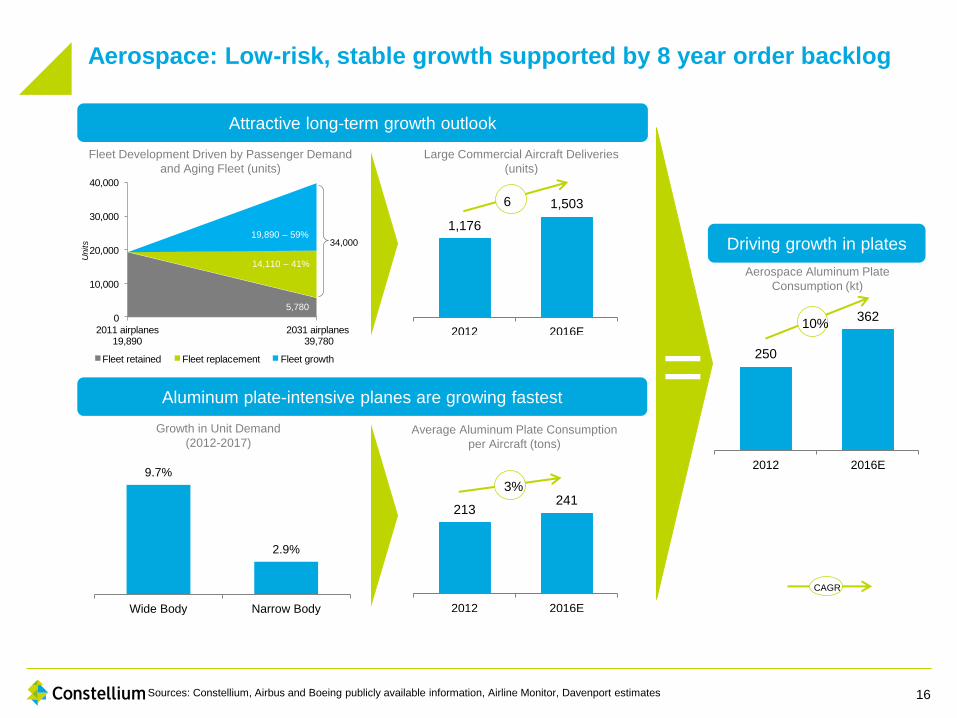
Sources: Constellium, Airbus and Boeing publicly available information, Airline Monitor, Davenport estimates
Driving growth in plates 1,176
1,503
2012 2016E
6
213 241
2012 2016E
3%
250
362
2012 2016E
10%
CAGR
Attractive long-term growth outlook
Aluminum plate-intensive planes are growing fastest =
Average Aluminum Plate Consumption
per Aircraft (tons)
Large Commercial Aircraft Deliveries
(units)
Aerospace Aluminum Plate
Consumption (kt)
Growth in Unit Demand
(2012-2017)
9.7%
2.9%
Wide Body Narrow Body
0
10,000
20,000
30,000
40,000
2011 airplanes 19,890
2031 airplanes39,780
Units
Fleet retained Fleet replacement Fleet growth
34,000 19,890 – 59%
14,110 – 41%
5,780
Fleet Development Driven by Passenger Demand
and Aging Fleet (units)
Aerospace: Low-risk, stable growth supported by 8 year order backlog
16
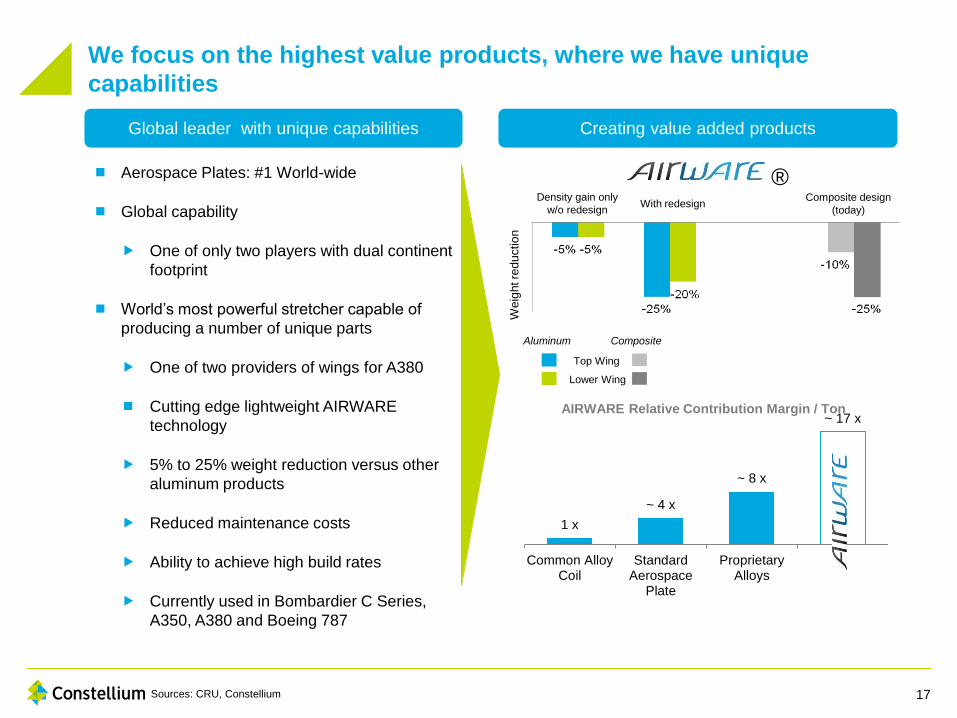
Global leader with unique capabilities
Aluminum
Lower Wing
Top Wing
Composite
Composite design
(today) With redesign
Density gain only
w/o redesign
Weig
ht re
du
ctio
n
®
Creating value added products
Aerospace Plates: #1 World-wide
Global capability
One of only two players with dual continent
footprint
World’s most powerful stretcher capable of
producing a number of unique parts
One of two providers of wings for A380
Cutting edge lightweight AIRWARE
technology
5% to 25% weight reduction versus other
aluminum products
Reduced maintenance costs
Ability to achieve high build rates
Currently used in Bombardier C Series,
A350, A380 and Boeing 787
1 x
~ 4 x
~ 8 x
~ 17 x
Common AlloyCoil
StandardAerospace
Plate
ProprietaryAlloys
AIRWARE Relative Contribution Margin / Ton
We focus on the highest value products, where we have unique
capabilities
17 Sources: CRU, Constellium
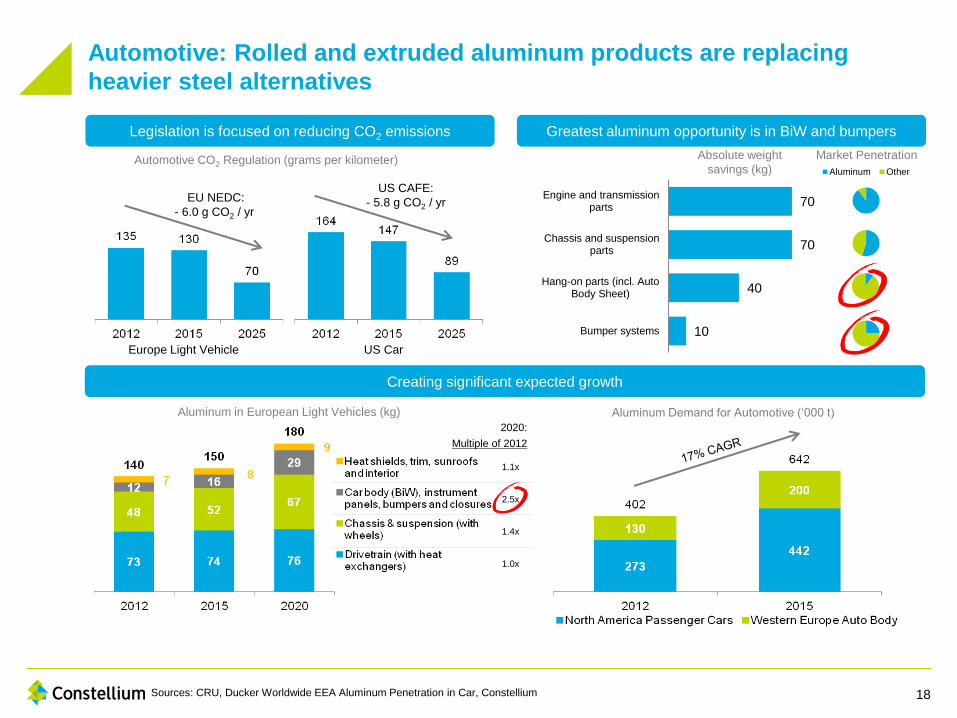
1.1x
2.5x
1.4x
1.0x
Market Penetration
70
70
40
10
Engine and transmissionparts
Chassis and suspensionparts
Hang-on parts (incl. AutoBody Sheet)
Bumper systems
Absolute weight
savings (kg) Aluminum Other
Sources: CRU, Ducker Worldwide EEA Aluminum Penetration in Car, Constellium
Legislation is focused on reducing CO2 emissions Greatest aluminum opportunity is in BiW and bumpers
Creating significant expected growth
19,890 – 59%
Automotive CO2 Regulation (grams per kilometer)
Aluminum in European Light Vehicles (kg)
EU NEDC:
- 6.0 g CO2 / yr
Europe Light Vehicle US Car
US CAFE:
- 5.8 g CO2 / yr
2020:
Multiple of 2012
Aluminum Demand for Automotive (‘000 t)
Automotive: Rolled and extruded aluminum products are replacing
heavier steel alternatives
18
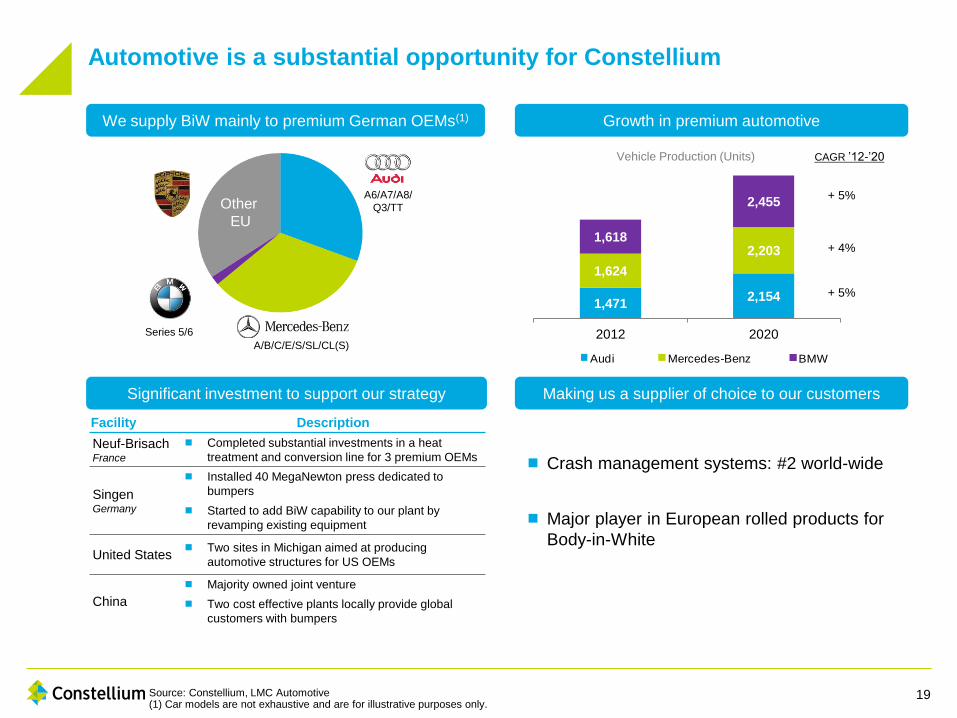
1,471 2,154
1,624
2,203 1,618
2,455
2012 2020
A6/A7/A8/
Q3/TT
A/B/C/E/S/SL/CL(S)
Series 5/6
Other
EU
Source: Constellium, LMC Automotive (1) Car models are not exhaustive and are for illustrative purposes only.
We supply BiW mainly to premium German OEMs(1) Growth in premium automotive
Significant investment to support our strategy Making us a supplier of choice to our customers
Crash management systems: #2 world-wide
Major player in European rolled products for
Body-in-White
Facility Description
Neuf-Brisach France
Completed substantial investments in a heat
treatment and conversion line for 3 premium OEMs
Singen Germany
Installed 40 MegaNewton press dedicated to
bumpers
Started to add BiW capability to our plant by
revamping existing equipment
United States Two sites in Michigan aimed at producing
automotive structures for US OEMs
China
Majority owned joint venture
Two cost effective plants locally provide global
customers with bumpers
CAGR ’12-’20
+ 5%
+ 4%
+ 5%
1,4712,154
1,624
2,203
1,618
2,455
2012 2020
BMW Mercedes-Benz Audi
1,4712,154
1,624
2,203
1,618
2,455
2012 2020
BMW Mercedes-Benz Audi
1,4712,154
1,624
2,203
1,618
2,455
2012 2020
BMW Mercedes-Benz Audi
Vehicle Production (Units)
Automotive is a substantial opportunity for Constellium
19
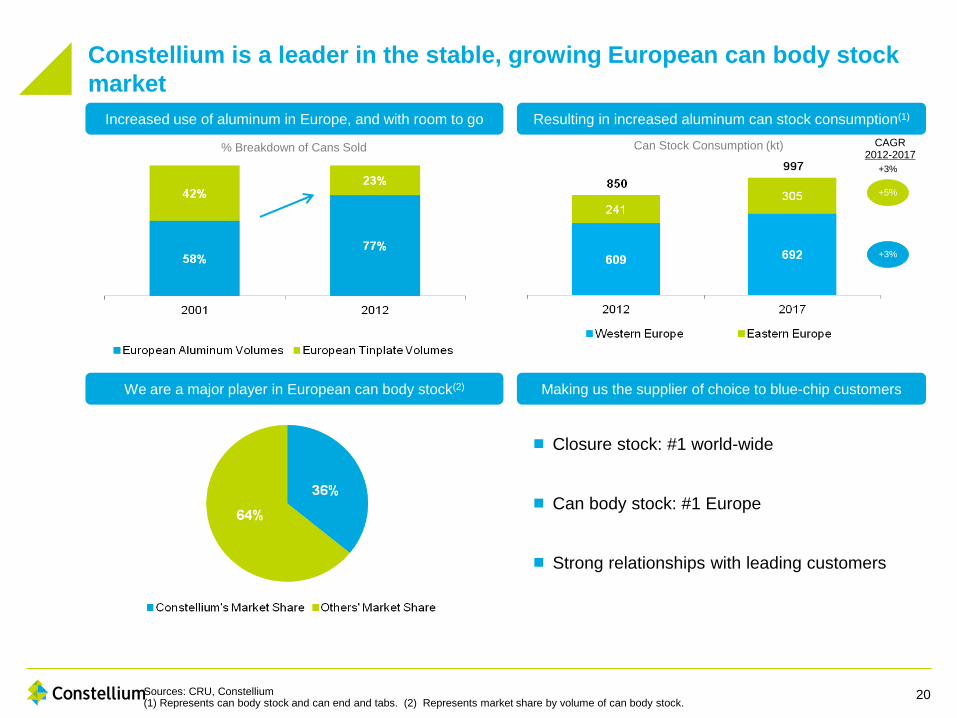
Sources: CRU, Constellium (1) Represents can body stock and can end and tabs. (2) Represents market share by volume of can body stock.
Increased use of aluminum in Europe, and with room to go
We are a major player in European can body stock(2)
Resulting in increased aluminum can stock consumption(1)
Making us the supplier of choice to blue-chip customers
19,890 – 59%
14,110 – 41%
5,780
CAGR 2012-2017
+3%
+5%
+3%
Closure stock: #1 world-wide
Can body stock: #1 Europe
Strong relationships with leading customers
% Breakdown of Cans Sold Can Stock Consumption (kt)
Constellium is a leader in the stable, growing European can body stock
market
20
Adjusted EBITDA Measures
We believe the use of certain non-GAAP measures are important supplemental measures of our operating performance. By
providing these measures, together with the reconciliations, we believe we are enhancing investors’ understanding of our business
and our results of operations, as well as assisting investors in evaluating how well we are executing our strategic initiatives.
In considering the financial performance of the business, management and our chief operational decision maker in accordance
with IFRS analyze the primary financial performance measure of Management Adjusted EBITDA in all of our business segments.
Management Adjusted EBITDA is defined as profit for the period from continuing operations before results from joint ventures, net
financial expense, income taxes and depreciation, amortization and impairment, as adjusted to exclude losses on disposal of
property, plant and equipment, acquisition and separation costs, restructuring costs, pension amendments and unrealized gains or
losses on derivatives and on foreign exchange differences. The most directly comparable IFRS measure to Management Adjusted
EBITDA is our profit or loss for the period. We believe Management Adjusted EBITDA is useful to investors and is used by our
management for measuring profitability because it excludes the impact of certain non-cash charges, such as depreciation,
amortization, impairment and unrealized gains and losses on derivatives as well as items that do not impact the day-to-day
operations and that management in many cases does not directly control or influence. Therefore, such adjustments eliminate items
which have less bearing on our core operating performance.
Adjusted EBITDA is an additional performance measure used by management as an important supplemental measure in
evaluating our operating performance, in preparing internal forecasts and budgets necessary for managing our business and,
specifically in relation to the exclusion of the effect of favorable or unfavorable metal price lag, in allowing management and the
investor to assess operating results and trends without the impact of our accounting for inventories. Adjusted EBITDA is defined as
Management Adjusted EBITDA further adjusted for favorable (unfavorable) metal price lag, exceptional consulting costs, effects of
purchase accounting adjustment, standalone costs and management fees payable by the company to an affiliate of Apollo Global
Management, LLC, and exceptional employee bonuses in relation to cost saving implementation and targets. We use the weighted
average cost method in accordance with IFRS which leads to the purchase price paid for metal impacting our cost of goods sold
and therefore profitability in the period subsequent to when the related sales price impacts our revenues. Management also
believes this measure provides additional information used by our lending facilities providers with respect to the ongoing
performance of our underlying business activities. We use Adjusted EBITDA in calculating our compliance with the financial
covenants under our Term Loan Agreement.
21