Embed Size (px)
Citation preview
85
Chapter IV
PROFILE OF DPs AND INVESTORS ATTITUDE ON DP
SERVICES
This chapter deals with profile of select DPs and investors attitude towards
demat charges, reasonability of charges, mode of trading, basis of investment
decision, brokerage charge, business activities of DPs, equity research of DPs
transfer of shares, add on services of DPs .
Profile of select Depository Participants
India Info Line IIFL
IIFL (India Infoline group), comprising the holding company, India Info
line Ltd (NSE: INDIAINFO, BSE: 532636) and its subsidiaries, is one of one of
India’s premier providers of financial services. IIFL offers advice and an
execution platform for the entire range of financial services covering products
ranging from loans, company wealth management, asset management, insurance,
fixed deposits, investment banking, equities and derivatives, commodities,
Government of India bonds and other small savings instruments. It owns and
manages the company site, www.indiainfoline.com, which is one of India’s
leading online destinations for personal finance, economy, corporate updates and
equity and commodity-related updates.The company services 2.1 million
customers with a team of 14,000 employees in 3,820 business locations present in
eight countries.
Credit and finance
The facility is offered by subsidiaries, India Infoline Finance Ltd and India
Infoline Housing Finance Ltd. The diversified lending portfolio includes home
loans, healthcare finance for medical equipments, SME and trader loans, secured
loans against gold jewellery, commercial vehicle financing, property loans, and
capital market finance secured against securities. In FY13, this segment posted an
82.10% year-on-year growth in revenues at Rs. 17.37bn. The high quality loan
86
book of `. 93.75bn as on March 31, 2013 is backed by strong capital adequacy of
over 20% companyll above the stipulated 15%.
Private wealth management
In an increasingly unpredictable world, there is greater investor need for a
comprehensive company wealth management solution as opposed to disparate
services. Under this segment, IIFL Private Company wealth offers advisory
services to high net worth individuals and corporate clients. It manages
over `. 400bn of assets under advice on a client base exceeding 7,000 families.
Financial products division
The Group distributes a range of financial products like insurance, mutual
funds, National Pension Scheme, bonds and debentures through its extensive
distribution network. The company is a leader among non-bank promoted entities
in the distribution of life insurance and mutual funds. For FY13, annual premium
mobilisation stood at `. 3.2bn.
Asset management
The business was launched in 2011 with a unique proposition. The maiden
scheme was, and still is, the lowers cost Nifty ETF in India. A total of six
schemes have been launched, including four close-ended debt schemes and two
open-ended equity schemes. Total Assets Under Management stands at `. 3.27bn
as on March 31, 2013.
Equity, commodities and currency
Though the contribution to revenues is less than 15%, IIFL Group
continues to remain a leading online and offline broking as company as advisory
services provider for cash and derivative segments directed at retail and
institutional clients. Over a decade, the company has created a brand marked by
informed research, systemic uptime, transaction speed, cutting-edge technology,
extensive footprint, high service standards and competitive brokerage. It
87
pioneered the concept of internet broking in India and rationalised brokerage rates
from 1-1.5% in the late 90s to as low as 0.05%. The extension into commodities
and currency trading reconciles with its vision to emerge as a one-stop-shop
financial intermediary.
Research
A forerunner in the field of equity research, IIFL’s research is
acknowledged by none other than Forbes as ‘Best of the Company’ and ‘…a must
read for investors in Asia’. IIFL research is available not just over the Internet but
also on international wire services like Bloomberg, Thomson, Dow Jones Factiva
and Internet Securities. It is amongst the most read incisive pieces from among
Indian brokerages.
Milestones of IIFL
On a consolidated basis, the company has posted a record all-time high
income and profit for FY13. Income and profit stood at `. 26.7bn and `. 2.79bn,
respectively. Some important milestones for the year gone by include loan book
at `. 93.75bn, total borrowing at `. 92.2bn, capital adequacy ratio of 21.6%, net
interest margin of 9.5%, net non-performing assets at 0.17% and cost to income
ratio of 58.16%.
The company supports employment of over 24,000 people directly and
thousands more indirectly. The company services its 2.1mn customers through its
network of 3,820 locations present in 900 cities, covering literally every nook and
corner of the country IIFL is physically present in key global markets includes
subsidiaries in Colombo, Dubai, New York, Mauritius, London, Singapore and
Hong Kong. It is a proud corporate citizen with cumulative contribution since
inception to the exchequer of over `. 5 bn. The company has set an example for
the peer group with its financial literacy campaign or Financial Literacy Agenda
For Mass Empowerment touching more than 30mn people.vIIFL’s short-term
debt is rated CRISIL A1+ and ICRA (A1+) by Crisil and ICRA, respectively. For
88
the long-term, it has been rated ICRA (AA-) and CRISIL AA-/Stable indicating a
high degree of safety for timely servicing of financial obligations.
KARVY STOCK BROKING LTD
Stock Broking Services
It is an undisputed fact that the stock market is unpredictable and yet enjoys a
high success rate as a Wealth management and Wealth accumulation option. The
difference between unpredictability and a safety anchor in the market is provided
by in-depth knowledge of market functioning and changing trends, planning with
foresight and choosing one's options with care. This is what company provides in
our Stock Broking services. Company offer services that are beyond just a
medium for buying and selling stocks and shares. Instead companies provide
services which are multi dimensional and multi-focused in their scope. There are
several advantages in utilizing our Stock Broking services, which are the reasons
why it is one of the best in the country.
Company offer trading on a vast platform; National Stock Exchange, Bombay
Stock Exchange and Hyderabad Stock Exchange. More importantly, company
make trading safe to the maximum possible extent, by accounting for several risk
factors and planning accordingly. Companies are assisted in this task by our in-
depth research, constant feedback and sound advisory facilities. Our highly skilled
research team, comprising of technical analysts as well as fundamental specialists,
secure result-oriented information on market trends, market analysis and market
predictions. This crucial information is given as a constant feedback to our
customers, through the following daily reports which are delivered to them thrice
a day;
• The Pre-session Report, where market scenario for the day is predicted
• The Mid-session Report, timed to arrive during lunch break , where the
market forecast for the rest of the day is given and
89
• The Post-session Report, the final report for the day, where the market and
the report itself is reviewed.
• To add to this repository of information, company publish a monthly
magazine called KARVY The Finapolis which analyzes the latest stock
market trends and takes a close look at the various investment options, and
products available in the market, while a weekly report, called KARVY
Bazaar Baatein, keeps you more informed on the immediate trends in the
stock market. In addition, our specific industry reports give
comprehensive information on various industries. Besides this, company
also offer special portfolio analysis packages that provide daily technical
advice on scrip’s for successful portfolio management and provide
customized advisory services to help you make the right financial moves
that are specifically suited to your portfolio.
Our Stock Broking services are widely networked across India, with the
number of our trading terminals providing retail stock broking facilities. Our
services have increasingly offered customer oriented convenience, which
company provide to a spectrum of investors, high-net worth or otherwise, with
equal dedication and competence. But true to our spirit, this success is not our
final destination, but just a platform to launch further enhanced quality services to
provide you the latest in convenient, customer-friendly stock management. Over
the years company have ensured that the trust of our customers is our biggest
returns. Factors such as our success in the Electronic custody business has helped
build on our tradition of trust even more. Consequentially our retail client base
expanded very fast. To empower the investor further company have made serious
efforts to ensure that our research calls are disseminated systematically to all our
stock broking clients through various delivery channels like email, chat, SMS,
phone calls etc.
Our foray into commodities broking has been path breaking and company are
in the process of converting existing traders in commodities into the more
organized mainstream of trading in commodity futures, both as a trading and risk
90
hedging mechanism. In the future, our focus will be on the emerging businesses
and to meet this objective, company have enhanced our manpower and revitalized
our knowledge base with enhances focus on Futures and Options as well as the
commodities business.
Depository Participant Services
The onset of the technology revolution in financial services Industry saw
the emergence of KARVY as an electronic custodian registered with National
Securities Depository Ltd (NSDL) and Central Securities Depository Ltd (CSDL)
in 1998. KARVY set standards enabling further comfort to the investor by
promoting paperless trading across the country and emerged as the top 3
Depository Participants in the country in terms of customer serviced.
Financial Products Distribution Services
The paradigm shift from pure selling to knowledge based selling drives
the business today. With our wide portfolio offerings, company occupies all
segments in the retail financial services industry. A team of highly qualified and
dedicated professionals drawn from the best of academic and professional
backgrounds are committed to maintaining high levels of client service delivery.
This has propelled us to a position among the top distributors for equity and debt
issues with an estimated market share of 15% in terms of applications mobilized,
besides being established as the leading procurer in all public issues. To further
tap the immense growth potential in the capital markets company enhanced the
scope of our retail brand, KARVY – the Finapolis, thereby providing planning
and advisory services to the mass affluent.
Advisory Services
Under our retail brand ‘KARVY – the Finapolis, company deliver
advisory services to a cross-section of customers. The service is backed by a team
of dedicated and expert professionals with varied experience and background in
handling investment portfolios. They are continually engaged in designing the
right investment portfolio for each customer according to individual needs and
91
budget considerations with a comprehensive support system that focuses on
trading customers' portfolios and providing valuable inputs, monitoring and
managing the portfolio through varied technological initiatives. This is made
possible by the expertise company have gained in the business over the years.
Another venture towards being investor-friendly is the circulation of a monthly
magazine called ‘KARVY - the Finapolis covering the latest of market news,
trends, investment schemes and research-based opinions from experts in various
financial fields.
Private Client Group Services
This specialized division was set up to cater to the high net worth
individuals and institutional clients keeping in mind that they require a different
kind of financial planning and management that will augment not just existing
finances but their life-style as well. Here company follows a hard-nosed business
approach with the soft touch of dedicated customer care and personalized
attention. For this purpose company offer a comprehensive and personalized
service that encompasses planning and protection of finances, planning of
business needs and retirement needs and a host of other services, all provided on a
one-to-one basis. Our research reports have been widely appreciated by this
segment. The delivery and support modules have been fine tuned by giving our
clients access to online portfolio information, constant updates on their portfolios
as well as value-added advice on portfolio churning, sector switches etc. The
investment recommendations given by our research team in the cash market have
enjoyed a high success rate. Offering a wide trading platform with a dual
membership at both NSDL and CDSL, companies are a powerful medium for
trading and settlement of dematerialized shares.
PCS SECURITIES LTD
PCS Securities Ltd. adds the dynamic growth factor to your savings and
investments by guiding you through the land of opportunities and maximizing
your returns. PCS is a fourth generation stock broking powerhouse - one among
the top 100 national brokerage firms in India and has served thousands of
92
investors over the past six decades. PCS is now present at over 340 locations
across the Nation and one of the top CDSL Participants in South India.
PCS Securities Ltd Powered by Generation Inpired by Trust
Today's world of advanced technology and blink-of-an-eye
communication has opened a magic box full of opportunities and wealth
fulfillment formulae. PCS is here to offer you some such opportunities which help
you stretch your investment horizon and unleash the true potential of your wealth.
PCS Securities Ltd. adds the dynamic growth factor to your savings and
investments by guiding you through the land of opportunities and maximizing
your returns. PCS is a fourth generation stock broking power house - one among
the top 100 national brokerage firms in India and has served thousands of
investors over the past six decades. PCS is now present at over 340 locations
across the Nation and one of the top CDSL Participants in South India.
PCS was born out of the aspirations of Late Mr. K. C. Shrimal - founder
member of Hyderabad Stock Exchange - and nurtured through generations by
Late Mr. S. C. Shrimal and his son Mr. P. C. Shrimal, Promoter and Chairman of
PCS Securities Ltd., twice President of HSE, who has also served as the Chairman
of the FISE - Federation of Indian Stock Exchanges. He is currently assisted by
his son, Mr. Prashant Shrimal. The Board consists not only of the highly
experienced generational hierarchy, but also industry stalwarts with a
companyalth of expertise including Whole-time Director Mr. Paresh Shah and
Director Mr. Jagdish Ahuja (Ex-President, Bangalore Stock Exchange).
NETWORTH STOCK BROKINGM LTD
Net worth has always endeavored to make a difference in the financial
services space. It constantly focuses on scaling and upgrading the technology
infrastructure so as to provide the best services to the investors.The Company
have presence of around 350 centers across India.
93
The Company Strengths
• Managed by a talented team of around 800 professionals.
• Serving nearly 100,000 clients across the country.
• ISO 9001:2000 Certified Software Division.
• Winner of CNBC-TV18’s Financial Advisor Awards 2008 for Best
Regional Level Financial Advisor.
• Proclaimed amongst the most read research analyst (Team Networth) by
Thomson Reuters consistently over a period of time.
• A Charter member of Financial Planning Standards Board of India
[FPSB].
• Alliance partners with PNB for online trading.
• Corporate Agents for MetLife India Insurance Co Ltd.
NET WORTH GROUP COMPANIES
Net worth Stock Broking Ltd. [NSBL]
NSBL is a member of the National Stock Exchange of India Ltd (NSE)
and the Bombay Stock Exchange Ltd (BSE) in the Capital Market and Derivatives
(Futures & Options) segment. NSBL has also acquired membership of the
currency derivatives segment with NSE, BSE, USE & MCX-SX. It is Depository
participants with Central Depository Services India (CDSL) and National
Securities Depository (India) Limited (NSDL). With a client base of around
100,000 loyal customers, NSBL is spread across the country though its around
350 branches. NSBL is listed on the BSE since 1994.
Net worth Wealth Solutions Ltd. [NWSL]
NWSL is into the business of delivery of Financial Planning & Advice.
It’s vision is to ‘Advice & Execute money related solutions to/for our customers
in the most Convenient & Consolidated manner, while making sure that their
experience with us is always pleasant & memorable resulting in positive
advocacy’. The product & Services include Financial Planning, Life Insurance,
94
On-line Trading Account, Mutual Funds, Debentures/Bonds, General Insurance,
Loans and Depository Services.
Net worth Commodities & Investments Limited [NCIL]
NCIL is the commodities arm of NSBL. It is a member at the Multi
Commodity Exchange of India (MCX), National Commodity & Derivatives
Exchange (NCDEX) and ICEX & is backed by solid research & analytics in
Commodities.
Net worth Soft Tech Ltd. [NSL]
NSL is an ISO 9001:2000 Certified Company. It is into Application
Development & maintenance. Building & Implementation of packaged software
across various functions within the Financial Services Industry is at its core. It
also provides data center services which include hosting of websites, applications
& related services. It combines a unique delivery model infused by a distinct
culture of customer satisfaction.
Ravisha Financial Services Pvt. Ltd. [RFSL]
RFSL is a RBI registered NBFC engaged in financing, primarily it
provides loan against securities.
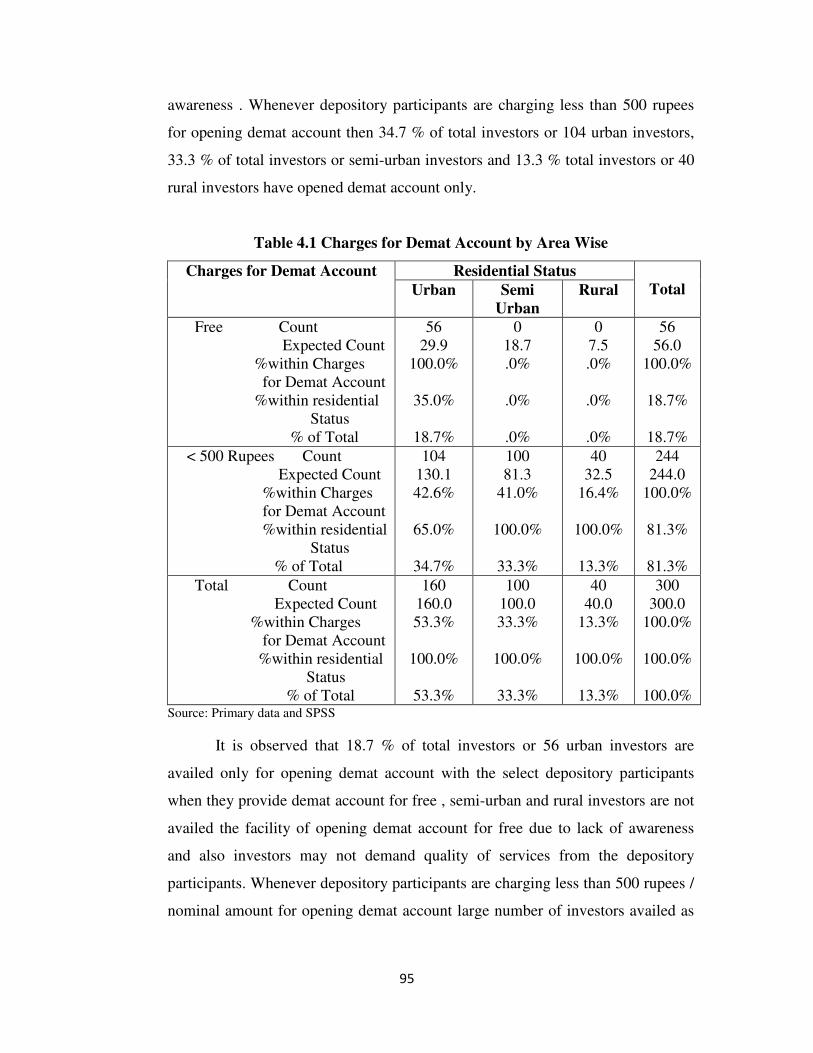
Demat Account Charges
The charges for opening demat account definitely influence the
membership of the depository participants. If they provide demat account for free
then membership also increases as large number of small investors are attracted.
If depository participant’s charges for opening demat account then their
membership decreases as high net worth investors are attracted only. For instance
in the table 4.1, when ever depository participants are providing demat account
for free then 18.7 % of total investors or 56 investors of urban area responded
only where as semi urban and rural investors are not responded due to lack of
95
awareness . Whenever depository participants are charging less than 500 rupees
for opening demat account then 34.7 % of total investors or 104 urban investors,
33.3 % of total investors or semi-urban investors and 13.3 % total investors or 40
rural investors have opened demat account only.
Table 4.1 Charges for Demat Account by Area Wise
Charges for Demat Account Residential Status
Total Urban Semi
Urban
Rural
Free Count
Expected Count
%within Charges
for Demat Account
%within residential
Status
% of Total
56
29.9
100.0%
35.0%
18.7%
0
18.7
.0%
.0%
.0%
0
7.5
.0%
.0%
.0%
56
56.0
100.0%
18.7%
18.7%
< 500 Rupees Count
Expected Count
%within Charges
for Demat Account
%within residential
Status
% of Total
104
130.1
42.6%
65.0%
34.7%
100
81.3
41.0%
100.0%
33.3%
40
32.5
16.4%
100.0%
13.3%
244
244.0
100.0%
81.3%
81.3%
Total Count
Expected Count
%within Charges
for Demat Account
%within residential
Status
% of Total
160
160.0
53.3%
100.0%
53.3%
100
100.0
33.3%
100.0%
33.3%
40
40.0
13.3%
100.0%
13.3%
300
300.0
100.0%
100.0%
100.0% Source: Primary data and SPSS
It is observed that 18.7 % of total investors or 56 urban investors are
availed only for opening demat account with the select depository participants
when they provide demat account for free , semi-urban and rural investors are not
availed the facility of opening demat account for free due to lack of awareness
and also investors may not demand quality of services from the depository
participants. Whenever depository participants are charging less than 500 rupees /
nominal amount for opening demat account large number of investors availed as
96
investors can demand quality of services from the concerned depository
participants.
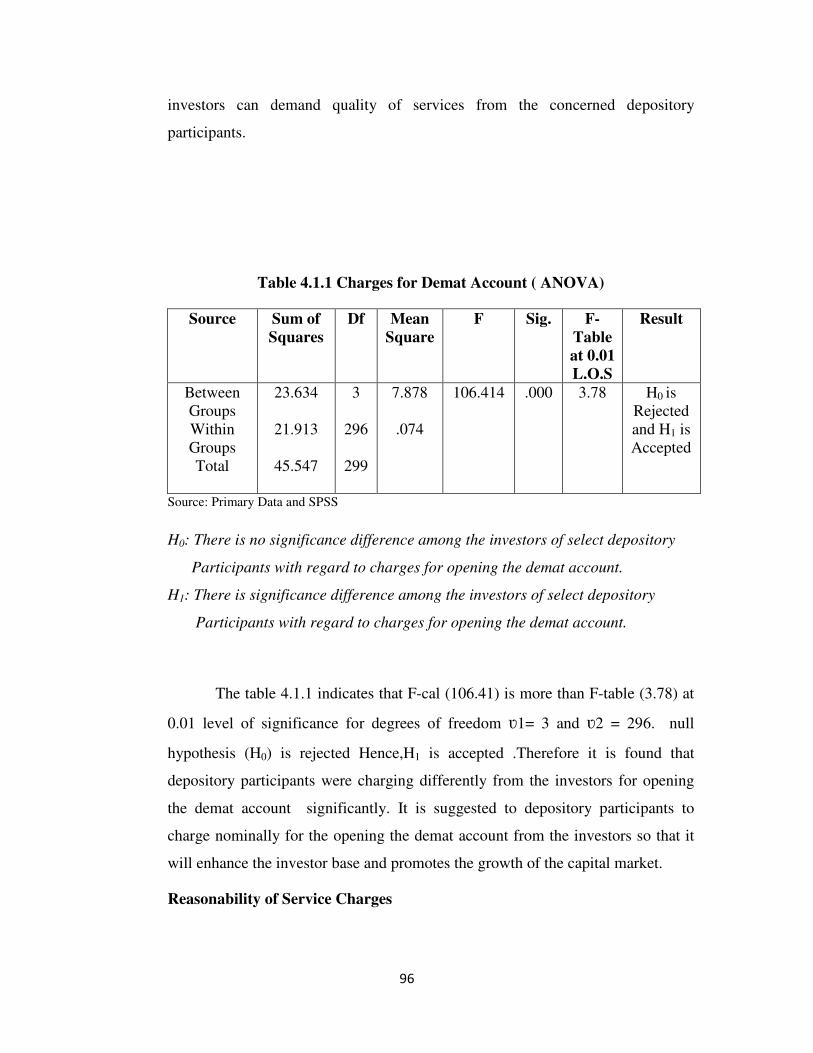
Table 4.1.1 Charges for Demat Account ( ANOVA)
Source Sum of
Squares
Df Mean
Square
F Sig. F-
Table
at 0.01
L.O.S
Result
Between
Groups
Within
Groups
Total
23.634
21.913
45.547
3
296
299
7.878
.074
106.414 .000 3.78 H0 is
Rejected
and H1 is
Accepted
Source: Primary Data and SPSS
H0: There is no significance difference among the investors of select depository
Participants with regard to charges for opening the demat account.
H1: There is significance difference among the investors of select depository
Participants with regard to charges for opening the demat account.
The table 4.1.1 indicates that F-cal (106.41) is more than F-table (3.78) at
0.01 level of significance for degrees of freedom ʋ1= 3 and ʋ2 = 296. null
hypothesis (H0) is rejected Hence,H1 is accepted .Therefore it is found that
depository participants were charging differently from the investors for opening
the demat account significantly. It is suggested to depository participants to
charge nominally for the opening the demat account from the investors so that it
will enhance the investor base and promotes the growth of the capital market.
Reasonability of Service Charges
97
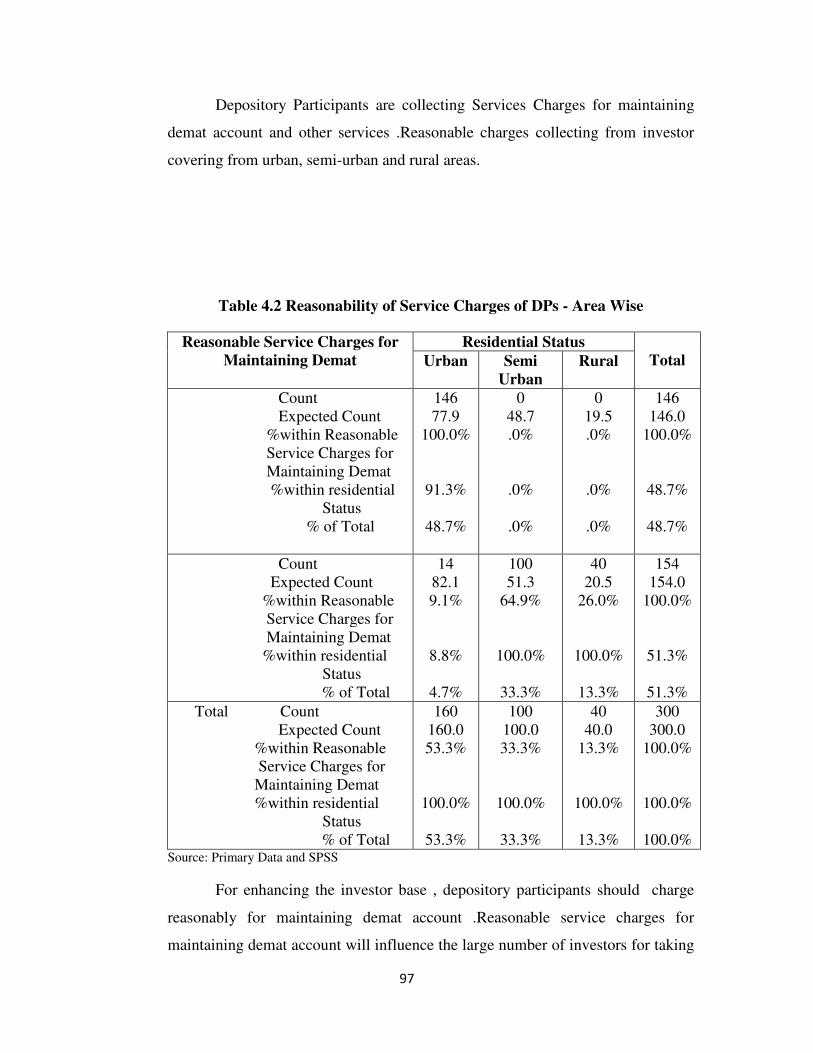
Depository Participants are collecting Services Charges for maintaining
demat account and other services .Reasonable charges collecting from investor
covering from urban, semi-urban and rural areas.
Table 4.2 Reasonability of Service Charges of DPs - Area Wise
Reasonable Service Charges for
Maintaining Demat
Residential Status
Total Urban Semi
Urban
Rural
Count
Expected Count
%within Reasonable
Service Charges for
Maintaining Demat
%within residential
Status
% of Total
146
77.9
100.0%
91.3%
48.7%
0
48.7
.0%
.0%
.0%
0
19.5
.0%
.0%
.0%
146
146.0
100.0%
48.7%
48.7%
Count
Expected Count
%within Reasonable
Service Charges for
Maintaining Demat
%within residential
Status
% of Total
14
82.1
9.1%
8.8%
4.7%
100
51.3
64.9%
100.0%
33.3%
40
20.5
26.0%
100.0%
13.3%
154
154.0
100.0%
51.3%
51.3%
Total Count
Expected Count
%within Reasonable
Service Charges for
Maintaining Demat
%within residential
Status
% of Total
160
160.0
53.3%
100.0%
53.3%
100
100.0
33.3%
100.0%
33.3%
40
40.0
13.3%
100.0%
13.3%
300
300.0
100.0%
100.0%
100.0% Source: Primary Data and SPSS
For enhancing the investor base , depository participants should charge
reasonably for maintaining demat account .Reasonable service charges for
maintaining demat account will influence the large number of investors for taking
98
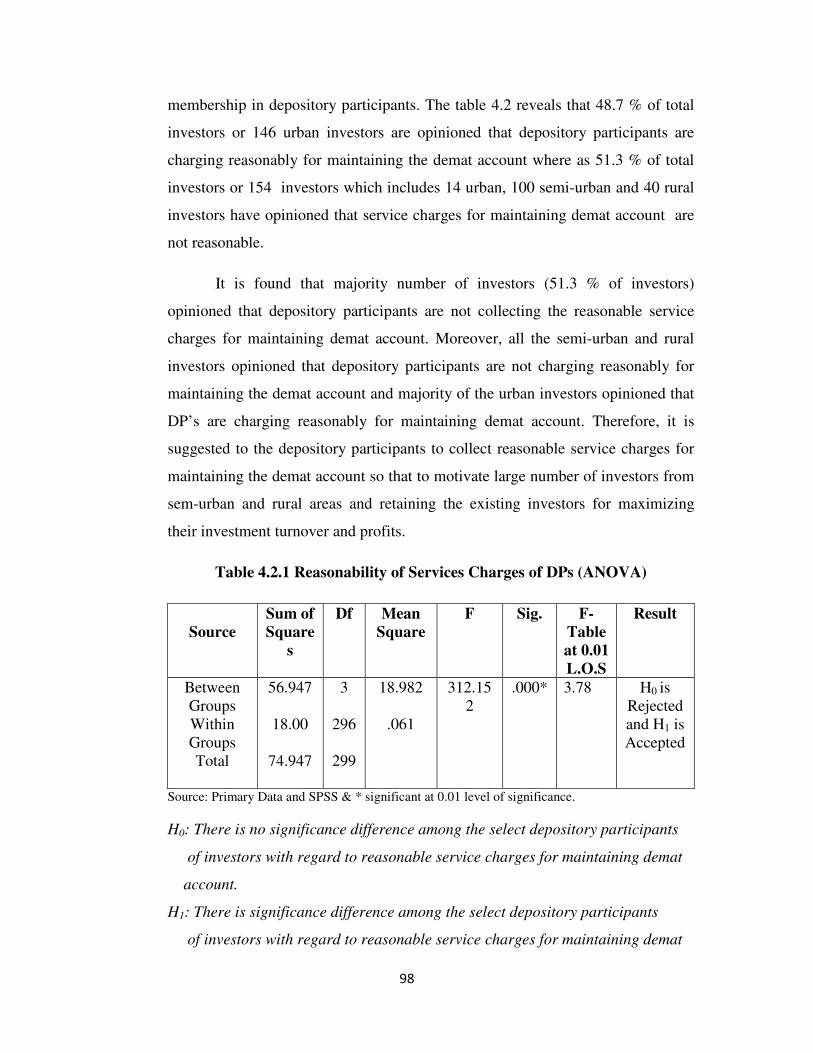
membership in depository participants. The table 4.2 reveals that 48.7 % of total
investors or 146 urban investors are opinioned that depository participants are
charging reasonably for maintaining the demat account where as 51.3 % of total
investors or 154 investors which includes 14 urban, 100 semi-urban and 40 rural
investors have opinioned that service charges for maintaining demat account are
not reasonable.
It is found that majority number of investors (51.3 % of investors)
opinioned that depository participants are not collecting the reasonable service
charges for maintaining demat account. Moreover, all the semi-urban and rural
investors opinioned that depository participants are not charging reasonably for
maintaining the demat account and majority of the urban investors opinioned that
DP’s are charging reasonably for maintaining demat account. Therefore, it is
suggested to the depository participants to collect reasonable service charges for
maintaining the demat account so that to motivate large number of investors from
sem-urban and rural areas and retaining the existing investors for maximizing
their investment turnover and profits.
Table 4.2.1 Reasonability of Services Charges of DPs (ANOVA)
Source
Sum of
Square
s
Df Mean
Square
F Sig. F-
Table
at 0.01
L.O.S
Result
Between
Groups
Within
Groups
Total
56.947
18.00
74.947
3
296
299
18.982
.061
312.15
2
.000* 3.78 H0 is
Rejected
and H1 is
Accepted
Source: Primary Data and SPSS & * significant at 0.01 level of significance.
H0: There is no significance difference among the select depository participants
of investors with regard to reasonable service charges for maintaining demat
account.
H1: There is significance difference among the select depository participants
of investors with regard to reasonable service charges for maintaining demat
99
account.
The table 4.2.1 indicates that F-cal (312.15) is more than F-table (3.78) at
0.01 level of significance for degrees of freedom ʋ1= 3 and ʋ2 = 296. The null
hypothesis (H0) is rejected and hence, H1 is accepted. It is concluded that there is
significance difference among the select depository participants of investors with
regard to reasonable service charges for maintaining demat account. (or)Therefore
it is found that investor’s opinion towards the reasonable service charges for
maintaining demat account among the select depository participants differed
significantly. It is suggested to the investors to know the average service charges
for maintaining demat account per year before opening account with the
depository participant. It is also suggested to the depository participants that they
should charge nominal /reasonable service charges for maintaining the investors
demat account.
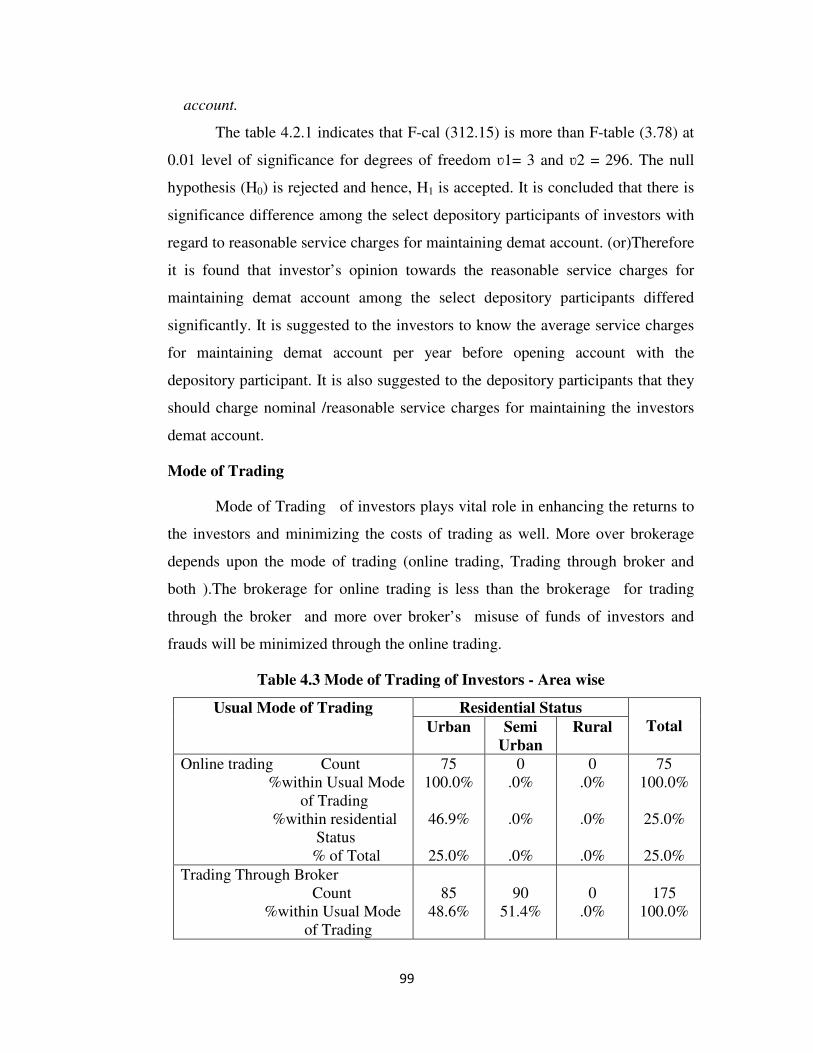
Mode of Trading
Mode of Trading of investors plays vital role in enhancing the returns to
the investors and minimizing the costs of trading as well. More over brokerage
depends upon the mode of trading (online trading, Trading through broker and
both ).The brokerage for online trading is less than the brokerage for trading
through the broker and more over broker’s misuse of funds of investors and
frauds will be minimized through the online trading.
Table 4.3 Mode of Trading of Investors - Area wise
Usual Mode of Trading Residential Status
Total Urban Semi
Urban
Rural
Online trading Count
%within Usual Mode
of Trading
%within residential
Status
% of Total
75
100.0%
46.9%
25.0%
0
.0%
.0%
.0%
0
.0%
.0%
.0%
75
100.0%
25.0%
25.0%
Trading Through Broker
Count
%within Usual Mode
of Trading
85
48.6%
90
51.4%
0
.0%
175
100.0%
100
%within residential
Status
% of Total
53.1%
28.3%
90.0%
30.0%
.0%
.0%
58.3%
58.3%
Both Count
%within Usual Mode
of Trading
%within residential
Status
% of Total
0
.0%
.0%
.0%
10
20.0%
10.0%
3.3%
40
80.0%
100.0%
13.3%
50
100.0%
16.7%
16.7%
Total Count
%within Usual Mode
of Trading
%within residential
Status
% of Total
160
53.3%
100.0%
53.3%
100
33.3%
100.0%
33.3%
40
13.3%
100.0%
13.3%
300
100.0%
100.0%
100.0% Source: Primary Data and SPSS
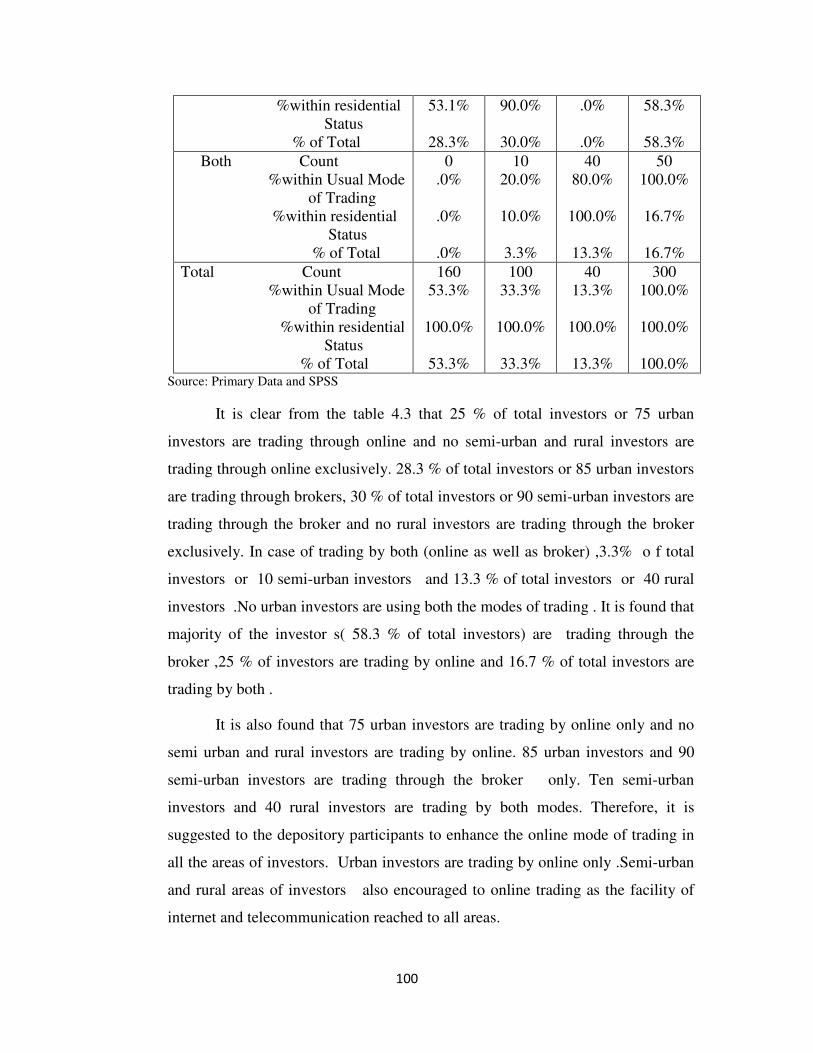
It is clear from the table 4.3 that 25 % of total investors or 75 urban
investors are trading through online and no semi-urban and rural investors are
trading through online exclusively. 28.3 % of total investors or 85 urban investors
are trading through brokers, 30 % of total investors or 90 semi-urban investors are
trading through the broker and no rural investors are trading through the broker
exclusively. In case of trading by both (online as well as broker) ,3.3% o f total
investors or 10 semi-urban investors and 13.3 % of total investors or 40 rural
investors .No urban investors are using both the modes of trading . It is found that
majority of the investor s( 58.3 % of total investors) are trading through the
broker ,25 % of investors are trading by online and 16.7 % of total investors are
trading by both .
It is also found that 75 urban investors are trading by online only and no
semi urban and rural investors are trading by online. 85 urban investors and 90
semi-urban investors are trading through the broker only. Ten semi-urban
investors and 40 rural investors are trading by both modes. Therefore, it is
suggested to the depository participants to enhance the online mode of trading in
all the areas of investors. Urban investors are trading by online only .Semi-urban
and rural areas of investors also encouraged to online trading as the facility of
internet and telecommunication reached to all areas.
101
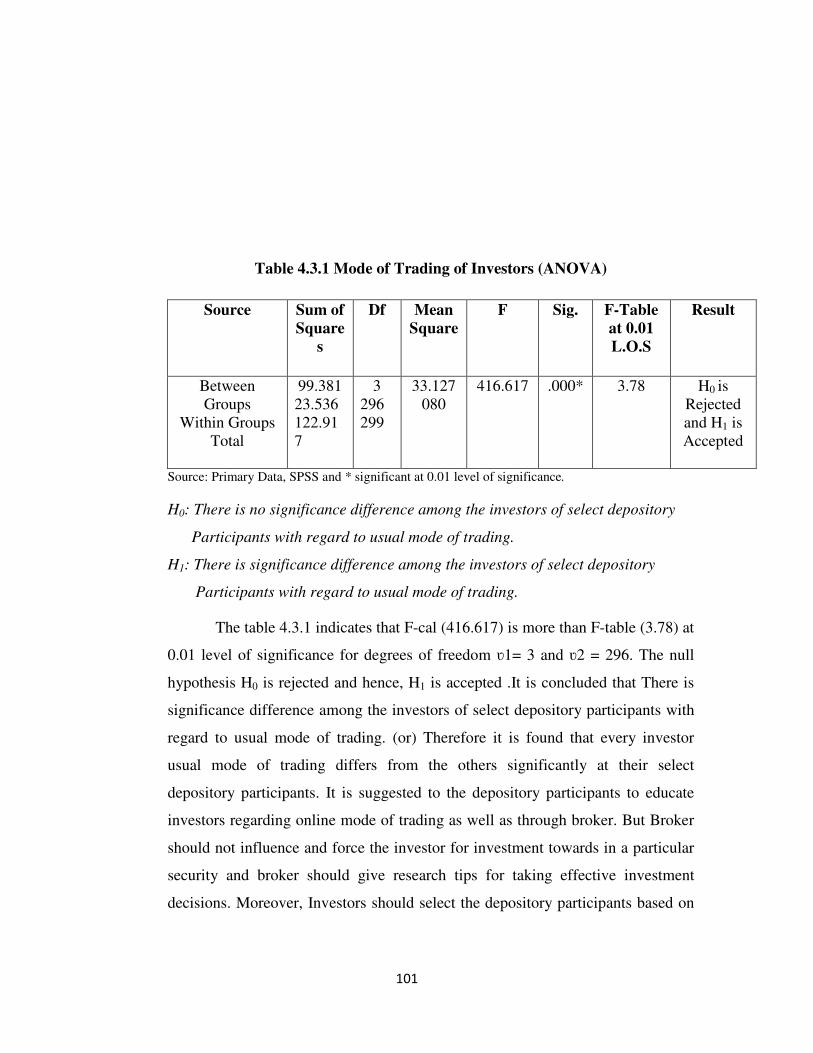
Table 4.3.1 Mode of Trading of Investors (ANOVA)
Source Sum of
Square
s
Df Mean
Square
F Sig. F-Table
at 0.01
L.O.S
Result
Between
Groups
Within Groups
Total
99.381
23.536
122.91
7
3
296
299
33.127
080
416.617 .000* 3.78 H0 is
Rejected
and H1 is
Accepted
Source: Primary Data, SPSS and * significant at 0.01 level of significance.
H0: There is no significance difference among the investors of select depository
Participants with regard to usual mode of trading.
H1: There is significance difference among the investors of select depository
Participants with regard to usual mode of trading.
The table 4.3.1 indicates that F-cal (416.617) is more than F-table (3.78) at
0.01 level of significance for degrees of freedom ʋ1= 3 and ʋ2 = 296. The null
hypothesis H0 is rejected and hence, H1 is accepted .It is concluded that There is
significance difference among the investors of select depository participants with
regard to usual mode of trading. (or) Therefore it is found that every investor
usual mode of trading differs from the others significantly at their select
depository participants. It is suggested to the depository participants to educate
investors regarding online mode of trading as well as through broker. But Broker
should not influence and force the investor for investment towards in a particular
security and broker should give research tips for taking effective investment
decisions. Moreover, Investors should select the depository participants based on
102
quality of investment advisory services which optimize risk and returns with
regard to different modes of trading.
Basis of Investment Decision
Most of the investors use fundamental analysis exclusively or technical
analysis exclusively or both the fundamental and technical analysis for taking
investment decisions. Majority of the investor are using the fundamental analysis
for taking long term investment decisions and technical analysis is used for short
term investment decisions. For taking wise investment decisions investors are
using both fundamental and technical analysis.
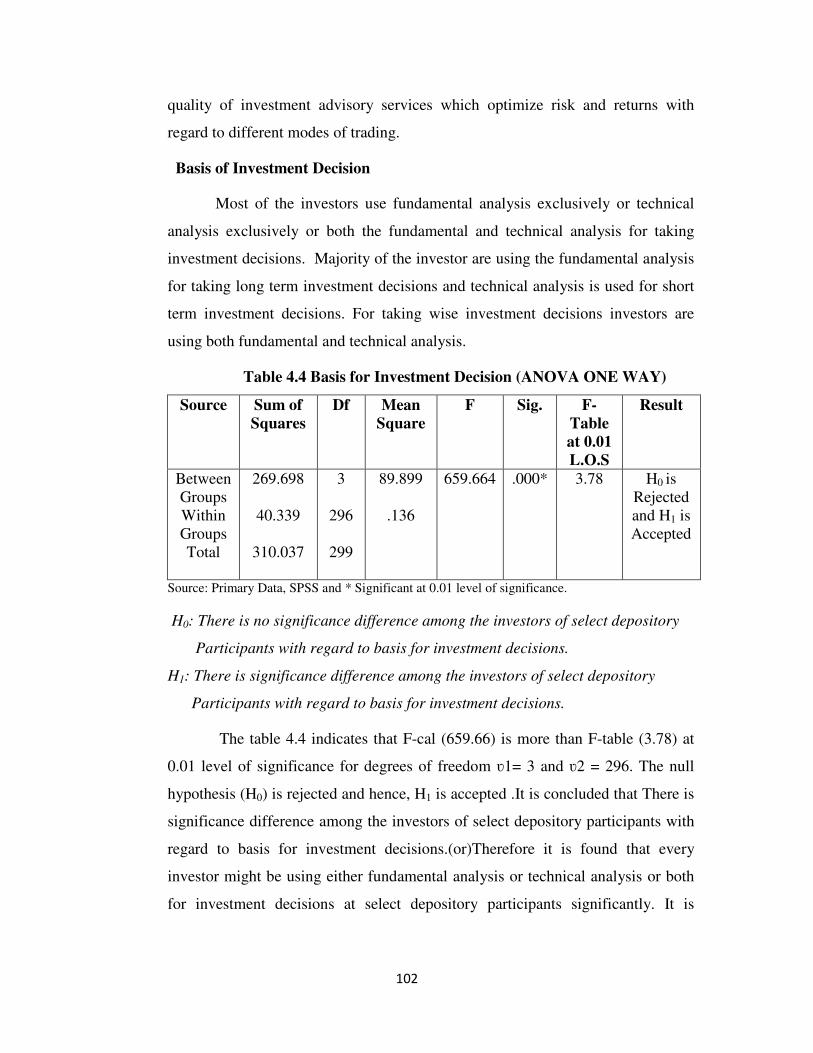
Table 4.4 Basis for Investment Decision (ANOVA ONE WAY)
Source Sum of
Squares
Df Mean
Square
F Sig. F-
Table
at 0.01
L.O.S
Result
Between
Groups
Within
Groups
Total
269.698
40.339
310.037
3
296
299
89.899
.136
659.664 .000* 3.78 H0 is
Rejected
and H1 is
Accepted
Source: Primary Data, SPSS and * Significant at 0.01 level of significance.
H0: There is no significance difference among the investors of select depository
Participants with regard to basis for investment decisions.
H1: There is significance difference among the investors of select depository
Participants with regard to basis for investment decisions.
The table 4.4 indicates that F-cal (659.66) is more than F-table (3.78) at
0.01 level of significance for degrees of freedom ʋ1= 3 and ʋ2 = 296. The null
hypothesis (H0) is rejected and hence, H1 is accepted .It is concluded that There is
significance difference among the investors of select depository participants with
regard to basis for investment decisions.(or)Therefore it is found that every
investor might be using either fundamental analysis or technical analysis or both
for investment decisions at select depository participants significantly. It is
103
suggested that Investors should use both fundamental and technical analysis for
rational investment decisions.
Brokerage for Intraday Trading
Brokerage for intraday is important factor which decides the investment
turnover of the capital market and depository participants as most of the investors
are intraday traders.
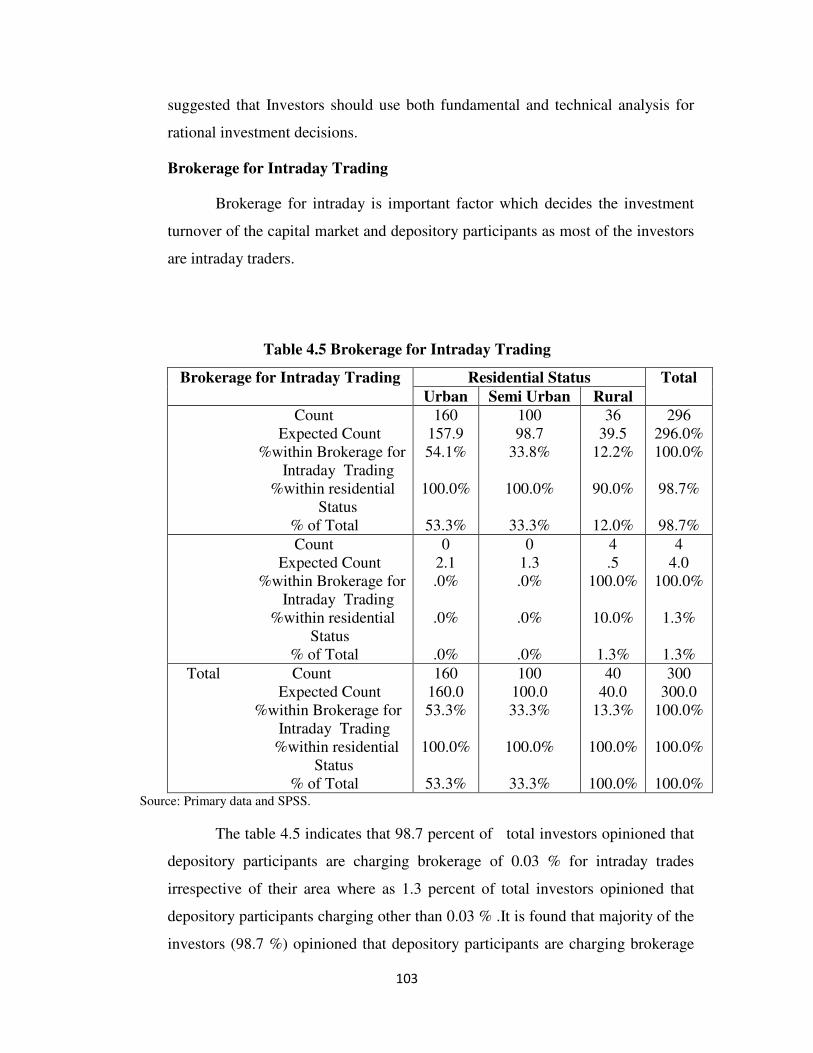
Table 4.5 Brokerage for Intraday Trading
Brokerage for Intraday Trading Residential Status Total
Urban Semi Urban Rural
Count
Expected Count
%within Brokerage for
Intraday Trading
%within residential
Status
% of Total
160
157.9
54.1%
100.0%
53.3%
100
98.7
33.8%
100.0%
33.3%
36
39.5
12.2%
90.0%
12.0%
296
296.0%
100.0%
98.7%
98.7%
Count
Expected Count
%within Brokerage for
Intraday Trading
%within residential
Status
% of Total
0
2.1
.0%
.0%
.0%
0
1.3
.0%
.0%
.0%
4
.5
100.0%
10.0%
1.3%
4
4.0
100.0%
1.3%
1.3%
Total Count
Expected Count
%within Brokerage for
Intraday Trading
%within residential
Status
% of Total
160
160.0
53.3%
100.0%
53.3%
100
100.0
33.3%
100.0%
33.3%
40
40.0
13.3%
100.0%
100.0%
300
300.0
100.0%
100.0%
100.0% Source: Primary data and SPSS.
The table 4.5 indicates that 98.7 percent of total investors opinioned that
depository participants are charging brokerage of 0.03 % for intraday trades
irrespective of their area where as 1.3 percent of total investors opinioned that
depository participants charging other than 0.03 % .It is found that majority of the
investors (98.7 %) opinioned that depository participants are charging brokerage
104
of 0.03 % for intraday trades irrespective of area. It is also observed that 53.3 %
of total investors (160 urban investors) ,33.3 % of total investors (100 semi-
urban investors) and 12 % of investors (36 rural investors) opinioned that
depository participants are charging brokerage for intraday trading to the extent of
0.0 3%. Therefore, it is suggested to the depository participants that they should
levy brokerage uniformly / nominally for intraday trades depending upon the type
of investor , investment amount and residential area , neworth ,etc., so that it
enhances the investment turnover of the depository participants and capital
market.
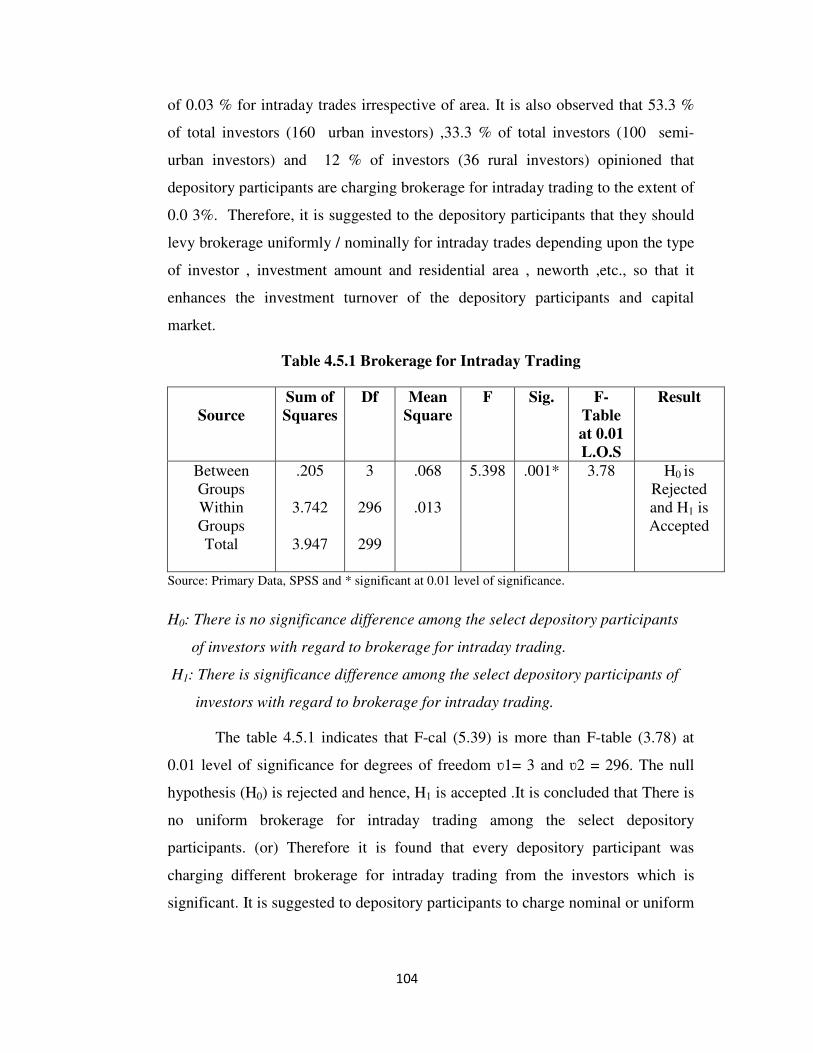
Table 4.5.1 Brokerage for Intraday Trading
Source
Sum of
Squares
Df Mean
Square
F Sig. F-
Table
at 0.01
L.O.S
Result
Between
Groups
Within
Groups
Total
.205
3.742
3.947
3
296
299
.068
.013
5.398 .001* 3.78 H0 is
Rejected
and H1 is
Accepted
Source: Primary Data, SPSS and * significant at 0.01 level of significance.
H0: There is no significance difference among the select depository participants
of investors with regard to brokerage for intraday trading.
H1: There is significance difference among the select depository participants of
investors with regard to brokerage for intraday trading.
The table 4.5.1 indicates that F-cal (5.39) is more than F-table (3.78) at
0.01 level of significance for degrees of freedom ʋ1= 3 and ʋ2 = 296. The null
hypothesis (H0) is rejected and hence, H1 is accepted .It is concluded that There is
no uniform brokerage for intraday trading among the select depository
participants. (or) Therefore it is found that every depository participant was
charging different brokerage for intraday trading from the investors which is
significant. It is suggested to depository participants to charge nominal or uniform
105
brokerage for the intraday trading so that investors will be encouraged for
intraday trading in addition to other types of trading.
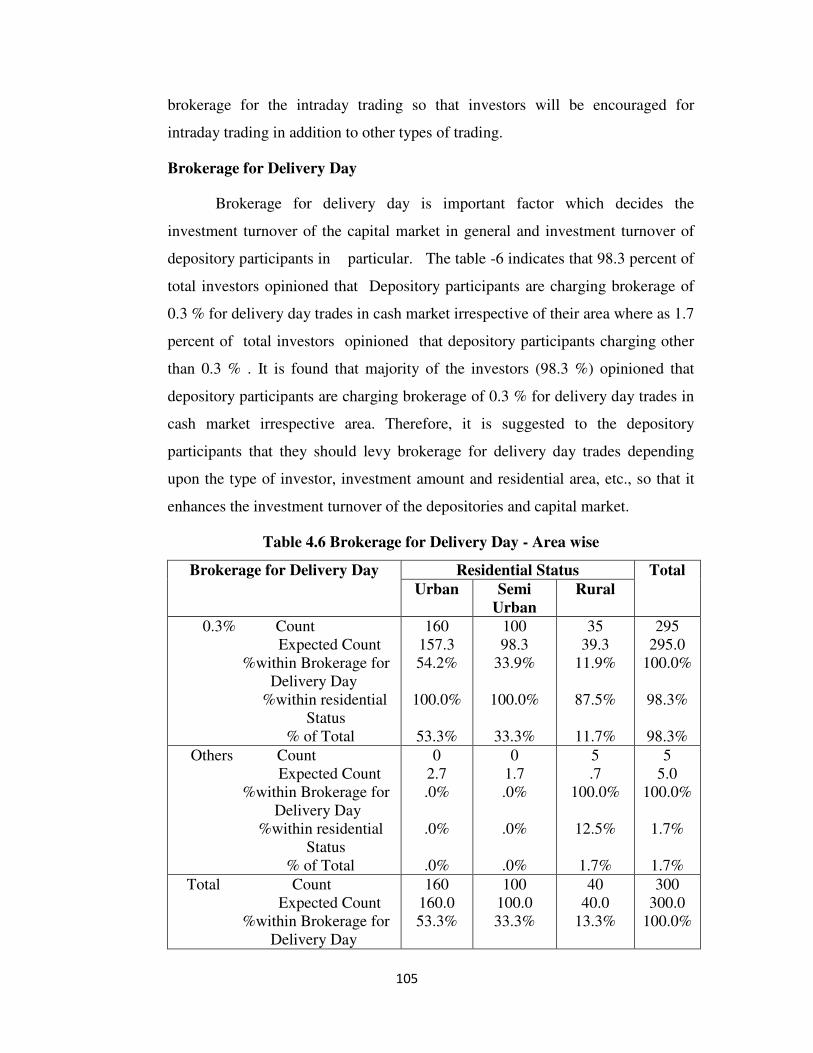
Brokerage for Delivery Day
Brokerage for delivery day is important factor which decides the
investment turnover of the capital market in general and investment turnover of
depository participants in particular. The table -6 indicates that 98.3 percent of
total investors opinioned that Depository participants are charging brokerage of
0.3 % for delivery day trades in cash market irrespective of their area where as 1.7
percent of total investors opinioned that depository participants charging other
than 0.3 % . It is found that majority of the investors (98.3 %) opinioned that
depository participants are charging brokerage of 0.3 % for delivery day trades in
cash market irrespective area. Therefore, it is suggested to the depository
participants that they should levy brokerage for delivery day trades depending
upon the type of investor, investment amount and residential area, etc., so that it
enhances the investment turnover of the depositories and capital market.
Table 4.6 Brokerage for Delivery Day - Area wise
Brokerage for Delivery Day Residential Status Total
Urban Semi
Urban
Rural
0.3% Count
Expected Count
%within Brokerage for
Delivery Day
%within residential
Status
% of Total
160
157.3
54.2%
100.0%
53.3%
100
98.3
33.9%
100.0%
33.3%
35
39.3
11.9%
87.5%
11.7%
295
295.0
100.0%
98.3%
98.3%
Others Count
Expected Count
%within Brokerage for
Delivery Day
%within residential
Status
% of Total
0
2.7
.0%
.0%
.0%
0
1.7
.0%
.0%
.0%
5
.7
100.0%
12.5%
1.7%
5
5.0
100.0%
1.7%
1.7%
Total Count
Expected Count
%within Brokerage for
Delivery Day
160
160.0
53.3%
100
100.0
33.3%
40
40.0
13.3%
300
300.0
100.0%
106
%within residential
Status
% of Total
100.0%
53.3%
100.0%
33.3%
100.0%
13.3%
100.0%
100.0% Source: Primary data and SPSS.
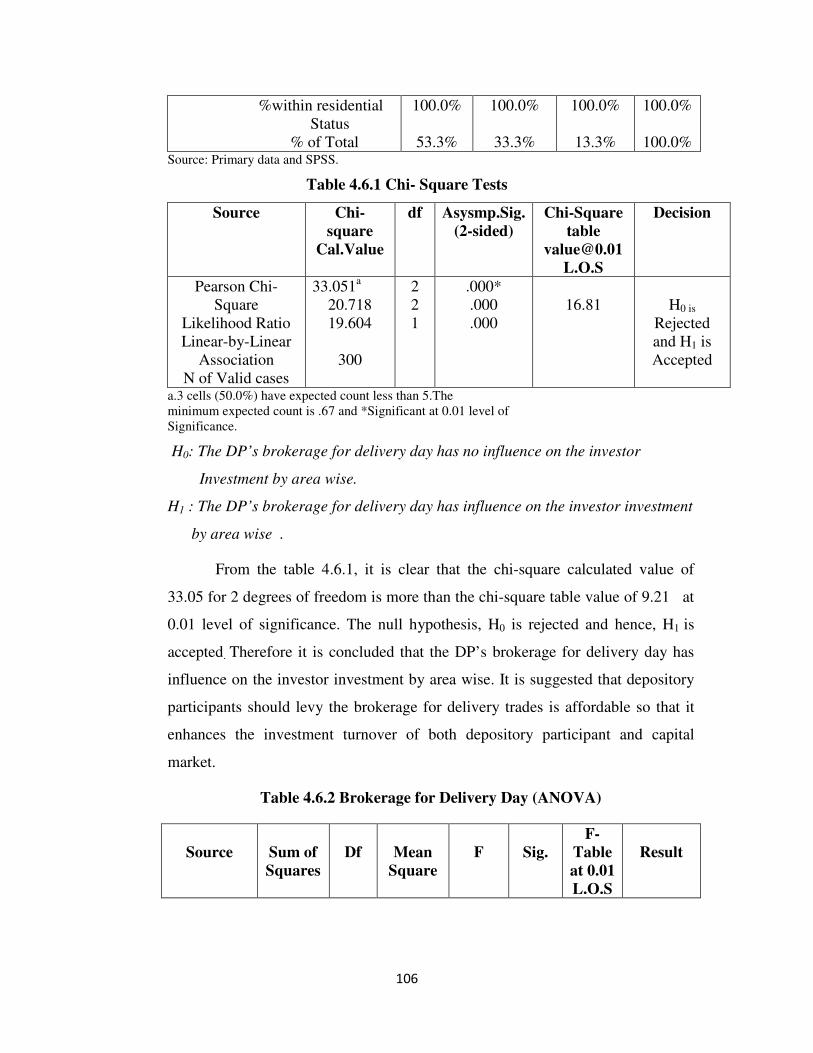
Table 4.6.1 Chi- Square Tests
Source Chi-
square
Cal.Value
df Asysmp.Sig.
(2-sided)
Chi-Square
table
L.O.S
Decision
Pearson Chi-
Square
Likelihood Ratio
Linear-by-Linear
Association
N of Valid cases
33.051a
20.718
19.604
300
2
2
1
.000*
.000
.000
16.81
H0 is
Rejected
and H1 is
Accepted
a.3 cells (50.0%) have expected count less than 5.The
minimum expected count is .67 and *Significant at 0.01 level of
Significance.
H0: The DP’s brokerage for delivery day has no influence on the investor
Investment by area wise.
H1 : The DP’s brokerage for delivery day has influence on the investor investment
by area wise .
From the table 4.6.1, it is clear that the chi-square calculated value of
33.05 for 2 degrees of freedom is more than the chi-square table value of 9.21 at
0.01 level of significance. The null hypothesis, H0 is rejected and hence, H1 is
accepted. Therefore it is concluded that the DP’s brokerage for delivery day has
influence on the investor investment by area wise. It is suggested that depository
participants should levy the brokerage for delivery trades is affordable so that it
enhances the investment turnover of both depository participant and capital
market.
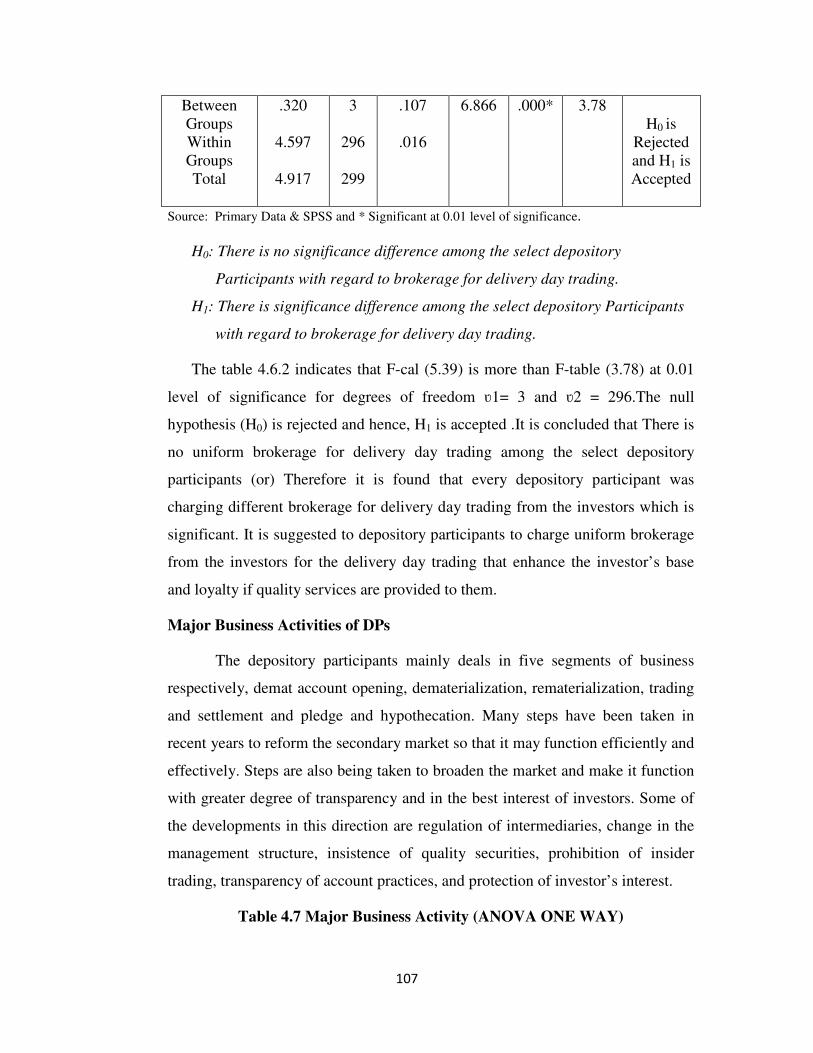
Table 4.6.2 Brokerage for Delivery Day (ANOVA)
Source
Sum of
Squares
Df
Mean
Square
F
Sig.
F-
Table
at 0.01
L.O.S
Result
107
Between
Groups
Within
Groups
Total
.320
4.597
4.917
3
296
299
.107
.016
6.866 .000* 3.78
H0 is
Rejected
and H1 is
Accepted
Source: Primary Data & SPSS and * Significant at 0.01 level of significance.
H0: There is no significance difference among the select depository
Participants with regard to brokerage for delivery day trading.
H1: There is significance difference among the select depository Participants
with regard to brokerage for delivery day trading.
The table 4.6.2 indicates that F-cal (5.39) is more than F-table (3.78) at 0.01
level of significance for degrees of freedom ʋ1= 3 and ʋ2 = 296.The null
hypothesis (H0) is rejected and hence, H1 is accepted .It is concluded that There is
no uniform brokerage for delivery day trading among the select depository
participants (or) Therefore it is found that every depository participant was
charging different brokerage for delivery day trading from the investors which is
significant. It is suggested to depository participants to charge uniform brokerage
from the investors for the delivery day trading that enhance the investor’s base
and loyalty if quality services are provided to them.
Major Business Activities of DPs
The depository participants mainly deals in five segments of business
respectively, demat account opening, dematerialization, rematerialization, trading
and settlement and pledge and hypothecation. Many steps have been taken in
recent years to reform the secondary market so that it may function efficiently and
effectively. Steps are also being taken to broaden the market and make it function
with greater degree of transparency and in the best interest of investors. Some of
the developments in this direction are regulation of intermediaries, change in the
management structure, insistence of quality securities, prohibition of insider
trading, transparency of account practices, and protection of investor’s interest.
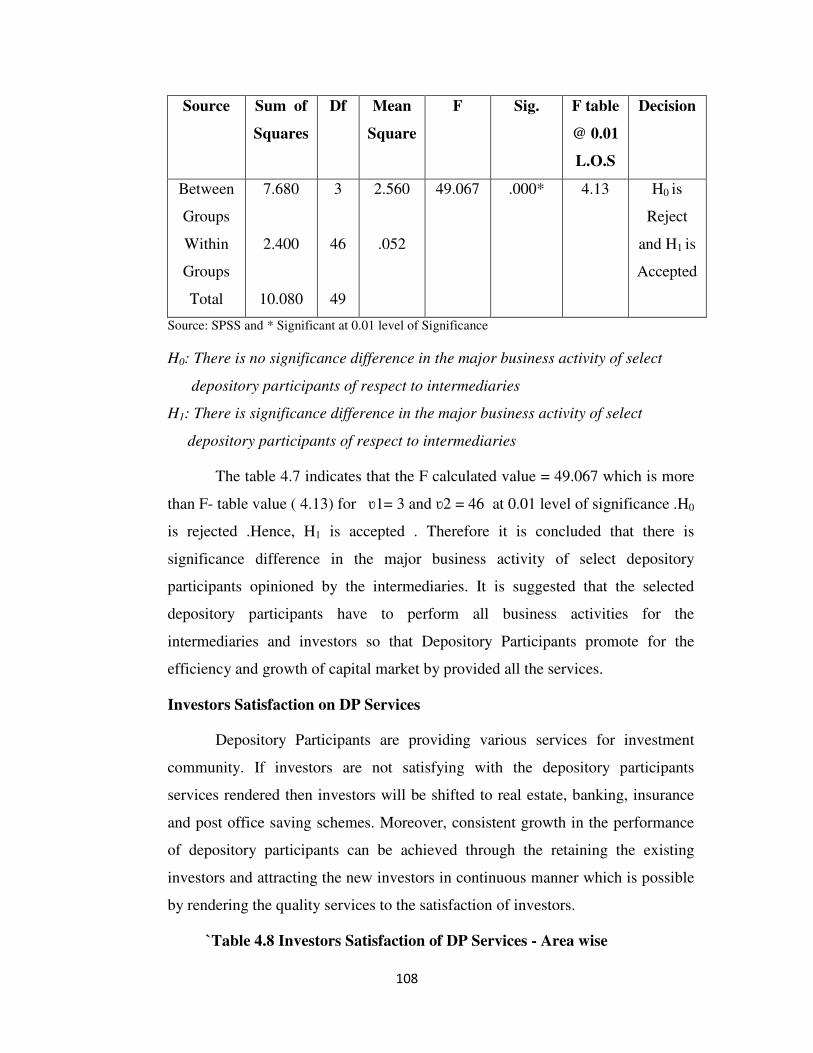
Table 4.7 Major Business Activity (ANOVA ONE WAY)
108
Source Sum of
Squares
Df Mean
Square
F Sig. F table
@ 0.01
L.O.S
Decision
Between
Groups
Within
Groups
Total
7.680
2.400
10.080
3
46
49
2.560
.052
49.067 .000* 4.13 H0 is
Reject
and H1 is
Accepted
Source: SPSS and * Significant at 0.01 level of Significance
H0: There is no significance difference in the major business activity of select
depository participants of respect to intermediaries
H1: There is significance difference in the major business activity of select
depository participants of respect to intermediaries
The table 4.7 indicates that the F calculated value = 49.067 which is more
than F- table value ( 4.13) for ʋ1= 3 and ʋ2 = 46 at 0.01 level of significance .H0
is rejected .Hence, H1 is accepted . Therefore it is concluded that there is
significance difference in the major business activity of select depository
participants opinioned by the intermediaries. It is suggested that the selected
depository participants have to perform all business activities for the
intermediaries and investors so that Depository Participants promote for the
efficiency and growth of capital market by provided all the services.
Investors Satisfaction on DP Services
Depository Participants are providing various services for investment
community. If investors are not satisfying with the depository participants
services rendered then investors will be shifted to real estate, banking, insurance
and post office saving schemes. Moreover, consistent growth in the performance
of depository participants can be achieved through the retaining the existing
investors and attracting the new investors in continuous manner which is possible
by rendering the quality services to the satisfaction of investors.
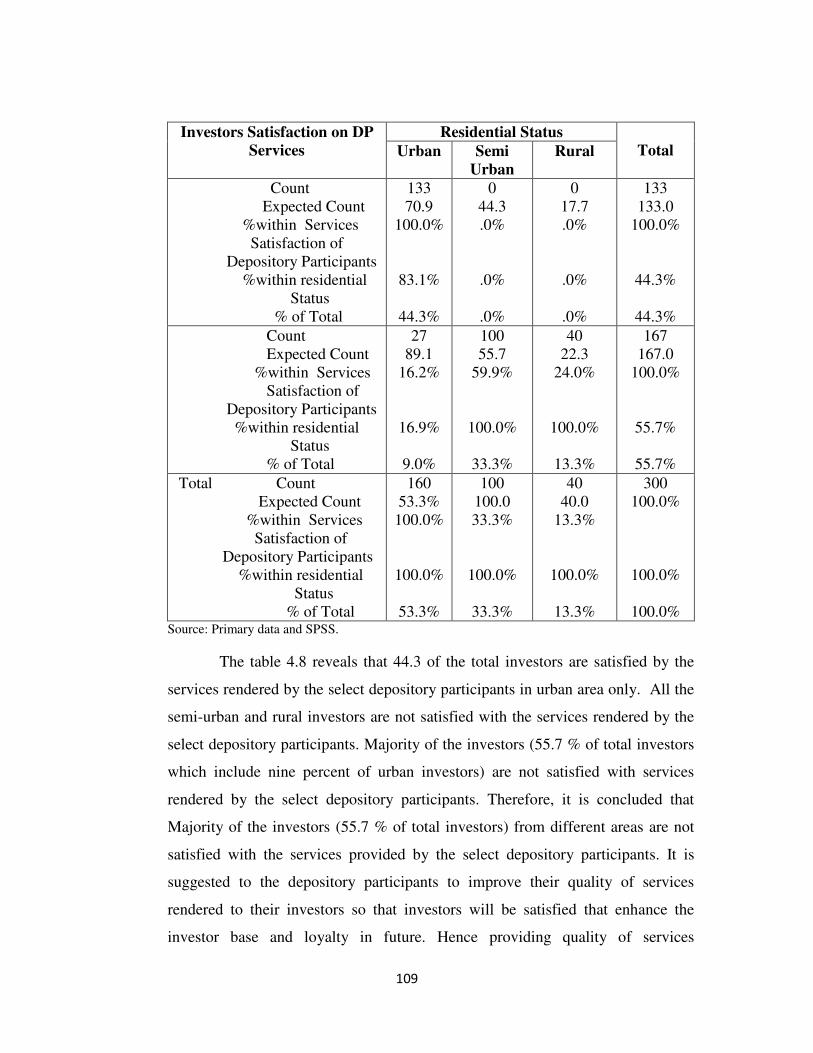
`Table 4.8 Investors Satisfaction of DP Services - Area wise
109
Investors Satisfaction on DP
Services
Residential Status
Total Urban Semi
Urban
Rural
Count
Expected Count
%within Services
Satisfaction of
Depository Participants
%within residential
Status
% of Total
133
70.9
100.0%
83.1%
44.3%
0
44.3
.0%
.0%
.0%
0
17.7
.0%
.0%
.0%
133
133.0
100.0%
44.3%
44.3%
Count
Expected Count
%within Services
Satisfaction of
Depository Participants
%within residential
Status
% of Total
27
89.1
16.2%
16.9%
9.0%
100
55.7
59.9%
100.0%
33.3%
40
22.3
24.0%
100.0%
13.3%
167
167.0
100.0%
55.7%
55.7%
Total Count
Expected Count
%within Services
Satisfaction of
Depository Participants
%within residential
Status
% of Total
160
53.3%
100.0%
100.0%
53.3%
100
100.0
33.3%
100.0%
33.3%
40
40.0
13.3%
100.0%
13.3%
300
100.0%
100.0%
100.0% Source: Primary data and SPSS.
The table 4.8 reveals that 44.3 of the total investors are satisfied by the
services rendered by the select depository participants in urban area only. All the
semi-urban and rural investors are not satisfied with the services rendered by the
select depository participants. Majority of the investors (55.7 % of total investors
which include nine percent of urban investors) are not satisfied with services
rendered by the select depository participants. Therefore, it is concluded that
Majority of the investors (55.7 % of total investors) from different areas are not
satisfied with the services provided by the select depository participants. It is
suggested to the depository participants to improve their quality of services
rendered to their investors so that investors will be satisfied that enhance the
investor base and loyalty in future. Hence providing quality of services
110
consistently is the key for improving the satisfaction of investors and enhancing
the performance of depository participants.
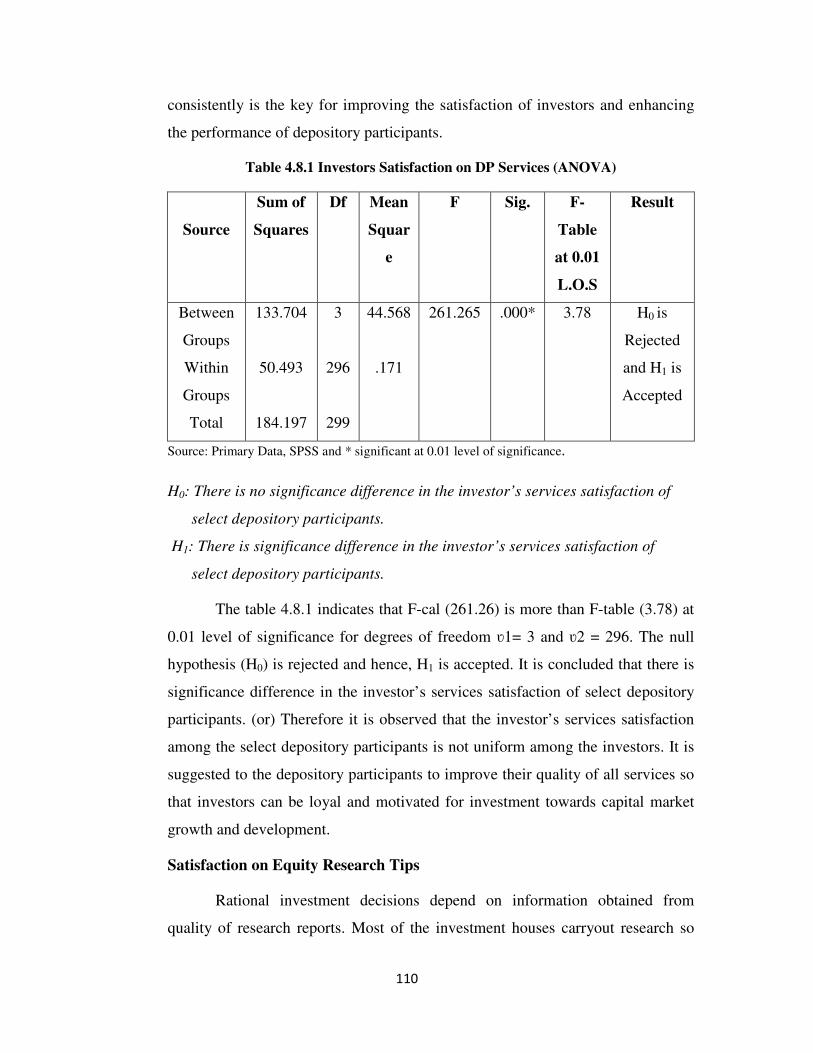
Table 4.8.1 Investors Satisfaction on DP Services (ANOVA)
Source
Sum of
Squares
Df Mean
Squar
e
F Sig. F-
Table
at 0.01
L.O.S
Result
Between
Groups
Within
Groups
Total
133.704
50.493
184.197
3
296
299
44.568
.171
261.265 .000* 3.78 H0 is
Rejected
and H1 is
Accepted
Source: Primary Data, SPSS and * significant at 0.01 level of significance.
H0: There is no significance difference in the investor’s services satisfaction of
select depository participants.
H1: There is significance difference in the investor’s services satisfaction of
select depository participants.
The table 4.8.1 indicates that F-cal (261.26) is more than F-table (3.78) at
0.01 level of significance for degrees of freedom ʋ1= 3 and ʋ2 = 296. The null
hypothesis (H0) is rejected and hence, H1 is accepted. It is concluded that there is
significance difference in the investor’s services satisfaction of select depository
participants. (or) Therefore it is observed that the investor’s services satisfaction
among the select depository participants is not uniform among the investors. It is
suggested to the depository participants to improve their quality of all services so
that investors can be loyal and motivated for investment towards capital market
growth and development.
Satisfaction on Equity Research Tips
Rational investment decisions depend on information obtained from
quality of research reports. Most of the investment houses carryout research so
111
that to provide research tips or information to their investors for taking rational
investment decisions that enhances the returns and minimizes the risk involved in
the investment decisions. It is a challenging task for the investment houses to
provide quality research tips to their investor’s .More over investors satisfaction
largely depends on research tips / information related to investment decisions.
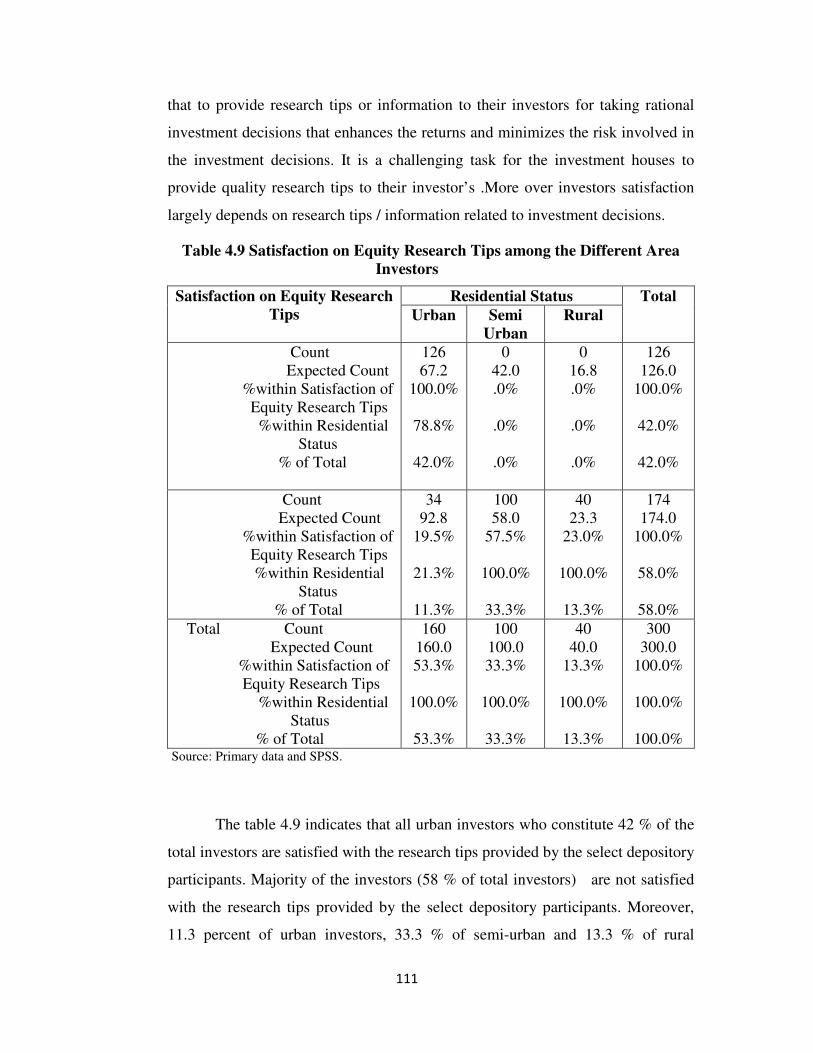
Table 4.9 Satisfaction on Equity Research Tips among the Different Area
Investors
Satisfaction on Equity Research
Tips
Residential Status Total
Urban Semi
Urban
Rural
Count
Expected Count
%within Satisfaction of
Equity Research Tips
%within Residential
Status
% of Total
126
67.2
100.0%
78.8%
42.0%
0
42.0
.0%
.0%
.0%
0
16.8
.0%
.0%
.0%
126
126.0
100.0%
42.0%
42.0%
Count
Expected Count
%within Satisfaction of
Equity Research Tips
%within Residential
Status
% of Total
34
92.8
19.5%
21.3%
11.3%
100
58.0
57.5%
100.0%
33.3%
40
23.3
23.0%
100.0%
13.3%
174
174.0
100.0%
58.0%
58.0%
Total Count
Expected Count
%within Satisfaction of
Equity Research Tips
%within Residential
Status
% of Total
160
160.0
53.3%
100.0%
53.3%
100
100.0
33.3%
100.0%
33.3%
40
40.0
13.3%
100.0%
13.3%
300
300.0
100.0%
100.0%
100.0% Source: Primary data and SPSS.
The table 4.9 indicates that all urban investors who constitute 42 % of the
total investors are satisfied with the research tips provided by the select depository
participants. Majority of the investors (58 % of total investors) are not satisfied
with the research tips provided by the select depository participants. Moreover,
11.3 percent of urban investors, 33.3 % of semi-urban and 13.3 % of rural
112
investors are not satisfied with the research tips provided by the select depository
participants. Therefore, it is observed that majority (58 % of total investors) of
investors which include 11.3 % of total investors from urban area; all semi-urban
and rural investors are not satisfied with the research tips provided by the select
depository participants. In this regard, it is suggested to the depository
participants to improve the quality of research tips so that it provides quality of
investment information to their investors for taking wise investment decisions that
optimize the returns and risk to the investors and also satisfies the investor
community.
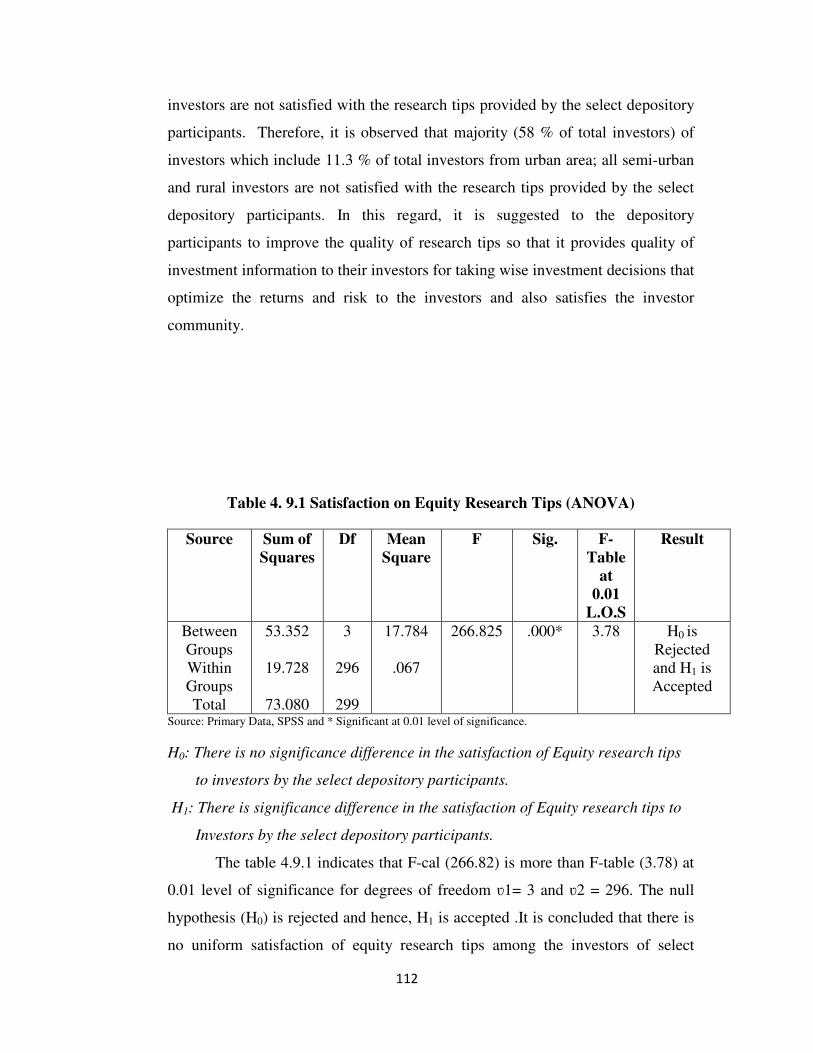
Table 4. 9.1 Satisfaction on Equity Research Tips (ANOVA)
Source Sum of
Squares
Df Mean
Square
F Sig. F-
Table
at
0.01
L.O.S
Result
Between
Groups
Within
Groups
Total
53.352
19.728
73.080
3
296
299
17.784
.067
266.825 .000* 3.78 H0 is
Rejected
and H1 is
Accepted
Source: Primary Data, SPSS and * Significant at 0.01 level of significance.
H0: There is no significance difference in the satisfaction of Equity research tips
to investors by the select depository participants.
H1: There is significance difference in the satisfaction of Equity research tips to
Investors by the select depository participants.
The table 4.9.1 indicates that F-cal (266.82) is more than F-table (3.78) at
0.01 level of significance for degrees of freedom ʋ1= 3 and ʋ2 = 296. The null
hypothesis (H0) is rejected and hence, H1 is accepted .It is concluded that there is
no uniform satisfaction of equity research tips among the investors of select
113
depository participants. It is suggested to depository participants that to provide
quality of equity research tips to the investors for improving their satisfaction and
enhancing the investors’ confidence.
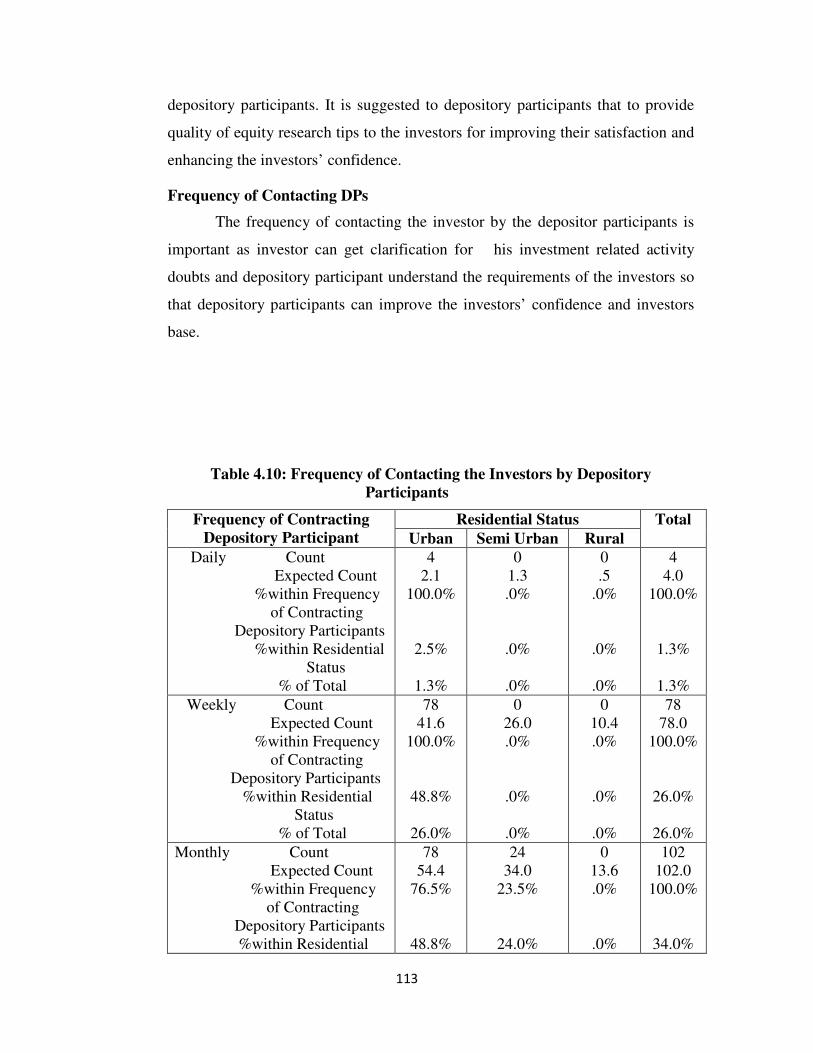
Frequency of Contacting DPs
The frequency of contacting the investor by the depositor participants is
important as investor can get clarification for his investment related activity
doubts and depository participant understand the requirements of the investors so
that depository participants can improve the investors’ confidence and investors
base.
Table 4.10: Frequency of Contacting the Investors by Depository
Participants
Frequency of Contracting
Depository Participant
Residential Status Total
Urban Semi Urban Rural
Daily Count
Expected Count
%within Frequency
of Contracting
Depository Participants
%within Residential
Status
% of Total
4
2.1
100.0%
2.5%
1.3%
0
1.3
.0%
.0%
.0%
0
.5
.0%
.0%
.0%
4
4.0
100.0%
1.3%
1.3%
Weekly Count
Expected Count
%within Frequency
of Contracting
Depository Participants
%within Residential
Status
% of Total
78
41.6
100.0%
48.8%
26.0%
0
26.0
.0%
.0%
.0%
0
10.4
.0%
.0%
.0%
78
78.0
100.0%
26.0%
26.0%
Monthly Count
Expected Count
%within Frequency
of Contracting
Depository Participants
%within Residential
78
54.4
76.5%
48.8%
24
34.0
23.5%
24.0%
0
13.6
.0%
.0%
102
102.0
100.0%
34.0%
114
Status
% of Total
26.0%
8.0%
.0%
34.0%
Rarely Count
Expected Count
%within Frequency
of Contracting
Depository Participants
%within Residential
Status
% of Total
0
61.9
.0%
.0%
.0%
76
38.7
65.5%
76.0%
25.3%
40
15.5
34.5%
100.0%
13.3%
116
116.0
100.0%
38.7%
38.7%
Total Count
Expected Count
%within Frequency
of Contracting
Depository Participants
%within Residential
Status
% of Total
160
160.0
53.3%
100.0%
53.3%
100
100.0
33.3%
100.0%
33.3%
40
40.0
13.3%
100.0%
13.3%
300
300.0
100.0%
100.0%
100.0% Source: Primary Data and SPSS
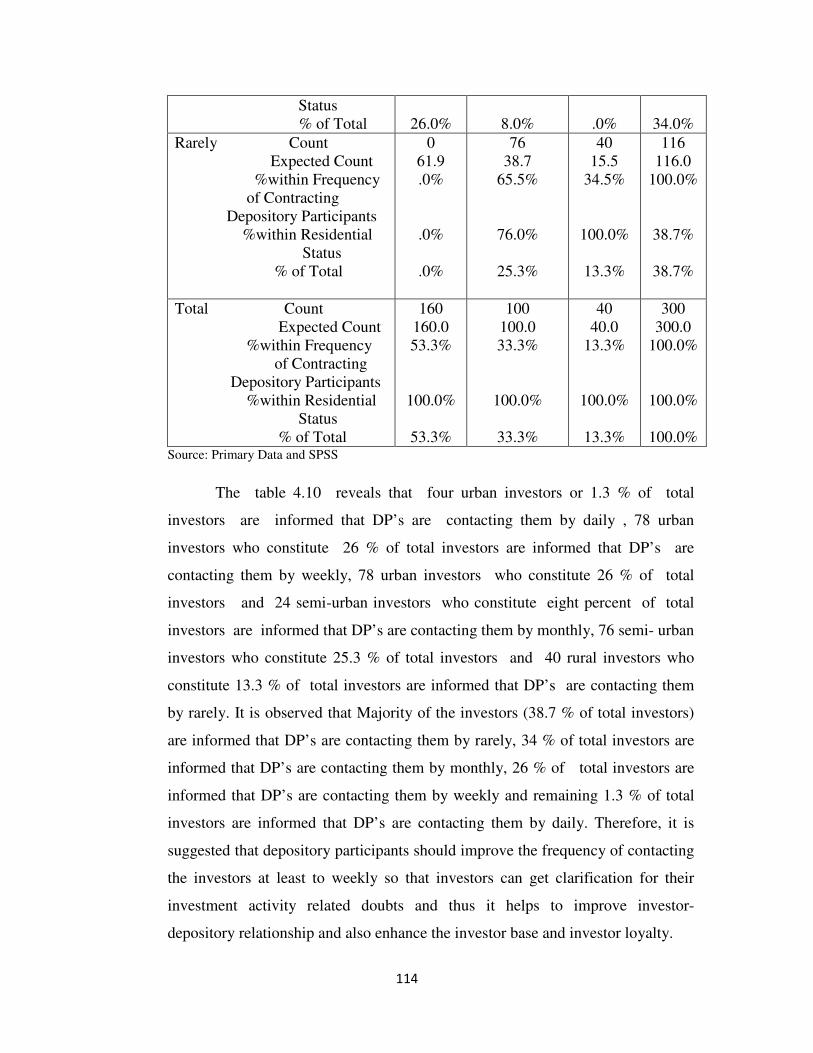
The table 4.10 reveals that four urban investors or 1.3 % of total
investors are informed that DP’s are contacting them by daily , 78 urban
investors who constitute 26 % of total investors are informed that DP’s are
contacting them by weekly, 78 urban investors who constitute 26 % of total
investors and 24 semi-urban investors who constitute eight percent of total
investors are informed that DP’s are contacting them by monthly, 76 semi- urban
investors who constitute 25.3 % of total investors and 40 rural investors who
constitute 13.3 % of total investors are informed that DP’s are contacting them
by rarely. It is observed that Majority of the investors (38.7 % of total investors)
are informed that DP’s are contacting them by rarely, 34 % of total investors are
informed that DP’s are contacting them by monthly, 26 % of total investors are
informed that DP’s are contacting them by weekly and remaining 1.3 % of total
investors are informed that DP’s are contacting them by daily. Therefore, it is
suggested that depository participants should improve the frequency of contacting
the investors at least to weekly so that investors can get clarification for their
investment activity related doubts and thus it helps to improve investor-
depository relationship and also enhance the investor base and investor loyalty.
115
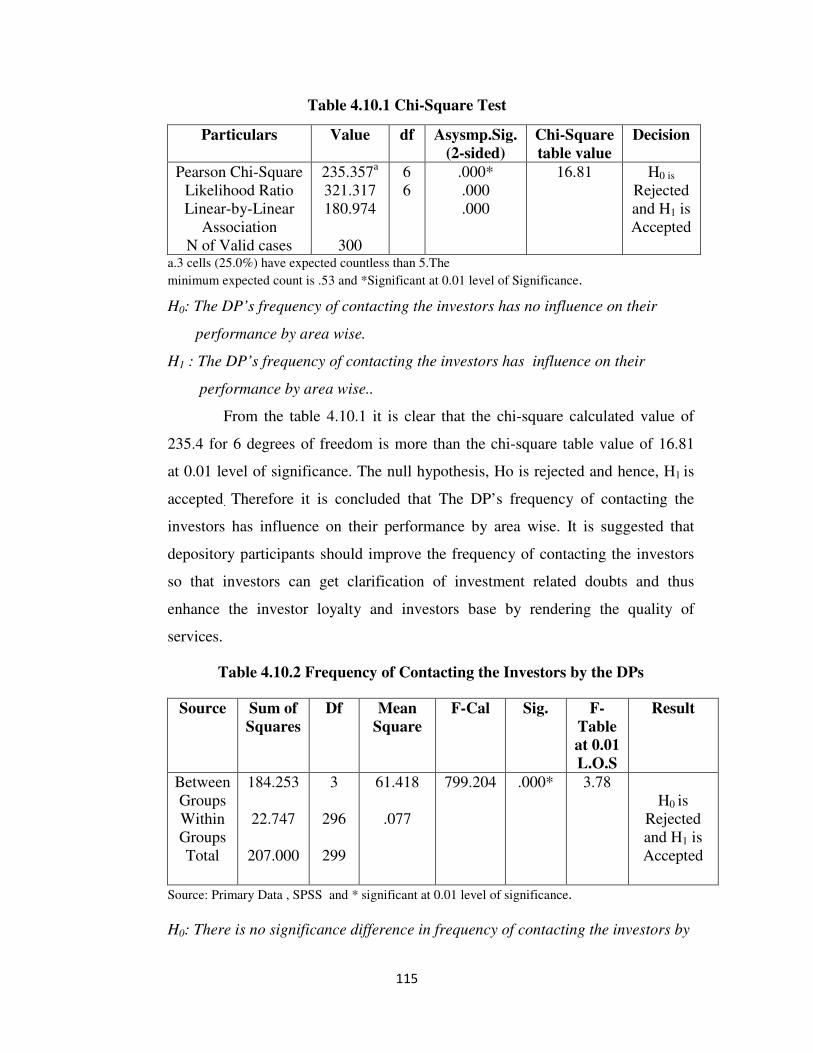
Table 4.10.1 Chi-Square Test
Particulars Value df Asysmp.Sig.
(2-sided)
Chi-Square
table value
Decision
Pearson Chi-Square
Likelihood Ratio
Linear-by-Linear
Association
N of Valid cases
235.357a
321.317
180.974
300
6
6
.000*
.000
.000
16.81 H0 is
Rejected
and H1 is
Accepted
a.3 cells (25.0%) have expected countless than 5.The
minimum expected count is .53 and *Significant at 0.01 level of Significance.
H0: The DP’s frequency of contacting the investors has no influence on their
performance by area wise.
H1 : The DP’s frequency of contacting the investors has influence on their
performance by area wise..
From the table 4.10.1 it is clear that the chi-square calculated value of
235.4 for 6 degrees of freedom is more than the chi-square table value of 16.81
at 0.01 level of significance. The null hypothesis, Ho is rejected and hence, H1 is
accepted. Therefore it is concluded that The DP’s frequency of contacting the
investors has influence on their performance by area wise. It is suggested that
depository participants should improve the frequency of contacting the investors
so that investors can get clarification of investment related doubts and thus
enhance the investor loyalty and investors base by rendering the quality of
services.
Table 4.10.2 Frequency of Contacting the Investors by the DPs
Source Sum of
Squares
Df Mean
Square
F-Cal Sig. F-
Table
at 0.01
L.O.S
Result
Between
Groups
Within
Groups
Total
184.253
22.747
207.000
3
296
299
61.418
.077
799.204 .000* 3.78
H0 is
Rejected
and H1 is
Accepted
Source: Primary Data , SPSS and * significant at 0.01 level of significance.
H0: There is no significance difference in frequency of contacting the investors by
116
the select depository participants.
H1: There is significance difference in frequency of contacting the investors by
the select depository participants.
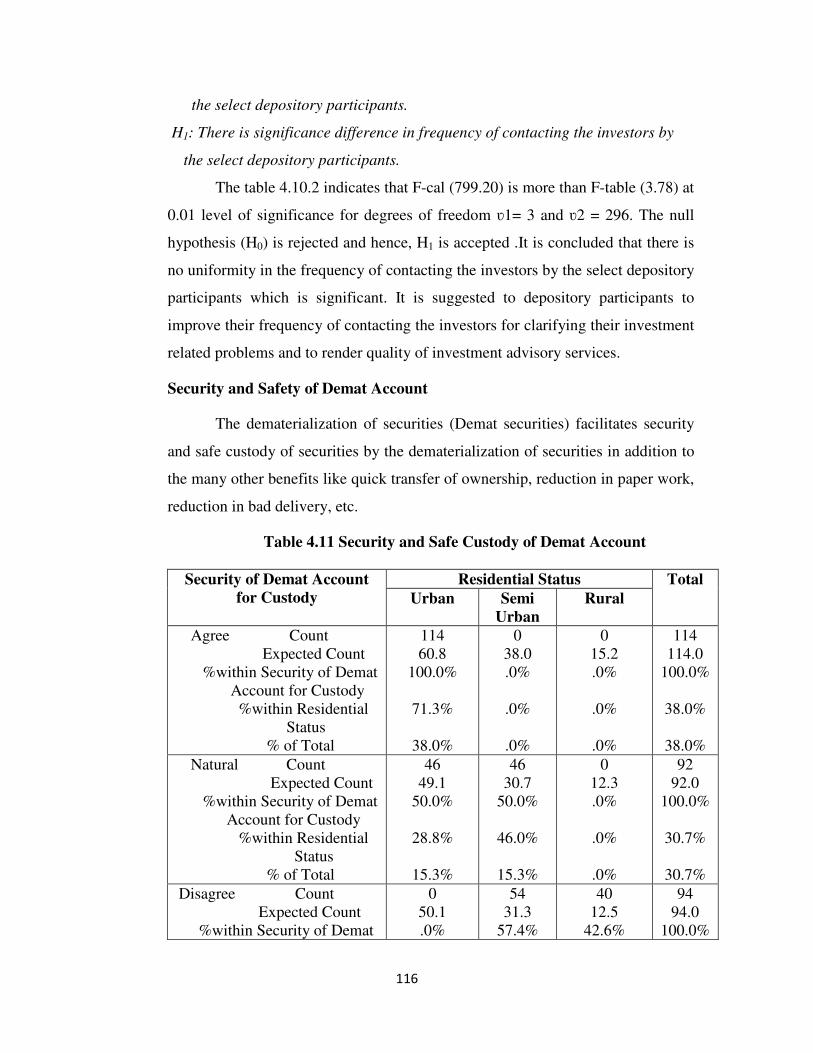
The table 4.10.2 indicates that F-cal (799.20) is more than F-table (3.78) at
0.01 level of significance for degrees of freedom ʋ1= 3 and ʋ2 = 296. The null
hypothesis (H0) is rejected and hence, H1 is accepted .It is concluded that there is
no uniformity in the frequency of contacting the investors by the select depository
participants which is significant. It is suggested to depository participants to
improve their frequency of contacting the investors for clarifying their investment
related problems and to render quality of investment advisory services.
Security and Safety of Demat Account
The dematerialization of securities (Demat securities) facilitates security
and safe custody of securities by the dematerialization of securities in addition to
the many other benefits like quick transfer of ownership, reduction in paper work,
reduction in bad delivery, etc.
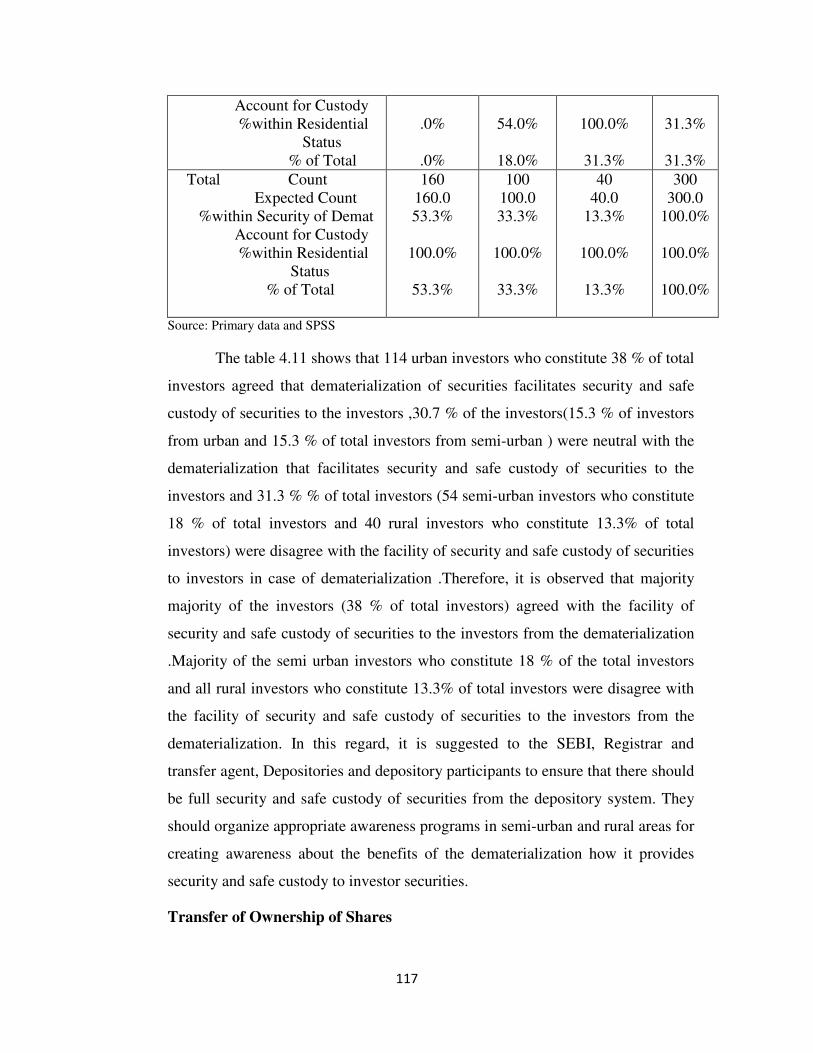
Table 4.11 Security and Safe Custody of Demat Account
Security of Demat Account
for Custody
Residential Status Total
Urban Semi
Urban
Rural
Agree Count
Expected Count
%within Security of Demat
Account for Custody
%within Residential
Status
% of Total
114
60.8
100.0%
71.3%
38.0%
0
38.0
.0%
.0%
.0%
0
15.2
.0%
.0%
.0%
114
114.0
100.0%
38.0%
38.0%
Natural Count
Expected Count
%within Security of Demat
Account for Custody
%within Residential
Status
% of Total
46
49.1
50.0%
28.8%
15.3%
46
30.7
50.0%
46.0%
15.3%
0
12.3
.0%
.0%
.0%
92
92.0
100.0%
30.7%
30.7%
Disagree Count
Expected Count
%within Security of Demat
0
50.1
.0%
54
31.3
57.4%
40
12.5
42.6%
94
94.0
100.0%
117
Account for Custody
%within Residential
Status
% of Total
.0%
.0%
54.0%
18.0%
100.0%
31.3%
31.3%
31.3%
Total Count
Expected Count
%within Security of Demat
Account for Custody
%within Residential
Status
% of Total
160
160.0
53.3%
100.0%
53.3%
100
100.0
33.3%
100.0%
33.3%
40
40.0
13.3%
100.0%
13.3%
300
300.0
100.0%
100.0%
100.0%
Source: Primary data and SPSS
The table 4.11 shows that 114 urban investors who constitute 38 % of total
investors agreed that dematerialization of securities facilitates security and safe
custody of securities to the investors ,30.7 % of the investors(15.3 % of investors
from urban and 15.3 % of total investors from semi-urban ) were neutral with the
dematerialization that facilitates security and safe custody of securities to the
investors and 31.3 % % of total investors (54 semi-urban investors who constitute
18 % of total investors and 40 rural investors who constitute 13.3% of total
investors) were disagree with the facility of security and safe custody of securities
to investors in case of dematerialization .Therefore, it is observed that majority
majority of the investors (38 % of total investors) agreed with the facility of
security and safe custody of securities to the investors from the dematerialization
.Majority of the semi urban investors who constitute 18 % of the total investors
and all rural investors who constitute 13.3% of total investors were disagree with
the facility of security and safe custody of securities to the investors from the
dematerialization. In this regard, it is suggested to the SEBI, Registrar and
transfer agent, Depositories and depository participants to ensure that there should
be full security and safe custody of securities from the depository system. They
should organize appropriate awareness programs in semi-urban and rural areas for
creating awareness about the benefits of the dematerialization how it provides
security and safe custody to investor securities.
Transfer of Ownership of Shares
118
With the enactment of Depositories act 1996, two depositories
organizations (NSDL and CDSL ) was setup in India. These two depositories
will perform functions through their agents called depository participants. The
dematerialization of securities (Demat securities) facilitates the quick transfer of
ownership from one investor to another through the depository participant as
securities hold in electronic form which is similar to money deposited in bank
savings account.
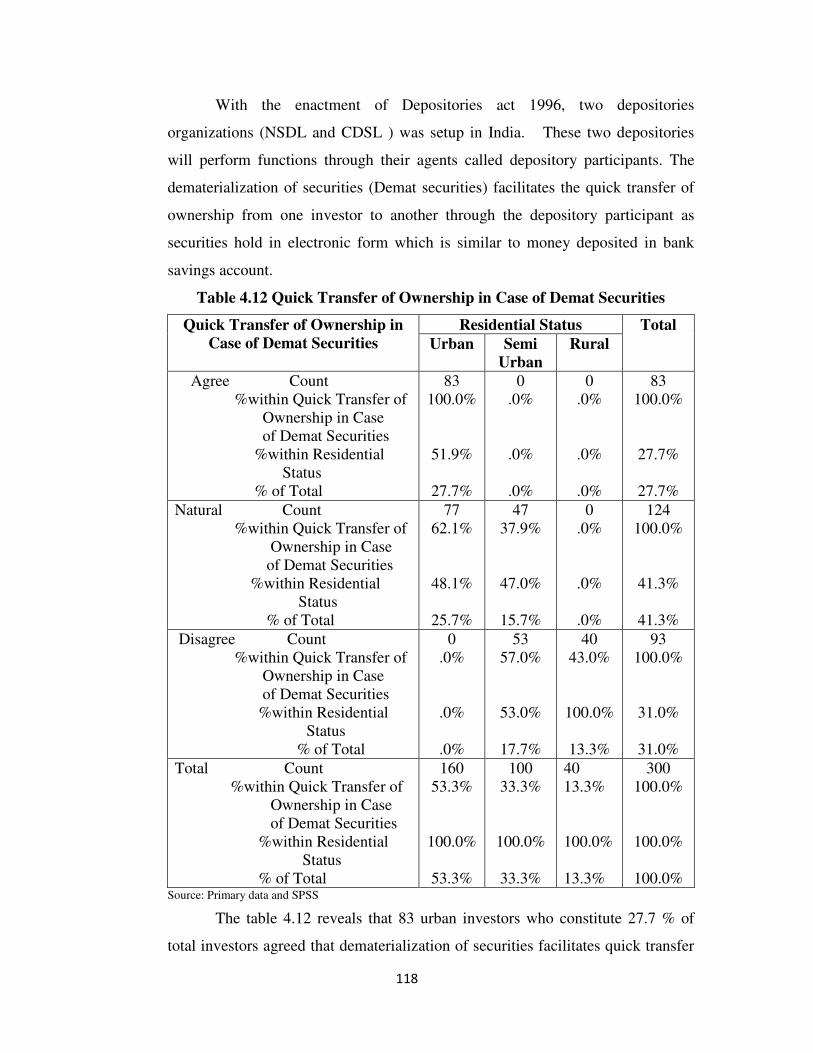
Table 4.12 Quick Transfer of Ownership in Case of Demat Securities
Quick Transfer of Ownership in
Case of Demat Securities
Residential Status Total
Urban Semi
Urban
Rural
Agree Count
%within Quick Transfer of
Ownership in Case
of Demat Securities
%within Residential
Status
% of Total
83
100.0%
51.9%
27.7%
0
.0%
.0%
.0%
0
.0%
.0%
.0%
83
100.0%
27.7%
27.7%
Natural Count
%within Quick Transfer of
Ownership in Case
of Demat Securities
%within Residential
Status
% of Total
77
62.1%
48.1%
25.7%
47
37.9%
47.0%
15.7%
0
.0%
.0%
.0%
124
100.0%
41.3%
41.3%
Disagree Count
%within Quick Transfer of
Ownership in Case
of Demat Securities
%within Residential
Status
% of Total
0
.0%
.0%
.0%
53
57.0%
53.0%
17.7%
40
43.0%
100.0%
13.3%
93
100.0%
31.0%
31.0%
Total Count
%within Quick Transfer of
Ownership in Case
of Demat Securities
%within Residential
Status
% of Total
160
53.3%
100.0%
53.3%
100
33.3%
100.0%
33.3%
40
13.3%
100.0%
13.3%
300
100.0%
100.0%
100.0% Source: Primary data and SPSS
The table 4.12 reveals that 83 urban investors who constitute 27.7 % of
total investors agreed that dematerialization of securities facilitates quick transfer
119
of ownership , 41.3 % of total investors (77 urban investors who constitute 25.7 %
of total investors and 47 semi-urban investors constitute 15.7 % of total
investors) were neutral with regard to quick transfer of ownership by the
dematerialization and 31 % of total investors (53 semi-urban investors who
constitute 17.7 % of total investors and 40 rural investors who constitute 13.3%
of total investors) were disagree with the facility of quick transfer of ownership in
case of dematerialization of securities. Therefore, it is observed that majority of
the (27.7 % of total investors) urban investors agreed with facility of quick
transfer of ownership in case of dematerialization of securities only.
Majority of the investors (41.3% of total investors) neither agree nor
disagree with the facility of quick transfer of ownership in case of
dematerialization of securities. Majority of the semi-urban investors (17.7 % of
total investors) and half of the rural investors ( 13.3 % of total investors ) were
disagree with the quick transfer of ownership from the dematerialization of
securities. In this regard, it is suggested to the SEBI, Registrar and transfer agent,
Depositories and depository participants to minimize the time taken to transfer the
ownership of securities in the dematerialization process and it helps the quick
transfer of ownership of securities from the dematerialization. The benefits of
dematerialization must reach to the investors so that they will be comfortable and
confident; it in turn promotes growth of the capital market.
Reducing Bad Delivery
A share certificate together with its transfer deed which meets all the
requirements of title transfer from the transferor (seller) to the transferee (buyer)
is called good delivery in the market.Redcuing bad delivery it makes benefits for
both investors and Depository Participants.
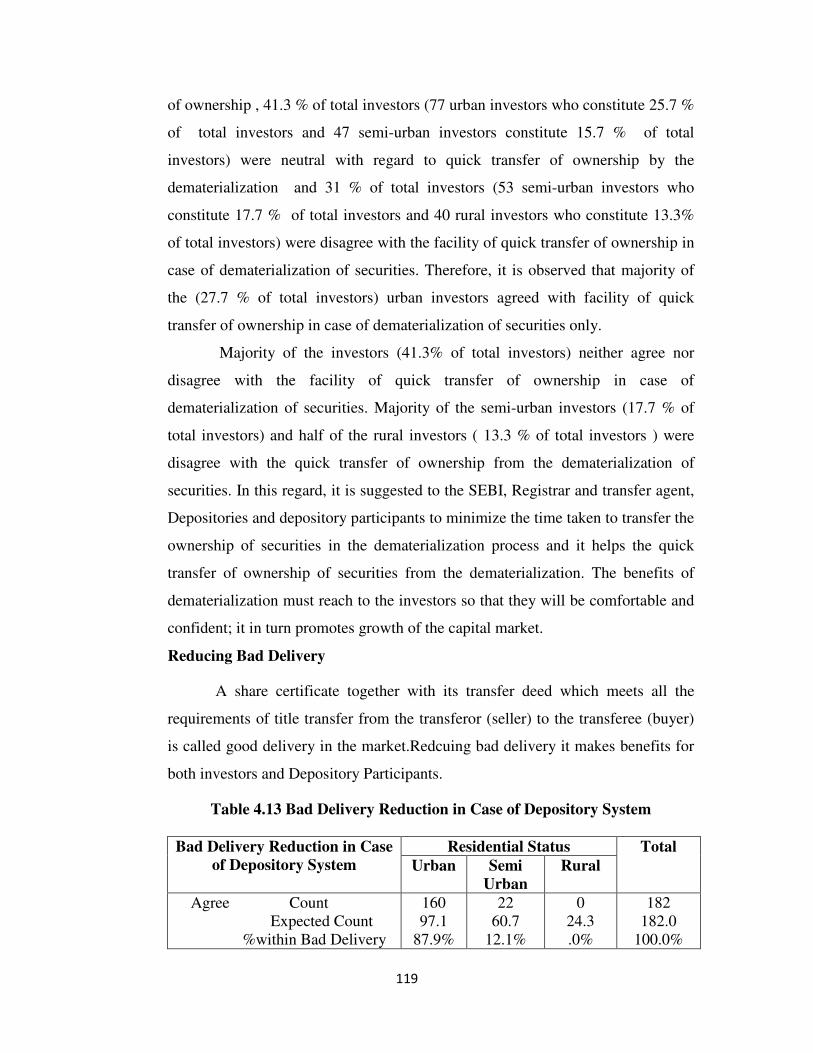
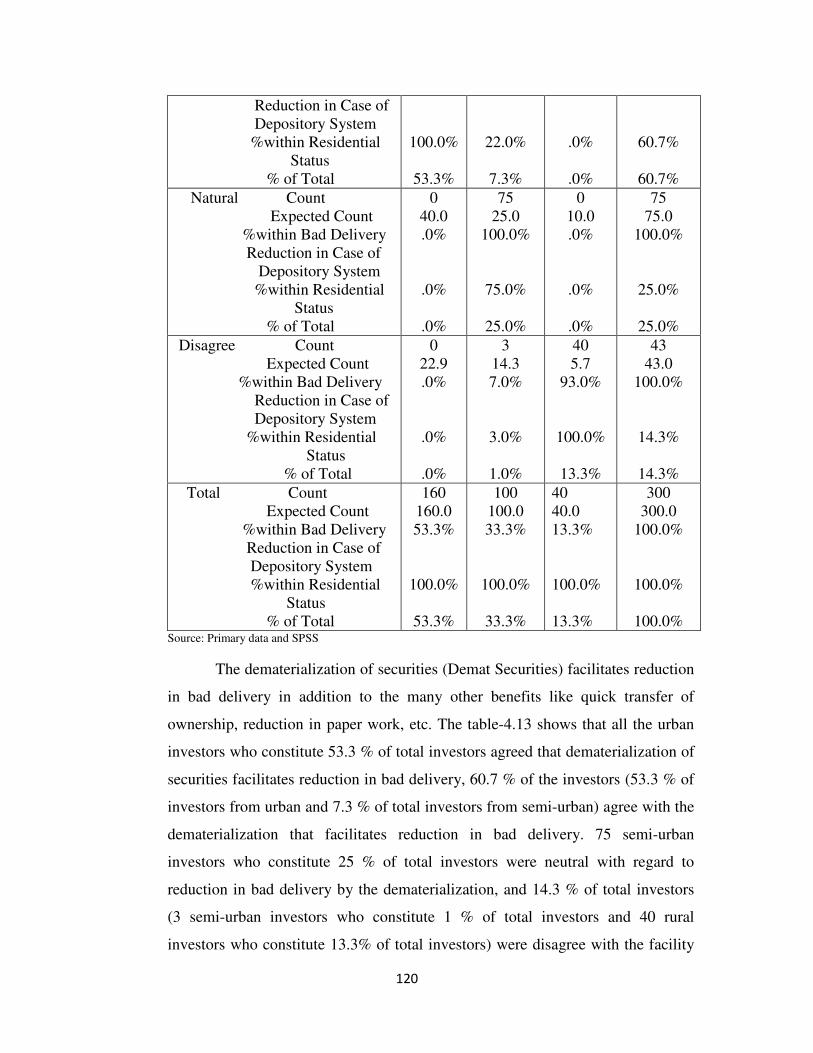
Table 4.13 Bad Delivery Reduction in Case of Depository System
Bad Delivery Reduction in Case
of Depository System
Residential Status Total
Urban Semi
Urban
Rural
Agree Count
Expected Count
%within Bad Delivery
160
97.1
87.9%
22
60.7
12.1%
0
24.3
.0%
182
182.0
100.0%
120
Reduction in Case of
Depository System
%within Residential
Status
% of Total
100.0%
53.3%
22.0%
7.3%
.0%
.0%
60.7%
60.7%
Natural Count
Expected Count
%within Bad Delivery
Reduction in Case of
Depository System
%within Residential
Status
% of Total
0
40.0
.0%
.0%
.0%
75
25.0
100.0%
75.0%
25.0%
0
10.0
.0%
.0%
.0%
75
75.0
100.0%
25.0%
25.0%
Disagree Count
Expected Count
%within Bad Delivery
Reduction in Case of
Depository System
%within Residential
Status
% of Total
0
22.9
.0%
.0%
.0%
3
14.3
7.0%
3.0%
1.0%
40
5.7
93.0%
100.0%
13.3%
43
43.0
100.0%
14.3%
14.3%
Total Count
Expected Count
%within Bad Delivery
Reduction in Case of
Depository System
%within Residential
Status
% of Total
160
160.0
53.3%
100.0%
53.3%
100
100.0
33.3%
100.0%
33.3%
40
40.0
13.3%
100.0%
13.3%
300
300.0
100.0%
100.0%
100.0% Source: Primary data and SPSS
The dematerialization of securities (Demat Securities) facilitates reduction
in bad delivery in addition to the many other benefits like quick transfer of
ownership, reduction in paper work, etc. The table-4.13 shows that all the urban
investors who constitute 53.3 % of total investors agreed that dematerialization of
securities facilitates reduction in bad delivery, 60.7 % of the investors (53.3 % of
investors from urban and 7.3 % of total investors from semi-urban) agree with the
dematerialization that facilitates reduction in bad delivery. 75 semi-urban
investors who constitute 25 % of total investors were neutral with regard to
reduction in bad delivery by the dematerialization, and 14.3 % of total investors
(3 semi-urban investors who constitute 1 % of total investors and 40 rural
investors who constitute 13.3% of total investors) were disagree with the facility
121
of reduction in bad delivery in case of dematerialization of securities. Therefore, it
is observed that majority of the (53.3 % of total investors) urban investors agreed
with facility of reduction in paper work in case of dematerialization of securities
only. Majority of the investors (60.7 % of total investors) agreed with the facility
of reduction in bad delivery in case of dematerialization of securities. Majority of
the semi-urban investors (75 semi-urban investors who constitute 25 % of total
investors) were neutral with regard to reduction in bad delivery by the
dematerialization. All the rural investors who constitute 13.3% of total investors)
disagreed with the facility of reduction in bad delivery in case of
dematerialization of securities. In this regard, it is suggested to the SEBI,
Registrar and transfer agent, Depositories and depository participants to ensure
that there should be no bad delivery of securities by the dematerialization. They
should organize appropriate awareness programs in semi-urban and rural areas for
creating awareness about the benefits of the dematerialization particularly how
dematerialization process eliminates /reduces the bad delivery. The benefits of
dematerialization must reach to the all the stakeholders of the capital market in
general and particularly to the investors so that they will be comfortable and
confident; it in turn promotes the efficiency and growth of the capital market.
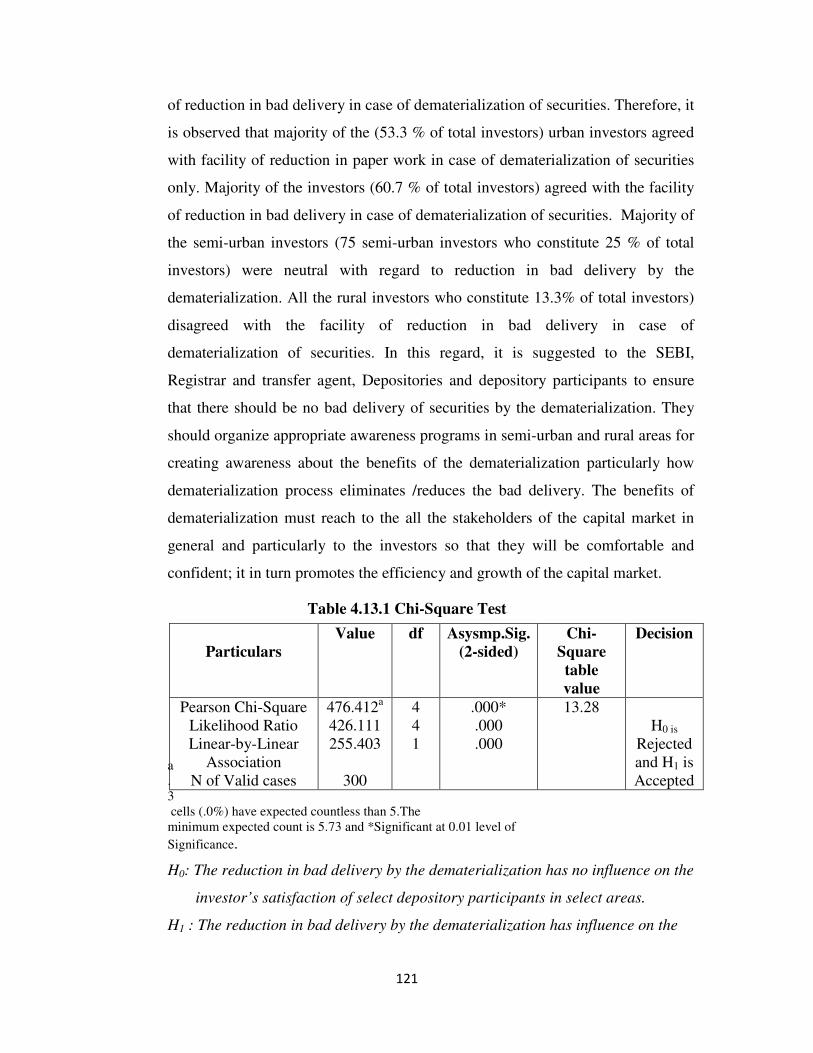
Table 4.13.1 Chi-Square Test
a
.
3
cells (.0%) have expected countless than 5.The
minimum expected count is 5.73 and *Significant at 0.01 level of
Significance.
H0: The reduction in bad delivery by the dematerialization has no influence on the
investor’s satisfaction of select depository participants in select areas.
H1 : The reduction in bad delivery by the dematerialization has influence on the
Particulars
Value df Asysmp.Sig.
(2-sided)
Chi-
Square
table
value
Decision
Pearson Chi-Square
Likelihood Ratio
Linear-by-Linear
Association
N of Valid cases
476.412a
426.111
255.403
300
4
4
1
.000*
.000
.000
13.28
H0 is
Rejected
and H1 is
Accepted
122
Investor’s satisfaction of select depository participants in select areas
From the table 4.13.1, it is clear that the chi-square calculated value of
476.4 for 4 degrees of freedom is more than the chi-square table value of 13.28
at 0.01 level of significance. The null hypothesis, Ho is rejected and hence, H1 is
accepted. Therefore it is concluded that the reduction in bad delivery of securities
by the dematerialization has influence on the investor’s satisfaction of select
depository participants in select areas. It is suggested to the SEBI, Registrar and
transfer agent, Depositories and depository participants to ensure that there should
be no bad delivery of securities by the dematerialization as reduction in bad
delivery enhances the investor’s satisfaction and confidence in the depository
system that promotes the efficiency and growth of the capital market.
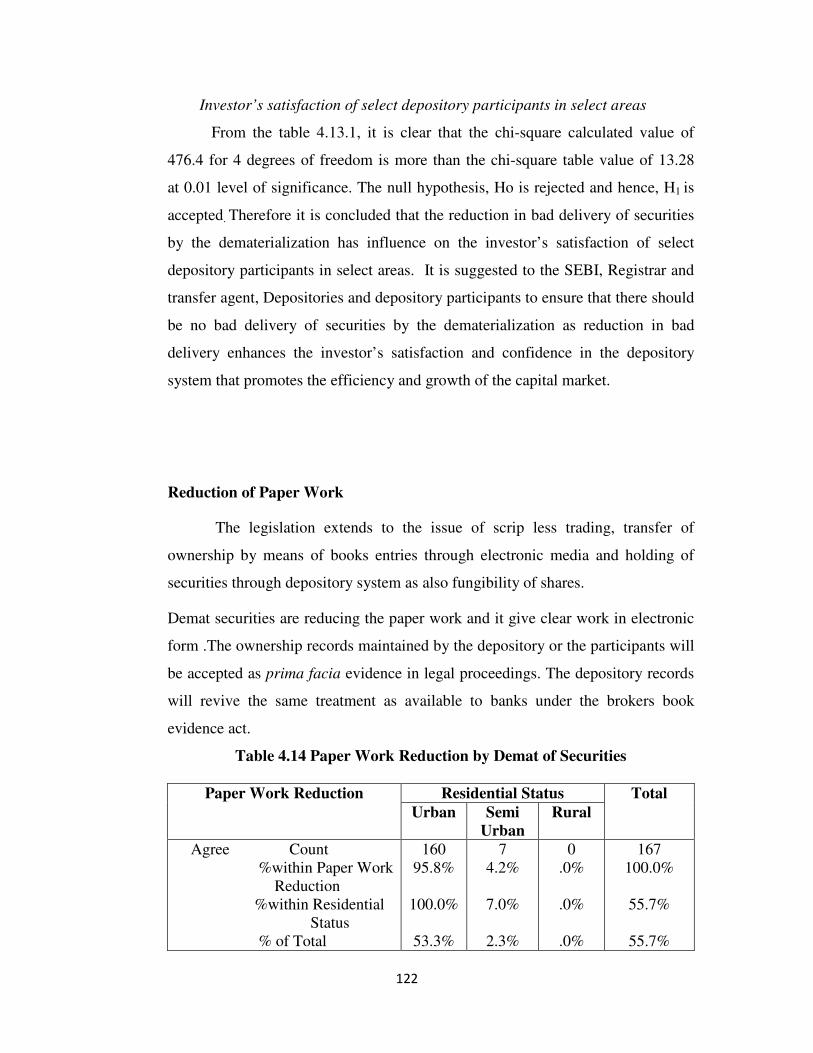
Reduction of Paper Work
The legislation extends to the issue of scrip less trading, transfer of
ownership by means of books entries through electronic media and holding of
securities through depository system as also fungibility of shares.
Demat securities are reducing the paper work and it give clear work in electronic
form .The ownership records maintained by the depository or the participants will
be accepted as prima facia evidence in legal proceedings. The depository records
will revive the same treatment as available to banks under the brokers book
evidence act.
Table 4.14 Paper Work Reduction by Demat of Securities
Paper Work Reduction Residential Status Total
Urban Semi
Urban
Rural
Agree Count
%within Paper Work
Reduction
%within Residential
Status
% of Total
160
95.8%
100.0%
53.3%
7
4.2%
7.0%
2.3%
0
.0%
.0%
.0%
167
100.0%
55.7%
55.7%
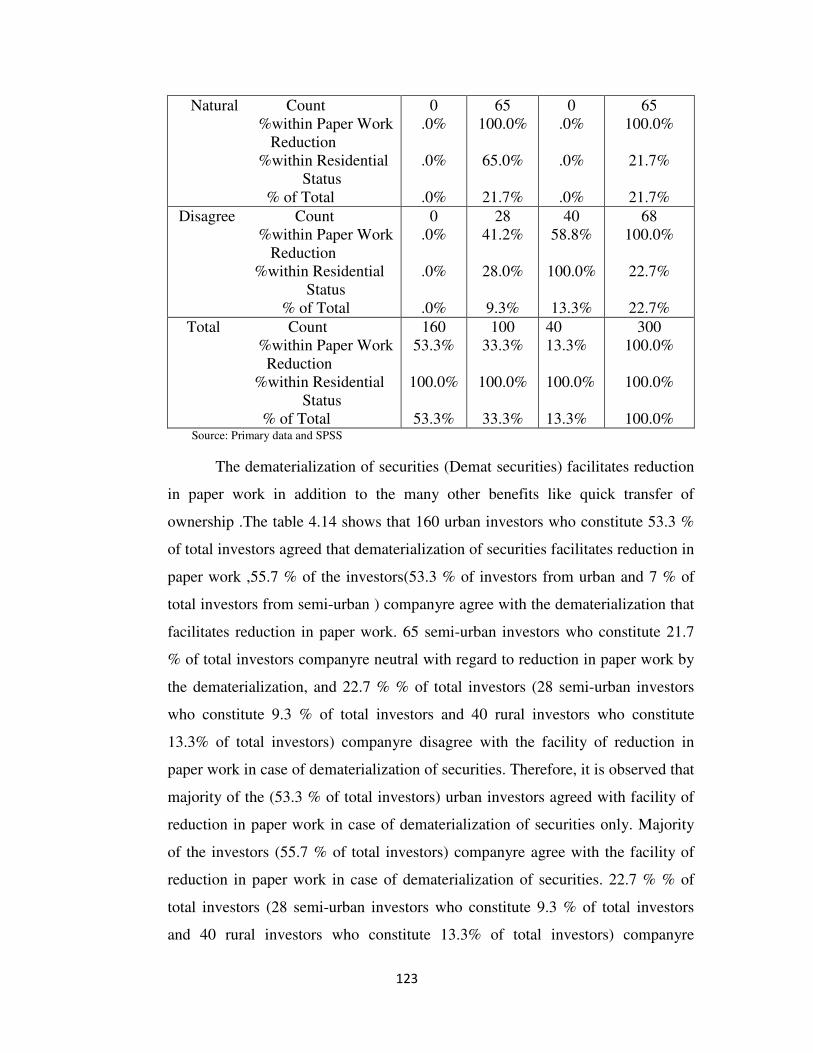
123
Natural Count
%within Paper Work
Reduction
%within Residential
Status
% of Total
0
.0%
.0%
.0%
65
100.0%
65.0%
21.7%
0
.0%
.0%
.0%
65
100.0%
21.7%
21.7%
Disagree Count
%within Paper Work
Reduction
%within Residential
Status
% of Total
0
.0%
.0%
.0%
28
41.2%
28.0%
9.3%
40
58.8%
100.0%
13.3%
68
100.0%
22.7%
22.7%
Total Count
%within Paper Work
Reduction
%within Residential
Status
% of Total
160
53.3%
100.0%
53.3%
100
33.3%
100.0%
33.3%
40
13.3%
100.0%
13.3%
300
100.0%
100.0%
100.0% Source: Primary data and SPSS
The dematerialization of securities (Demat securities) facilitates reduction
in paper work in addition to the many other benefits like quick transfer of
ownership .The table 4.14 shows that 160 urban investors who constitute 53.3 %
of total investors agreed that dematerialization of securities facilitates reduction in
paper work ,55.7 % of the investors(53.3 % of investors from urban and 7 % of
total investors from semi-urban ) companyre agree with the dematerialization that
facilitates reduction in paper work. 65 semi-urban investors who constitute 21.7
% of total investors companyre neutral with regard to reduction in paper work by
the dematerialization, and 22.7 % % of total investors (28 semi-urban investors
who constitute 9.3 % of total investors and 40 rural investors who constitute
13.3% of total investors) companyre disagree with the facility of reduction in
paper work in case of dematerialization of securities. Therefore, it is observed that
majority of the (53.3 % of total investors) urban investors agreed with facility of
reduction in paper work in case of dematerialization of securities only. Majority
of the investors (55.7 % of total investors) companyre agree with the facility of
reduction in paper work in case of dematerialization of securities. 22.7 % % of
total investors (28 semi-urban investors who constitute 9.3 % of total investors
and 40 rural investors who constitute 13.3% of total investors) companyre
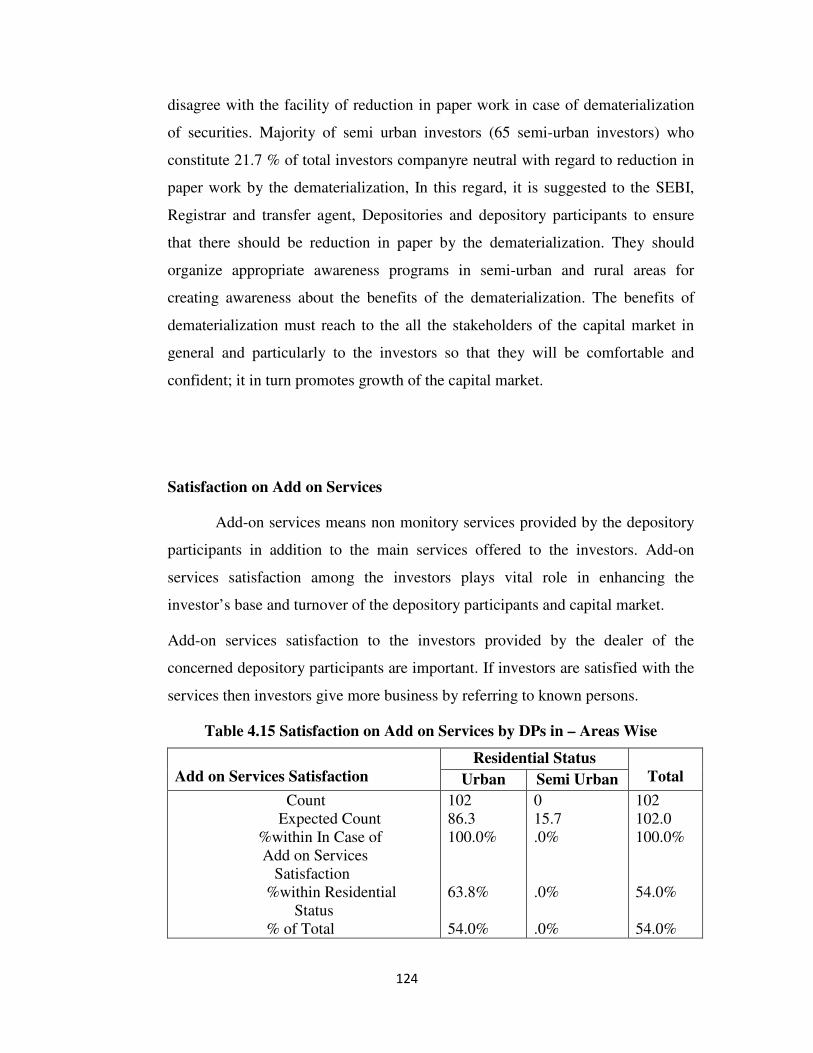
124
disagree with the facility of reduction in paper work in case of dematerialization
of securities. Majority of semi urban investors (65 semi-urban investors) who
constitute 21.7 % of total investors companyre neutral with regard to reduction in
paper work by the dematerialization, In this regard, it is suggested to the SEBI,
Registrar and transfer agent, Depositories and depository participants to ensure
that there should be reduction in paper by the dematerialization. They should
organize appropriate awareness programs in semi-urban and rural areas for
creating awareness about the benefits of the dematerialization. The benefits of
dematerialization must reach to the all the stakeholders of the capital market in
general and particularly to the investors so that they will be comfortable and
confident; it in turn promotes growth of the capital market.
Satisfaction on Add on Services
Add-on services means non monitory services provided by the depository
participants in addition to the main services offered to the investors. Add-on
services satisfaction among the investors plays vital role in enhancing the
investor’s base and turnover of the depository participants and capital market.
Add-on services satisfaction to the investors provided by the dealer of the
concerned depository participants are important. If investors are satisfied with the
services then investors give more business by referring to known persons.
Table 4.15 Satisfaction on Add on Services by DPs in – Areas Wise
Add on Services Satisfaction
Residential Status
Total Urban Semi Urban
Count
Expected Count
%within In Case of
Add on Services
Satisfaction
%within Residential
Status
% of Total
102
86.3
100.0%
63.8%
54.0%
0
15.7
.0%
.0%
.0%
102
102.0
100.0%
54.0%
54.0%
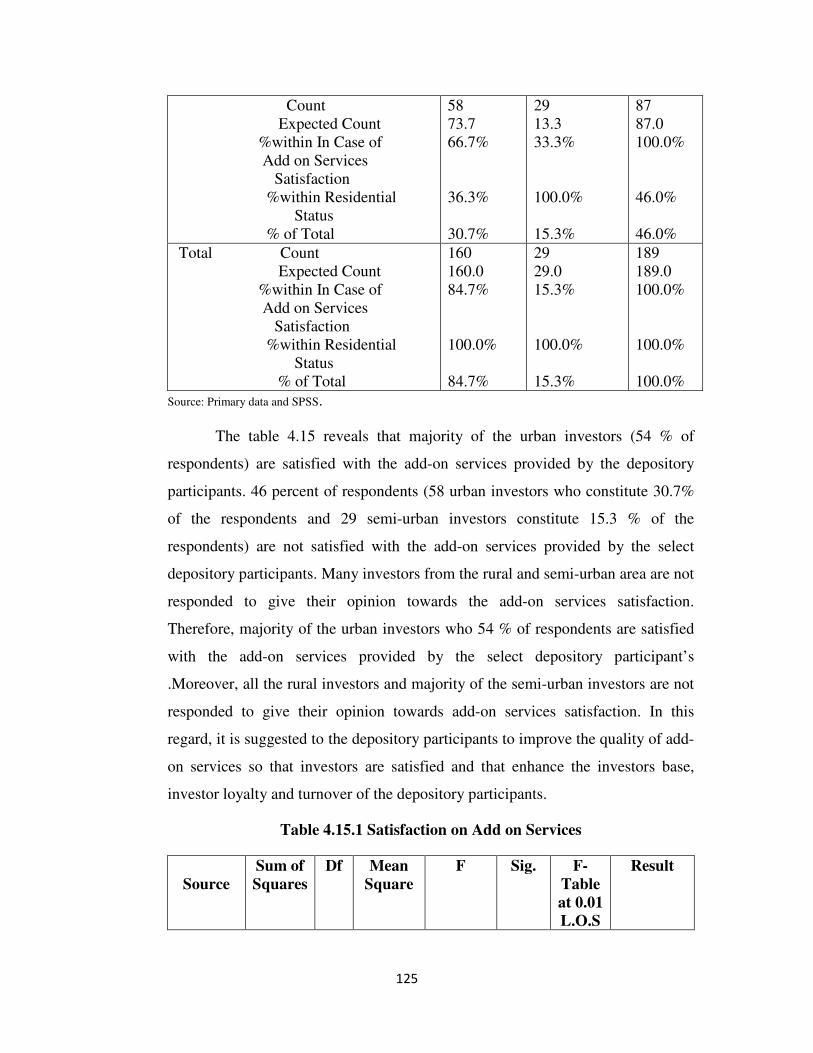
125
Count
Expected Count
%within In Case of
Add on Services
Satisfaction
%within Residential
Status
% of Total
58
73.7
66.7%
36.3%
30.7%
29
13.3
33.3%
100.0%
15.3%
87
87.0
100.0%
46.0%
46.0%
Total Count
Expected Count
%within In Case of
Add on Services
Satisfaction
%within Residential
Status
% of Total
160
160.0
84.7%
100.0%
84.7%
29
29.0
15.3%
100.0%
15.3%
189
189.0
100.0%
100.0%
100.0%
Source: Primary data and SPSS.
The table 4.15 reveals that majority of the urban investors (54 % of
respondents) are satisfied with the add-on services provided by the depository
participants. 46 percent of respondents (58 urban investors who constitute 30.7%
of the respondents and 29 semi-urban investors constitute 15.3 % of the
respondents) are not satisfied with the add-on services provided by the select
depository participants. Many investors from the rural and semi-urban area are not
responded to give their opinion towards the add-on services satisfaction.
Therefore, majority of the urban investors who 54 % of respondents are satisfied
with the add-on services provided by the select depository participant’s
.Moreover, all the rural investors and majority of the semi-urban investors are not
responded to give their opinion towards add-on services satisfaction. In this
regard, it is suggested to the depository participants to improve the quality of add-
on services so that investors are satisfied and that enhance the investors base,
investor loyalty and turnover of the depository participants.
Table 4.15.1 Satisfaction on Add on Services
Source
Sum of
Squares
Df Mean
Square
F Sig. F-
Table
at 0.01
L.O.S
Result
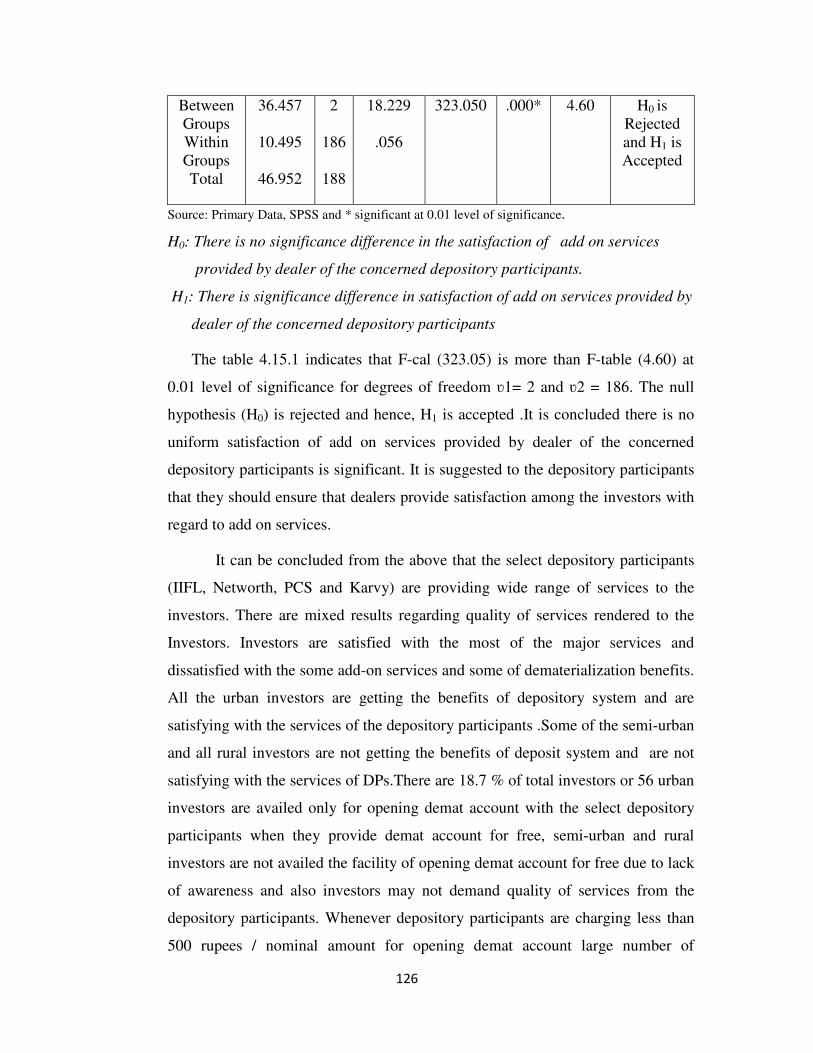
126
Between
Groups
Within
Groups
Total
36.457
10.495
46.952
2
186
188
18.229
.056
323.050 .000* 4.60 H0 is
Rejected
and H1 is
Accepted
Source: Primary Data, SPSS and * significant at 0.01 level of significance.
H0: There is no significance difference in the satisfaction of add on services
provided by dealer of the concerned depository participants.
H1: There is significance difference in satisfaction of add on services provided by
dealer of the concerned depository participants
The table 4.15.1 indicates that F-cal (323.05) is more than F-table (4.60) at
0.01 level of significance for degrees of freedom ʋ1= 2 and ʋ2 = 186. The null
hypothesis (H0) is rejected and hence, H1 is accepted .It is concluded there is no
uniform satisfaction of add on services provided by dealer of the concerned
depository participants is significant. It is suggested to the depository participants
that they should ensure that dealers provide satisfaction among the investors with
regard to add on services.
It can be concluded from the above that the select depository participants
(IIFL, Networth, PCS and Karvy) are providing wide range of services to the
investors. There are mixed results regarding quality of services rendered to the
Investors. Investors are satisfied with the most of the major services and
dissatisfied with the some add-on services and some of dematerialization benefits.
All the urban investors are getting the benefits of depository system and are
satisfying with the services of the depository participants .Some of the semi-urban
and all rural investors are not getting the benefits of deposit system and are not
satisfying with the services of DPs.There are 18.7 % of total investors or 56 urban
investors are availed only for opening demat account with the select depository
participants when they provide demat account for free, semi-urban and rural
investors are not availed the facility of opening demat account for free due to lack
of awareness and also investors may not demand quality of services from the
depository participants. Whenever depository participants are charging less than
500 rupees / nominal amount for opening demat account large number of
127
investors availed as investors can demand quality of services from the concerned
depository participants. A majority of the investor s( 58.3 % of total investors) are
trading through the broker, 25 % of investors are trading by online and 16.7 % of
total investors are trading by both. A majority of the investors (98.7 %) opinioned
that depository participants are charging brokerage of 0.03 % for intraday trades
irrespective of area.
A majority of the investors (55.7 % of total investors) from different areas
are not satisfied with the services provided by the select depository participants.
Hence providing quality of services consistently is the key for improving the
satisfaction of investors and enhancing the performance of depository
participants. It is observed that majority (58 % of total investors) of investors
which include 11.3 % of total investors from urban area; all semi-urban and rural
investors are not satisfied with the research tips provided by the select depository
participants. It is observed that Majority of the investors (38.7 % of total
investors) are informed that DPs are contacting them by rarely, 34 % of total
investors are informed that DPs are contacting them by monthly, 26 % of total
investors are informed that DPs are contacting them by weekly and remaining 1.3
% of total investors are informed that DPs are contacting them by daily. A
majority of the investors (38 % of total investors) agreed with the facility of
security and safe custody of securities to the investors from the dematerialization.
It is observed that majority of the (27.7 % of total investors) urban investors
agreed with facility of quick transfer of ownership in case of dematerialization of
securities only. It is observed that majority of the (53.3 % of total investors) urban
investors agreed with facility of reduction in paper work in case of
dematerialization of securities only. Majority of the urban investors are satisfied
with the add-on services provided by the select depository participant’s.


![Chapter 1 World of Careers - shodhganga.inflibnet.ac.inshodhganga.inflibnet.ac.in/bitstream/10603/53446/9/09_chapter 1.pdf · Chapter 1 ] World of Careers ... SWOT analysis is relevant](https://img.pdfslide.us/doc/110x75/5addb3e37f8b9a213e8d21a0/chapter-1-world-of-careers-1pdfchapter-1-world-of-careers-swot-analysis.jpg)