Embed Size (px)
Citation preview
109
10
9
3. MATERIALS AND METHODS
For conducting any fruitful research, the most important thing is the
selection and application of right kind of methodologies to get valid results. The
details of the research procedures and methodological steps used to Assess the
Nutritional Status of Cardiac patients, Development of Intervention Package and
Development of suitable recipes for cardiac health have been discussed here
under the following heads:
Assessment of Nutritional Status of Cardiac patients
Development, Implementation and Validation of Intervention
Package for Cardiac patients
Formulation of suitable Recipes for the Cardiac patients
3.1.0 Domain of the study
The study entitle “Development, Implementation and Validation of
Intervention Package for Cardiac Patients” was conducted in the department
of Food Science and Nutrition, College of Home Science, CSK Himachal
Pradesh Agricultural University, Palampur during the year 2008-2010
3.2.0 Locale of the study
The present study was conducted in the district Kangra of Himachal
Pradesh on Hundred cardiac patients were selected from Government hospital of
Palampur and Baijnath. The data was collected by regular visits to their places
3.3.0 Sampling procedure
Two government hospitals viz. Civil Hospital Palampur and Baijnath were
selected, then permission was taken from SMO, Civil Hospital Baijnath and MS,
Civil hospital Palampur to personally interview the respondents who visited
hospital regularly for their checkup and also to obtain the records of the clinical
tests of the interviewed respondents. A total of hundred respondents (male and
female) formed the sample (Fig.3.1).

110
11
0
100
Civil Hospital Palampur Govt. Hospital Baijnath
(50) (50)
.
Gender wise distribution Age wise distribution
Male Female < 50 years of age >50 years of age
(53) (47) (40) (60)
Fig.3.1. Sampling Procedure
3.4.0 Development and Pre-testing of Questionnaire
A well structured and exhaustive questionnaire was formulated after
consulting literature to collect the relevant informations specifically keeping in
mind the objectives of the study. For the pretesting of the questionnaire, ten
questionnaire were got filled up by cardiac patients other than the selected
patients and then evaluated for responses of the patients. On the basis of
collected information and difficulties faced, necessary improvement/ modification
were incorporated to make it more functional.

111
11
1
3.5.0 Experimental layout
The study was scientifically laid out according to Complete Randomized
Block Designing and replicated thrice
3.6.0 Collection of Data
In order to meet the objectives of the study, the data was collected
through pre-tested and a well structured questionnaire, given under the following
subheads viz.
3.6.1. Information about Cardiac patients
i. Demographic profile
ii. Socio-economic profile
iii. Family history
iv. Personal habits
v. Physical activity
vi. Health information
3.6.2. Assessment of Nutritional Status of Cardiac patients
i. Dietary pattern
ii. Anthropometry
3.6. 3. Development of Intervention Package
i. Implementation of Intervention Package
ii. Validation of Intervention Package
3.6.4. Formulation of suitable Recipes for the Cardiac patients
i. Nutritional and Chemical Composition
ii. Organoleptic Evaluation
An effort was made to develop a personal rapport with the patients to
extract information as for as possible. Cross checking and indirect queries were
also raised to ascertain the authenticity of the study.

112
11
2
3.6.1 Information about Cardiac patients
i. Demographic profile
This segment included the general information regarding age, sex, religion
and community.
ii. Socio-economic
The information pertaining to education, occupation, type of family, family
income, land holding pattern, animal holding and type of housing etc. were
recorded by filling up questionnaire.
iii. Family history
The component was used to extract information regarding the family
history of cardiac disease and related metabolic diseases such as hypertension
and diabetes etc.
iv. Personal habits
This aspect include the informations regarding the smoking and alcohol
consumption pattern of selected patients.
v. Physical activity
This head include the informations to get an idea to the type of activity
such as sedentary, moderate and heavy activity, physical exercise and sleeping
pattern of selected patients.
vi. Health information
This component of the study was used to collect informations regarding the type
of measures used to control heart problems, symptoms, causation factors and
history of cardiac of family members.
3.6.2 Assessment of Nutritional Status of the Cardiac patients
An effort was made to assess the nutritional status of the patients and for
the purpose their dietary pattern and anthropometric measurements were
evaluated.

113
11
3
i. Dietary pattern
To ascertain the dietary pattern a 24 hours recall method for three
consecutive days was taken and calculated mean were used for the further
analyses. The mean intake of different food stuffs was then computed for a day
and compared with the balanced diet for cardiac patients given by Ghafoorunisa
and Krishnaswamy1998.
The patients were provided with different sets of standardized katories and
glasses to record the exact amount of foods and beverages consumed by them.
The amount of cooked food was converted into raw ingredients and the nutrient
intake was calculated by using the value per 100 g of edible portion using the
food consumption Table (Gopalan et al. 1995). The weight and volume of
different cooked foods consumed by the patient was recorded in terms of
household measures/number/kg to find out quantity of raw food intake.
In case of chapaties, the amount of flour used in the preparation of one
chapati was calculated by dividing the total amount of flour used by number of
chapaties prepared, this value was then multiplied by the number of chapaties
consumed by the patients to find out the raw amount of flour consumed by the
patients.
a. Food preferences and avoidances
Information regarding food preferences and avoidances of the patients in
term to frequency of consumption was also collected.
b. Food consumption pattern
The patients were interviewed to collect information regarding the detailed
dietary history with added information about his/ her food likes/ dislikes, general
meal pattern before and after the onset of disease, number of meals and dietary
intake. Information was also taken about dietary modification in relation to
present condition, such as food avoided, consumption and modification of
ghee/oil.
ii. Anthropometry

114
11
4
Anthropometric measurements are considered as a indispensible tool for
assessing nutritional status of the patients. The height, weight, mid upper arm
circumference and skinfold thickness of four different sites, i.e. triceps, biceps,
subscapular and suprailliac were recorded for calculating the per cent body fat.
The measurements were taken as follows:
a. Height
The height was measured according to the method described by (Jelliffe
1966) with the help of anthropometer rod. The patients were asked to stand erect
without shoes with bare foot. The heels, buttocks, shoulders, and back of the
head touched the anthropometer at the back, with the arms hanging on the sides.
The head piece was lowered gently, crushing the hair and making contact with
the top of the head. The readings were recorded to the nearest of 0.5 cm. The
same procedure was repeated thrice to avoid any error and then mean was
taken.
b. Weight
The weights of the patients were taken using the weighing balance
calibrated in kilograms and grams. The balance was initially standardized with
known weight before use and kept in a flat surface adjusted to zero. The body
weight was determined to the nearest of 0.5 kg using weighing machine. The
patients were not wearing any heavy garments and were asked to remove their
shoes before measurements and stand erect on the centre of the platform
without touching anything else. The weight was recorded in kg and the data was
compared with the weight of the reference Indian man (60 kg) and women (50
kg) as given by ICMR (1999).
c. Body Mass Index
Body mass index, a measure of body weight adjusted for height is used as
an indicator of nutritional status and size of the body energy stores in adult
population. The index was calculated for each of the patient as weight (kg)
divided by height (m²), BMI include both fat and lean tissues. It was calculated by
the equation given by Garrow (1981).

115
11
5
Weight (kg) BMI = ------------------ = Kg/m² Height (m²)
Interpretation - BMI was compared with the classification given by WHO
(1998).
Classification BMI kg/m² Risk of comorbidites
Underweight < 18.50 Low (but risk of other clinical
problems increased)
Normal range 18.50-24.99 Average
Overweight > 25.00 Increased
Pre-obese 25.00-29.99 Increased
Obese class-I 30.00-34.99 Moderate
Obese class-II 35.00-39.99 Severe
Obese class-III > 40.00 Very severe
d. Waist and Hip Circumference
Waist and hip circumference is a measurement at the level of navel, when
the patient breathes quietly, whereas, hip circumference was measured at the
intertichantric level (Despres 1991) with the help of non-stretchable tape.
e. Waist to Hip Ratio
Waist to hip ratio is a measurement of visceral obesity and is a strong
indicator of risk of hypertension, cardiovascular disease and some other
diseases like cancer etc (Rockville 1993). It was calculated as:
Waist circumference (cm) Waist to Hip ratio = --------------------------------------
Hip circumference (cm)
f. Skin fold thickness

116
11
6
The Harpenden Skinfold Calliper was used to measure skinfold thickness
such as triceps, biceps, subscapular and suprailliac to the nearest of 0.1 mm by
the method as suggested by Jelliffe (1966).
f.i Triceps skinfold thickness
It measures a double layer of skin and sub-cutaneous fat. The
measurement was taken half way down the left arm between the tip of acromial
process of scapula (shoulder blade) and the olecraneon process of ulna (tip of
the elbow). Measurements were taken while hanging freely at the side. The skin
fold parallel to the long axis was picked up between the thumb and the forefinger
of the left hand clear away from the underlying muscle. The calipers were applied
to the fold little below the finger and reading was noted to the nearest of 0.1 mm.
f.ii Biceps skinfold thickness
The skinfold was picked on the front of the arm directly above the centre
of the orbital fossa at the same level on which the triceps skinfold was measured.
f.iii Subscapular skinfold thickness
The subscapular skinfold was measured just below and laterally to the
angle of left scapula. The fold should be in a line running at approximately 45° to
the spine, in the natural line of skin cleavage. It has the advantage of providing a
uniform layer of subcutaneous fat not requiring precise localization.
f.iv Suprailliac skinfold thickness
This measurement was taken above the illiac crest in the mid auxiliary line
of the patients.
g. Body fat percentage
It was calculated from the sum of tricep, biceps, subscapular, and
suprailliac from equation given by Durnin and Womersley (1977).
Body density = 1.1599 - (0.0717* log of sum of all four skin fold).
Where D is body density.
4.95

117
11
7
% Fat = --------------------- - 4.50 x 100 Body density Interpretation
The values thus obtained were interpreted as per the classes
of body fat percentage suggested by Deurenberg et al. (1998) as follow:
------------------------------------------------------------------------------------------------- Sex Thin Normal Stout Obese Extreme obese ------------------------------------------------------------------------------------------------- Male < 10% 10-20% 20-25% 25-30% > 30% Female < 20% 20-30% 30-35% 35-40% > 40% -------------------------------------------------------------------------------------------------
3.6.3 Development of Intervention Package
Based upon the information collected, need based Intervention Package
was developed which includes different modules like Leaflets, Pamphlets,
Games, Flash cards, Pictorial diagrams, Displays, Calendar, Desk calendar,
Puppets shows and Diet charts with sample menu of different caloric diets etc.
The selected proportion of cardiac patients (N=30) were firstly evaluated
to test their basic knowledge (pre-testing) regarding various aspects of disease
using multiple choice questionnaire to test the awareness/ knowledge of the
patients regarding general nutrition awareness, knowledge regarding heart
disease and nutrition concepts (Appendix-II).They were tested for their
knowledge regarding various aspects of disease before imparting nutrition
education.
i. Implementation of Intervention Package
The developed package was then applied on selected groups of cardiac
patients for its validation.
In implementation of intervention programme, the patients were educated
regarding various aspects of cardiac diseases, its causative, symptoms, types,
and complications associated with other diseases. Patients were also educated
about the importance of various nutrients, diet charts, role of medicinal plants
118
11
8
necessary dietary modification required for healthy living etc. Nutrition education
was given in a group through a developed intervention package which include
various printing matter like leaflet, pamphlet, games, displays, puppet show etc.
Teaching materials and lesson plans pertaining to above aspects were prepared,
modified and used for imparting general awareness. Teaching was carried out
through lectures, discussions and demonstration were also used and medium of
interaction was used in Hindi and local dialect. All queries were cleared and
discussions were also made with the subjects. Personal contacts with the
respondent were maintained. The developed package was also used as a
medium of interaction was used in Hindi and local dialect. All queries were
cleared and discussions were also made with the patients. Personal contacts
with the respondent were maintained.
ii. Validation of Intervention Package
After imparting nutrition education, any changes in the knowledge of the
patients were reassessed by asking them to fill up the same questionnaire (post-
test).
a. Gain in knowledge
In the present study, the effect of implementation package was assessed
in terms of gain in knowledge calculated by finding out the difference between
post and pre exposure knowledge of the patients. For evaluating the
questionnaires, one score was awarded for each correct and zero for wrong
answer, respectively. Effect of nutrition education was assessed by applying
impaired’t’ test to see its impact on gain in knowledge which was calculated using
the following equation.
Gain in knowledge = Score of post test - Score of pre test.
b. Physical fitness
To assess the physical fitness, Harvard Step test was conducted as per
the method suggested by Weiner and Laurie (1969).

119
11
9
This test was performed by the subject stepping on and off a bench 14"
height 30 times a minute or until the subject was able to do it. Stepping should be
in time to metronome beating at half second interval. Stepping up with one leg on
the first beat, up with the other leg on the second beat, down with the first leg on
third beat and down with the other leg on final beat of the cycle. It was
permissible to change the step from time to time. The subject must stand erect at
each step on the bench. If the subject failed to keep-up with the metronome for
15 seconds exercise was stopped and duration of exercise was recorded at the
time of stoppage. To note the duration of exercise stop watch was used. The
pulse count was made from one to one and half minutes. The Rapid Fitness
Index (RFI) was calculated as follows:
Duration of exercise in second RFI = -------------------------------------------------------------------- x 100 5.5 x (Pulse count 1-1.5 min after the exercise)
The norms followed for the test were:
Below 50 - Poor fitness
50 - 80 - Average fitness
Above 80 - Good fitness
3.6.4 Formulation of suitable Recipes for the Cardiac patients
Different products viz beverages, juices, RTS, squash and syrup were
prepared by using bottle gourd and aloe-vera. An effort was made to prepare low
caloric products by substituting in place of sugar suiting to the palate of cardiac
patients as well as other health conscious strata of the society. Bottle gourd
(Lagenaria siceraria) and Aloe-vera (Aloe barbadensis) were mainly taken for
the study as these have a therapeutic uses and act as functional food for cardiac
patients. The various products viz. aloe-vera and bottle gourd juice, dietetic
based aloe-vera beverage, RTS, squash and syrup were also prepared by using
these two functional foods. Since Arjuna bark (Terminalia arjuna), Dalchini (
Cinnamomum zeylanicum), linseed(Linum usitatisimum), Oat(Avena sativa) and
Giloy( Tinapora cordifolia) are also known to their medicinal value and functional

120
12
0
constituents of cardiac health, an effort was made to develop and formulate
certain recipes viz. Beverages, Soups, Porridges, Breakfast items, Dry mixtures
and Main meals by using these ingredients. The detailed recipes are given in
appendix (III).
a. Procurement of selected raw ingredients
Bottle gourd was procured from the local market and Aloe-vera from
local area of the Palampur at optimum maturity period.
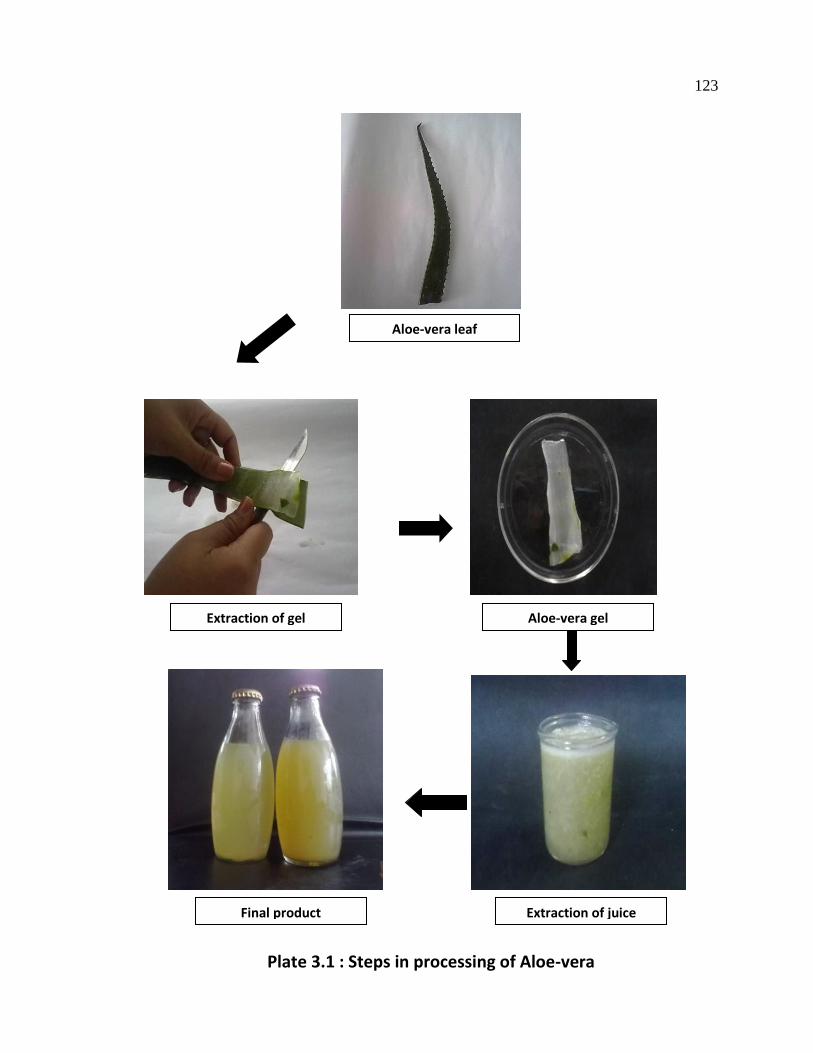
a.1 Processing of raw materials
After selecting fruits of bottle gourd, were washed to remove dirt and
extraneous matter, removed heads, peeled and cut into approximately 12 mm
thick pieces. Aloe- vera leaves were also washed, cleaned and then lower part of
leaf base or the white part attached to the stem of plant, and the tapering point of
the top, and sharp spines located along the leaf margins were removed by a sharp
knife. Then with the help of knife mucilage layer was removed lie below the green top
rind then similarly bottom rind was also removed (Plate 3.1).
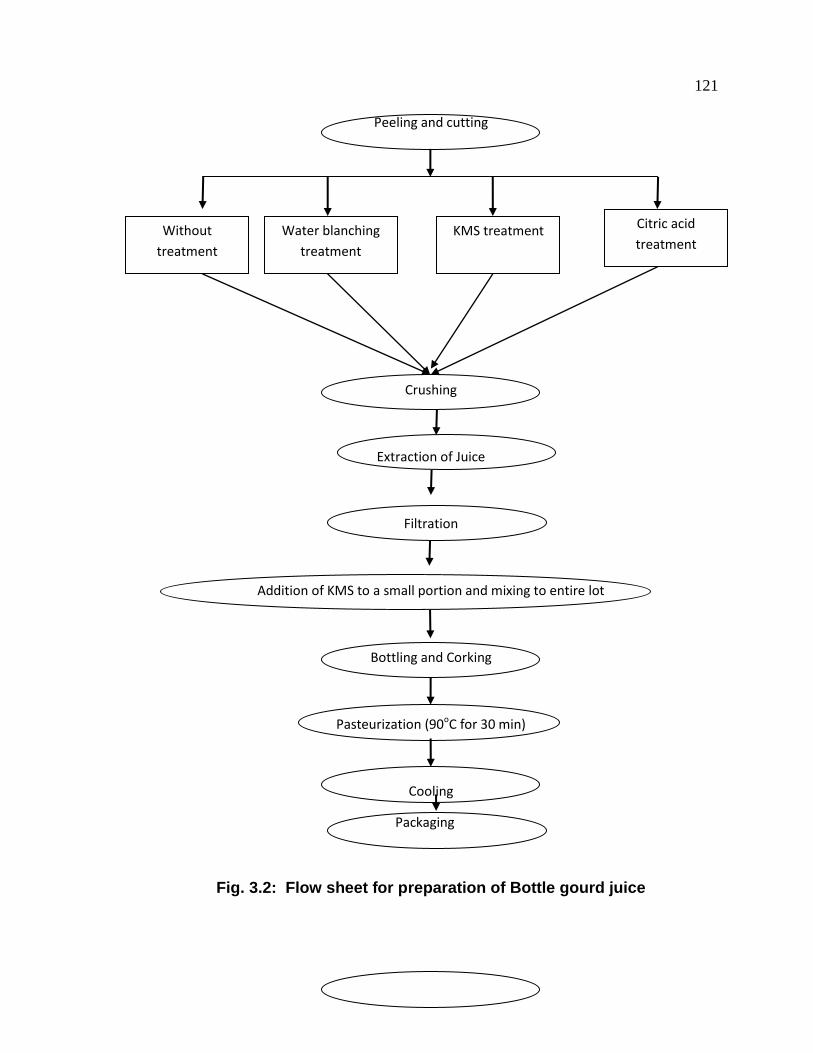
a.2 Preparation of juice
The prepared pieces of bottle gourd and aloe-vera gel were divided
into four different lots and then subjected to following treatments.
i) Untreated
ii) Water blanched for 3 minutes
iii) KMS (1% w/v) treated
iv) Citric acid (1% w/v) treated
Then the treated pieces and extracted gel were crushed in a blender to extract
the juice which stored still further use. The detailed process is shown in Figure
3.2 and 3.3.
Washing of fruit
121
12
1
Peeling and cutting
Crushing
Extraction of Juice
Filtration
Addition of KMS to a small portion and mixing to entire lot
Bottling and Corking
Pasteurization (90oC for 30 min)
Cooling
Packaging
Fig. 3.2: Flow sheet for preparation of Bottle gourd juice
Water blanching
treatment
KMS treatment
Citric acid
treatment
Without
treatment

122
12
2
Washing of leaves
separation of gel
Crushing
Extraction of Juice
Filtration
Addition of KMS to a small portion and mixing to entire lot
Bottling and Corking
Pasteurization (90oC for 30 min)
Cooling and Packaging
Fig 3.3: Flow sheet for preparation of Aloe-vera juice
Water blanching
treatment
KMS treatment
Citric acid
treatment
No treatment
123
12
3
Plate 3.1 : Steps in processing of Aloe-vera
Aloe-vera leaf
Extraction of gel Aloe-vera gel
Final product Extraction of juice

124
12
4
a.3 Development of Low Calorie Aloe-vera based RTS, Squash and Syrup
The extracted juice of aloe-vera was further used for the preparation of
sorbitol and sugar based RTS, squash and syrup. Zero caloric beverage was
prepared by substituting stevioside in place of sugar (Figure 3.4). The detailed
procedure is given in appendix III.
i. Nutritional and Chemical Evaluation
a. Moisture (AOAC 1990)
The moisture was determined on the basis of AOAC method. Weighed
samples (5 g) in triplicate were dried for eight hours in a hot air oven at 105oC in
pre-weighed moisture dishes. The dishes were transferred immediately to
desiccators, cooled and weighed. The losses in weight represented the moisture
content of the samples.
Calculations
Weight of empty dish = W (g)
Weight of sample = W1 (g)
Weight of dish + sample before drying = X (g)
Weight of crucible + sample after drying = Y (g)
Loss of weight Per cent moisture = –––––––––––––––––– X 100 Weight of sample (g)
(X–W) –– (Y–W) Per cent Moisture = ––––––––––––––––– X 100 W1

125
12
5
Water + sugar/ dietetic
Preparation of syrup
Addition of pulp
Adjusting TSS
Addition of KMS to a small portion and mixing to entire lot
Bottling and Corking
Pasteurization (90oC for 30 min)
Cooling and Packaging
Fig 3.4: Flow sheet for preparation of Sugar and Dietetic Aloe-vera based Beverage, RTS, Squash and Syrup
b. Per cent Ash
The ash content was obtained as laid down in literature (AOAC 1990).
Squash Syrup RTS Beverage

126
12
6
After determining the moisture content, the samples in the crucibles were burnt
on a hot plate and then placed in a muffle-furnace at 600oC for 4 hours. From the
weight of residue left in crucible, the total ash content was calculated as follows:
Calculations
Weight of empty crucible = W (g)
Weight of empty crucible + sample before drying = W1 (g)
Weight of empty crucible + sample after drying = W2 (g)
Weight after ashing (g) Per cent Ash = –––––––––––––––––– X 100 Weight of sample (g) W2 – W Per cent Ash = ––––––––– X 100 W1 – W
c. Fat (AOAC 1990)
Reagent
Petroleum ether (B.P. 60-80oC)
Procedure
Weighed samples of 5.0 g each in triplicate were extracted with petroleum
ether (60-80°C BP) in Soxhlet extraction apparatus for 18 hours. The ether
extract was filtered through a sintered funnel in a pre-weighed beaker and was
washed with small volume of petroleum ether 2-3 times. The petroleum ether
was completely evaporated and the beakers were weighed. The increase in the
weight of beakers represented the fat content present in the samples.
Calculations
Weight of sample = W (g)

127
12
7
Weight of empty beaker = W1 (g)
Weight of beaker + fat extract = W2 (g)
Amount of ether extract (g) Per cent Fat = ––––––––––––––––––––– X100 Weight of sample (g) W2 – W1 Per cent Fat = ––––––––– X 100 W
d. Crude Protein (AOAC 1990)
Reagents
Digestion mixture : One part of copper sulphate + 10 parts of potassium
sulphate
Boric acid solution : 4.0 per cent
Sodium hydroxide : 40.0 per cent
Standard H2SO4 : 0.1 N
Mixed indicator : 0.1 (g) Methyl red and 0.5 (g) Bromocreasol green in
100ml of 95.0 percent ethanol
Procedure
Weighed sample (2 g) was digested with concentrated sulphuric acid (25
ml) and digestion mixture (5 g) in Kjeldahl digestion flask. The content were
cooled and transferred to 250 ml volumetric flask. The volume was made upto
the mark with distilled water and mixed. Measured aliquot (5 ml) was taken in a
distillation flask followed by 40.0 per cent Sodium hydroxide and ammonium
borate was collected through a condenser in a flask containing (10 ml) of 4.0 per
cent boric acid solution. The distillate was titrated with 0.1 N sulphuric acid. A
blank sample was also run along with the sample.
Calculations
Initial burette reading = a
Final burette reading = b

128
12
8
Volume used (Titre value) = (a – b) ml
Volume made up = 250 ml
Aliquot taken = 5 ml
Weight of sample = 1.0 g
Titre value x 0.00014 x Volume made x 100 Per cent nitrogen = –––––––––––––––––––––––––––––––––– Aliquot taken (g) x Weight of sample (g) (a-b) x 0.00014 x 250 x 100 Per cent nitrogen = –––––––––––––––––––––– 5 x 2
Per cent crude protein = Per cent nitrogen x 6.25
e. Crude Fibre (AOAC 1990)
Reagents
Sulphuric acid : 1.25 per cent
Sodium hydroxide : 1.25 per cent
Weighed defatted samples (5 g) each in triplicate were digested with 200
ml of 1.25 per cent sulphuric acid by gentle boiling for half an hour. The contents
were filtered and the residue was washed free of acid using hot distilled water.
Acid free residue was then transferred to the same flask to which 200 ml of 1.25
per cent sodium hydroxide was added. The contents were digested again for half
an hour, filtered and again washed free of alkali using hot distilled water. The
residue was dried in an oven overnight at 105oC, weighed and then placed in the
muffle furnace at 600oC for 4 hours. The loss in weight after ignition represented
the crude fibre in the sample.
Calculations
Weight of sample = W (g)
Weight of crucible = W1 (g)

129
12
9
Weight of empty crucible + = W2 (g)
Sample before ignition
Weight of empty crucible + = W3 (g)
Sample after ignition
Weight of sample – Weight of sample (before ignition) (after ignition) Per cent Crude fibre = –––––––––––––––––––––––––––––––––x 100 Weight of sample (W2 – W1) – (W3 – W1) Per cent Crude fibre = –––––––––––––––––––– x 100 W
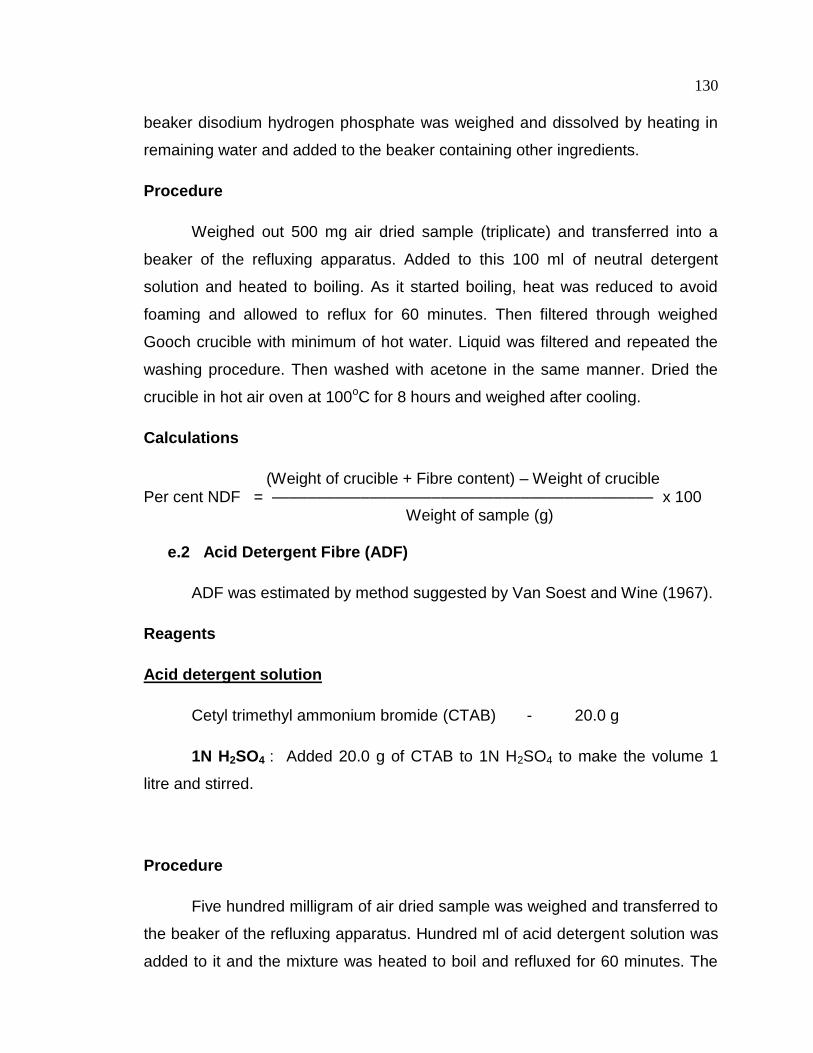
e.1 Neutral Detergent Fibre (NDF)
NDF was estimated by the method suggested by Van Soest and Wine
(1967).
Reagents
Neutral detergent solution
Sodium borate decahydrate - 6.18 g
Sodium lauryl Sulphate - 30.00 g
2-ethoxy ethanol - 10.00 ml
Disodium ethylene diamino tetra acetate (EDTA) - 18.16 g
Water - 1.00 L
Disodium hydrogen phosphate - 5.00 g
Disodium hydrogen phosphate:
Weighed together EDTA and sodium borate decahydrate in a large
beaker. Added some amount of water and heated the solution till the content
dissolved. Then sodium lauryl sulphate was added to the solution. In a separate
130
13
0
beaker disodium hydrogen phosphate was weighed and dissolved by heating in
remaining water and added to the beaker containing other ingredients.
Procedure
Weighed out 500 mg air dried sample (triplicate) and transferred into a
beaker of the refluxing apparatus. Added to this 100 ml of neutral detergent
solution and heated to boiling. As it started boiling, heat was reduced to avoid
foaming and allowed to reflux for 60 minutes. Then filtered through weighed
Gooch crucible with minimum of hot water. Liquid was filtered and repeated the
washing procedure. Then washed with acetone in the same manner. Dried the
crucible in hot air oven at 100oC for 8 hours and weighed after cooling.
Calculations
(Weight of crucible + Fibre content) – Weight of crucible Per cent NDF = ––––––––––––––––––––––––––––––––––––––––––– x 100 Weight of sample (g)
e.2 Acid Detergent Fibre (ADF)
ADF was estimated by method suggested by Van Soest and Wine (1967).
Reagents
Acid detergent solution
Cetyl trimethyl ammonium bromide (CTAB) - 20.0 g
1N H2SO4 : Added 20.0 g of CTAB to 1N H2SO4 to make the volume 1
litre and stirred.
Procedure
Five hundred milligram of air dried sample was weighed and transferred to
the beaker of the refluxing apparatus. Hundred ml of acid detergent solution was
added to it and the mixture was heated to boil and refluxed for 60 minutes. The

131
13
1
mixture was then filtered through a weighed Gooche crucible on filter manifold.
The sample was rinsed into the crucible with minimum amount of hot water.
Filtered the liquid and washing was repeated. Then the sample was dried at
100oC for 8 hours in hot air oven and weighed.
Calculations
(Weight of crucible + Fibre content) – Weight of crucible Per cent ADF = –––––––––––––––––––––––––––––––––––––––––––– x 100 Weight of sample
f. Total Soluble Solids (Ranganna 2006)
The TSS was determined in triplicate using Hand Refractometer and the
values were expressed in degree Brix. A temperature correction was also applied
when the temperature was above or below 20°C( Appendix iv).
g. pH (Ranganna 2006)
The pH of the samples was determined with the help of pH meter. The
equipment was standardized with buffer solution of pH of 4.0 and 9.0.
h. Acidity (Ranganna 2006)
Reagent
NaOH solution : 0.1 N NAOH
Phenolphthalein indicator : 1 per cent
Procedure
Five gram sample was taken and transferred into a flask. The volume was
made upto 50 ml with distilled water. The mixture was boiled for half an hour by
replacing water losses. Five milliliter aliquot was taken and titrated with 0.1 N
NaOH and phenolphthalein was used as an indicator. The end point was the
development of faint pink colour which persisted for 15 seconds.
Titre x Normality of alkali x Volume made up x 64 Per cent Acidity = –––––––––––––––––––––––––––––––––––––– x100

132
13
2
(as citric acid) Volume of aliquot taken x Wt of sample(g) x 1000
i. Ascorbic Acid (Ranganna 2006)
The ascorbic acid estimation was done by the method of Ranganna
(2006). Ascorbic acid was estimated by using 2, 6-dichlorophenol indophenol
dye.
Procedure
5 g sample was taken and blended with 3 per cent HPO3 and made the
volume to 50 ml with HPO3 and filtered. Then 5 ml aliquot was taken and titrated
with standard dye to a pink colour persisted for 15 seconds..
Calculations
Titre x Dye factor x Volume made up x 100 Ascorbic acid = ––––––––––––––––––––––––––––––––––– (mg/100g) Aliquot taken for estimation x Wt of sample(g)
j. Sugars
Sugars were estimated by Lane and Eynon’s method (1923) as reported
by Ranganna (2006).
1. Total sugars
2. Reducing sugars
3. Non-reducing sugars
Calculations
mg of invert sugar x Dilution 1. Total sugars percent = ––––––––––––––––––––––––––X 100 Titre value x wt of sample (g)
mg of invert sugar x Dilution 2. Reducing sugars percent = –––––––––––––––––––––––––– X 100 Titre value x wt of sample (g)
3. Non-reducing sugars percent = [Total sugar – Reducing sugars] X 0.95
133
13
3
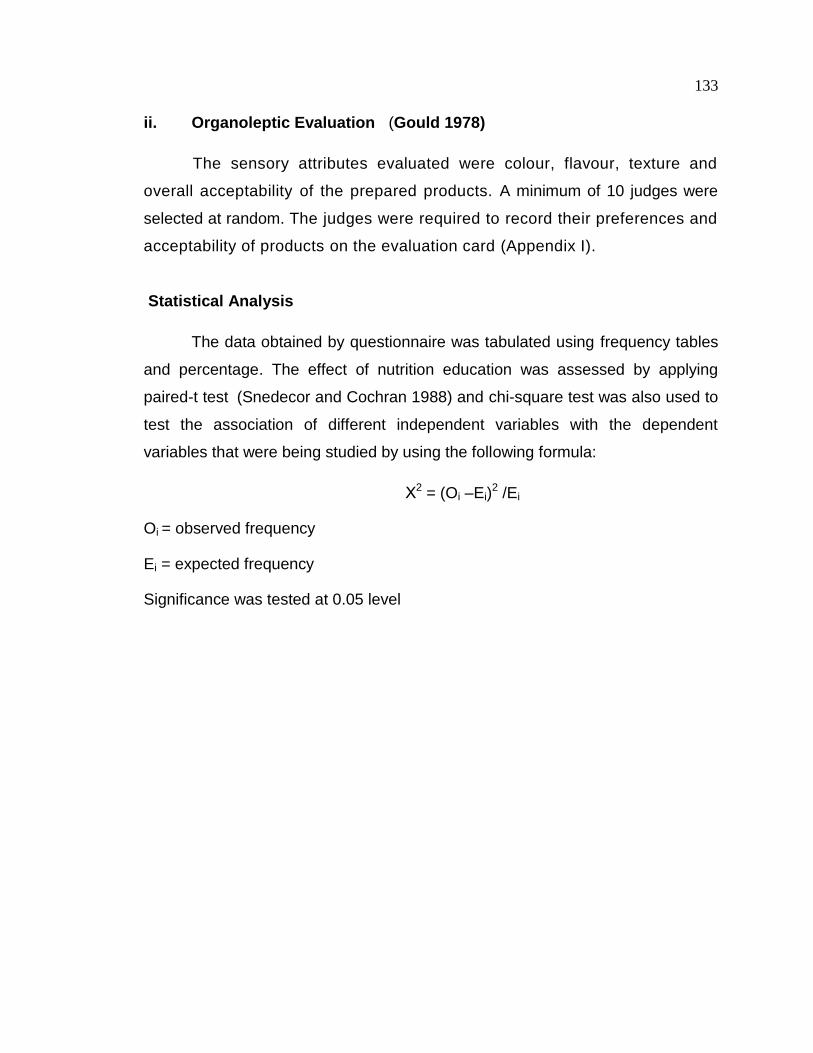
ii. Organoleptic Evaluation (Gould 1978)
The sensory attributes evaluated were colour, flavour, texture and
overall acceptability of the prepared products. A minimum of 10 judges were
selected at random. The judges were required to record their preferences and
acceptability of products on the evaluation card (Appendix I).
Statistical Analysis
The data obtained by questionnaire was tabulated using frequency tables
and percentage. The effect of nutrition education was assessed by applying
paired-t test (Snedecor and Cochran 1988) and chi-square test was also used to
test the association of different independent variables with the dependent
variables that were being studied by using the following formula:
Χ2 = (Oi –Ei)2 /Ei
Oi = observed frequency
Ei = expected frequency
Significance was tested at 0.05 level