Embed Size (px)
Citation preview
GENERAL PRINCIPLE! OF POLAROGRAPHY
GENERAL PRINCIPLES OF POLAROGRAPHY
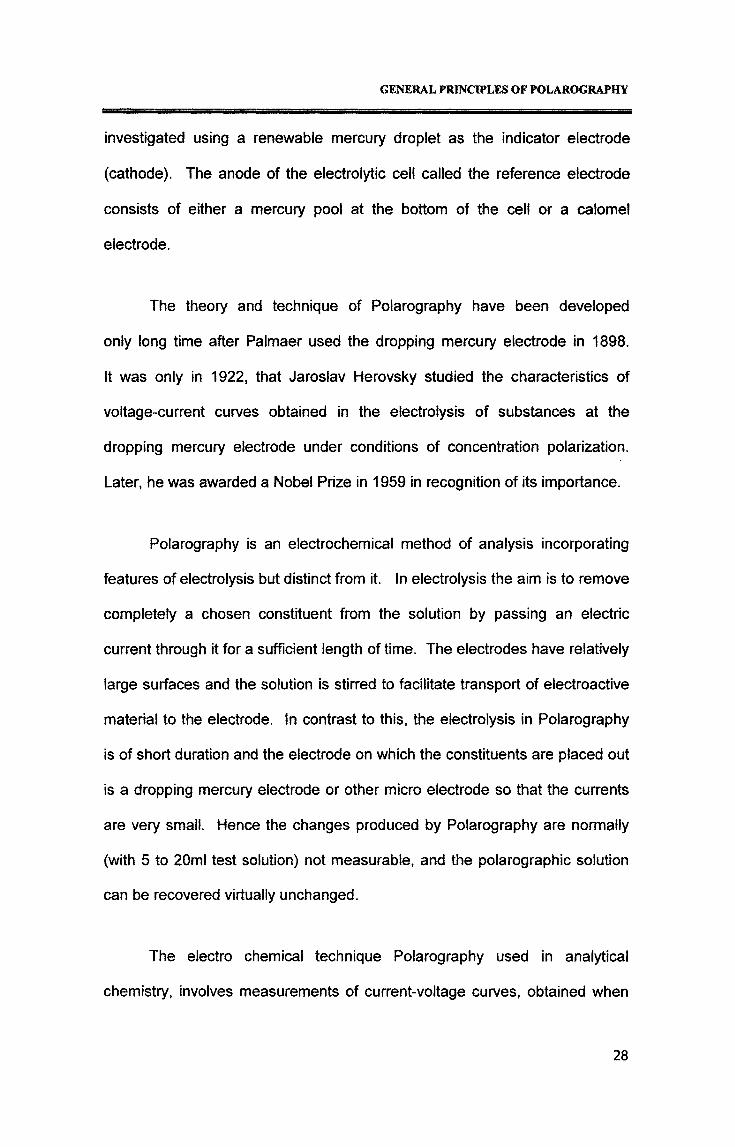
a) Theory and Applications of Polarography
Voltammetry comprises a group of electro analytical methods in
which information about the analyte is derived from the measurement of
current as a function of applied potential obtained under conditions that
encourage polarization of the indicator or working electrode. Generally, the
working electrodes in Voltammetry are characterized by their small surface
area [usually a few square millimeters] which enhances polarization. Such
electrodes are generally referred to as micro electrodes.
At the outset, it is worthwhile pointing out the basic differences
between Voltammetry and the two types of electrochemical methods viz:
Coulometry and Potentiometry. Voltammetry is based upon the measurement
of a current that develops in an electrochemical cell under conditions
of complete concentration polarization. In contrast, in potentiometry the
unknown potential of an electrode is measured against a reference electrode
with known potential by balancing the potential difference between the two
against a known but opposite voltage. During this balancing process every
effort is made to avoid any flow of current since this might polarize
an electrode. Voltammetry differs from coulometry in the respect that with
the tatter, measures are taken to minimize or compensate for the
effects of concentration polarization. Furthermore, in Voltammetry a minimal
consumption of analyte takes place, whereas in coulometry essentially all
of the analyte is converted to another state.
Polarography is that branch of Voltammetry in which changes in
current, resulting from the electrolysis of the solution under study are
27
GENERAL PRINCIPLES OF POLAROGRAPHY
investigated using a renewable mercury droplet as the indicator electrode
(cathode). The anode of the electrolytic cell called the reference electrode
consists of either a mercury pool at the bottom of the cell or a calomel
electrode.
The theory and technique of Polarography have been developed
only long time after Palmaer used the dropping mercury electrode in 1898.
It was only in 1922, that Jaroslav Herovsky studied the characteristics of
voltage-current curves obtained in the electrolysis of substances at the
dropping mercury electrode under conditions of concentration polarization.
Later, he was awarded a Nobel Prize in 1959 in recognition of its importance.
Polarography is an electrochemical method of analysis incorporating
features of electrolysis but distinct from it. In electrolysis the aim is to remove
completely a chosen constituent from the solution by passing an electric
current through it for a sufficient length of time. The electrodes have relatively
large surfaces and the solution is stirred to facilitate transport of electroactive
material to the electrode. In contrast to this, the electrolysis in Polarography
is of short duration and the electrode on which the constituents are placed out
is a dropping mercury electrode or other micro electrode so that the currents
are very small. Hence the changes produced by Polarography are normally
(with 5 to 20ml test solution) not measurable, and the polarographic solution
can be recovered virtually unchanged.
The electro chemical technique Polarography used in analytical
chemistry, involves measurements of current-voltage curves, obtained when
28
GENERAL PRINCIPLES OF POLAROGRAPHY
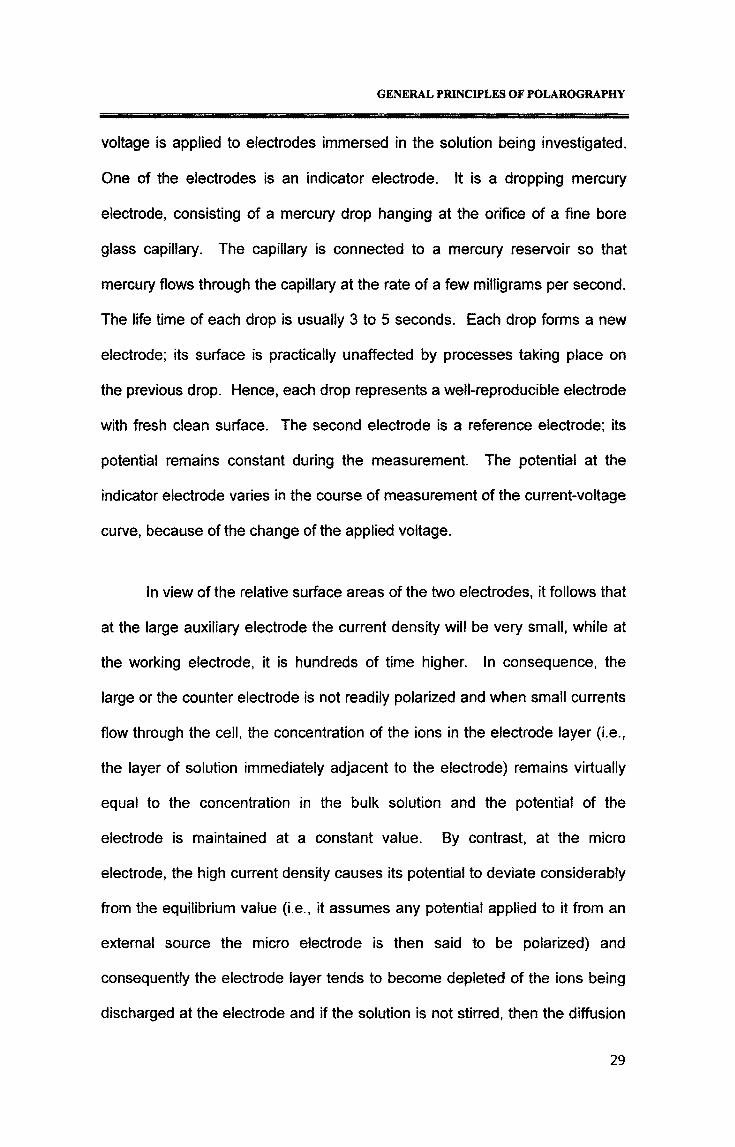
voltage is applied to electrodes immersed in the solution being investigated.
One of the electrodes is an indicator electrode. It is a dropping mercury
electrode, consisting of a mercury drop hanging at the orifice of a fine bore
glass capillary. The capillary is connected to a mercury reservoir so that
mercury flows through the capillary at the rate of a few milligrams per second.
The life time of each drop is usually 3 to 5 seconds. Each drop forms a new
electrode; its surface is practically unaffected by processes taking place on
the previous drop. Hence, each drop represents a well-reproducible electrode
with fresh clean surface. The second electrode is a reference electrode; its
potential remains constant during the measurement. The potential at the
indicator electrode varies in the course of measurement of the current-voltage
curve, because of the change of the applied voltage.
In view of the relative surface areas of the two electrodes, it follows that
at the large auxiliary electrode the current density will be very small, while at
the working electrode, it is hundreds of time higher. In consequence, the
large or the counter electrode is not readily polarized and when small currents
flow through the cell, the concentration of the ions in the electrode layer (i.e.,
the layer of solution immediately adjacent to the electrode) remains virtually
equal to the concentration in the bulk solution and the potential of the
electrode is maintained at a constant value. By contrast, at the micro
electrode, the high current density causes its potential to deviate considerably
from the equilibrium value (i.e., it assumes any potential applied to it from an
external source the micro electrode is then said to be polarized) and
consequently the electrode layer tends to become depleted of the ions being
discharged at the electrode and if the solution is not stirred, then the diffusion
29
GENERAL PRINCIPLES OF POLAROGRAPHY
of ions across the resultant concentration gradient takes place. The working
electrode being perfectly polarisable assumes the correspondingly increasing
negative potential applied to it; very small current flows in the cell until the
decomposition potential is reached. As the cathode potential is made
progressively more negative, than the decomposition potential, current
suddenly commences to increase until the current approaches a steady
limiting value. Inspite of the fact that the reducible ion in the bulk of the
solution diffuses slowly towards the electrode, a point is reached where the
reducible ion or compound is nearly depleted at the electrode, a further
increase in e.m.f causes practically no increase in current unless a second
compound able to depolarize the working electrode is present in the solution.
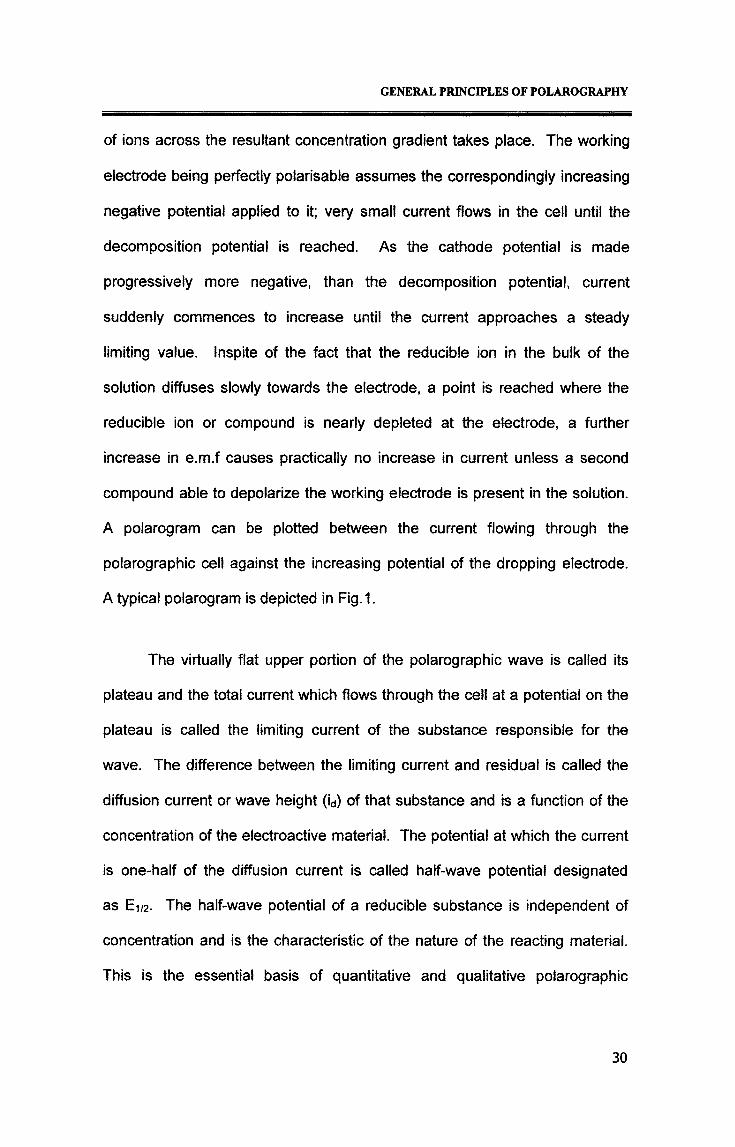
A polarogram can be plotted between the current flowing through the
polarographic cell against the increasing potential of the dropping electrode.
A typical polarogram is depicted in Fig,1.
The virtually flat upper portion of the polarographic wave is called its
plateau and the total current which flows through the cell at a potential on the
plateau is called the limiting current of the substance responsible for the
wave. The difference between the limiting current and residual is called the
diffusion current or wave height (id) of that substance and is a function of the
concentration of the electroactive material. The potential at which the current
is one-half of the diffusion current is called half-wave potential designated
as E-j/2- The half-wave potential of a reducible substance is independent of
concentration and is the characteristic of the nature of the reacting material.
This is the essential basis of quantitative and qualitative polarographic
30
Cur
rent
mic
roam
pers
©
o **
__
____
____
_O
Fig. 1: Typical polarogram obtained with the dropping
mercury electrode.
GENERAL PRINCIPLES OF POLAROGRAPHY
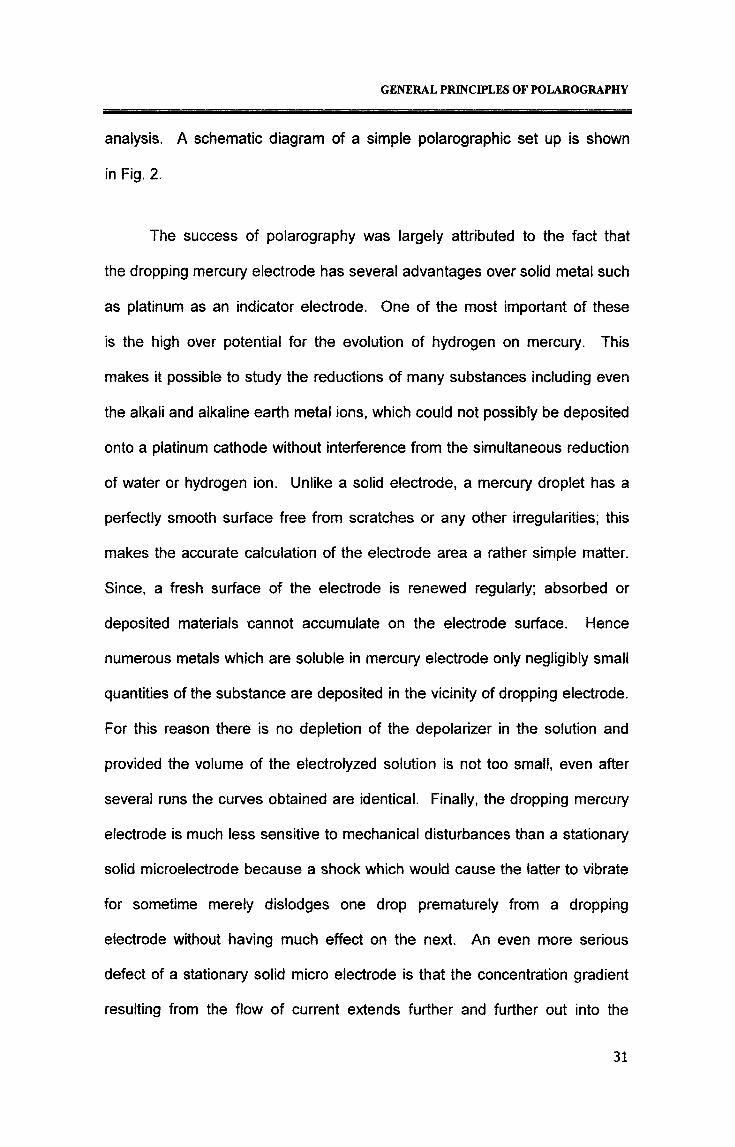
analysis, A schematic diagram of a simple polarographic set up is shown
in Fig. 2.
The success of polarography was largely attributed to the fact that
the dropping mercury electrode has several advantages over solid metal such
as platinum as an indicator electrode. One of the most important of these
is the high over potential for the evolution of hydrogen on mercury. This
makes it possible to study the reductions of many substances including even
the alkali and alkaline earth metal ions, which could not possibly be deposited
onto a platinum cathode without interference from the simultaneous reduction
of water or hydrogen ion. Unlike a solid electrode, a mercury droplet has a
perfectly smooth surface free from scratches or any other irregularities; this
makes the accurate calculation of the electrode area a rather simple matter.
Since, a fresh surface of the electrode is renewed regularly; absorbed or
deposited materials cannot accumulate on the electrode surface. Hence
numerous metals which are soluble in mercury electrode only negligibly small
quantities of the substance are deposited in the vicinity of dropping electrode.
For this reason there is no depletion of the depolarizer in the solution and
provided the volume of the electrolyzed solution is not too small, even after
several runs the curves obtained are identical. Finally, the dropping mercury
electrode is much less sensitive to mechanical disturbances than a stationary
solid microelectrode because a shock which would cause the latter to vibrate
for sometime merely dislodges one drop prematurely from a dropping
electrode without having much effect on the next. An even more serious
defect of a stationary solid micro electrode is that the concentration gradient
resulting from the flow of current extends further and further out into the
31
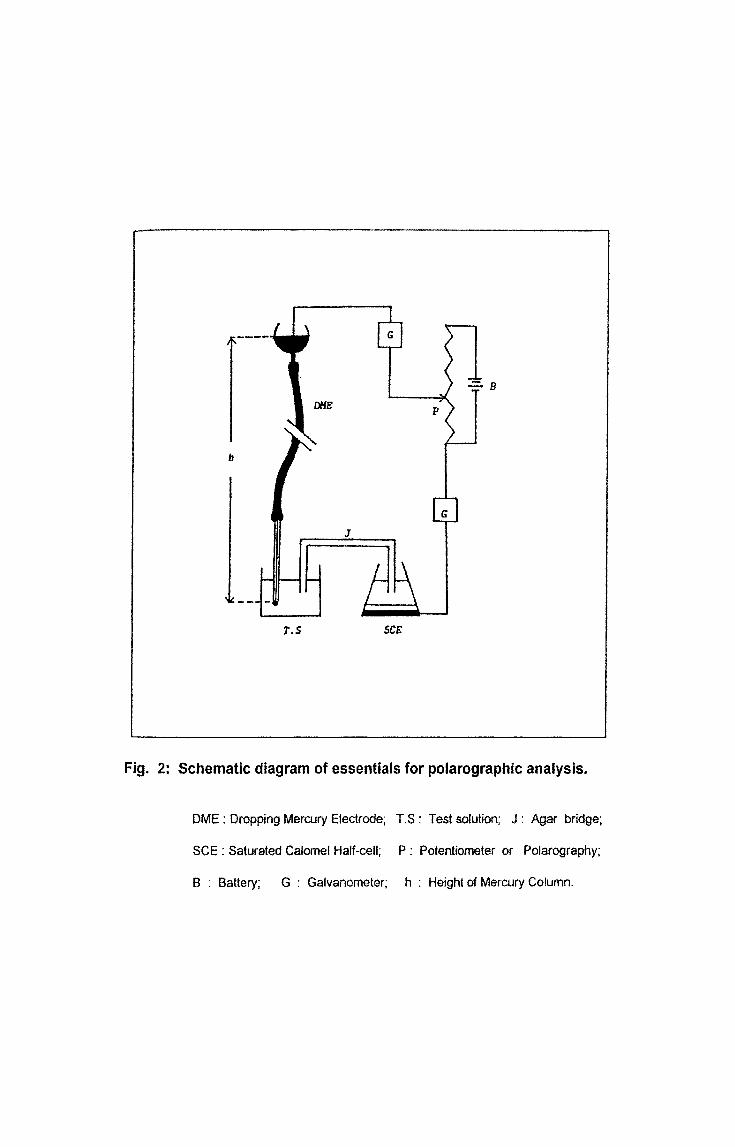
Fig. 2: Schematic diagram of essentials for polarographic analysis.
DME : Dropping Mercury Electrode; T.S : Test solution; J : Agar bridge;
SCE : Saturated Calomel Half-cell; P : Potentiometer or Polarography;
B : Battery; G : Galvanometer; h : Height of Mercury Column.
GENERAL PRINCIPLES OF POLAROGRAPHY
solution as time goes on, so that ions must diffuse through a greater
and greater distance to reach the electrode surface, resulting in a steady
decrease of the current.
On the other hand, there are certain definite limitations associated
with the dropping electrode. The dropping mercury electrode may be applied
over the range +0.4 to about -2.0 volts with reference to S.C.E. At about
+0.4 volt mercury dissolves and gives an anodic wave; it begins to oxidize
to mercury (I) ion. At potentials more negative than about -1.8 Volts vs.
S.C.E, visible hydrogen evolution occurs in acid solutions and the usual
supporting electrolytes commence to discharge. The range may be extended
to about -2.6 Volts vs S.C.E by using supporting electrolytes having
higher reduction potentials than the alkali metals. For work at potentials
where mercury undergoes oxidation, other types of electrodes must,
therefore, be sought.
From the stand point of analytical chemistry, the sensitivity of
polarography is restricted by the charging current caused by the growth of the
drop. From the theoretical point of view a serious complication in the
mathematical formulation is introduced by the necessity of considering the
growth of the drop. The current varies between a minimum and maximum for
each drop of mercury it forms, since there is periodic change in the surface
area of the drop. Therefore, the graph lines obtained are actually not smooth
lines but are saw toothed lines. The amplitude of the fluctuation is small;
however, smooth lines can easily be drawn between them to represent the
average current during the drop life.
32
GENERAL PRINCIPLES OF POLAROGRAPHY
POLAROGRAPHIC CURRENTS
The total current that flow in, consists of the following components:
a) Residual Current,
b) Migration Current and
c) Diffusion Current.
a) Residual Current
The current that flows in the absence of the depolarizer (i.e. due to the
supporting electrolyte) is called residual current. This has to be taken into
consideration while interpreting the polarograms.
b) Migration Current
It is the current due to migration of ions caused by the electrostatic
field between the two polarographic electrodes. The contribution of this
component is minimized under experimental conditions by taking large
concentrations of the supporting electrolyte. Under these conditions, only
ions of the supporting electrolyte migrate in electrostatic field. The ions of
the depolarizer do not take part in migration. They reach the surface of the
electrode by the process of diffusion.
c) Diffusion Current
Diffusion current is due to electroactive substances. When the
potential of the d.m.e is in the plateau region the electroactive ions or
molecules are reduced or oxidized as soon as they reach the electrode
surface. As a result they are consumed and their concentration in a thin layer
of solution in contact with the electrode becomes zero. Now, there is a
33
GENERAL PRINCIPLES OF POLAROGRAPHY
concentration gradient of the depolarizer in the solution and the electroactive
ions or molecules diffuse towards the drop from adjacent layers a little further
away from the electrode resulting in the limiting current. When the mercury
drop falls, the solution rushes into that space and the concentration gradient
disappears when a new drop is formed, diffusion takes place again at the
same rate as described earlier. The average current during the life time of
each drop is the same and thus it leads to the flat plateau on the polarogram.
The limiting current of a wave is very important and is called diffusion
current as it reflects the rate at which the ions or molecules of the depolarizer
reach the electrode surface under the influence of a diffusion force. The basis
for the quantitative polarographic analysis is the existence of the linear
proportionality between the diffusion current and the concentration of the
depolarizer as given by Ilkovic equation.
id = 607 n D1/2 C mm t1/6 .....(1)
where,
id = Average diffusion current, pA (lO^amps)
n = Number of Faradays per mol involved in the electrode
reaction
D = Diffusion coefficient of the electroactive material,
(cm2/sec)
C = Concentration of the electroactive material,
(millimoles/litre).
m = rate of flow of mercury through the capillary, (mg/sec).
t = time between successive drops of mercury, (in seconds).
34
GENERAL PRINCIPLES OF POLAROGRAPHY
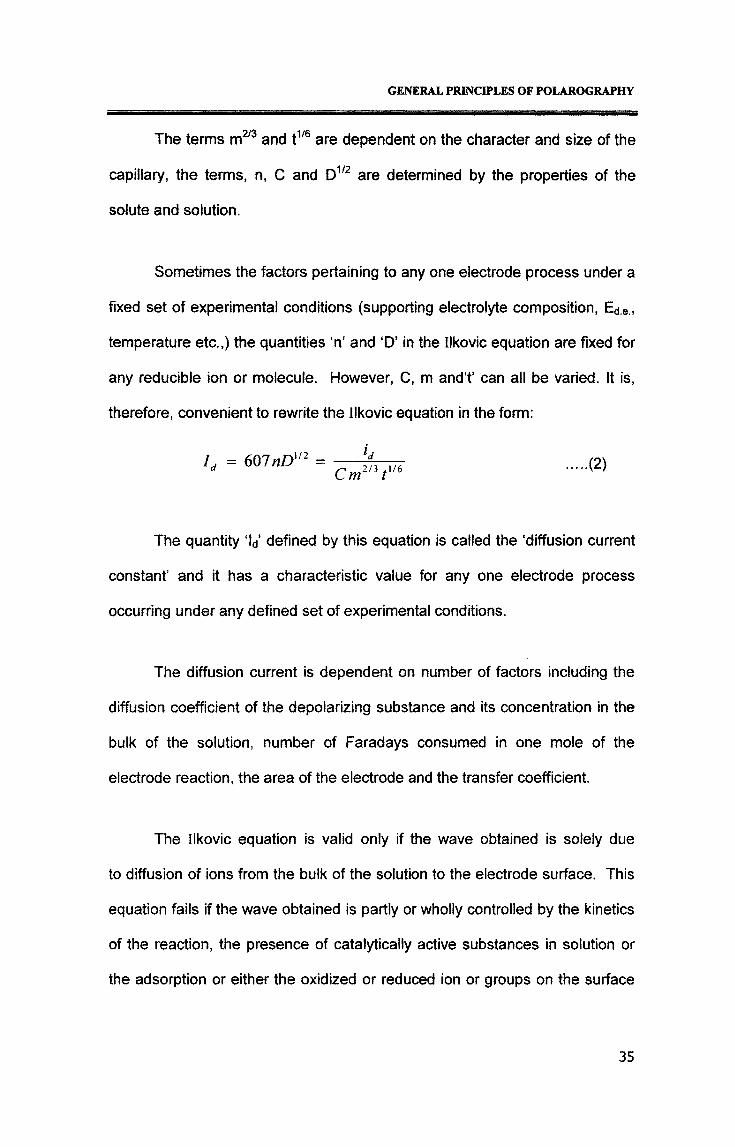
The terms m2'3 and t1/6 are dependent on the character and size of the
capillary, the terms, n, C and D1/2 are determined by the properties of the
solute and solution.
Sometimes the factors pertaining to any one electrode process under a
fixed set of experimental conditions (supporting electrolyte composition, Ed.e.,
temperature etc.,) the quantities ‘n’ and ‘D’ in the Ilkovic equation are fixed for
any reducible ion or molecule. However, C, m and't’ can all be varied. It is,
therefore, convenient to rewrite the Ilkovic equation in the form:
Id = 607nDi/2
Cm2ntm ■(2)
The quantity ‘ld’ defined by this equation is called the ‘diffusion current
constant’ and it has a characteristic value for any one electrode process
occurring under any defined set of experimental conditions.
The diffusion current is dependent on number of factors including the
diffusion coefficient of the depolarizing substance and its concentration in the
bulk of the solution, number of Faradays consumed in one mole of the
electrode reaction, the area of the electrode and the transfer coefficient.
The Ilkovic equation is valid only if the wave obtained is solely due
to diffusion of ions from the bulk of the solution to the electrode surface. This
equation fails if the wave obtained is partly or wholly controlled by the kinetics
of the reaction, the presence of catalytically active substances in solution or
the adsorption or either the oxidized or reduced ion or groups on the surface
35
GENERAL PRINCIPLES OF POLAROGRAPHY
of mercury drop. So the validity of this equation is decided by considering
whether the polarographic wave obtained, is diffusion controlled or not.
To decide this following factors are considered.
(1) The diffusion current id is proportional to 'm2/311/6, when the other
factors in the Ilkovic equation are constant. The drop time ‘t’ depends upon
the heights of mercury column. Hence, if the wave is diffusion controlled
K = . This is the frequently used method of ascertaining whether
the height of the wave is diffusion controlled or not. If ‘K’ is not constant
within the limits of experimental error over a wide range of the mercury
heights it may be concluded that the current must be either partly or wholly
governed by the rate of some process other than the diffusion of metal ions.
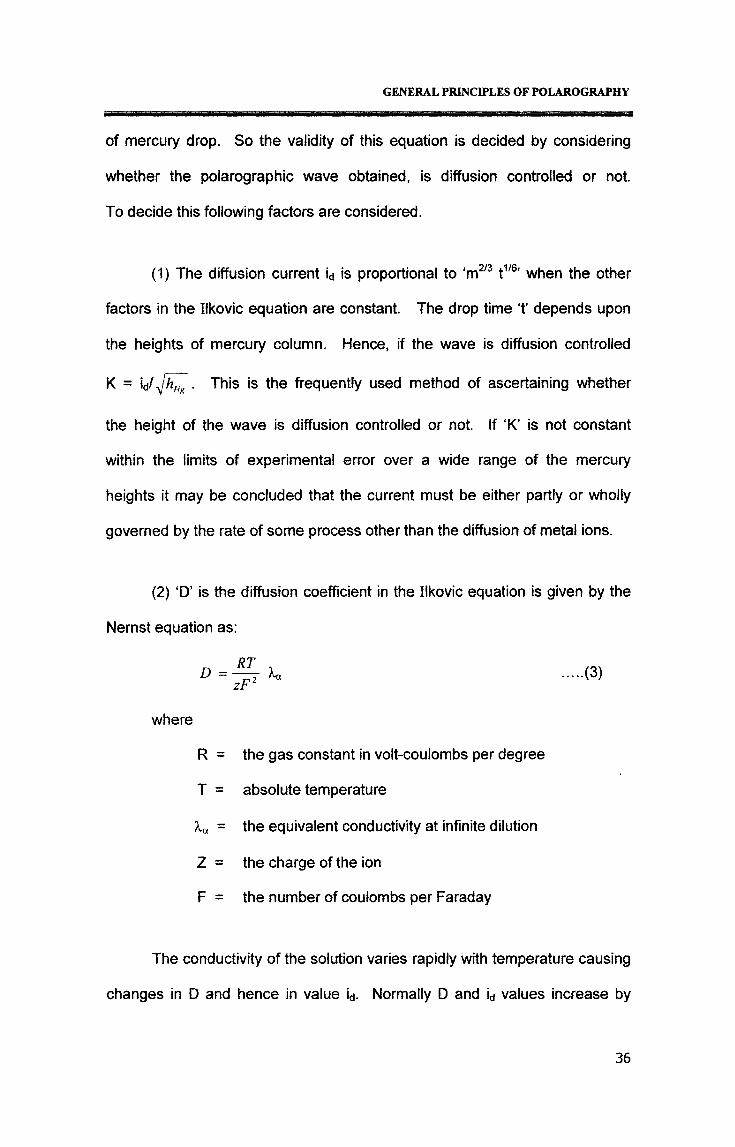
(2) ‘D’ is the diffusion coefficient in the Ilkovic equation is given by the
Nernst equation as:
.....(3)zF
where
R = the gas constant in volt-coulombs per degree
T = absolute temperature
Xa = the equivalent conductivity at infinite dilution
Z = the charge of the ion
F = the number of coulombs per Faraday
The conductivity of the solution varies rapidly with temperature causing
changes in D and hence in value id. Normally D and id values increase by
36
GENERAL PRINCIPLES OF POLAROGRAPHY
2 and 3 percent respectively per degree rise in temperature. High deviations
from these values are common tests for kinetic and catalytic currents.
(3) When other factors in the Ilkovic equation remain constant the
diffusion current ‘id’ is directly proportional to the concentration of the
reducible or oxidisable substances. Hence a graph plotted between the
diffusion current and concentration of the substance should give a straight
line if the wave is diffusion controlled. This forms the quantitative aspect of
polarography.
Complexation of a metal ion decreases the diffusion current if the
ligand is bigger in size to the water molecules it replaces and shifts the
half-wave potential generally to the more cathodic value. These two
variables induced by increasing concentration of ligand allows the
determination of coordination number, size and stability constants of
complexes in solution or serve to elucidate the kinetics of the rate determining
step depending upon the type of the electrode reaction.
Oxygen removal
Dissolved oxygen undergoes a two-step irreversible reduction at the
dropping electrode; the H202 produced in the first step is reduced to H20 in
the second. The two waves of equal size result, the first with a half-wave
potential at about -0.14 V and the second at about -0.9 V vs. S.C.E. The two
half-reactions are somewhat slow. As a consequence, the waves are drawn
out over a considerable potential range. While these polarographic waves
are convenient for the determination of oxygen in solutions, the presence of
37
GENERAL PRINCIPLES OF POLAROGRAPHY
this element often interferes with the accurate determination of other species.
Thus, gas accomplishes this end. A stream of the same gas, usually nitrogen,
is passed over the surface during the analysis to prevent re-absorption.
Nature of the Limiting Current
Besides diffusion currents, the limiting current is classified on the basis
of the nature of the process governing it as 1) Kinetic currents, 2) Catalytic
currents and 3) Adsorption currents.
Kinetic currents
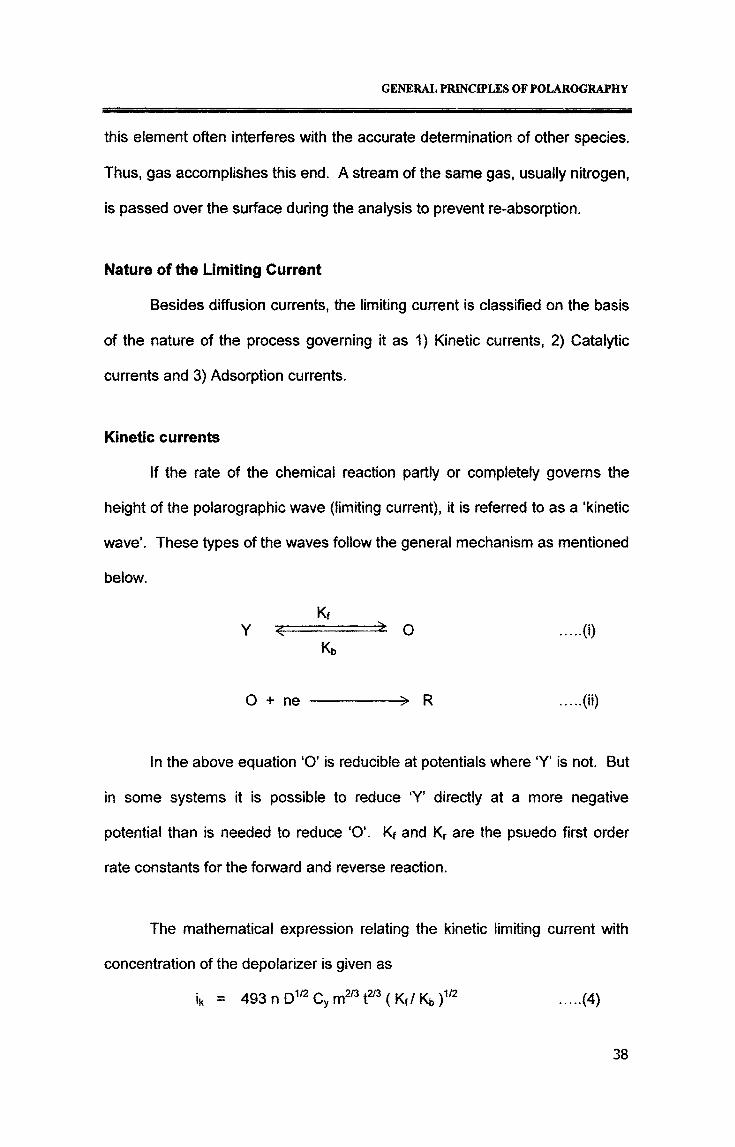
If the rate of the chemical reaction partly or completely governs the
height of the polarographic wave (limiting current), it is referred to as a ‘kinetic
wave’. These types of the waves follow the general mechanism as mentioned
below.
K,Y ...=..O ..... (i)
Kb
O + ne -------------------- > R ..... (ii)
In the above equation ‘O’ is reducible at potentials where ‘Y’ is not. But
in some systems it is possible to reduce ‘Y’ directly at a more negative
potential than is needed to reduce ‘O’. Kf and Kr are the psuedo first order
rate constants for the forward and reverse reaction.
The mathematical expression relating the kinetic limiting current with
concentration of the depolarizer is given as
ik = 493nD1/2Cym2/3t2/3(K,/Kb)1/2 ..... (4)
38
GENERAL PRINCIPLES OF POLAROGRAPHY
where
ik = average kinetic current during the life of the drop
D = diffusion coefficient of ‘Y’ or ‘O’
Cy= concentration of ‘Y’ in millimoles per litre
n = number of electrons transferred
m = mass of the drop in milligram
t = drop time in seconds.
Kinetic waves generally have high temperature coefficient. The limiting
current of a kinetic wave is independent of height of mercury column.
The plot between the limiting current and the concentration of the depolarizer
is linear, but this plot will not pass through the origin in case of kinetic waves.
Catalytic Current
The poiarographic wave corresponding to the electrode process which
follows the mechanism mentioned below is referred to as ‘Catalytic Wave’.
O + ne =^. R .....(iii)
R + Z -----------------> O (Fast) .....(iv)
Where ‘Z’ is not reduced when present alone at the electrode in the
potential range of study. However, it is reduced by the reduction product ‘R’
to regenerate the electroactive substance ‘O’. Thus the second step takes
place a number of times during the life of the drop and is responsible for the
great increase in the limiting current. The average catalytic current during the
life of a drop is represented by the equation
ic=493nDy2C0m2/3tui(Kf+Kr)Czo]y2 .....(5)
39
GENERAL PRINCIPLES OF POLAROGRAPHY
Where C0 is the concentration of ‘O’ expressed in millimoles per litre.
An equation relating the rate constant and limiting current can be give as
ic =l/5(l.255 X 106)nm2ntm Dm C0C1'2 KU2 .... (6)
where
ic = average catalytic current
n = number of electrons
D polarographic diffusion coefficient of the
depolarizer ‘O’
Co = concentration of the electroactive species in
millimoles per litre
= concentration of the electro-inactive species (z) in
the given potential range expressed in millimole
per litre.
K rate constant of the reaction producing the
electroactive species.
Catalytic currents being a special case of kinetic currents posses the
same characteristics as those of kinetic currents.
Adsorption currents
If either the electroactive species (or) the product of the electrode
reaction is adsorbed on the surface of the drop, adsorption currents are
observed. Suppose the product ‘R’ of the electrode reaction is adsorbed,
a single wave representing
O + ne ------------------ ► R .... (v)
40
GENERAL PRINCIPLES OF POLAROGRAPHY
the reduction of ‘O’ to adsorbed ‘R’ is noticed at low concentration of ‘O’.
The wave in such cases is still diffusion controlled and its height is
proportional to the concentration of ‘O’. As the concentration of ‘O’ increases,
a point will be reached at which enough of ‘R’ is formed during the life
of the drop to cover its entire surface. Beyond this point the excess ‘O’ added
is reduced to ‘R’ in the dissolved state at a more negative potential resulting
in the appearance of a second wave. The first wave is called the ‘adsorption
wave’, and the second ‘the normal wave’. The total height of the double wave
corresponds to the reduction of all of the ‘O’ diffusing to the surface of the
drop and is therefore diffusion controlled and its height is proportional to
the concentration of ‘O’ and h1/2.
the waves individually.
If on the other hand ‘O’ ii
wave obtained at low concentration of ‘O’ will represent the reduction of
adsorbed ‘O’. On increasing the concentration of ‘O’ this wave will reach a
limiting height when the amount of ‘O’ diffusing to the surface of each drop
is just sufficient to cover the entire surface of the drop. At still higher
concentrations the excess ‘O’ remaining dissolved at the drop surface will
produce a normal wave at a less positive potential.
The limiting height of the adsorption wave is proportional to the number
of molecules adsorbed on the drop during its life. Average adsorption current
‘ia’ is expressed as
ia = 13.66 nm2nr'l3/a .....(7)
41
GENERAL PRINCIPLES OF POLAROGRAPHY
Where ‘a’ is the area covered by each molecule. Adsorption waves are
observed with methylene blue, thiols, organic mercury compounds, uracils
and arsenic.
Polarographic Maxima
An increase of current above the limiting value in the form of a
maximum is often noticed on polarographic waves. The origin of the
maximum is sometimes connected with the mechanism of the electrode
process as in the case of catalytic discharge of ions, while in many cases,
it is caused by the increased transport of the depolarizer towards the
electrode by a streaming motion of the solution. The later is more frequent
and is called the streaming maximum. These are further divided into two
types namely (1) Maxima of the first kind and (2) Maxima of the second kind.
Maxima of first kind
In dilute solutions of supporting electrolytes this kind of maxima is
usually observed on the rising portion of the polarographic wave. It increases
rapidly with voltage to larger values than limiting current and falls
discontinuously to the normal limiting current. Thus first kind of maxima is
characterized by a sharp current peak. The maximum is called positive or
negative depending on whether the half-wave potential of the depolarizer lies
on the positive side of the electro capillary curve or on the negative side.
Antweiler explained that streaming of the solution past the electrode
surface causes this maxima. The direction of streaming is different for
positive and negative maxima. In the case of positive maxima, the solution
42
GENERAL PRINCIPLES OF POLAROGRAPHY
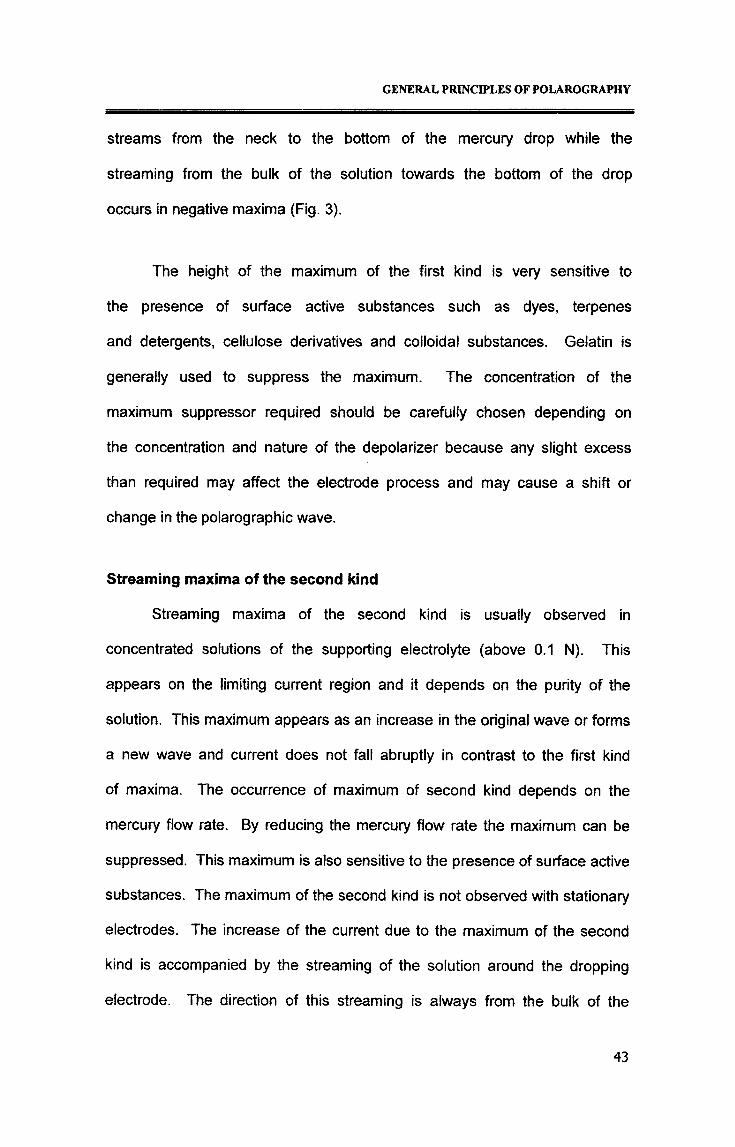
streams from the neck to the bottom of the mercury drop while the
streaming from the bulk of the solution towards the bottom of the drop
occurs in negative maxima (Fig. 3).
The height of the maximum of the first kind is very sensitive to
the presence of surface active substances such as dyes, terpenes
and detergents, cellulose derivatives and colloidal substances. Gelatin is
generally used to suppress the maximum. The concentration of the
maximum suppressor required should be carefully chosen depending on
the concentration and nature of the depolarizer because any slight excess
than required may affect the electrode process and may cause a shift or
change in the polarographic wave.
Streaming maxima of the second kind
Streaming maxima of the second kind is usually observed in
concentrated solutions of the supporting electrolyte (above 0.1 N). This
appears on the limiting current region and it depends on the purity of the
solution. This maximum appears as an increase in the original wave or forms
a new wave and current does not fall abruptly in contrast to the first kind
of maxima. The occurrence of maximum of second kind depends on the
mercury flow rate. By reducing the mercury flow rate the maximum can be
suppressed. This maximum is also sensitive to the presence of surface active
substances. The maximum of the second kind is not observed with stationary
electrodes. The increase of the current due to the maximum of the second
kind is accompanied by the streaming of the solution around the dropping
electrode. The direction of this streaming is always from the bulk of the
43
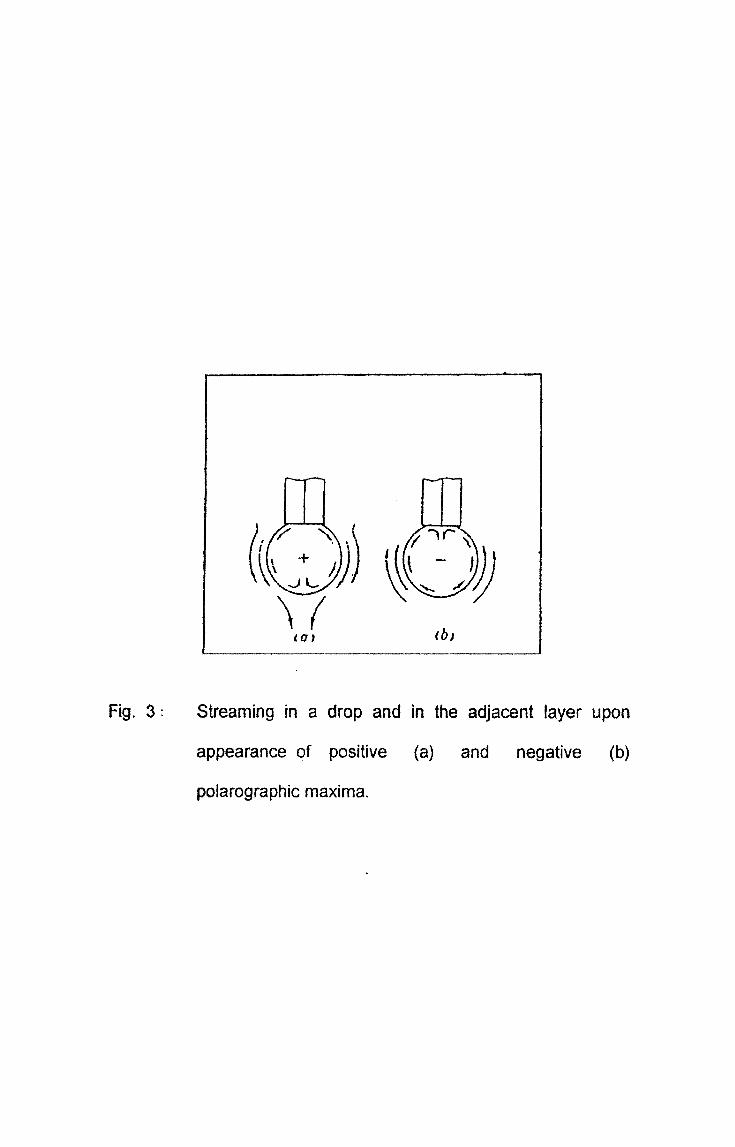
Fig. 3: Streaming in a drop and in the adjacent layer upon
appearance of positive (a) and negative (b)
polarographic maxima.
GENERAL PRINCIPLES OF POLAROGRAPHY
solution towards the bottom of the drop over the mercury surface to the
neck of the drop and from there horizontally along the tip of the capillary
into the solution (Fig. 4). The intensity of this motion attains its maximum
value at the potential of the electro capillary zero and slowly decreases with
the distance from this potential.
Maxima connected with the mechanism of the electrode process
There are cases in which the occurrence of the maximum cannot be
explained due to the streaming effect but may be due to some electrode
process. It may be of catalytic origin. A minimum or decrease in the current
is sometimes observed in the reduction of anions, and the shape of the wave
may be similar to those for the maxima. Sometimes a maximum occurs due
to the evolution of gas bubbles mostly of hydrogen.
A decrease in the current may also be observed when the reaction
product forms a film at the electrode surface. The dependence on the height
of the mercury reservoir is not uniform and usually gives little information
about the character of the maximum.
Reversible and irreversible processes
Electrode reactions at d.m.e can be broadly divided into reversible and
irreversible processes. Reversible reactions are so rapid that thermodynamic
equilibrium is very nearly attained at every instant during the life of a drop at
any potential. On the other hand irreversible reactions are so slow that they
precede only a fraction of the way towards equilibrium during the life of each
drop. For these reactions it is the rate of the electron transfer process and the
44
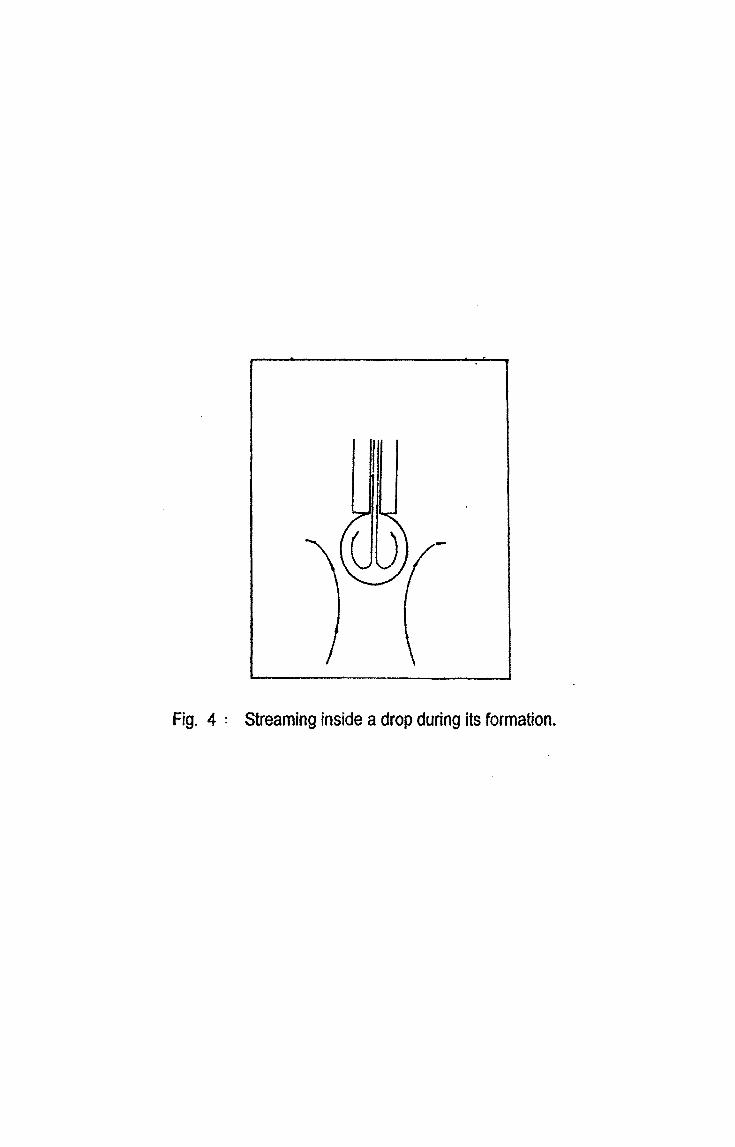
Fig. 4 : Streaming inside a drop during its formation.
GENERAL PRINCIPLES OF POLAROGRAPHY
manner in which this is influenced by the electrode potential that governs the
relationship between the current and potential. Between these two electrode
reactions there is an intermediate class of reactions that are fast enough to
approach the equilibrium during the drop life but not quite so fast that they
appear to reach it within the experimental error of the measurements. These
types of electrode reactions are known as quasi-reversible reactions.
The values of standard rate constant, Ks of these three types of reactions
are given as follows:
1. Reversible processes where Ks > 2 x 10"2 cm sec1
2. Irreversible process Ks < 10'5 cm sec"1
3. Quasi-reversible process Ks = 2 x 10"2 to10"5 cm sec"1
The theory of reversible processes was well-established in the early
stages of the development of the field.
Reversible electrode reactions at d.m.e.
Consider a reduction reaction occurring at the dropping mercury
electrode which may be represented as
Oxidant + n electrons ^.....- ^ Reductant
Ox + ne ^ t:.;,;.... ....^ Red .....(8)
When the oxidized species is brought to the electrode surface it can be
reduced at a proper potential. The transfer of the species is due to the three
modes of transfer viz., migration, convection and diffusion. Diffusion becomes
the sole mode of transfer, convection and migration being avoided.
The current depends upon the kinetics of the electrochemical reaction and
45
GENERAL PRINCIPLES OF POLAROGRAPHY
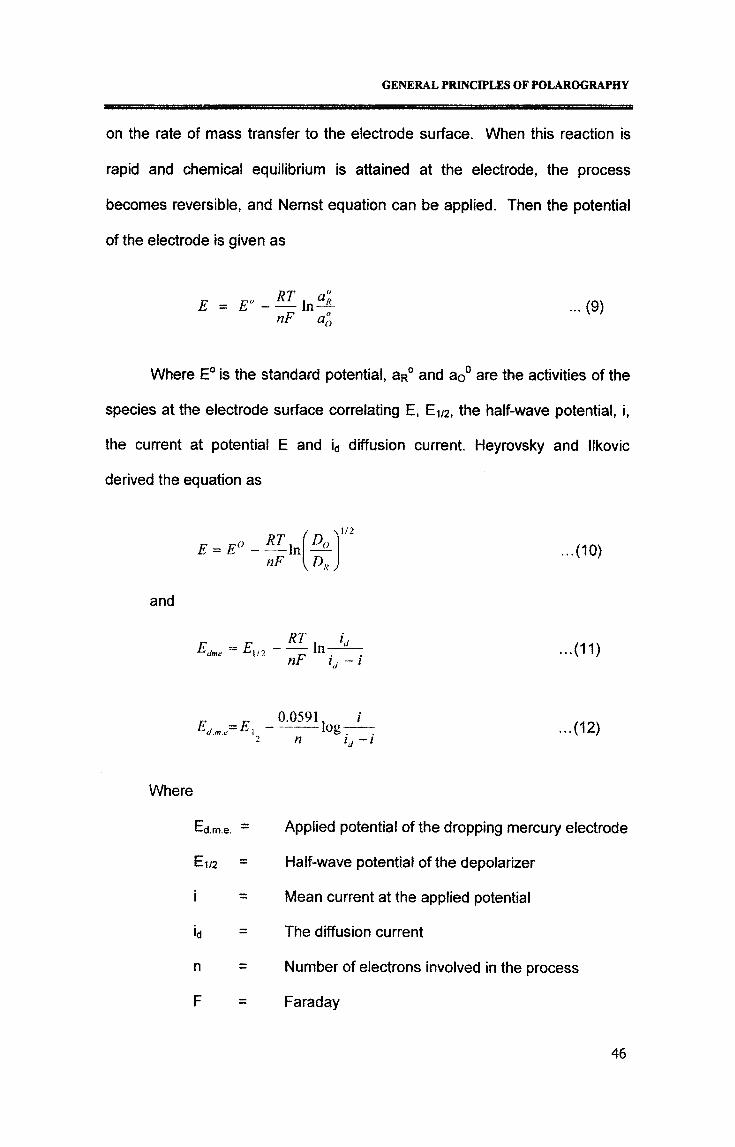
on the rate of mass transfer to the electrode surface. When this reaction is
rapid and chemical equilibrium is attained at the electrode, the process
becomes reversible, and Nernst equation can be applied. Then the potential
of the electrode is given as
E = E° - — In— ... (9)j—i o v /nF a0
Where E° is the standard potential, aR° and ao° are the activities of the
species at the electrode surface correlating E, E1/2, the half-wave potential, i,
the current at potential E and id diffusion current. Heyrovsky and llkovic
derived the equation as
E = E° RTnF
In(D ' uo\DkJ
1/2
and
E<lme ~ E\I2nF ij - i
...(10)
...(11)
0.0591
n...(12)
Where
Ed. m,e.
El/2
I
Id
n
F
Applied potential of the dropping mercury electrode
Half-wave potential of the depolarizer
Mean current at the applied potential
The diffusion current
Number of electrons involved in the process
Faraday
46
GENERAL PRINCIPLES OF POLAROGRAPHY
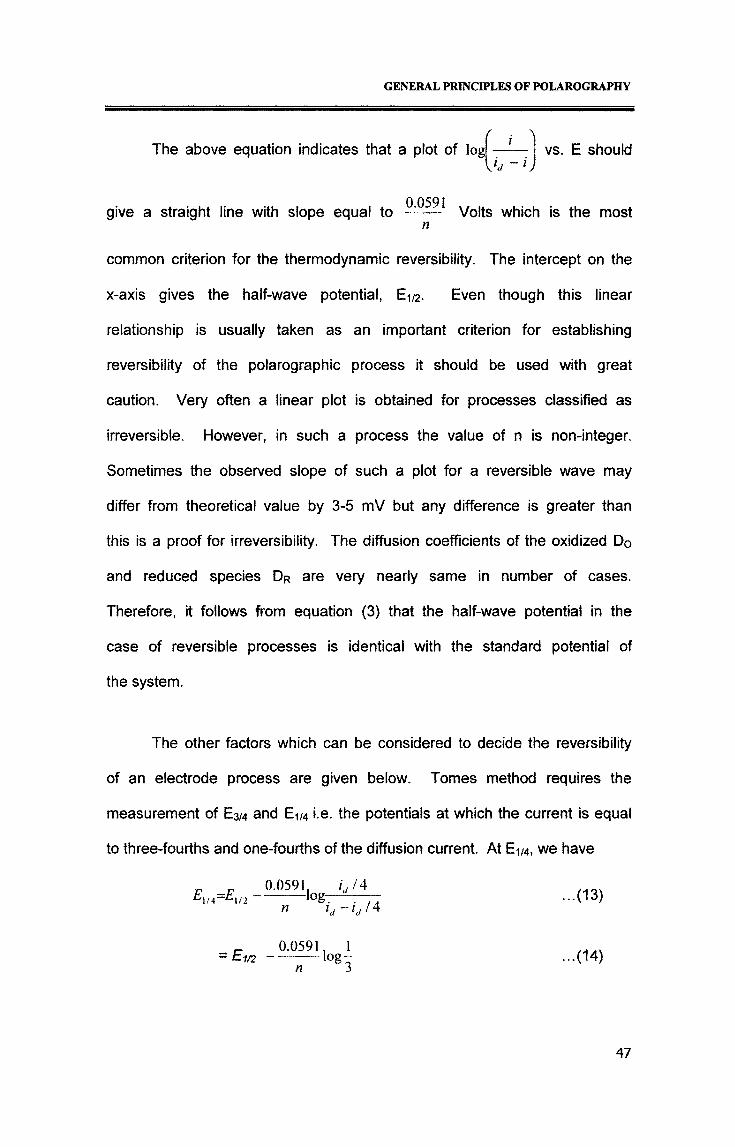
The above equation indicates that a plot of log/ . \ i vs. E should
give a straight line with slope equal to * Volts which is the most
n
common criterion for the thermodynamic reversibility. The intercept on the
x-axis gives the half-wave potential, E1/2. Even though this linear
relationship is usually taken as an important criterion for establishing
reversibility of the polarographic process it should be used with great
caution. Very often a linear plot is obtained for processes classified as
irreversible. However, in such a process the value of n is non-integer.
Sometimes the observed slope of such a plot for a reversible wave may
differ from theoretical value by 3-5 mV but any difference is greater than
this is a proof for irreversibility. The diffusion coefficients of the oxidized Do
and reduced species Dr are very nearly same in number of cases.
Therefore, it follows from equation (3) that the half-wave potential in the
case of reversible processes is identical with the standard potential of
the system.
The other factors which can be considered to decide the reversibility
of an electrode process are given below. Tomes method requires the
measurement of E3/4 and E1/4 i.e. the potentials at which the current is equal
to three-fourths and one-fourths of the diffusion current. At E1/4, we have
Eim—E\/20.0591, L/4—---- logr
ij 4...(13)
= E1/2 - 0.0591, 1--------- log-n 3
...(14)
47
GENERAL PRINCIPLES OF POLAROGRAPHY
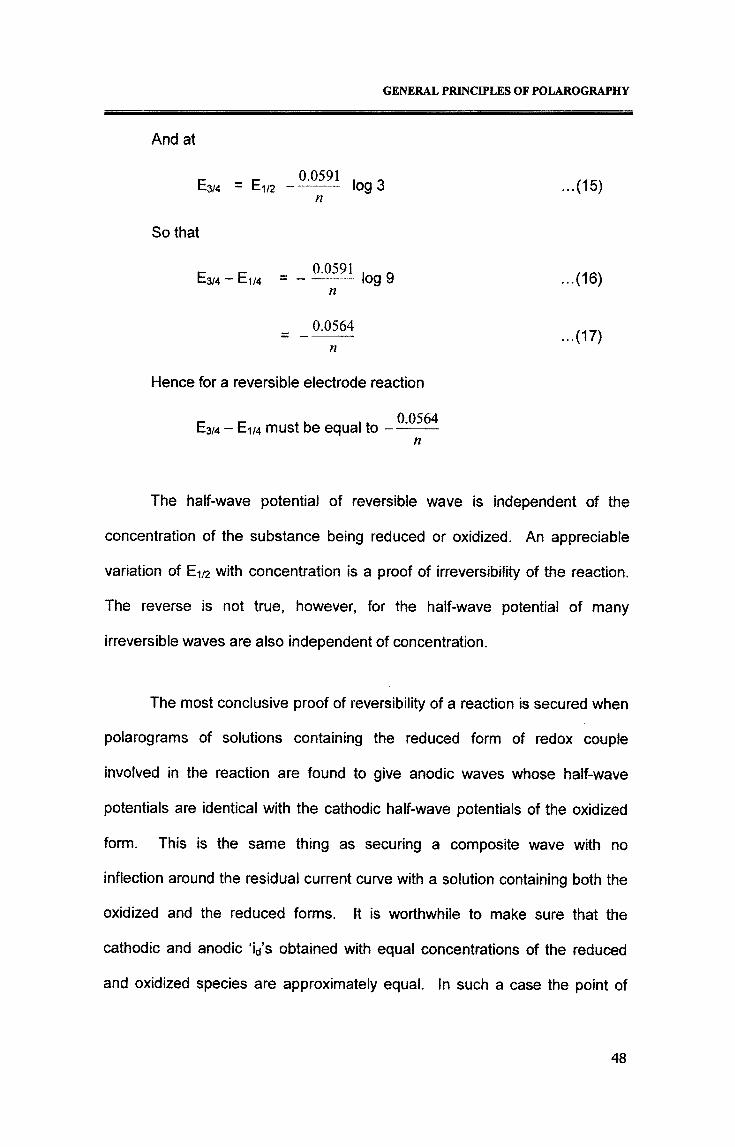
And at
_ _ _ 0.0591 . .E3/4 - E1/2 - ------- log 3n
So that
E3/4-E1/4 =-M591|0g9
0.0564
Hence for a reversible electrode reaction
E3/4 - E1/4 must be equal to 0.0564
...(15)
...(16)
...(17)
The half-wave potential of reversible wave is independent of the
concentration of the substance being reduced or oxidized. An appreciable
variation of E1/2 with concentration is a proof of irreversibility of the reaction.
The reverse is not true, however, for the half-wave potential of many
irreversible waves are also independent of concentration.
The most conclusive proof of reversibility of a reaction is secured when
polarograms of solutions containing the reduced form of redox couple
involved in the reaction are found to give anodic waves whose half-wave
potentials are identical with the cathodic half-wave potentials of the oxidized
form. This is the same thing as securing a composite wave with no
inflection around the residual current curve with a solution containing both the
oxidized and the reduced forms. It is worthwhile to make sure that the
cathodic and anodic Vs obtained with equal concentrations of the reduced
and oxidized species are approximately equal. In such a case the point of
48
GENERAL PRINCIPLES OF POLAROGRAPHY
inflection is the redox potential of the system. In addition to these common
criteria of reversibility there are several others that are less often used, partly
because special information must be obtained to permit their application
and the important one among these is temperature coefficient values.
The temperature coefficients of a reversible wave depend on the nature of
dEthe electrode reaction. For a reduction to a metal soluble in mercury ——dt
dEis about -0.7 mV/degree and for a homogeneous reduction —— may bedt
either positive or negative but is rarely greater than ±1 mV/ degree.
The temperature coefficient of Ei/2 for an irreversible wave is almost
always positive and is usually of the order of several mV/degree. Larger
temperature coefficients of E1/2 constitute fair evidence against the
reversibility of the wave.
Applications of Poiarography
Polarographic analyses can be used directly for the determination of
any substance solid, liquid, or gaseous, organic or inorganic, ionic or
molecular that can be reduced or oxidized at dropping mercury electrode.
One of the most important advantages of poiarography is the determination of
two or more substances by obtaining a single current-potential curve. Another
important technique is the Amperometric titration which involves polarographic
measurements. In addition to analytical uses, poiarography is one of the most
fruitful techniques of research in physical, inorganic and organic chemistry.
This technique is spreading more widely in subsidiary fields like biochemistry,
pharmaceutical chemistry, environmental chemistry and others. It is being
49
GENERAL PRINCIPLES OF POLAROGRAPHY
used to study diverse topics as hydrolysis, solubility, complex formation, and
adsorption, the stoichiometry and kinetics of chemical reactions, the
mechanisms of electrode reaction and of chemical reactions accompanying
them, standard and formal potentials, molecular dimensions, the effects of
structure on reactivity and many others of interest and importance.
In electrochemistry polarography allows measurement of potentials and
yields information about the rate of the electrode process, adsorption
desorption phenomena, and fast chemical reactions accompanying the
electron transfer. Since polarographic experiments are simple and not too
time consuming, polarography can be used in a preliminary test designed to
find the most suitable model compound for detailed electrochemical
investigations.
In fundamental applications, polarography allows one to distinguish
the form and charge of the species (for example, inorganic complex or
organic ion) in the solution. Polarography also permits the study of
equilibria (complex formation, acid-base, tautomeric) rates and mechanisms.
For equilibria established in the bulk of the solution in more than 15
seconds, measurement of wave heights of individual components makes
possible the evaluation of equilibrium constants. For equilibria that are very
rapidly established at the electrode surface, equilibrium constants can be
determined from shifts of half-wave potentials. Finally for some equilibria
between these two extremes, which are established in times comparable
to the drop time (3 seconds), calculation of rate constants is possible.
50
In this way, rate constants of very fast reactions of the order
105 -1010 litre mole"1 sec-1 can be determined.
For slower reactions, rate constants can be found from changes
of wave heights with time. Moreover, as some reaction intermediates
giving separate waves can be detected, identified and followed
polarographically (if their half-lives are longer than 15 sec), Polarography
can prove useful in mechanistic studies. Elimination of Mannich bases,
hydration of multiple bonds in unsaturated ketones and aldolization are
example studies.
Polarography can be used for investigation of the relationship between
electrochemical data and structure. Reduction of most organic systems,
particularly in aqueous media, involves steps with high activation energy
and is therefore irreversible. Half-wave potentials of such systems are a
function of the rate constant of the electrode process. This heterogeneous
rate constant is frequently influenced by structural effects, as are, in a
similar manner, rate constants of homogeneous reactions. Therefore, effects
of substituents on half-wave potentials in aromatic systems and in aliphatic
systems can be treated by the Hammett relations and the Taft substitutent
constants respectively. Among steric effects, for example, steric hindrance
of coplanarity or effects of cis-trans isomerism affect polarographic curves.
Polarography also makes it possible to distinguish between some epimers,
for example bearing axial or equatorial halogen.
GENERAL PRINCIPLES OF POLAROGRAPHY
51
GENERAL PRINCIPLES OF POLAROGRAPHY
In Inorganic analysis, Polarography is used predominantly for trace
metal analysis (with increased sensitivity of differential Pulse Polarography
and stripping analysis). The most important fields of application of inorganic
determinations are in metallurgy, environmental analysis (air, water, and
sea water contaminants), food analysis, toxicology and clinical analysis.
The possibility of being able to determine vitamins, alkaloids, hormones,
terpenoid substances, and natural colorings substances has made
polarography useful in analysis of biological systems. Analysis of drugs and
pharmaceutical preparations, determination of pesticide or herbicide residues
in the foods and so forth. Polarography can also make possible determination
of monomers, catalysts and even some reactive groupings in polymers.
52
GENERAL PRINCIPLES OF POLAROGRAPHY
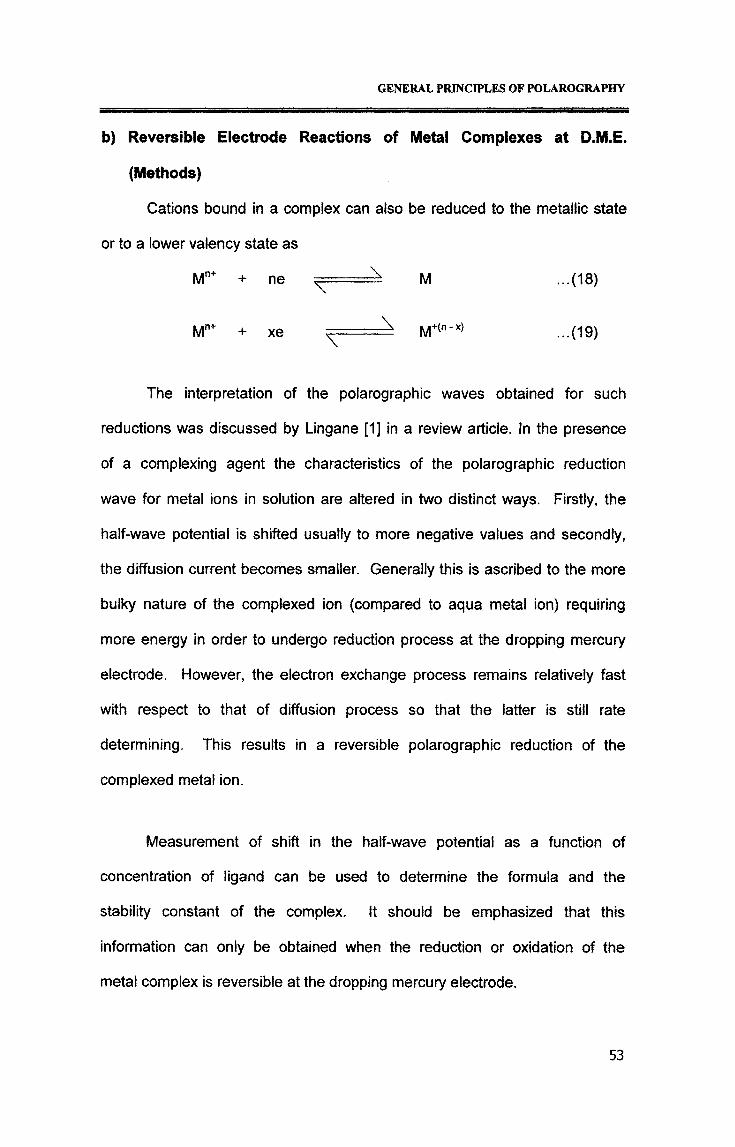
b) Reversible Electrode Reactions of Metal Complexes at D.M.E.
(Methods)
Cations bound in a complex can also be reduced to the metallic state
or to a lower valency state as
Mn+ + ne •<=: M ...(18)
Mn+ + xe M+{n'x) ...(19)
The interpretation of the polarographic waves obtained for such
reductions was discussed by Lingane [1] in a review article. In the presence
of a complexing agent the characteristics of the polarographic reduction
wave for metal ions in solution are altered in two distinct ways. Firstly, the
half-wave potential is shifted usually to more negative values and secondly,
the diffusion current becomes smaller. Generally this is ascribed to the more
bulky nature of the complexed ion (compared to aqua metal ion) requiring
more energy in order to undergo reduction process at the dropping mercury
electrode. However, the electron exchange process remains relatively fast
with respect to that of diffusion process so that the latter is still rate
determining. This results in a reversible polarographic reduction of the
complexed metal ion.
Measurement of shift in the half-wave potential as a function of
concentration of ligand can be used to determine the formula and the
stability constant of the complex, it should be emphasized that this
information can only be obtained when the reduction or oxidation of the
metal complex is reversible at the dropping mercury electrode.
53
GENERAL PRINCIPLES OF POLAROGRAPHY
Under these reactions two methods are discussed for the
determination of stability constants and coordination number of metal
complexes. The first one is that of Lingane, which is applicable to metal-
ligand system in which a single complex species is formed to the virtual
exclusion of all others over the entire ligand concentration working range.
The second one is the DeFord and Hume [8] method for the study of
consecutively formed complex ions, whose stabilities differ to such an extent
from one another, that each tends to predominate between fairly and sharply
defined limits of ligand concentration. It is a method of mathematical analysis
of the shift of half-wave potentials with ligand concentration which makes
possible the identification of successive complex ions formed and the
evaluation of formation constants.
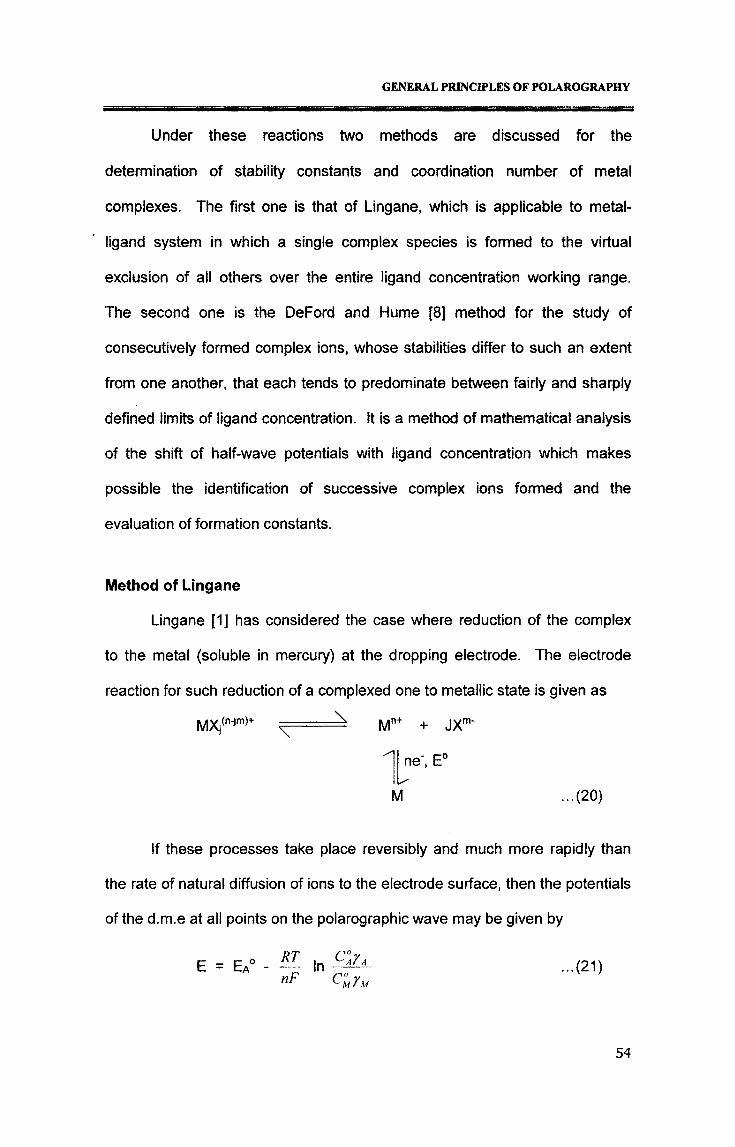
Method of Lingane
Lingane [1] has considered the case where reduction of the complex
to the metal (soluble in mercury) at the dropping electrode. The electrode
reaction for such reduction of a complexed one to metallic state is given as
If these processes take place reversibly and much more rapidly than
the rate of natural diffusion of ions to the electrode surface, then the potentials
of the d.m.e at all points on the polarographic wave may be given by
Mn+ + JXm‘
ne, E°
M ...(20)
...(21)
54
GENERAL PRINCIPLES OF POLAROGRAPHY
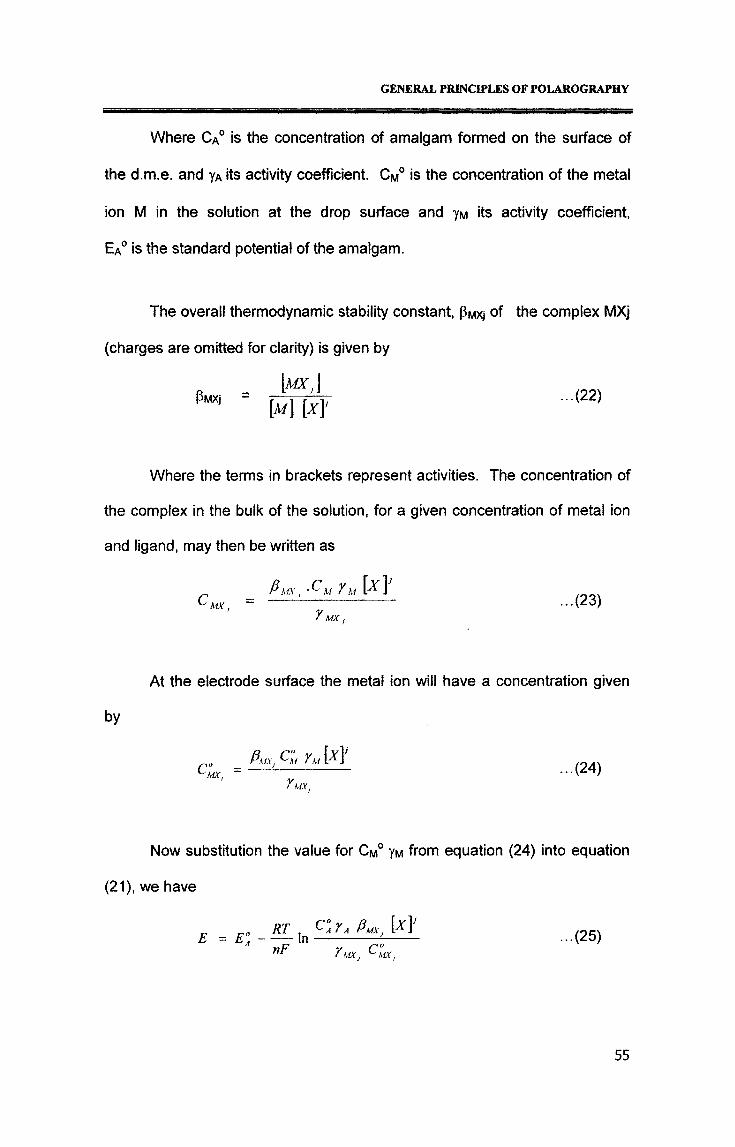
Where Ca° is the concentration of amalgam formed on the surface of
the d.m.e. and yA its activity coefficient. Cm0 is the concentration of the metal
ion M in the solution at the drop surface and jm its activity coefficient,
Ea° is the standard potential of the amalgam.
The overall thermodynamic stability constant, PMXj of the complex MXj
(charges are omitted for clarity) is given by
[mxAPwxj = f | f..1. ...(22)
M M'
Where the terms in brackets represent activities. The concentration of
the complex in the bulk of the solution, for a given concentration of metal ion
and ligand, may then be written as
C Pmx , -Cm Y m IX]MX ,
Y MX ,■
...(23)
At the electrode surface the metal ion will have a concentration given
by
^MX,
PmxCIyA*]
Y MX,
...(24)
Now substitution the value for Cm0 ym from equation (24) into equation
(21), we have
E RT , C°AyAa
»F Ymt C°mi...(25)
55
GENERAL PRINCIPLES OF POLAROGRAPHY
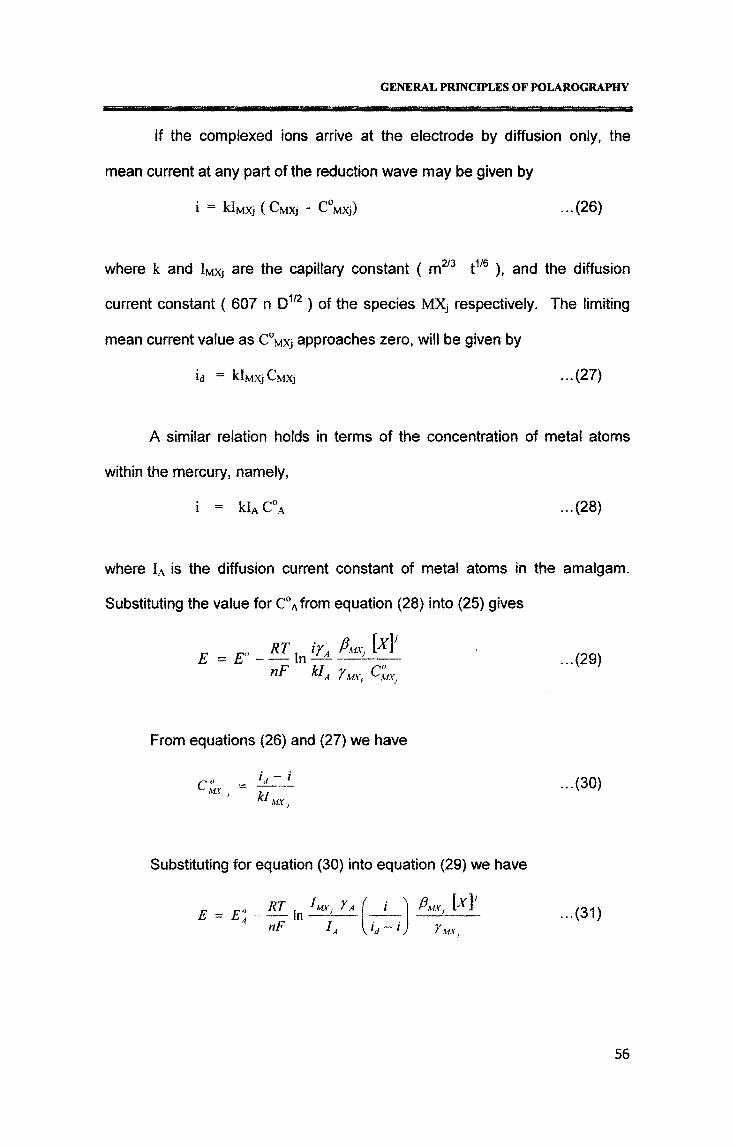
If the complexed ions arrive at the electrode by diffusion only, the
mean current at any part of the reduction wave may be given by
i = klMxj (CMXj - C°Mxj) ...(26)
where k and IMxj are the capillary constant ( m273 t1/6 ), and the diffusion
current constant ( 607 n D1/2) of the species MXj respectively. The limiting
mean current value as C°Mxj approaches zero, will be given by
id = klMxjCMXj ••■(27)
A similar relation holds in terms of the concentration of metal atoms
within the mercury, namely,
i = kIAC°A ...(28)
where IA is the diffusion current constant of metal atoms in the amalgam.
Substituting the value for C°Afrom equation (28) into (25) gives
E- ~*L\n’r‘ Pu*> ^
nF UA 7m, CMX,...(29)
From equations (26) and (27) we have
c°L MXl. - l
kl,.(30)
Substituting for equation (30) into equation (29) we have
E = e°aRT , lux, rA
nFin
Pux, W
7 MX:•(31)
56
GENERAL PRINCIPLES OF POLAROGRAPHY
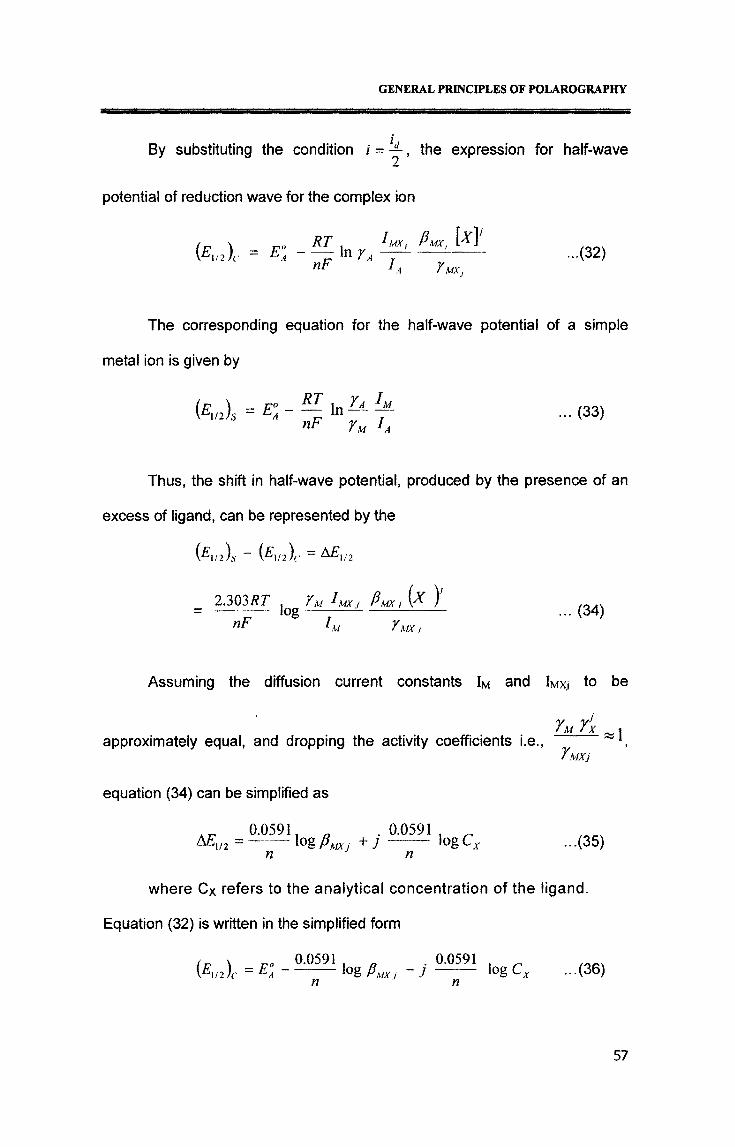
By substituting the condition / = ~, the expression for half-wave
potential of reduction wave for the complex ion
to, A = ^ - f 1nF IA Tm,
...(32)
The corresponding equation for the half-wave potential of a simple
metal ion is given by
(£js 'f
”F rm h... (33)
Thus, the shift in half-wave potential, produced by the presence of an
excess of ligand, can be represented by the
(•^1/2)s — (^i/2)( ~ ^F\n
i.mRT . rM imj Pmxj (x )nF
logM ymx ,
... (34)
Assuming the diffusion current constants IM and IMxj to be
approximately equal, and dropping the activity coefficients i.e.,
equation (34) can be simplified as
An 0.0591, _ .0.0591, ^M!/2 = —3- log + j —— log Cx
rMfxFMXj
n n...(35)
where Cx refers to the analytical concentration of the ligand.
Equation (32) is written in the simplified form
\ 0.0591 , „ . 0.0591 , „(^1/2)r = Ea--------- - tog Pmxj ~ J — iog Cx •••(36)n n
57
GENERAL PRINCIPLES OF POLAROGRAPHY
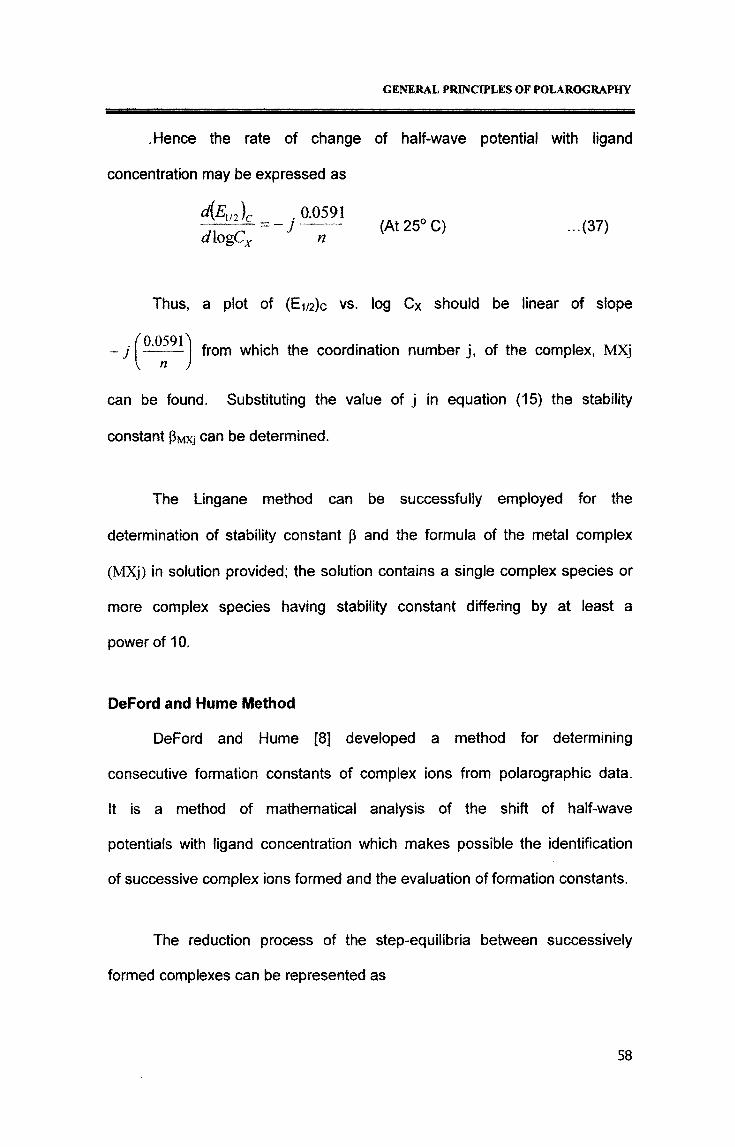
.Hence the rate of change of half-wave potential with ligand
concentration may be expressed as
d(Em)c . 0.0591d\ogCx ^ n (At 25° C) ...(37)
Thus, a plot of (Ei/2)c vs. log Cx should be linear of slope
-j( 0.059O from which the coordination number j, of the complex, MXjV n
can be found. Substituting the value of j in equation (15) the stability
constant pMxj can be determined.
The Lingane method can be successfully employed for the
determination of stability constant p and the formula of the metal complex
(MXj) in solution provided; the solution contains a single complex species or
more complex species having stability constant differing by at least a
power of 10.
DeFord and Hume Method
DeFord and Hume [8] developed a method for determining
consecutive formation constants of complex ions from polarographic data.
It is a method of mathematical analysis of the shift of half-wave
potentials with ligand concentration which makes possible the identification
of successive complex ions formed and the evaluation of formation constants.
The reduction process of the step-equilibria between successively
formed complexes can be represented as
58
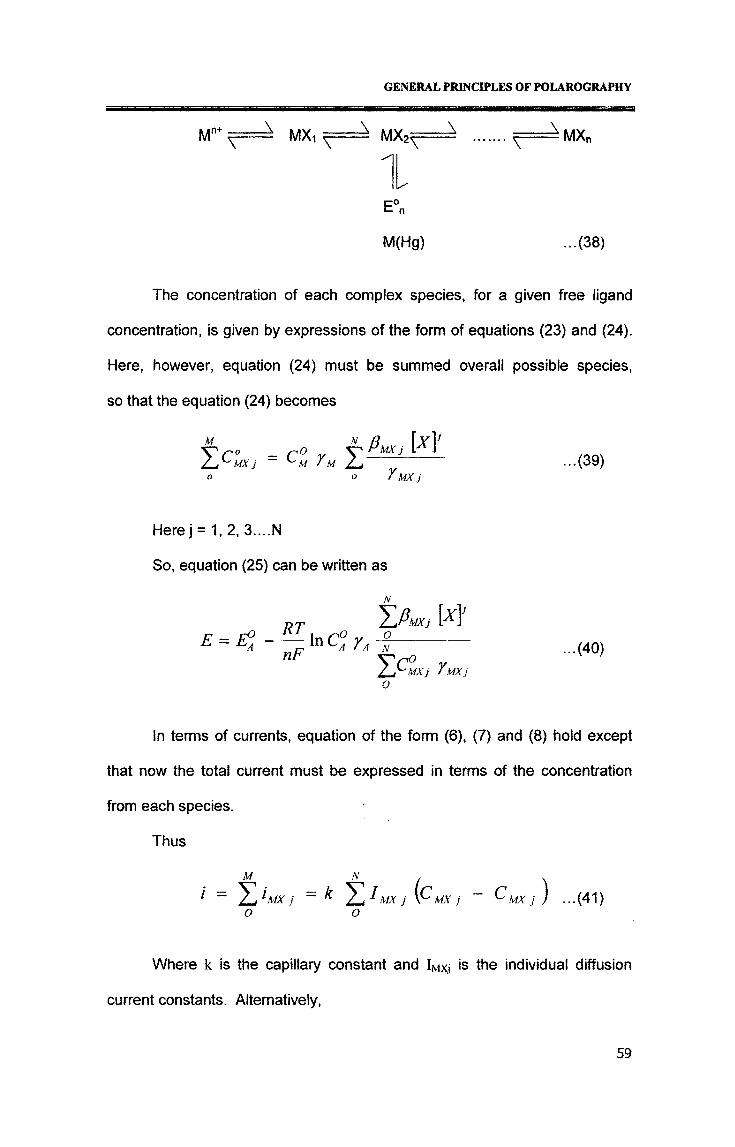
GENERAL PRINCIPLES OF POLAROGRAPHY
Mn+ MXi MX2^=^ ....... MXn
E°n
M(Hg) ...(38)
The concentration of each complex species, for a given free ligand
concentration, is given by expressions of the form of equations (23) and (24).
Here, however, equation (24) must be summed overall possible species,
so that the equation (24) becomes
MoMX j C°u ru z-
Pm, W'MX j
y mx j...(39)
Here j = 1, 2, 3....N
So, equation (25) can be written as
E = EPa RTnF
\nC°A yAY.Pmx, WoN
'y'X'MXi yMX j...(40)
In terms of currents, equation of the form (6), (7) and (8) hold except
that now the total current must be expressed in terms of the concentration
from each species.
Thus
MX j
N .k I IwuKCMX j
O...(41)
Where k is the capillary constant and IMxj is the individual diffusion
current constants. Alternatively,
59
GENERAL PRINCIPLES OF POLAROGRAPHY
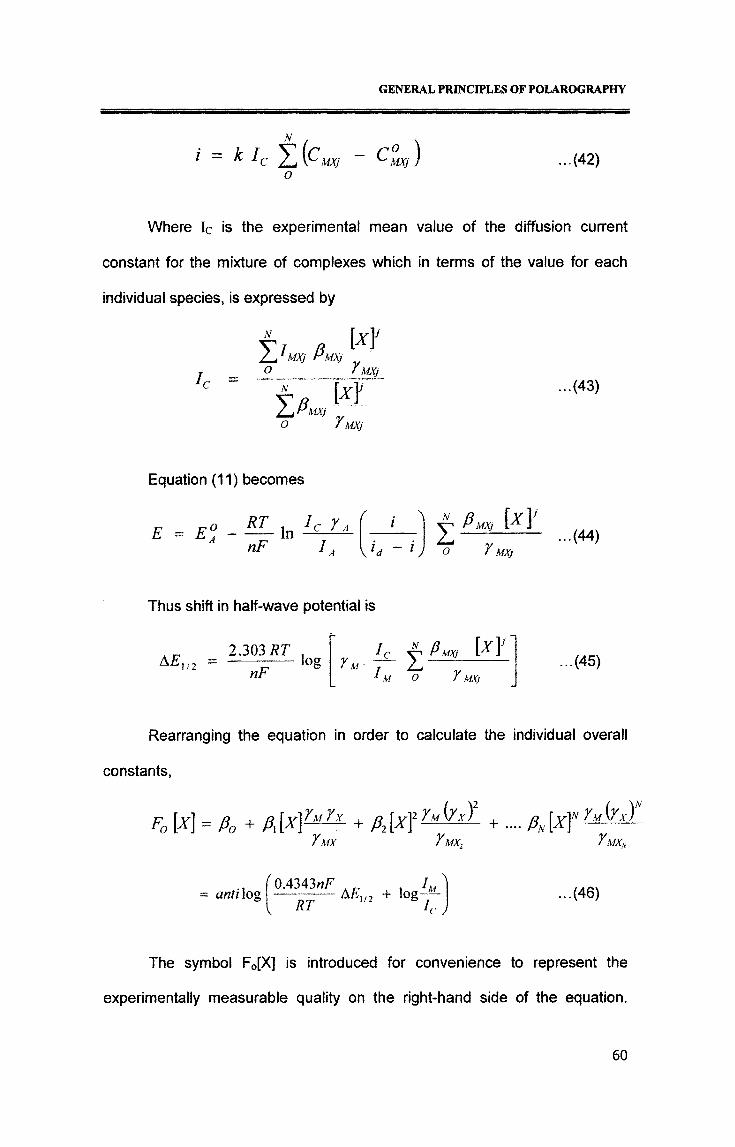
i = k let icm - cm)-{42)
o
Where Ic is the experimental mean value of the diffusion current
constant for the mixture of complexes which in terms of the value for each
individual species, is expressed by
«NI' MXi P MX)O y MX)
y r M'Z^PmX)O 7 MX)
...(43)
Equation (11) becomes
£ = £?- — In lcnF \ld ~ ij
N
sPm [XY
O 7 MXi...(44)
Thus shift in half-wave potential is
2.303 RTA E1/2 nF
log 7 M ■IC ^ ft MX) 1/^]
M O 7 MX)...(45)
Rearranging the equation in order to calculate the individual overall
constants,
F0 [x] = {30 + /3x\x)^Ix + ^[xf^xkA, + .... ps[x)sh<^.A
7 mx 7mx2 7 mxn
anti log 0A343nFRT
A E,1/2 + log-—h-J
...(46)
The symbol F0[X] is introduced for convenience to represent the
experimentally measurable quality on the right-hand side of the equation.
60
GENERAL PRINCIPLES OF POLAROGRAPHY
Maintaining constant ionic strength, the activity coefficients in equation (46)
may be dropped and the equation becomes
FolX] = 1+ PiPC] + p2[X]2 + ... pN[Xf ...(47)
After recording the shift in E1/2 the various F0[X] functions are
determined for each value of [X].
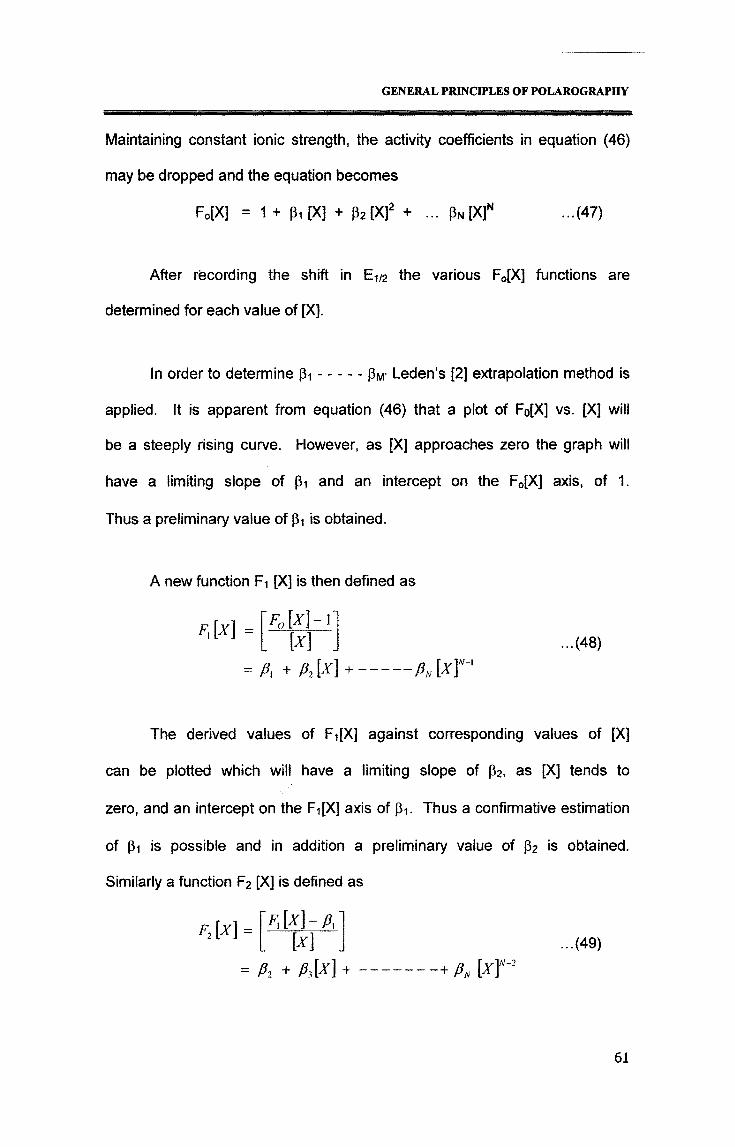
In order to determine Pi...........Pw Leden’s [2] extrapolation method is
applied. It is apparent from equation (46) that a plot of F0[X] vs. [X] will
be a steeply rising curve. However, as [X] approaches zero the graph will
have a limiting slope of pi and an intercept on the F0[X] axis, of 1.
Thus a preliminary value of Pi is obtained.
A new function Fi [X] is then defined as
AM M JA + AM +---------- PAxT'
■ (48)
The derived values of Fi[X] against corresponding values of [X]
can be plotted which will have a limiting slope of p2, as [X] tends to
zero, and an intercept on the Fi[X] axis of Pi. Thus a confirmative estimation
of Pi is possible and in addition a preliminary value of p2 is obtained.
Similarly a function F2 (X] is defined as
F2[X]
Pi
Fx M-a M
+ aM +...(49)
•+ Ph M\N-2
61
GENERAL PRINCIPLES OF POLAROGRAPHY
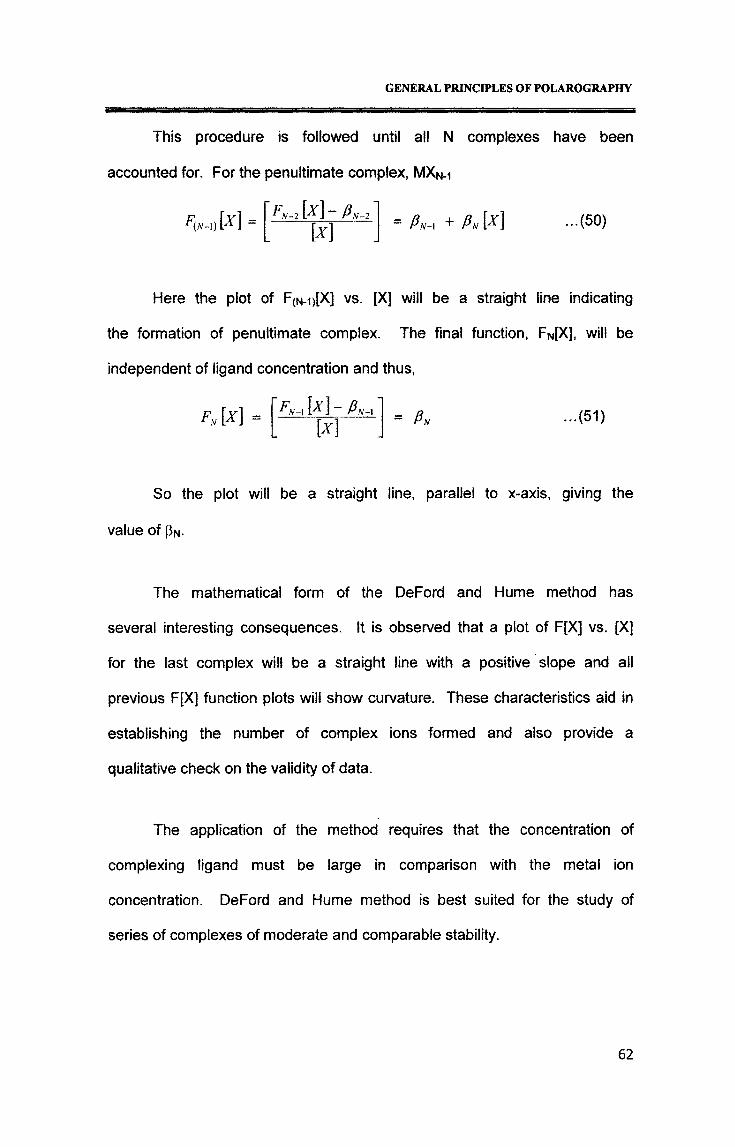
This procedure is followed until all N complexes have been
accounted for. For the penultimate complex, MXn.i
(AM) M- N-2
[X] AJV-1 + ...(50)
Here the plot of F(N-i)[X] vs. [X] will be a straight line indicating
the formation of penultimate complex. The final function, Fn[X], will be
independent of ligand concentration and thus,
f, M = A-iM-Ah
M = A„ ...(51)
So the plot will be a straight line, parallel to x-axis, giving the
value of pN.
The mathematical form of the DeFord and Hume method has
several interesting consequences. It is observed that a plot of F[X] vs. [X]
for the last complex will be a straight line with a positive slope and all
previous F[X] function plots will show curvature. These characteristics aid in
establishing the number of complex ions formed and also provide a
qualitative check on the validity of data.
The application of the method requires that the concentration of
complexing ligand must be large in comparison with the metal ion
concentration. DeFord and Hume method is best suited for the study of
series of complexes of moderate and comparable stability.
62
GENERAL PRINCIPLES OF POLAROGRAPHY
c) Irreversible Electrode Reactions of Metal Complexes at D.M.E.
(Methods)
A polarographic process is termed irreversible when the electron
exchange process is quite slow. Nevertheless the rate limiting step may still
be a diffusion process. Such a process is referred to as irreversible diffusion
controlled process. Nernst equation cannot be applied in the interpretation of
current-potential curves which are irreversible. The half-wave potentials in
case of irreversible waves are far different from the standard potentials
depending upon ‘if, the over voltage which is equal to the potential at which
the reaction occurs minus the potential calculated from Nernst equation.
The shapes of the polarograms expected for a reversible and an
irreversible reduction are shown in Fig. 5. In an irreversible process the
current is controlled mainly by the electrode reaction rate over a large part of
the curve. However, at more negative potentials the electrode reaction
becomes quite rapid and consequently the diffusion process becomes rate
determining. Thus the Ilkovic equation is equally applicable to the limiting
currents of both reversible and irreversible processes. In the case of
irreversible process the half-wave potentials corresponding to the two
processes i.e., oxidation and reduction are quite distinct and lie on different
sides of the standard potential ‘E0’ of the depolarizer. The greater the degree
of irreversibility the greater is the separation. On the other hand for reversible
processes the cathodic and anodic half-wave potentials coincide.
In its simplest form the mechanism responsible for a totally irreversible
wave may be described by the equation
63

Fig. 5: A reversible (i) and a totally irreversible wave (n)
GENERAL PRINCIPLES OF POLAROGRAPHY
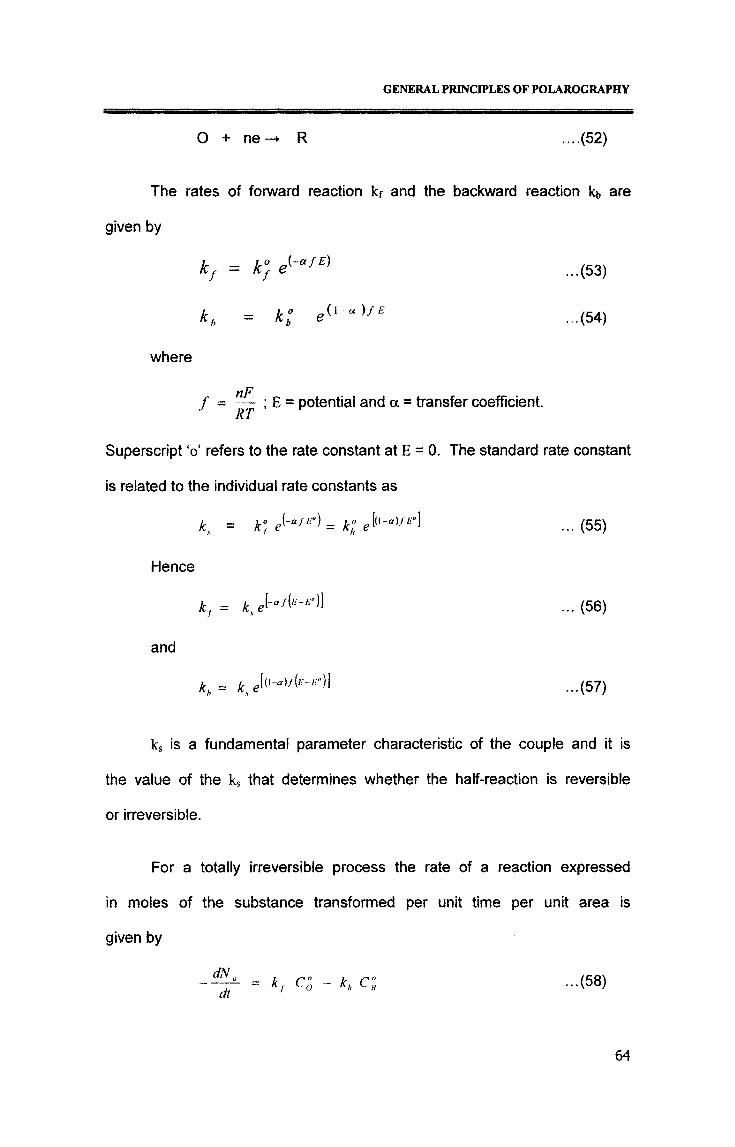
O + ne —► R ....(52)
The rates of forward reaction kf and the backward reaction kb are
given by
k, = k} e{-afE) ...(53)
k„ = k; eu-)fc ...(54)
where
yiFf _ —- ; e = potential and a = transfer coefficient.
RT
Superscript ‘o’ refers to the rate constant at E = 0. The standard rate constant
is related to the individual rate constants as
ks = k°f e[ran:"] = k; e^-a)fp\ ... (55)
Hence
kf= ,..(56)
and
kh= ^ ...(57)
ks is a fundamental parameter characteristic of the couple and it is
the value of the ks that determines whether the half-reaction is reversible
or irreversible.
For a totally irreversible process the rate of a reaction expressed
in moles of the substance transformed per unit time per unit area is
given by
= kf Cl - K c;; ...(58)
64
GENERAL PRINCIPLES OF POLAROGRAPHY
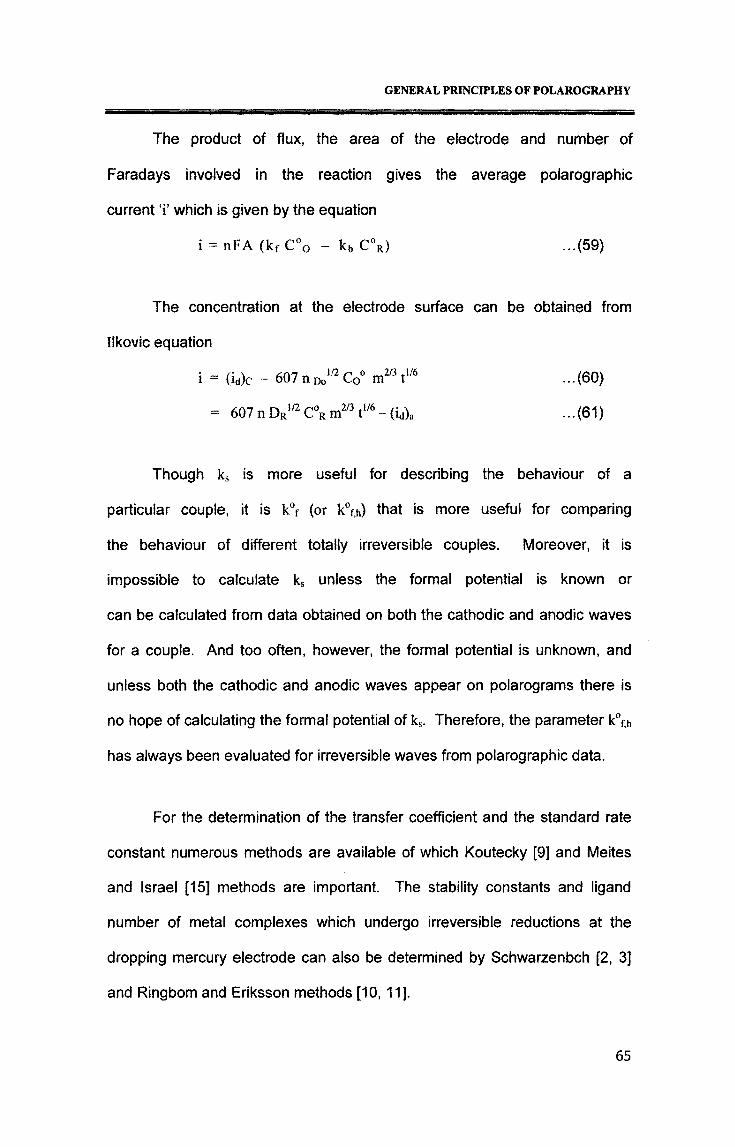
The product of flux, the area of the electrode and number of
Faradays involved in the reaction gives the average polarographic
current ‘i’ which is given by the equation
i = nFA (kf C°0 - kb C°R) ...(59)
The concentration at the electrode surface can be obtained from
Ilkovic equation
i = (id)c - 607nDo1/2Co° rn2/3tl/f’ ...(60)
= 607nDR1/2e°Rm2/3t,/6-(id)a ...(61)
Though ks is more useful for describing the behaviour of a
particular couple, it is k°f (or k°fjh) that is more useful for comparing
the behaviour of different totally irreversible couples. Moreover, it is
impossible to calculate ks unless the formal potential is known or
can be calculated from data obtained on both the cathodic and anodic waves
for a couple. And too often, however, the formal potential is unknown, and
unless both the cathodic and anodic waves appear on polarograms there is
no hope of calculating the formal potential of ks. Therefore, the parameter k0f,h
has always been evaluated for irreversible waves from polarographic data.
For the determination of the transfer coefficient and the standard rate
constant numerous methods are available of which Koutecky [9] and Meites
and Israel [15] methods are important. The stability constants and ligand
number of metal complexes which undergo irreversible reductions at the
dropping mercury electrode can also be determined by Schwarzenbch [2, 3]
and Ringbom and Eriksson methods [10,11].
65
GENERAL PRINCIPLES OF POLAROGRAPHY
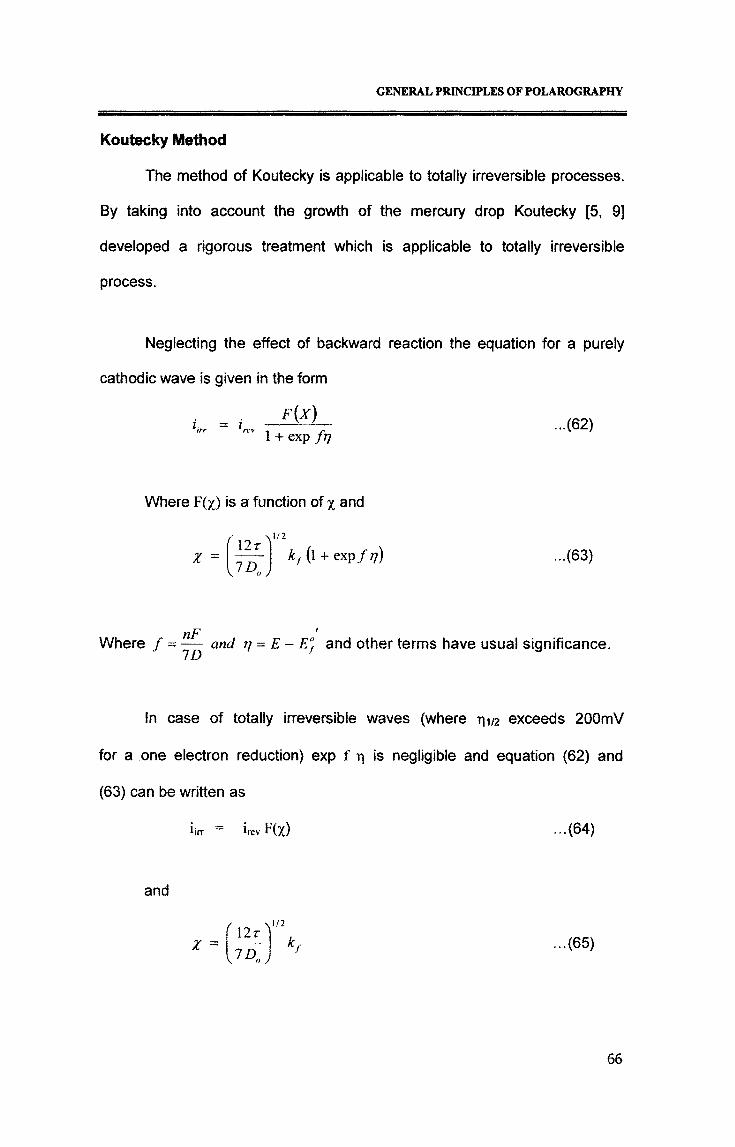
Koutecky Method
The method of Koutecky is applicable to totally irreversible processes.
By taking into account the growth of the mercury drop Koutecky [5, 9]
developed a rigorous treatment which is applicable to totally irreversible
process.
Neglecting the effect of backward reaction the equation for a purely
cathodic wave is given in the form
F{X)1 + exp ft]
...(62)
Where F(x) is a function of % and
12r/.y/2X \?D.J
kf (l + exp/7) ...(63)
Where / = — ID
and tj = E - E°f and other terms have usual significance.
In case of totally irreversible waves (where 1^/2 exceeds 200mV
for a one electron reduction) exp f q is negligible and equation (62) and
(63) can be written as
iirr = irevF(x) ...(64)
and
X =
/ \ 1/2 M2r^...(65)
66
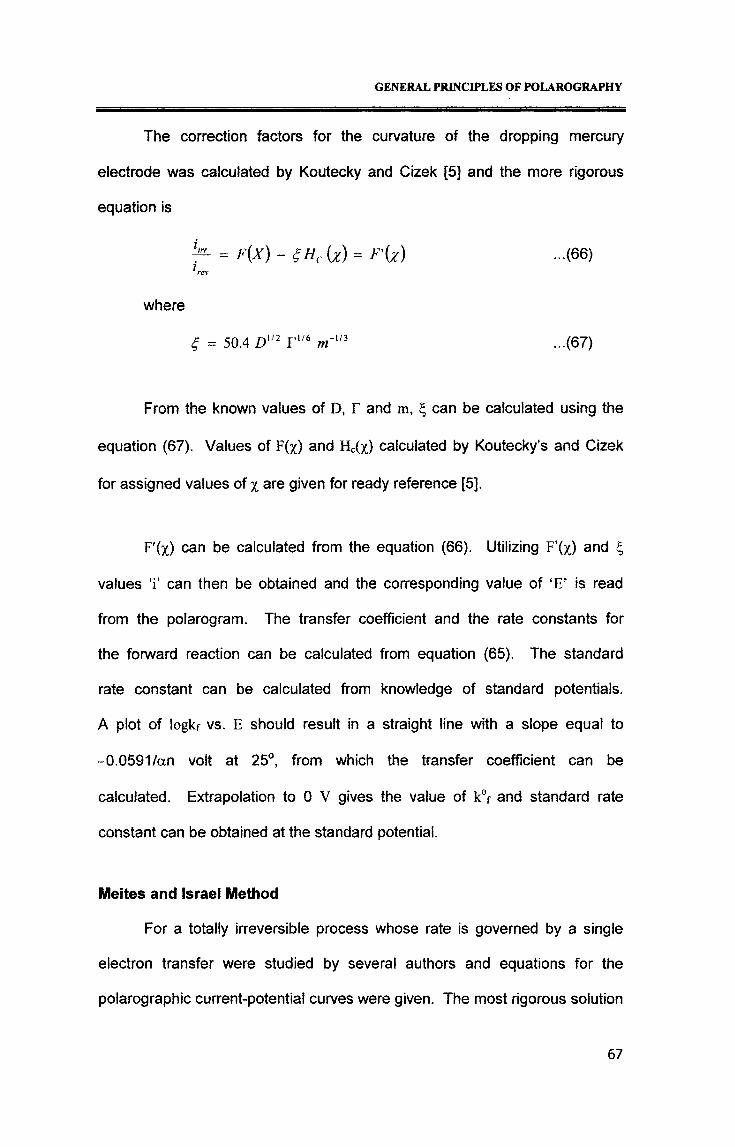
The correction factors for the curvature of the dropping mercury
electrode was calculated by Koutecky and Cizek [5] and the more rigorous
equation is
— = F{X)~ 4Hc{x)= Hz) -(66)*rev
where
= 50.4 Din T1/6 m~l,} ...(67)
From the known values of D, r and m, \ can be calculated using the
equation (67). Values of F(x) and Hc(/) calculated by Koutecky’s and Cizek
for assigned values of % are given for ready reference [5].
F'(x) can be calculated from the equation (66). Utilizing F’(x) and t,
values ‘i’ can then be obtained and the corresponding value of ‘E’ is read
from the polarogram. The transfer coefficient and the rate constants for
the forward reaction can be calculated from equation (65). The standard
rate constant can be calculated from knowledge of standard potentials.
A plot of logkf vs. E should result in a straight line with a slope equal to
-0.0591/an volt at 25°, from which the transfer coefficient can be
calculated. Extrapolation to 0 V gives the value of k°f and standard rate
constant can be obtained at the standard potential.
Meites and Israel Method
For a totally irreversible process whose rate is governed by a single
electron transfer were studied by several authors and equations for the
polarographic current-potential curves were given. The most rigorous solution
GENERAL PRINCIPLES OF POLAROGRAPHY
67
GENERAL PRINCIPLES OF POLAROGRAPHY
was given by Koutecky [5, 9]. Delahay and Strassner [6, 7] devised a
graphical method, which yielded essentially identical values for the
parameters an and k°fjh. From Koutecky’s treatment, Kern [12] has shown
that a plot of Ede vs. log i/id—i employing average currents in the log term
should be linear with a slope of -0.0591/an volt at 25°C. These results were
accepted by some of the workers concerned with the subject [13,14],
A simple and most vulnerable method was developed by Meites and
Israel [15] by taking into account the numerical deductions from Koutecky’s
method. They have suggested the use of maximum current at the end of a
drop life for the calculations of an and k\h from polarographic data.
This procedure is more convenient in general and is better adapted to the
particular case in which the drop time varies appreciably over the
rising portion of the wave than the relationship based on average current that
was deduced by Kern. The derivation of their equation is described below.
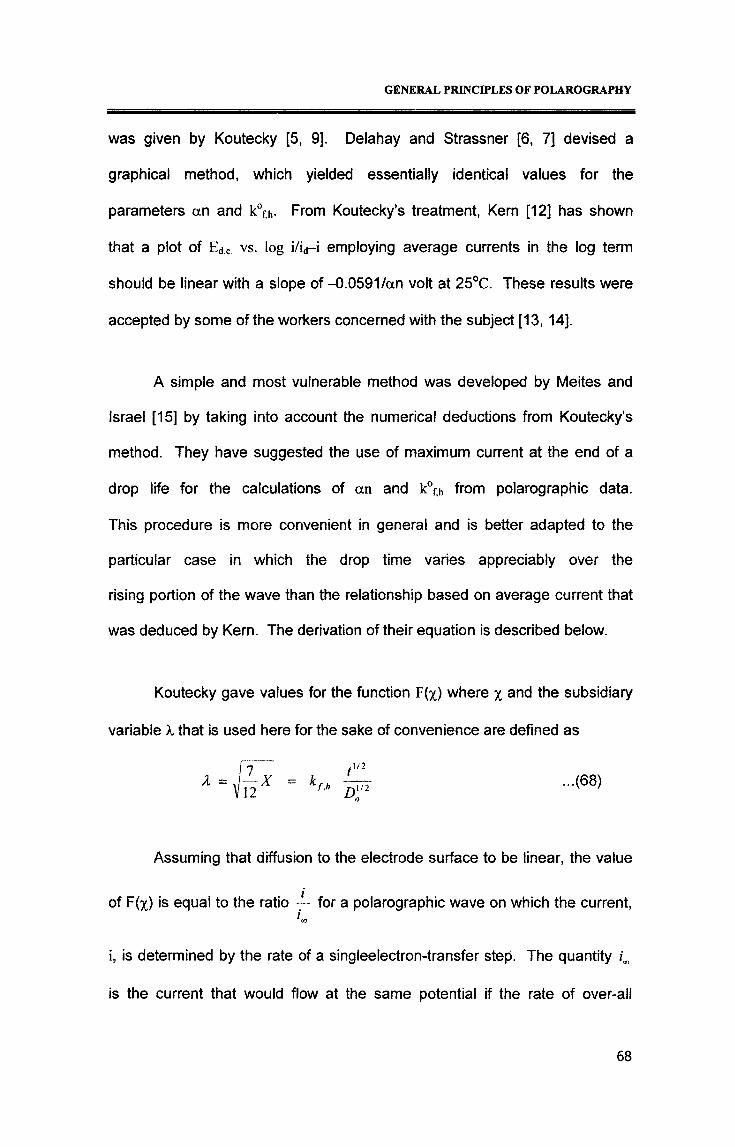
Koutecky gave values for the function F(x) where % and the subsidiary
variable X that is used here for the sake of convenience are defined as
Assuming that diffusion to the electrode surface to be linear, the value
of F(x) is equal to the ratio — for a polarographic wave on which the current,L
i, is determined by the rate of a singleelectron-transfer step. The quantity /„
is the current that would flow at the same potential if the rate of over-all
...(68)
68
GENERAL PRINCIPLES OF POLAROGRAPHY
process is strictly controlled by diffusion. Both i and in are defined as
maximum currents during a drop life. Equation (68) can be given for
totally irreversible process in which the rate of backward reaction is
negligibly small over the entire rising portion of the wave. Then iOT will
be equal to the diffusion current id, when the potential first becomes
sufficiently negative to cause ‘i’ to deviate significantly from zero.
On neglecting changes in the structure of the electrical double layer
k - k° J-anFEtRT)Kf,h ~ Kf,h e ...(69)
which, when combined with equation (68), yields
0.434 RT anF
logio .1/2Kf,k 1
D 1/2
0.434 RT nF
log A ...(70)
On the basis of the values given by Koutecky it may be shown that
log X is a linear function of log i/id - i over nearly entire raising portion of
the wave in which the straight line represents the equation
log A =-0.1300 + 0.9163 log i/id-i ...(71)
On combining equations (70) and (71) it follows from Koutecky
results that an irreversible wave of the above type must obey the
equation (at 25°C)
Ed,e0.05915
anlog
1.349 k°f h t 1/2
D.1/20.0542 , i—---- -- log-;-----—
an id - i...(72)
69
GENERAL PRINCIPLES OF POLAROGRAPHY
Hence if ‘t’ is constant and independent of potential, a plot of
Ede versus log i/(id - i) for such a wave should be linear and should
have a slope equal to -0.0542/an volt.
Then
Ed.e = E' 0.0542 , i log -—an
...(73)
r, . 0.05915 , (l.349 k°f'„ t1'2)E = -0.2412 + —....... log ——-----r——----- ...(74)
an D.
In these equations both Edeand E' are referred with respect to S.C.E.
Meites and Israel observed that except in unusual circumstances a plot of
Ede vs. log i/(id-i) will be linear over nearly the entire rising portion of the
wave. It was also found that the slope of such a plot depends to some extent
on drop time employed. Hence it was suggested by them that the use of the
equation (73) in the form
Edt = E" - ^42 [log f/(/rf _ o 546 log ,] ... (75)an
is preferable, where
0 05915 1 349E’ = -0.2412 + log k" ...(76)an DJ
A plot of Ede vs [log i/(id-i) - 0.546 log t] will have a slope of
-54.2/an mV, and an intercept where the quantity being plotted along the
abscissa is zero which is equal to parameter E' defined by the equation from
which k" h is calculated. The parameter an is best obtained from the slope.
For waves occurring between ‘0’ and -1.0 volts vs. S.C.E, the variation in drop
70

GENERAL PRINCIPLES OF POLAROGRAPHY
time ‘f may generally be ignored but outside this region it becomes much
larger and correction for‘t’ is necessary.
The Method of Ringbom and Eriksson
This method [10, 11] also depends upon the availability of suitable
indicator ion as in the case of Schwarzenbach method, which must
undergo reversible reduction at a more positive potential than an ion
whose complexes are to be studied. The method is applicable to systems
characterized by a set of metal-ligand step equilibria and is based on
half-wave potential measurements.
The main characteristic of a labile system of complexes is that a
single polarographic wave is produced whose half-wave potential is shifted
to more negative values as the concentration of added ligand increases.
If the metal ion that is reversibly reduced is N, then its half-wave potential
will be shifted by a characteristic amount on addition of a specified amount
of complexing agent.
If metal ions, M, are then added to the system, they will compete with N
for association with X thereby reducing the effective amount of ligand
available for complexation with the indicator species. As a result, the
half-wave potential for N will now correspond to a smaller value of the
ligand concentration so that the observed Ei/2 value will occur at a less
negative potential than in the absence of M. The concentration of the
metal ion, M, must be 103 times greater than that of N in order to make
the change in shift measurable for practical purpose.
71
GENERAL PRINCIPLES OF POLAROGRAPHY
The practical procedure of this method involves mainly two stages.
In the primary stage series of AEi/2 values are obtained for N over a wide
range of ligand concentration in fairly small increments. If the complexes
formed in the N, X system are relatively weak it may be assumed that
the total analytical concentration may be identified with the free ligand
concentration [XJ. A graph may then be drawn of AE1/2 as a function of [X],
The entire set of measurements are repeated in the presence of a fixed
concentration of metal ion M and the A£'1/2 values are computed.
In each case the A £'1/2 value will be less than the value for the indicator
system alone, and a plot of A£'1/2 versus [X] will be below that for the
first curve and at higher values of [X], it will become parallel indicating
attainment of the maximum coordination number of the system, M, X.
The above plot is utilized in determining the free ligand concentration
for the system M, X at any value of known total ligand concentration.
The ligand number n may be evaluated as follows:
The ligand number n' of the system, N, X is defined as
_ total concentration of X bound to N total concentration of N
•■•(77)
_ c, - [*]
When M is also present, the ligand number n of the system M, X
is given by
. Total concentration of X bound to Mn = ————■——----- ——=— -------- —------ —Total concentration of M
72
GENERAL PRINCIPLES OF POLAROGRAPHY
[Total ligand concentration]- [Free ligand concentration]- [Total ligand bound toN]
Total concentration of M
cx - [x] - «• c„'M
... (78)
At the half-wave potential of the wave for the system N, X the above
equation becomes
Where
cx - [x] - »’c"n = „ 2 (79)
Cx = Total ligand concentration
[X] = Free ligand concentration
n' = Ligand number of the indicator system, N, X
Cn = Concentration of indicator ion
Cm = Concentration of the metal ion under study.
The term n' CN/2 may be ignored since CN is usually very much less
than CM.
n c,y - Mc,M
... (80)
Using the above equation n can be calculated at each value of
free ligand concentration, n values plotted as a function of log[X]free
will give the formation curve showing the maximum coordination
number for the system M, X. The formation curve may be integrated
graphically using Fronaeous [4] relation to give F0[X] data as
73
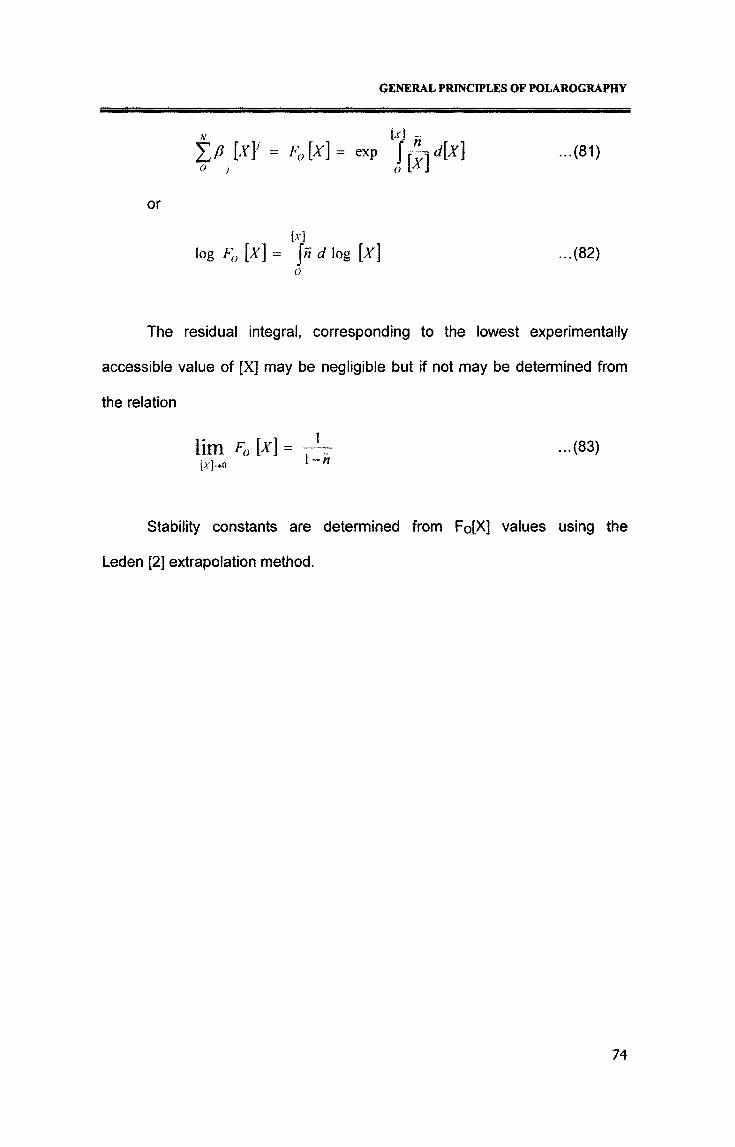
GENERAL PRINCIPLES OF POLAROGRAPHY
ifi M' = F0 M= exp '{rFl'Mo j O lAl
...(81)
or
log F0 [x] = \nd log [x]O
...(82)
The residual integral, corresponding to the lowest experimentally
accessible value of [X] may be negligible but if not may be determined from
the relation
lim F0 [x] -[.r J—»-o l — Tt
...(83)
Stability constants are determined from Fo[X] values using the
Leden [2] extrapolation method.
74
GENERAL PRINCIPLES OF POLAROGRAPHY
BOOKS REFERRED
[1] Lingane, J.J., Chem. Rev., 29,1 (1941).
[2] Leden, !., Z. Phys. Chem., 188,160 (1941).
[3] Calvin, M. and Bailes, R.H., J. Am. Chem. Soc., 68,949 (1946).
[4] Froneous, S., Acta. Chem. Scand., 4, 72 (1950).
[5] Kouteckey, J. and Cizek, J., Coll. Cezch. Chem. Commons., 21, 836 (1951).
[6] Delahay, P., J. Am. Chem. Soc., 73,4944 (1951).
[7] Delahay, P. and Strassner, J.E., J. Am. Chem. Soc., 73, 5219 (1951).
[8] Deford, D.D. and Hume, D.N., J. Am. Chem. Soc., 73, 5351 (1951).
[9] Koutecky, J., Coll. C Cezch. Chem. Commons., 18, 597 (1953).
[10] Ringbom, A. and Eriksson, L,, Acta. Chem. Scand., 7,1105 (1953).
[11] Eriksson, L., Acta. Chem. Scand., 7,1146 (1953).
[12] Kern, D.M.H., J. Am. Chem. Soc., 76,4234 (1954).
[13] Dekshat, P., Record of Chemical Progress., 1983 (1958).
[14] Reinmoth, W.H., Rogers, L.B., J. Am. Chem. Soc., 82, 802 (1960).
[15] Meites, L. and Isreal, Y., J. Am. Chem. Soc., 83,4903 (1961).
75