Embed Size (px)
Citation preview
FIFTH GRADE
1 WEEKLESSON PLANS AND
ACTIVITIES
Math/Science Nucleus © 1990, 2001 2
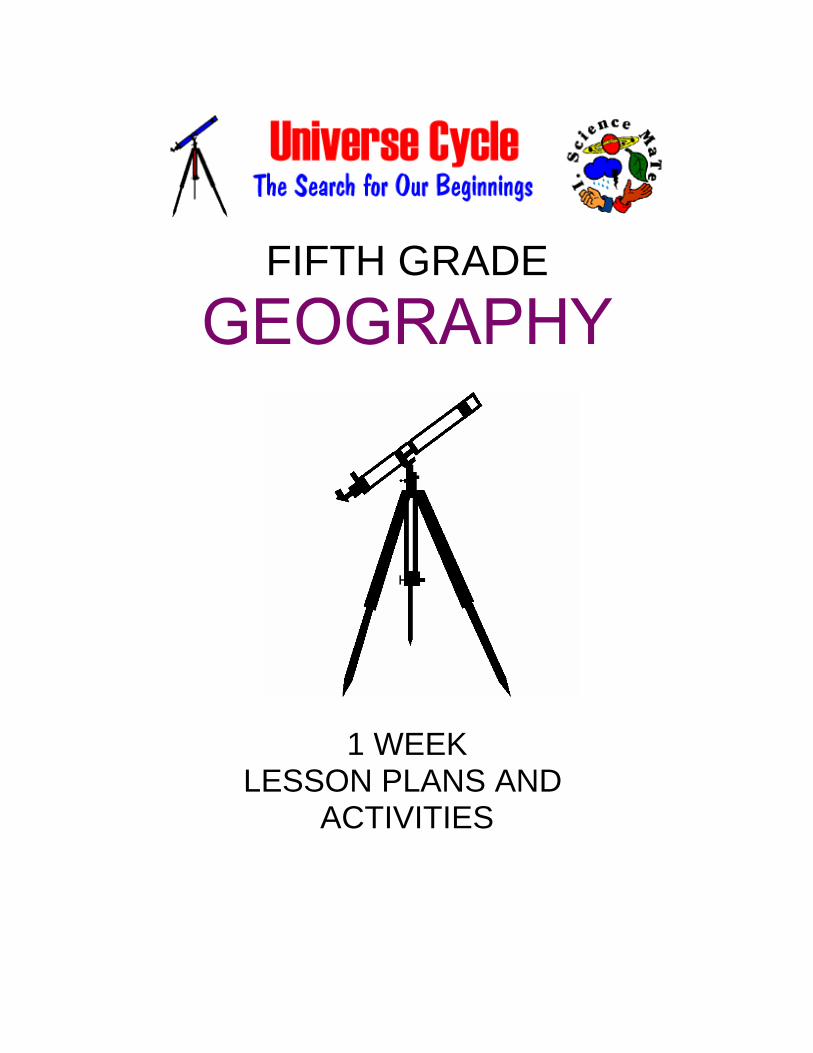
UNIVERSE CYCLEOVERVIEW OF FIFTH GRADE
UNIVERSE
WEEK 1.PRE: Comparing components of the Universe.LAB: Exploring how the Universe may have formed.POST: Comparing constellation charts with celestial globes.
SOLAR SYSTEM
WEEK 2.PRE: Comparing and contrasting the features of the planets.LAB: Comparing meteorites to Earth rocks.POST: Discovering the atmosphere on different planets.
EARTH
WEEK 3.PRE: Exploring how planets are formed.LAB: Comparing landforms of the Moon, Mars, and Earth.POST: Discovering influence of ice, rain, and wind.
GEOGRAPHY
WEEK 4.PRE: Exploring how topographic maps are made.LAB: Comparing and contrasting topographic maps.POST: Understanding topographic maps.
Math/Science Nucleus © 1990, 2001 3
Students construct a contourmap using an image maker.
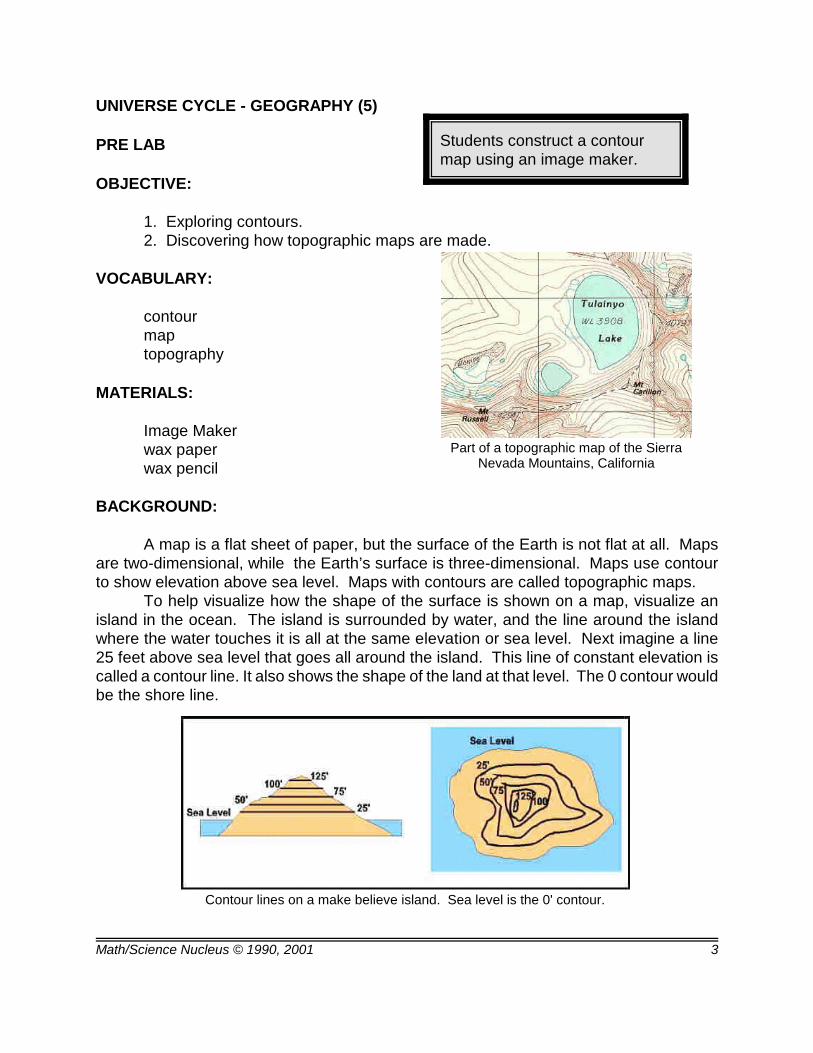
Part of a topographic map of the SierraNevada Mountains, California
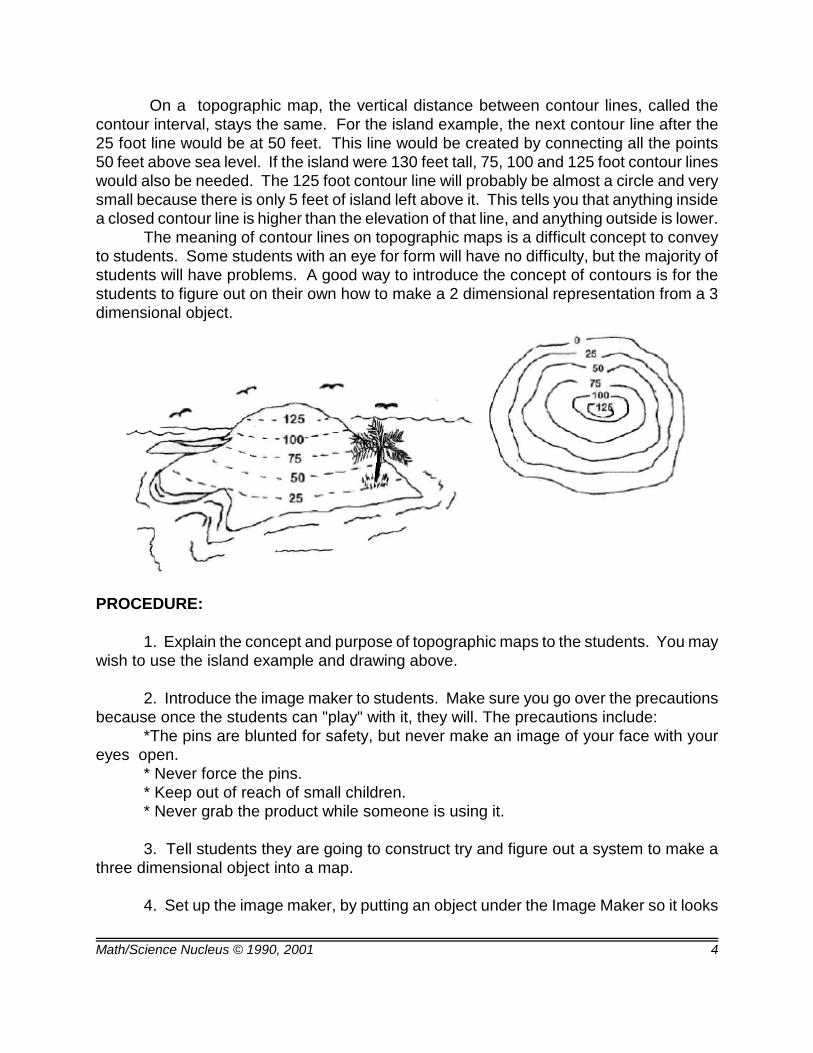
Contour lines on a make believe island. Sea level is the 0' contour.
UNIVERSE CYCLE - GEOGRAPHY (5)
PRE LAB
OBJECTIVE:
1. Exploring contours.2. Discovering how topographic maps are made.
VOCABULARY:
contourmaptopography
MATERIALS:
Image Makerwax paperwax pencil
BACKGROUND:
A map is a flat sheet of paper, but the surface of the Earth is not flat at all. Mapsare two-dimensional, while the Earth’s surface is three-dimensional. Maps use contourto show elevation above sea level. Maps with contours are called topographic maps.
To help visualize how the shape of the surface is shown on a map, visualize anisland in the ocean. The island is surrounded by water, and the line around the islandwhere the water touches it is all at the same elevation or sea level. Next imagine a line25 feet above sea level that goes all around the island. This line of constant elevation iscalled a contour line. It also shows the shape of the land at that level. The 0 contour wouldbe the shore line.
Math/Science Nucleus © 1990, 2001 4
On a topographic map, the vertical distance between contour lines, called thecontour interval, stays the same. For the island example, the next contour line after the25 foot line would be at 50 feet. This line would be created by connecting all the points50 feet above sea level. If the island were 130 feet tall, 75, 100 and 125 foot contour lineswould also be needed. The 125 foot contour line will probably be almost a circle and verysmall because there is only 5 feet of island left above it. This tells you that anything insidea closed contour line is higher than the elevation of that line, and anything outside is lower.
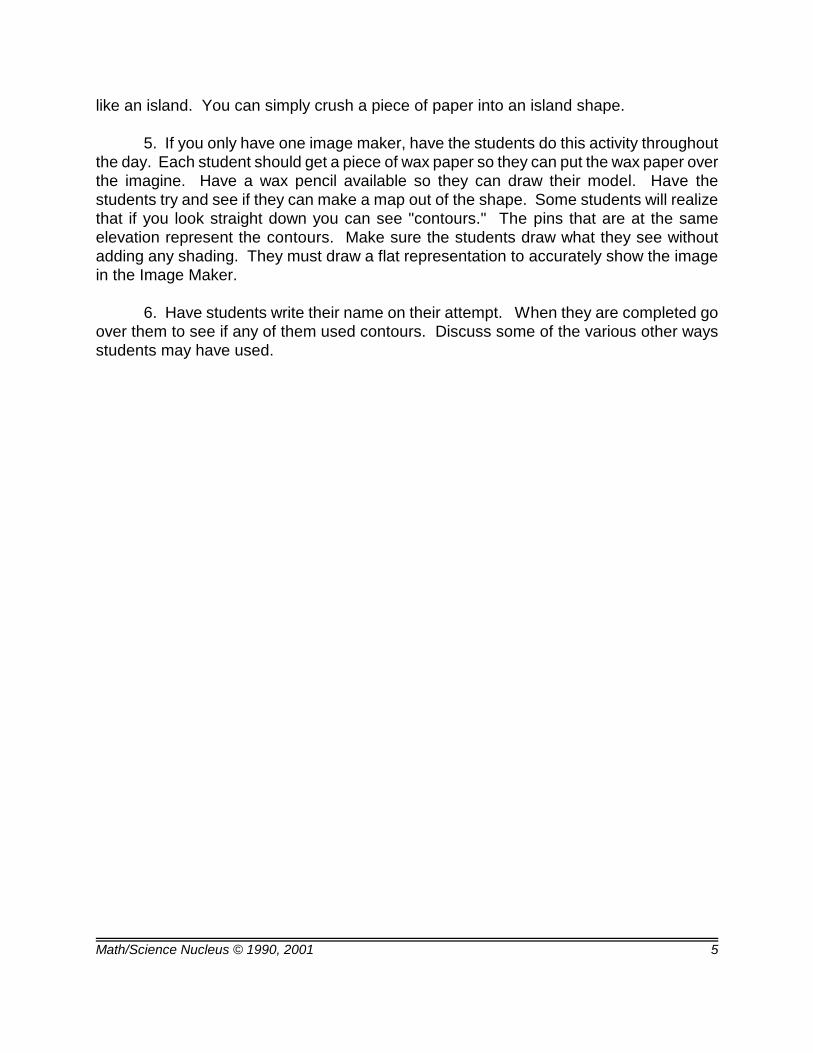
The meaning of contour lines on topographic maps is a difficult concept to conveyto students. Some students with an eye for form will have no difficulty, but the majority ofstudents will have problems. A good way to introduce the concept of contours is for thestudents to figure out on their own how to make a 2 dimensional representation from a 3dimensional object.
PROCEDURE:
1. Explain the concept and purpose of topographic maps to the students. You maywish to use the island example and drawing above.
2. Introduce the image maker to students. Make sure you go over the precautionsbecause once the students can "play" with it, they will. The precautions include:
*The pins are blunted for safety, but never make an image of your face with youreyes open.
* Never force the pins.* Keep out of reach of small children.* Never grab the product while someone is using it.
3. Tell students they are going to construct try and figure out a system to make athree dimensional object into a map.
4. Set up the image maker, by putting an object under the Image Maker so it looks
Math/Science Nucleus © 1990, 2001 5
like an island. You can simply crush a piece of paper into an island shape.
5. If you only have one image maker, have the students do this activity throughoutthe day. Each student should get a piece of wax paper so they can put the wax paper overthe imagine. Have a wax pencil available so they can draw their model. Have thestudents try and see if they can make a map out of the shape. Some students will realizethat if you look straight down you can see "contours." The pins that are at the sameelevation represent the contours. Make sure the students draw what they see withoutadding any shading. They must draw a flat representation to accurately show the imagein the Image Maker.
6. Have students write their name on their attempt. When they are completed goover them to see if any of them used contours. Discuss some of the various other waysstudents may have used.
Math/Science Nucleus © 1990, 2001 6
Students compare a series oftopographic maps.
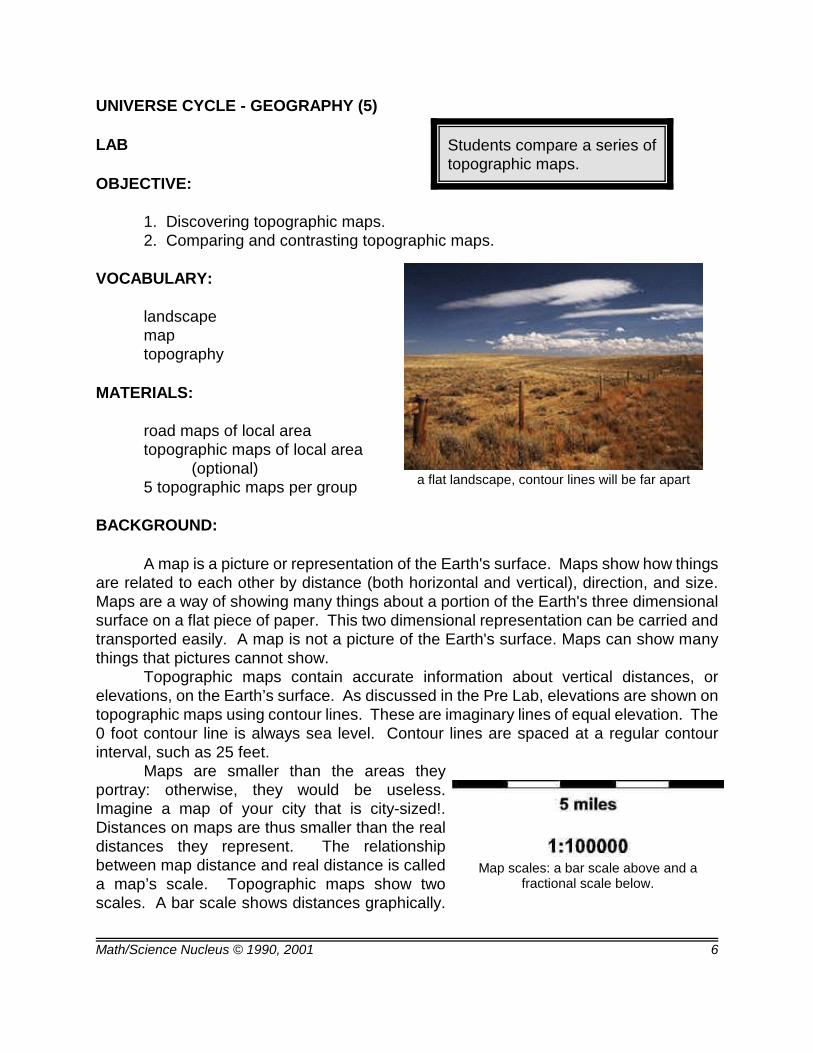
a flat landscape, contour lines will be far apart
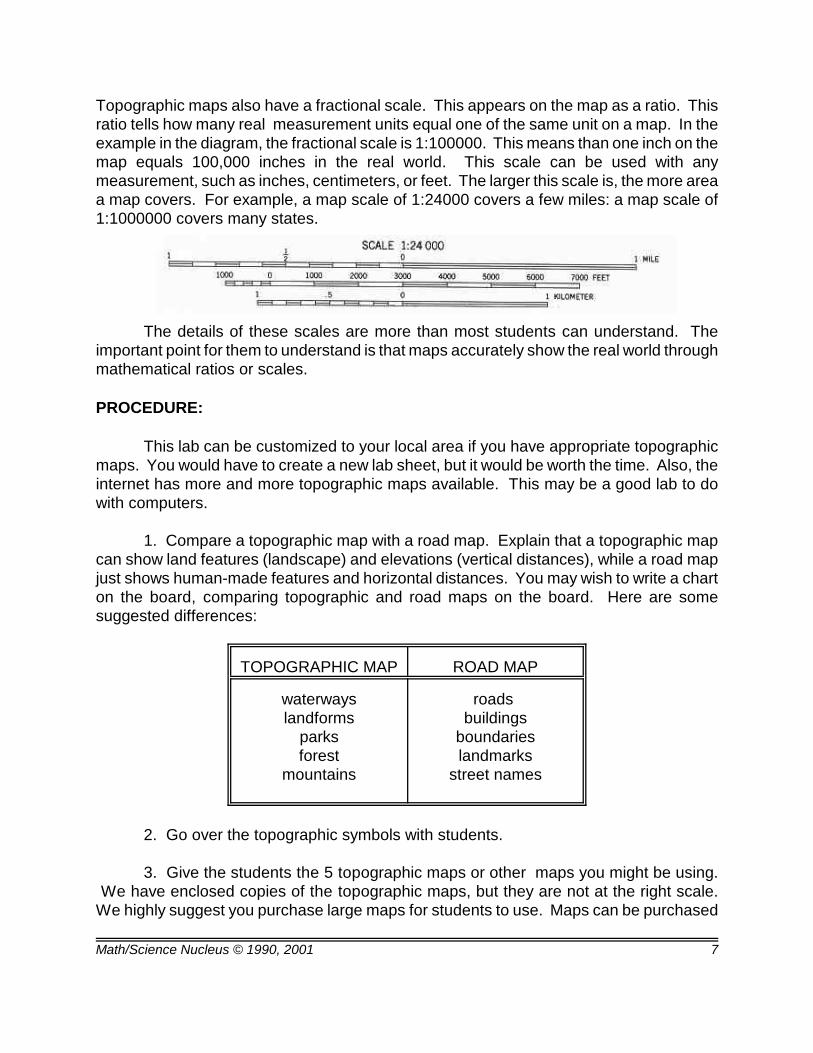
Map scales: a bar scale above and afractional scale below.
UNIVERSE CYCLE - GEOGRAPHY (5)
LAB
OBJECTIVE:
1. Discovering topographic maps.2. Comparing and contrasting topographic maps.
VOCABULARY:
landscapemaptopography
MATERIALS:
road maps of local areatopographic maps of local area
(optional)5 topographic maps per group
BACKGROUND:
A map is a picture or representation of the Earth's surface. Maps show how thingsare related to each other by distance (both horizontal and vertical), direction, and size.Maps are a way of showing many things about a portion of the Earth's three dimensionalsurface on a flat piece of paper. This two dimensional representation can be carried andtransported easily. A map is not a picture of the Earth's surface. Maps can show manythings that pictures cannot show.
Topographic maps contain accurate information about vertical distances, orelevations, on the Earth’s surface. As discussed in the Pre Lab, elevations are shown ontopographic maps using contour lines. These are imaginary lines of equal elevation. The0 foot contour line is always sea level. Contour lines are spaced at a regular contourinterval, such as 25 feet.
Maps are smaller than the areas theyportray: otherwise, they would be useless.Imagine a map of your city that is city-sized!.Distances on maps are thus smaller than the realdistances they represent. The relationshipbetween map distance and real distance is calleda map’s scale. Topographic maps show twoscales. A bar scale shows distances graphically.
Math/Science Nucleus © 1990, 2001 7
Topographic maps also have a fractional scale. This appears on the map as a ratio. Thisratio tells how many real measurement units equal one of the same unit on a map. In theexample in the diagram, the fractional scale is 1:100000. This means than one inch on themap equals 100,000 inches in the real world. This scale can be used with anymeasurement, such as inches, centimeters, or feet. The larger this scale is, the more areaa map covers. For example, a map scale of 1:24000 covers a few miles: a map scale of1:1000000 covers many states.
The details of these scales are more than most students can understand. Theimportant point for them to understand is that maps accurately show the real world throughmathematical ratios or scales.
PROCEDURE:
This lab can be customized to your local area if you have appropriate topographicmaps. You would have to create a new lab sheet, but it would be worth the time. Also, theinternet has more and more topographic maps available. This may be a good lab to dowith computers.
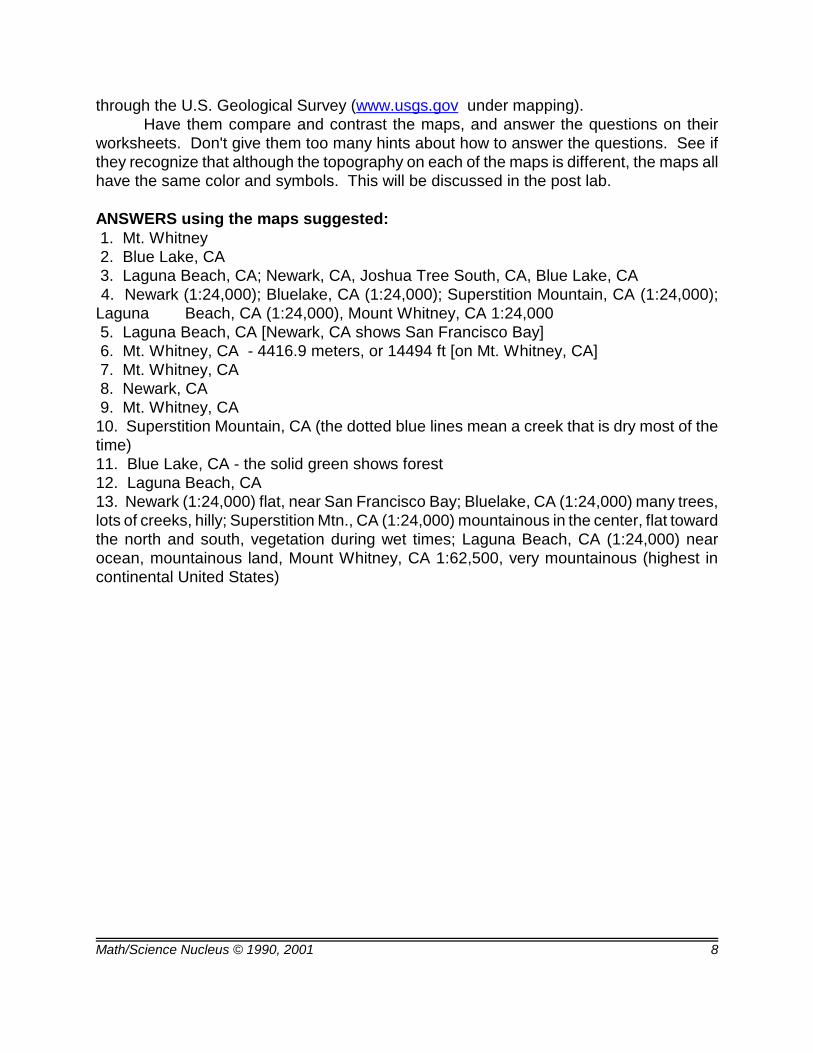
1. Compare a topographic map with a road map. Explain that a topographic mapcan show land features (landscape) and elevations (vertical distances), while a road mapjust shows human-made features and horizontal distances. You may wish to write a charton the board, comparing topographic and road maps on the board. Here are somesuggested differences:
TOPOGRAPHIC MAP ROAD MAP
waterwayslandforms
parksforest
mountains
roads buildings
boundarieslandmarks
street names
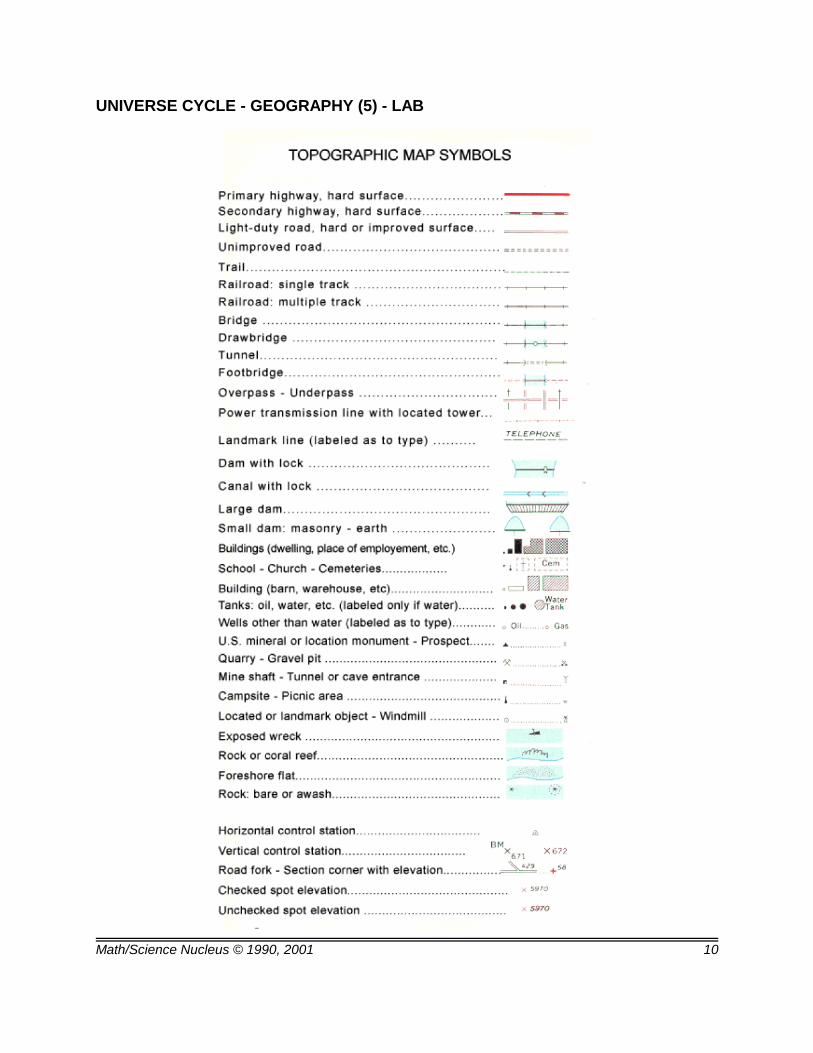
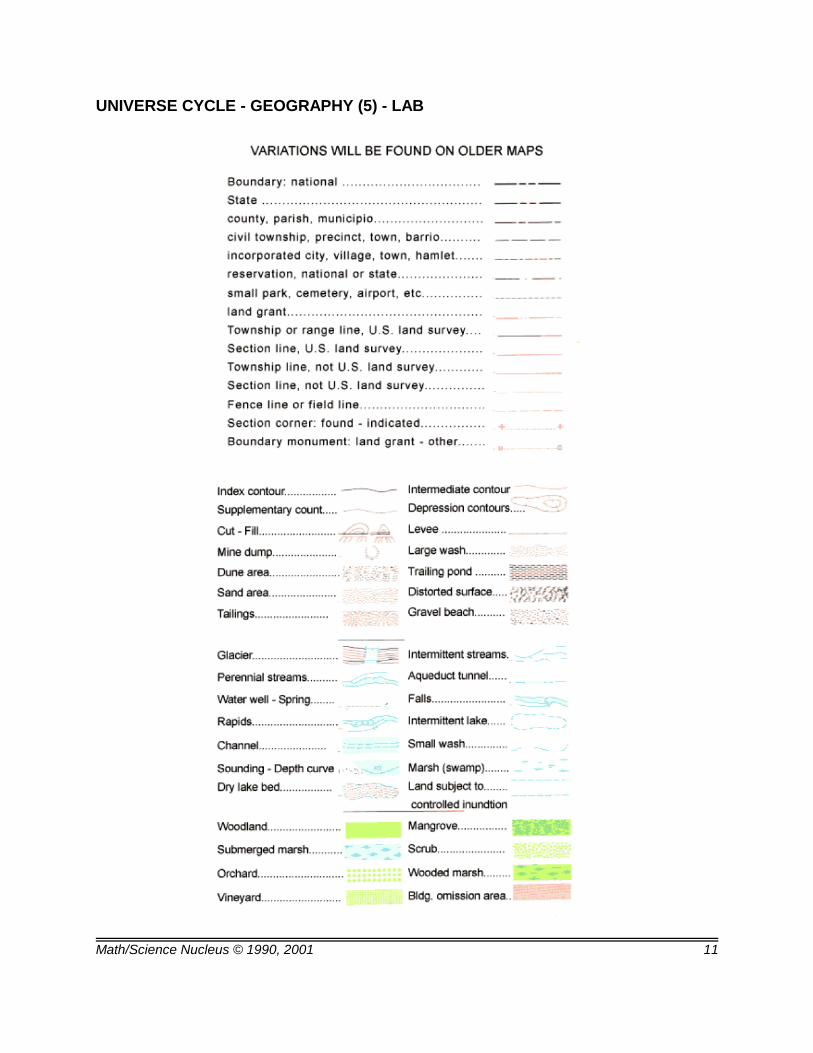
2. Go over the topographic symbols with students.
3. Give the students the 5 topographic maps or other maps you might be using. We have enclosed copies of the topographic maps, but they are not at the right scale.We highly suggest you purchase large maps for students to use. Maps can be purchased
Math/Science Nucleus © 1990, 2001 8
through the U.S. Geological Survey (www.usgs.gov under mapping). Have them compare and contrast the maps, and answer the questions on their
worksheets. Don't give them too many hints about how to answer the questions. See ifthey recognize that although the topography on each of the maps is different, the maps allhave the same color and symbols. This will be discussed in the post lab.
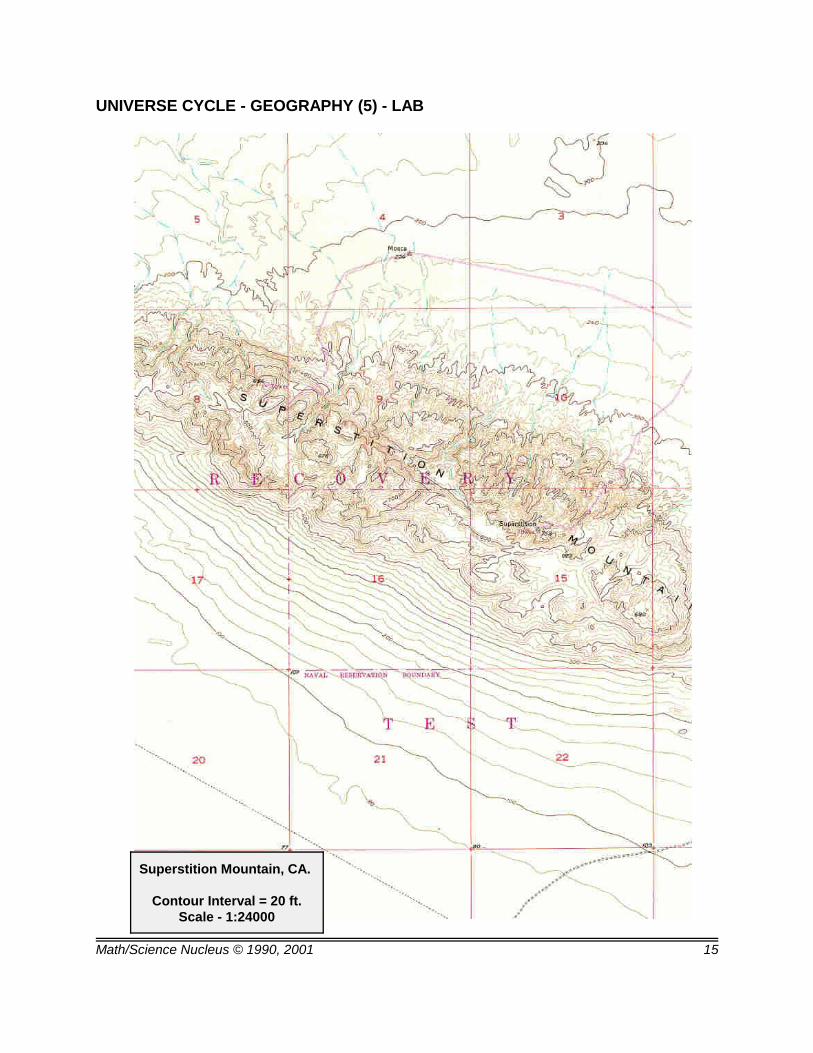
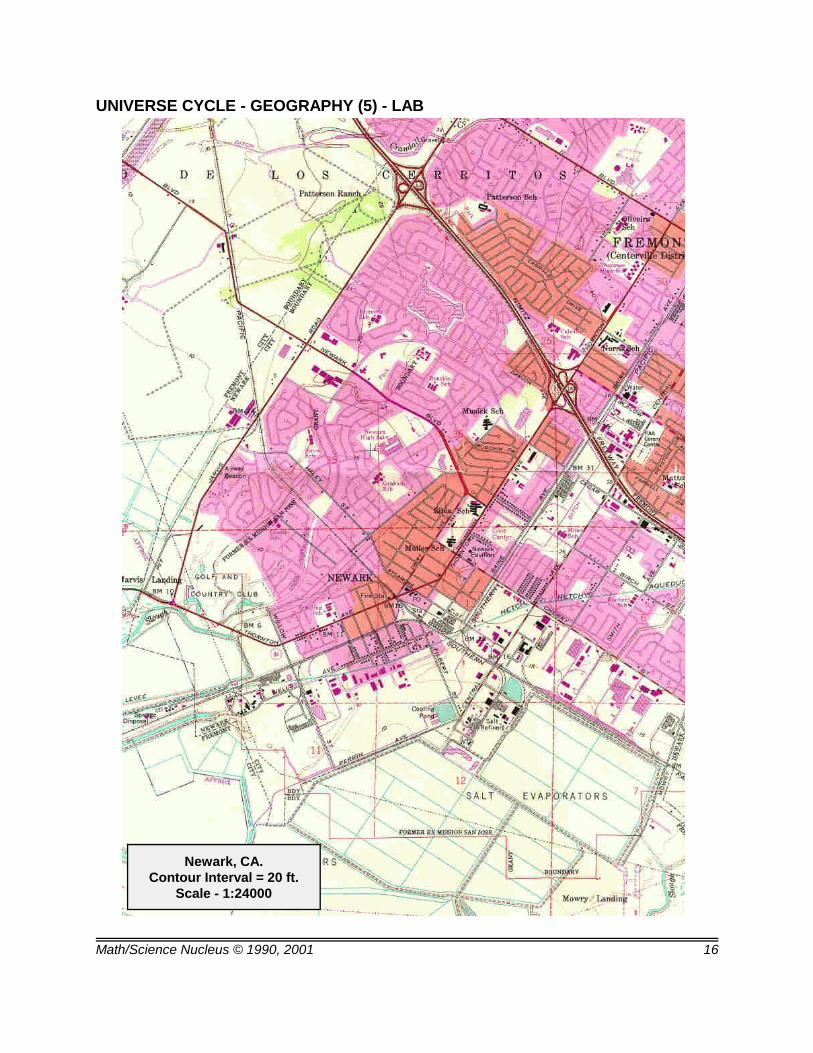
ANSWERS using the maps suggested: 1. Mt. Whitney 2. Blue Lake, CA 3. Laguna Beach, CA; Newark, CA, Joshua Tree South, CA, Blue Lake, CA 4. Newark (1:24,000); Bluelake, CA (1:24,000); Superstition Mountain, CA (1:24,000);Laguna Beach, CA (1:24,000), Mount Whitney, CA 1:24,000 5. Laguna Beach, CA [Newark, CA shows San Francisco Bay] 6. Mt. Whitney, CA - 4416.9 meters, or 14494 ft [on Mt. Whitney, CA] 7. Mt. Whitney, CA 8. Newark, CA 9. Mt. Whitney, CA10. Superstition Mountain, CA (the dotted blue lines mean a creek that is dry most of thetime)11. Blue Lake, CA - the solid green shows forest12. Laguna Beach, CA13. Newark (1:24,000) flat, near San Francisco Bay; Bluelake, CA (1:24,000) many trees,lots of creeks, hilly; Superstition Mtn., CA (1:24,000) mountainous in the center, flat towardthe north and south, vegetation during wet times; Laguna Beach, CA (1:24,000) nearocean, mountainous land, Mount Whitney, CA 1:62,500, very mountainous (highest incontinental United States)
Math/Science Nucleus © 1990, 2001 9
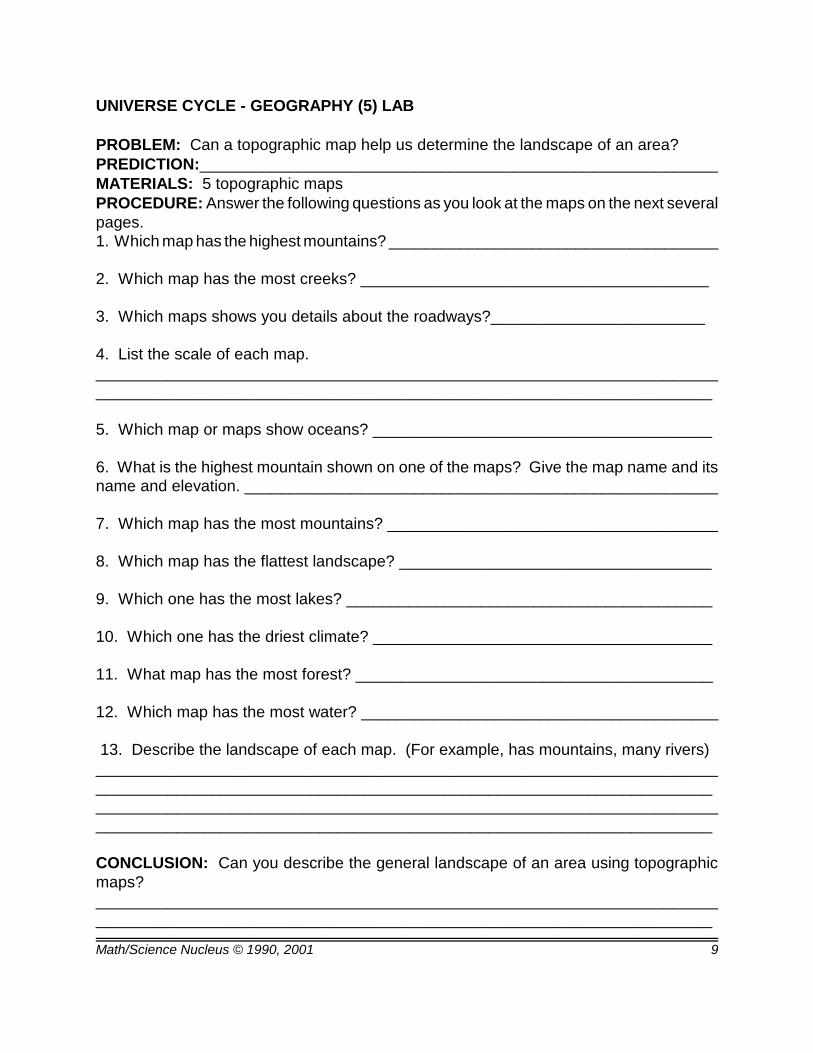
UNIVERSE CYCLE - GEOGRAPHY (5) LAB
PROBLEM: Can a topographic map help us determine the landscape of an area?PREDICTION:__________________________________________________________MATERIALS: 5 topographic mapsPROCEDURE: Answer the following questions as you look at the maps on the next severalpages.1. Which map has the highest mountains? _____________________________________
2. Which map has the most creeks? _______________________________________
3. Which maps shows you details about the roadways?________________________
4. List the scale of each map.__________________________________________________________________________________________________________________________________________
5. Which map or maps show oceans? ______________________________________
6. What is the highest mountain shown on one of the maps? Give the map name and itsname and elevation. _____________________________________________________
7. Which map has the most mountains? _____________________________________
8. Which map has the flattest landscape? ___________________________________
9. Which one has the most lakes? _________________________________________
10. Which one has the driest climate? ______________________________________
11. What map has the most forest? ________________________________________
12. Which map has the most water? ________________________________________
13. Describe the landscape of each map. (For example, has mountains, many rivers)____________________________________________________________________________________________________________________________________________________________________________________________________________________________________________________________________________________
CONCLUSION: Can you describe the general landscape of an area using topographicmaps?__________________________________________________________________________________________________________________________________________
Math/Science Nucleus © 1990, 2001 10
UNIVERSE CYCLE - GEOGRAPHY (5) - LAB
Math/Science Nucleus © 1990, 2001 11
UNIVERSE CYCLE - GEOGRAPHY (5) - LAB
Math/Science Nucleus © 1990, 2001 12
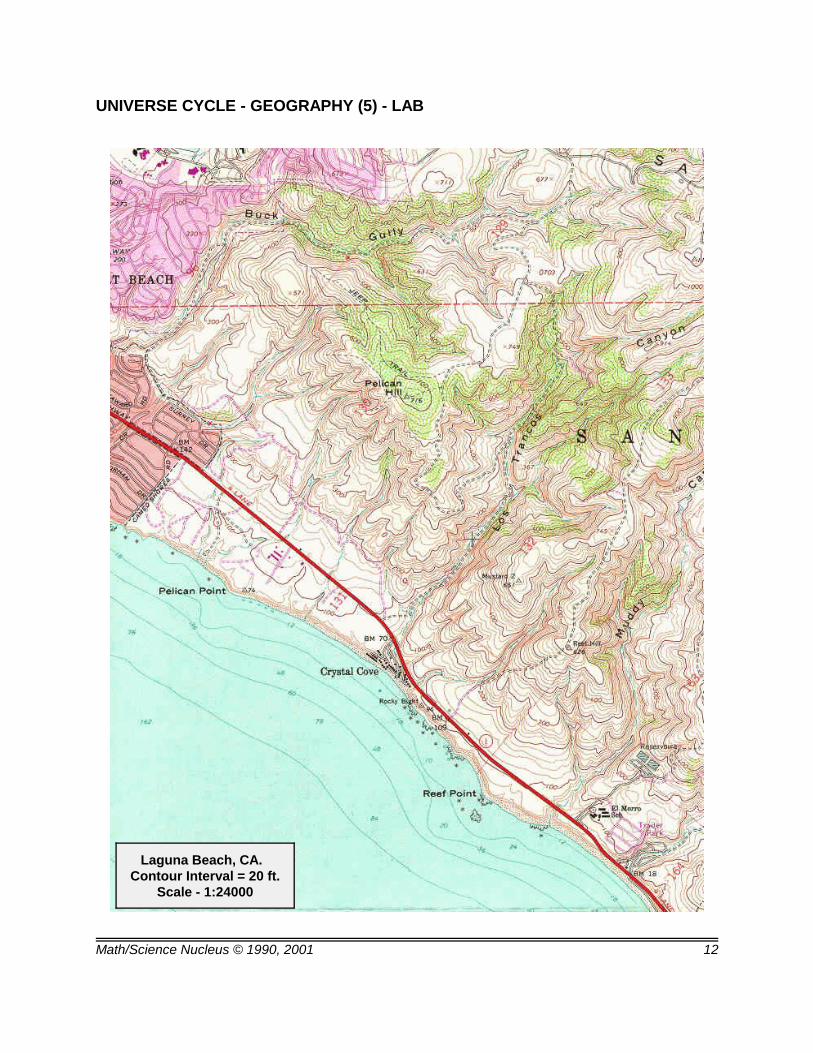
Laguna Beach, CA. Contour Interval = 20 ft.
Scale - 1:24000
UNIVERSE CYCLE - GEOGRAPHY (5) - LAB
Math/Science Nucleus © 1990, 2001 13
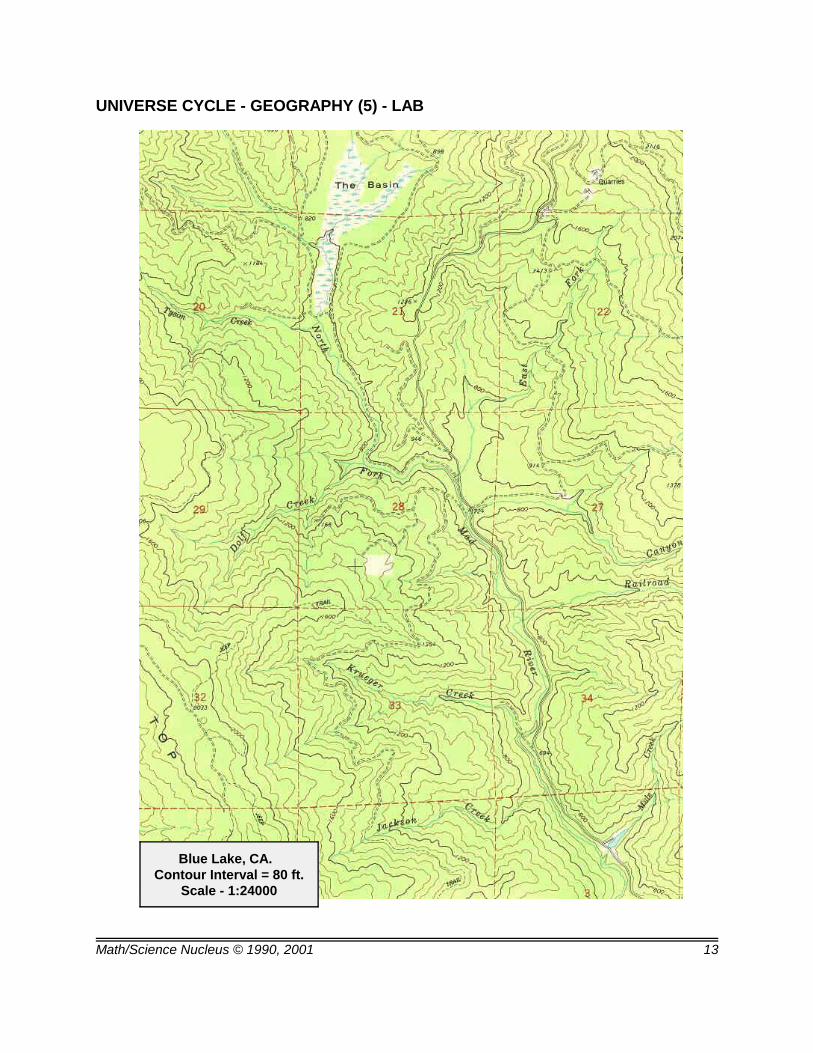
Blue Lake, CA. Contour Interval = 80 ft.
Scale - 1:24000
UNIVERSE CYCLE - GEOGRAPHY (5) - LAB
Math/Science Nucleus © 1990, 2001 14
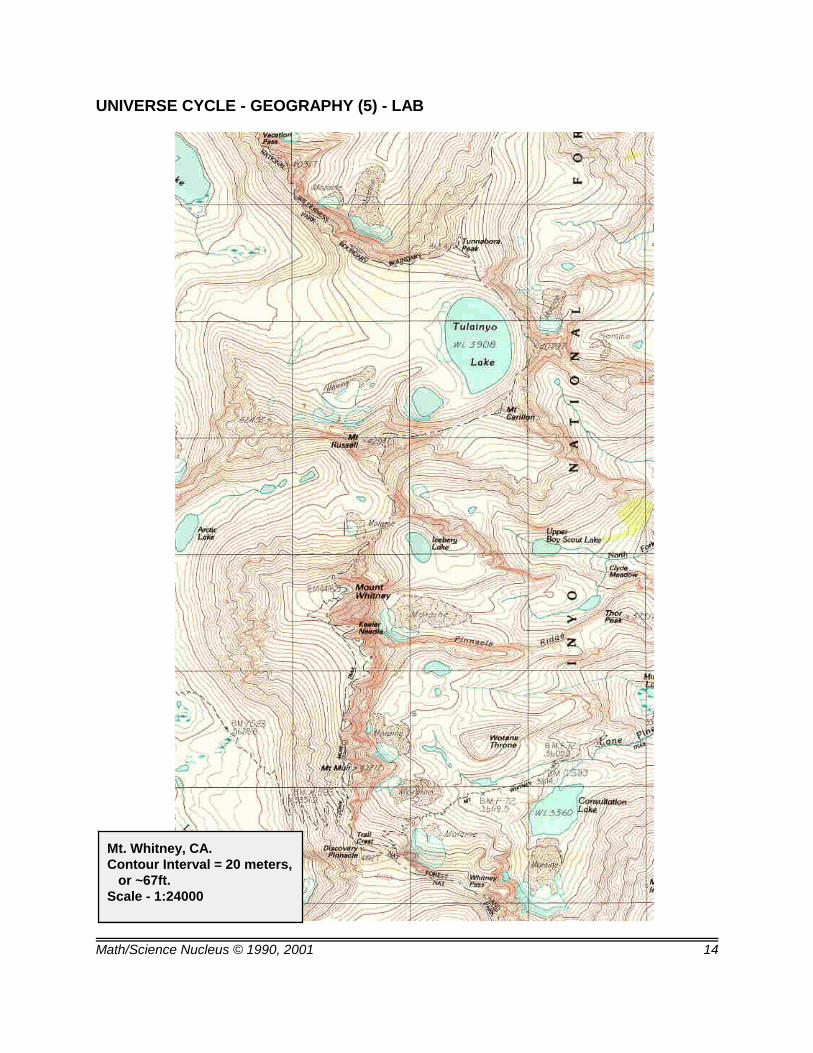
Mt. Whitney, CA. Contour Interval = 20 meters, or ~67ft.Scale - 1:24000
UNIVERSE CYCLE - GEOGRAPHY (5) - LAB
Math/Science Nucleus © 1990, 2001 15
Superstition Mountain, CA.
Contour Interval = 20 ft.Scale - 1:24000
UNIVERSE CYCLE - GEOGRAPHY (5) - LAB
Math/Science Nucleus © 1990, 2001 16
Newark, CA.Contour Interval = 20 ft.
Scale - 1:24000
UNIVERSE CYCLE - GEOGRAPHY (5) - LAB
Math/Science Nucleus © 1990, 2001 17
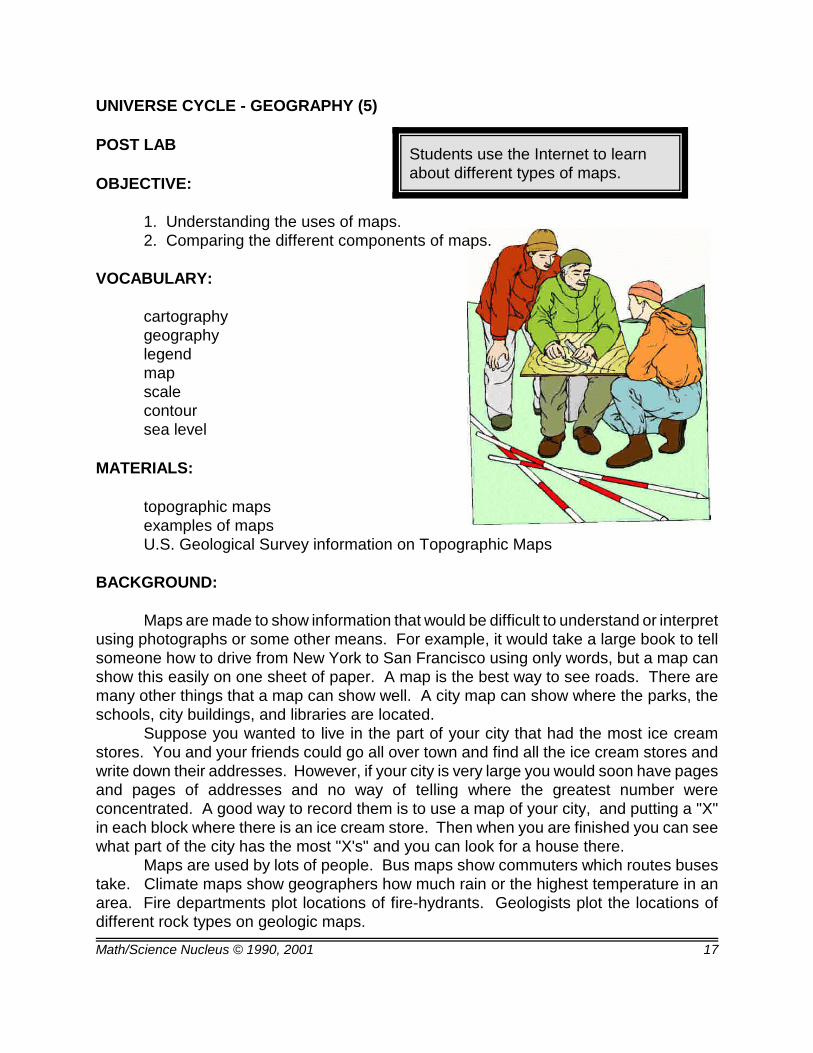
Students use the Internet to learnabout different types of maps.
UNIVERSE CYCLE - GEOGRAPHY (5)
POST LAB
OBJECTIVE:
1. Understanding the uses of maps.2. Comparing the different components of maps.
VOCABULARY:
cartographygeographylegendmapscalecontoursea level
MATERIALS:
topographic mapsexamples of maps
U.S. Geological Survey information on Topographic Maps
BACKGROUND:
Maps are made to show information that would be difficult to understand or interpretusing photographs or some other means. For example, it would take a large book to tellsomeone how to drive from New York to San Francisco using only words, but a map canshow this easily on one sheet of paper. A map is the best way to see roads. There aremany other things that a map can show well. A city map can show where the parks, theschools, city buildings, and libraries are located.
Suppose you wanted to live in the part of your city that had the most ice creamstores. You and your friends could go all over town and find all the ice cream stores andwrite down their addresses. However, if your city is very large you would soon have pagesand pages of addresses and no way of telling where the greatest number wereconcentrated. A good way to record them is to use a map of your city, and putting a "X"in each block where there is an ice cream store. Then when you are finished you can seewhat part of the city has the most "X's" and you can look for a house there.
Maps are used by lots of people. Bus maps show commuters which routes busestake. Climate maps show geographers how much rain or the highest temperature in anarea. Fire departments plot locations of fire-hydrants. Geologists plot the locations ofdifferent rock types on geologic maps.
Math/Science Nucleus © 1990, 2001 18
PROCEDURE:
1. Explain to the class that maps have many uses. Have the students list differenttypes of maps. List their ideas on the board.
2. As an in class or homework assignment, have each student find a virtual mapon the Internet or a real map. Have the student write a paragraph describing the purposeof the map, how it shows information, and giving the map’s scale and other features it mayhave. You may wish to assign specific map types to each student especially if you do theassignment in the classroom.
Encourage them to look for a map that interests them. We recommend using oneof the search engines to find especially local maps. Make sure the students writes downthe URL of the website.