Embed Size (px)
Citation preview
Fifteen years of Academic Entrepreneurship in Italy: Evidence from the TASTE project
Riccardo Fini 18/2/2015
Porto Business School
Agenda
• TASTE project: overview
• TASTE project: results
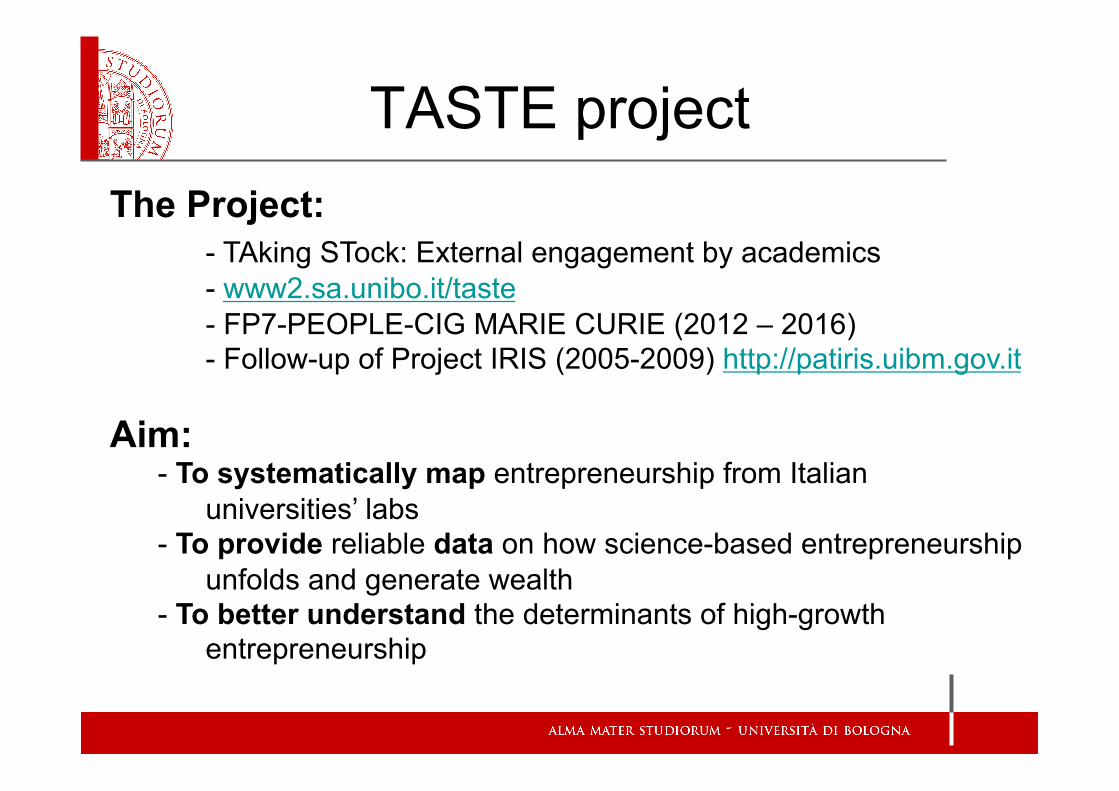
TASTE project The Project:
- TAking STock: External engagement by academics - www2.sa.unibo.it/taste - FP7-PEOPLE-CIG MARIE CURIE (2012 – 2016) - Follow-up of Project IRIS (2005-2009) http://patiris.uibm.gov.it
Aim: - To systematically map entrepreneurship from Italian
universities’ labs - To provide reliable data on how science-based entrepreneurship
unfolds and generate wealth - To better understand the determinants of high-growth
entrepreneurship
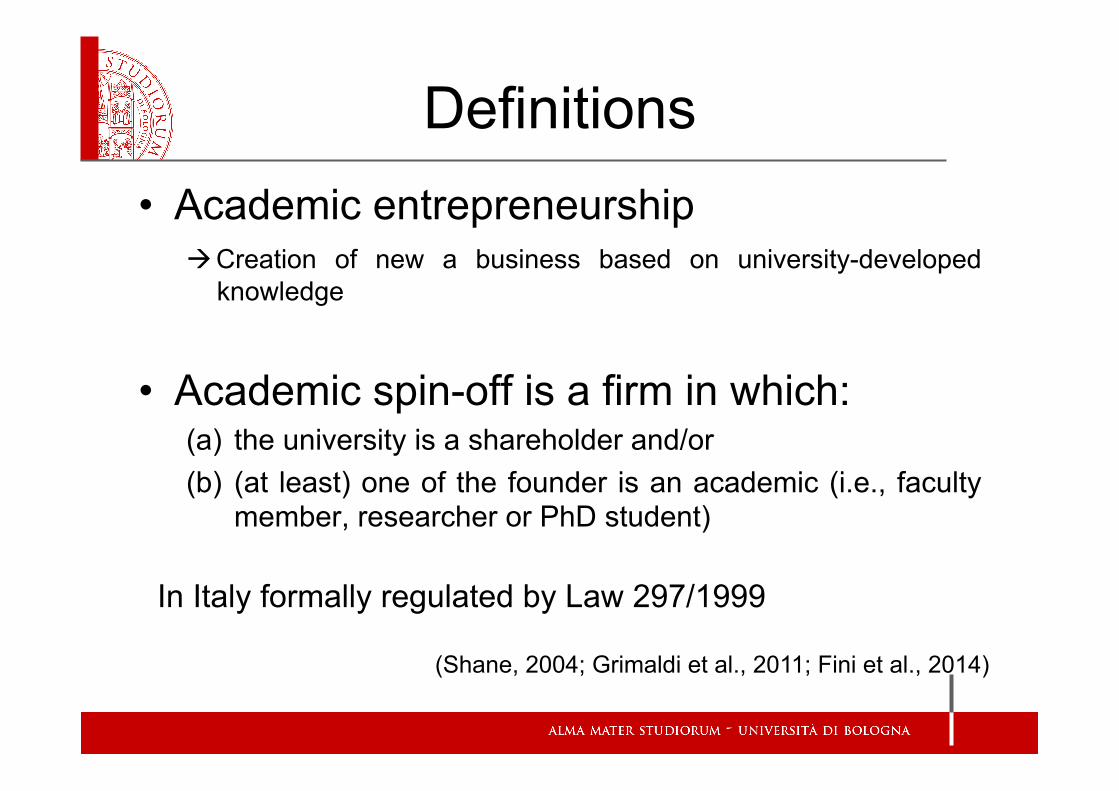
Definitions • Academic entrepreneurship
Creation of new a business based on university-developed knowledge
• Academic spin-off is a firm in which: (a) the university is a shareholder and/or (b) (at least) one of the founder is an academic (i.e., faculty
member, researcher or PhD student)
In Italy formally regulated by Law 297/1999
(Shane, 2004; Grimaldi et al., 2011; Fini et al., 2014)
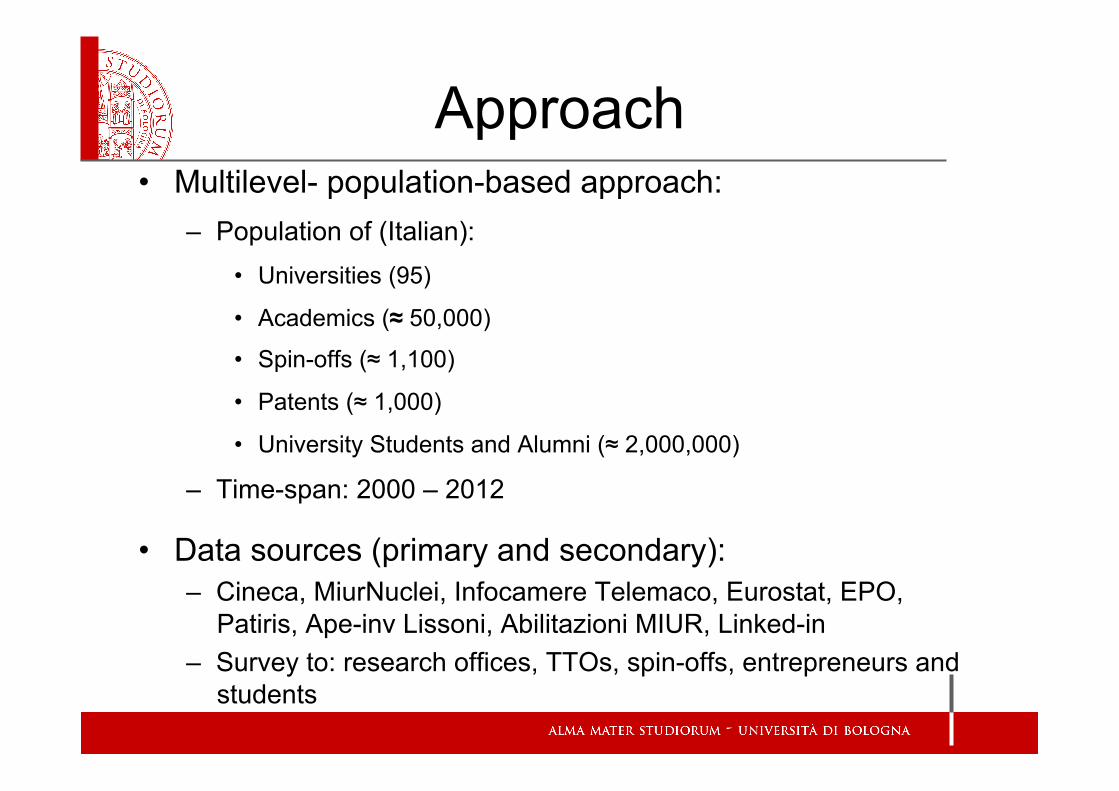
Approach • Multilevel- population-based approach:
– Population of (Italian): • Universities (95)
• Academics (≈ 50,000)
• Spin-offs (≈ 1,100)
• Patents (≈ 1,000)
• University Students and Alumni (≈ 2,000,000)
– Time-span: 2000 – 2012
• Data sources (primary and secondary): – Cineca, MiurNuclei, Infocamere Telemaco, Eurostat, EPO,
Patiris, Ape-inv Lissoni, Abilitazioni MIUR, Linked-in – Survey to: research offices, TTOs, spin-offs, entrepreneurs and
students
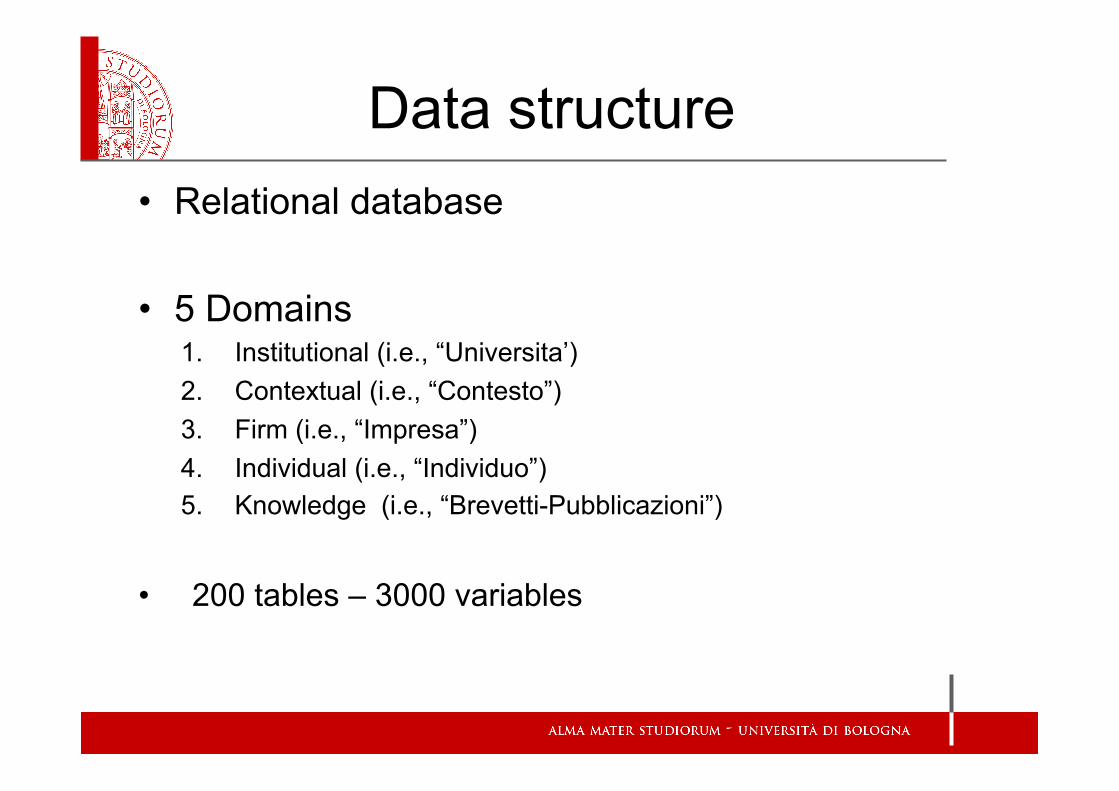
Data structure • Relational database
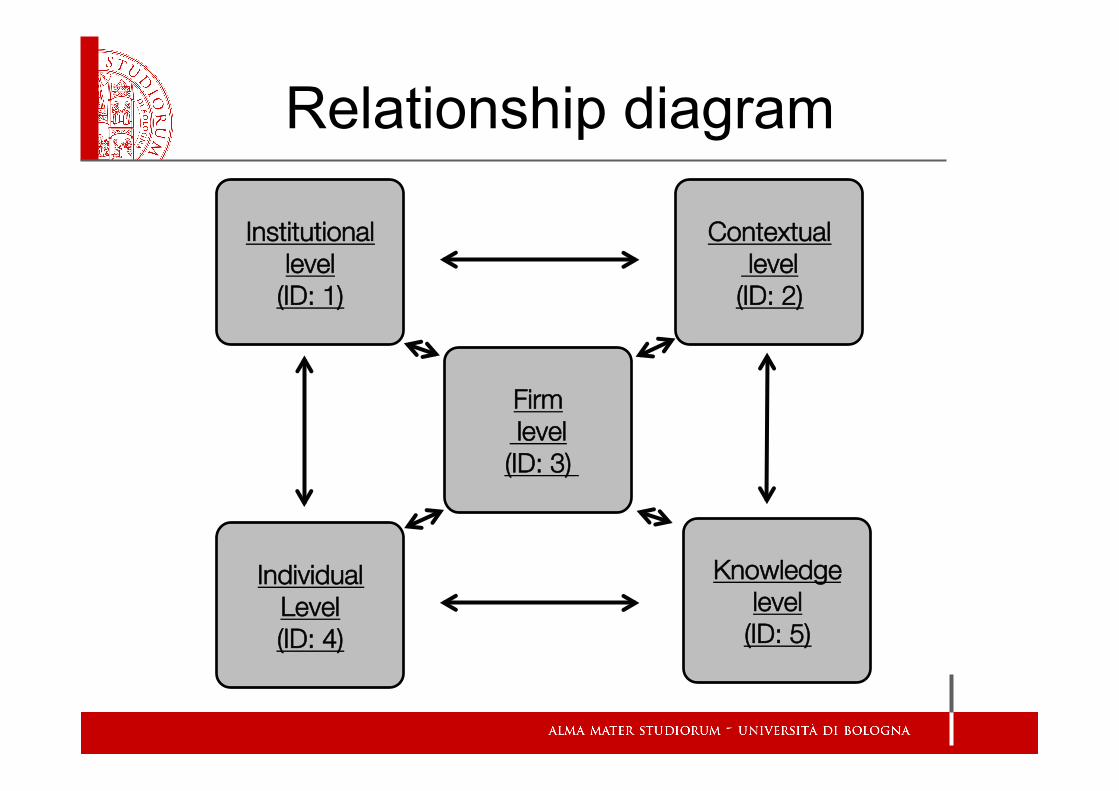
• 5 Domains 1. Institutional (i.e., “Universita’) 2. Contextual (i.e., “Contesto”) 3. Firm (i.e., “Impresa”) 4. Individual (i.e., “Individuo”) 5. Knowledge (i.e., “Brevetti-Pubblicazioni”)
• 200 tables – 3000 variables
Individual Level (ID: 4)
Firm level (ID: 3)
Contextual level (ID: 2)
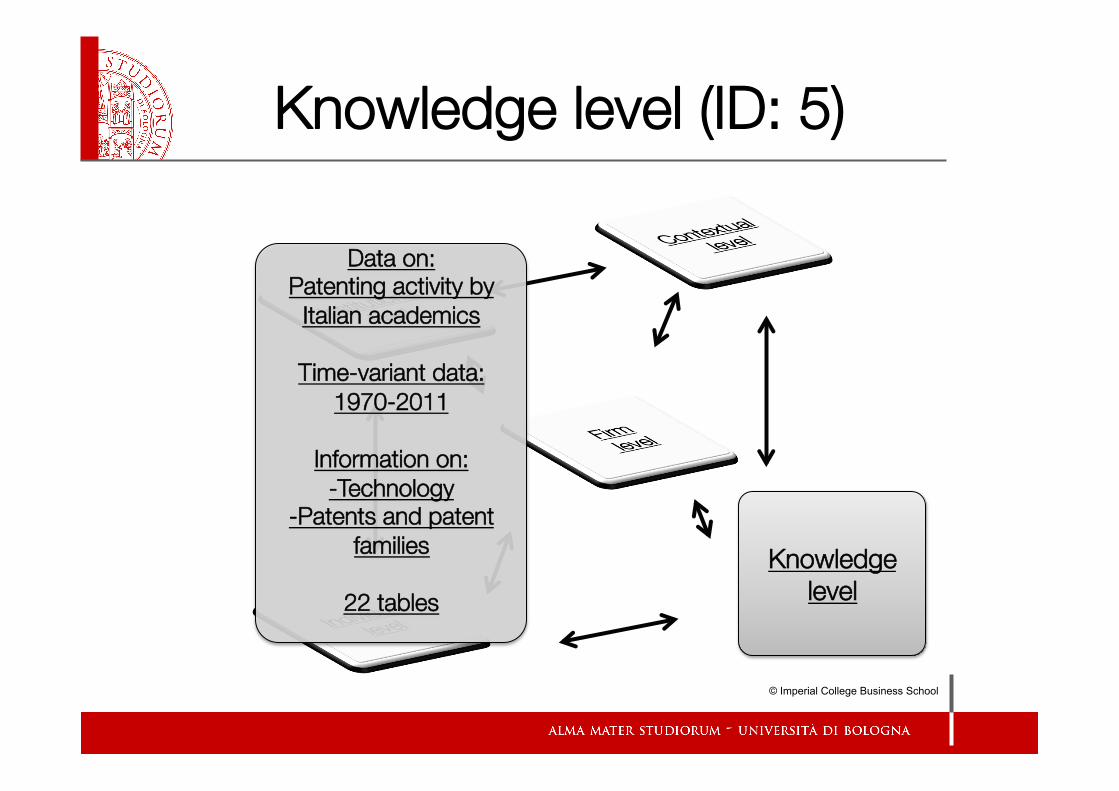
Knowledge level
(ID: 5)
Institutional level
(ID: 1)
Relationship diagram
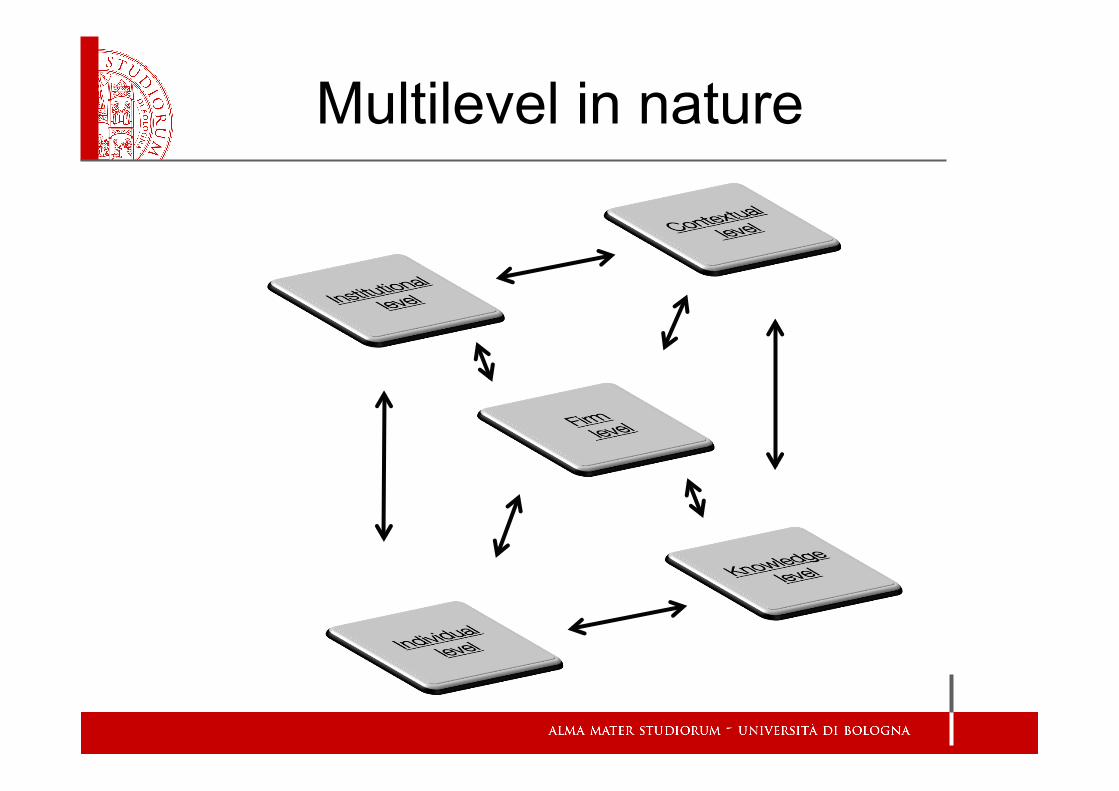
Multilevel in nature
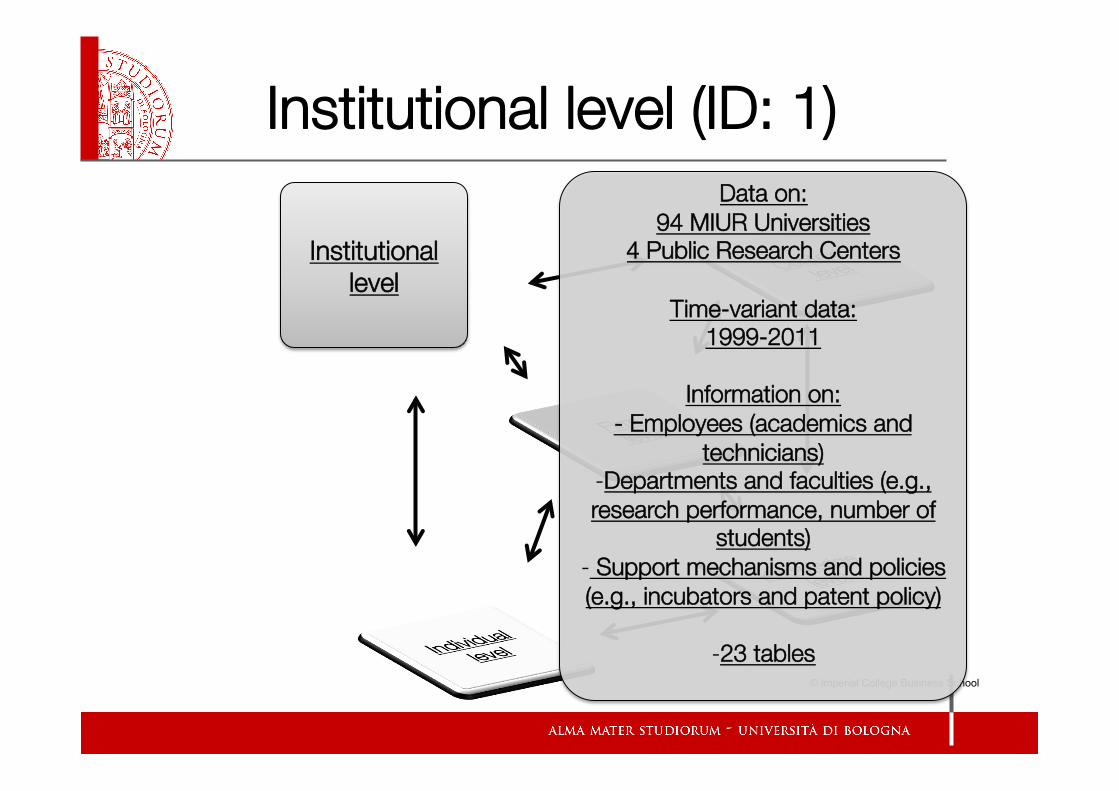
Institutional level (ID: 1)"
© Imperial College Business School
Institutional level
Data on: 94 MIUR Universities
4 Public Research Centers
Time-variant data: 1999-2011
Information on: - Employees (academics and
technicians) - Departments and faculties (e.g., research performance, number of
students) - Support mechanisms and policies (e.g., incubators and patent policy)
- 23 tables
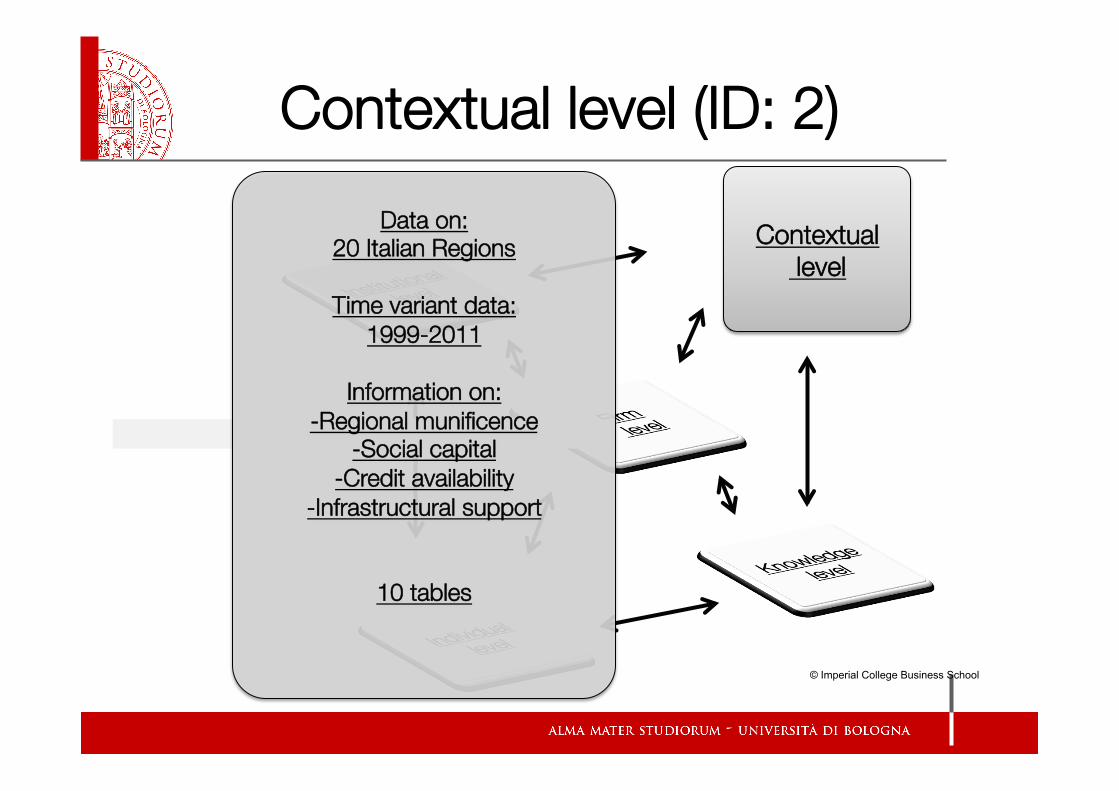
Contextual level (ID: 2)"
© Imperial College Business School
Contextual level
Data on: 20 Italian Regions
Time variant data: 1999-2011
Information on: -Regional munificence
-Social capital -Credit availability
-Infrastructural support
10 tables
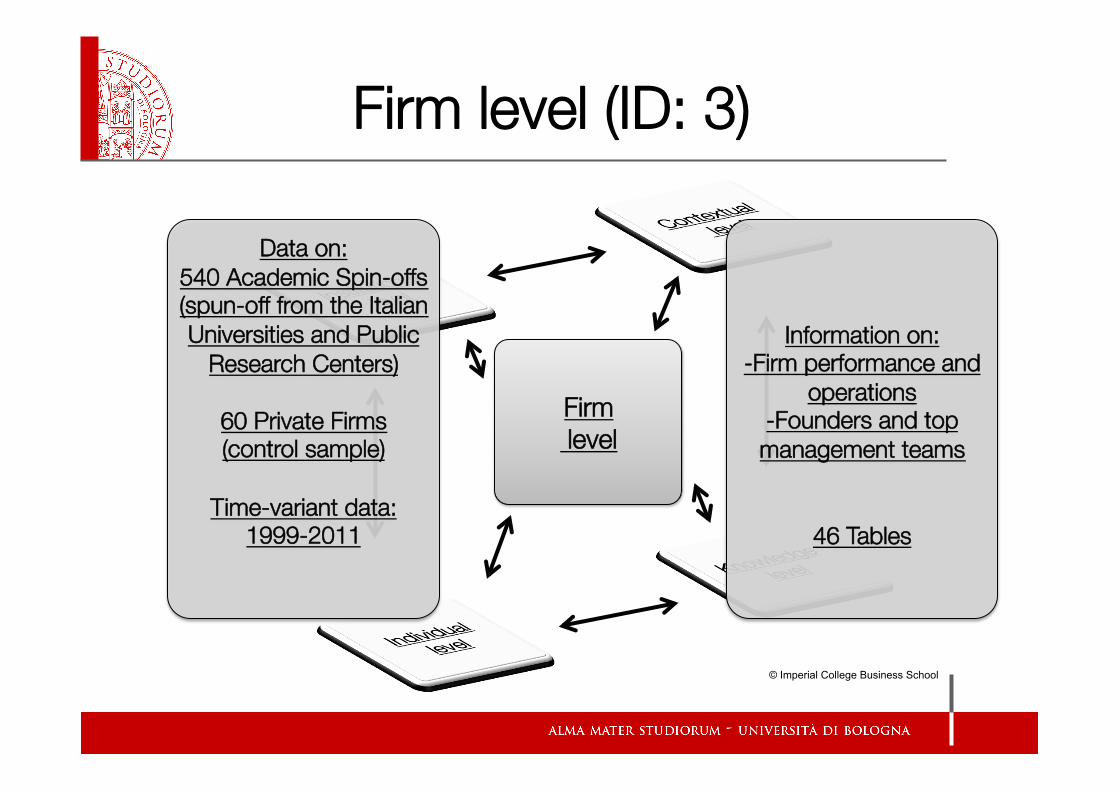
Firm level (ID: 3) "
© Imperial College Business School
Firm level
Data on: 540 Academic Spin-offs (spun-off from the Italian Universities and Public
Research Centers)
60 Private Firms (control sample)
Time-variant data: 1999-2011
Information on: -Firm performance and
operations -Founders and top management teams
46 Tables
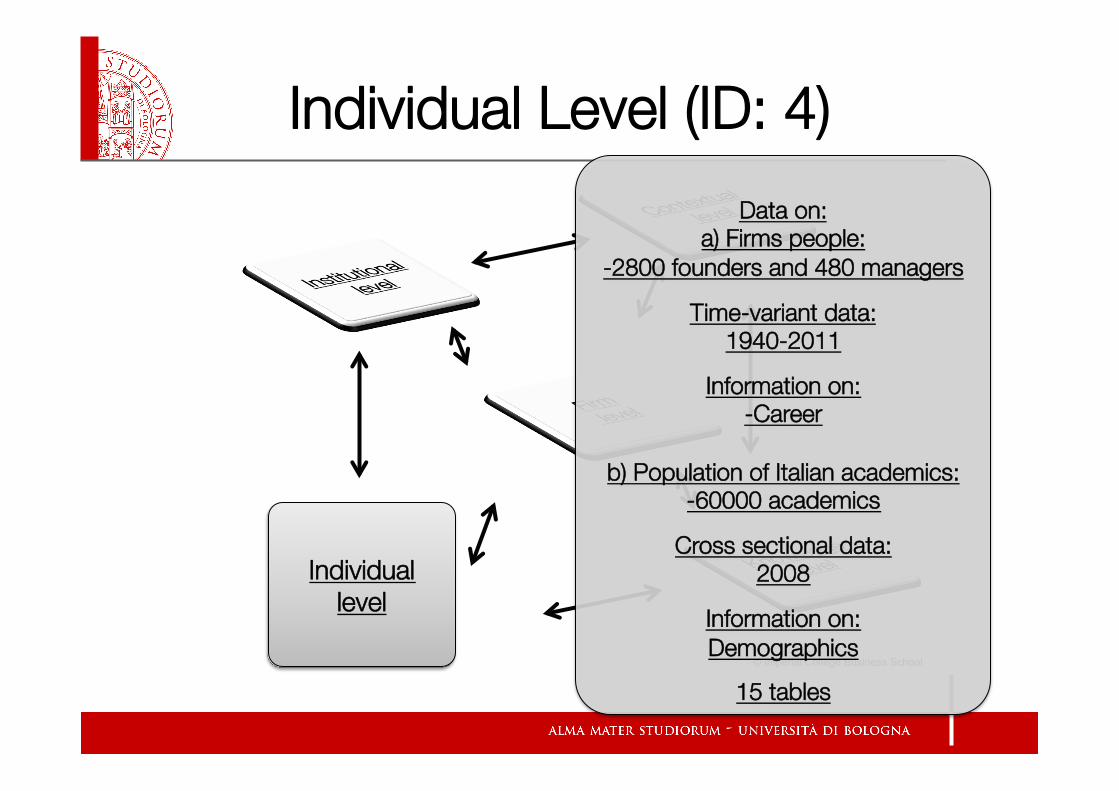
Individual Level (ID: 4)"
© Imperial College Business School
Individual level
Data on: a) Firms people:
-2800 founders and 480 managers
Time-variant data: 1940-2011
Information on: -Career
b) Population of Italian academics: -60000 academics
Cross sectional data: 2008
Information on: Demographics
15 tables
Knowledge level (ID: 5)
© Imperial College Business School
Knowledge level
Data on: Patenting activity by
Italian academics
Time-variant data: 1970-2011
Information on: -Technology
-Patents and patent families
22 tables
Research team • Unibo:
– Daniela Bolzani – Riccardo Fini – Rosa Grimaldi – Gian Luca Marzocchi – Maurizio Sobrero
• Externals: – Tim Folta (Uconn) – Enrico Forti (UCL) – Antonio Giuliani (UIC) – Einar Rasmussen (Bodo) – Simone Santoni (Ucass) – Mike Wright (ICL)
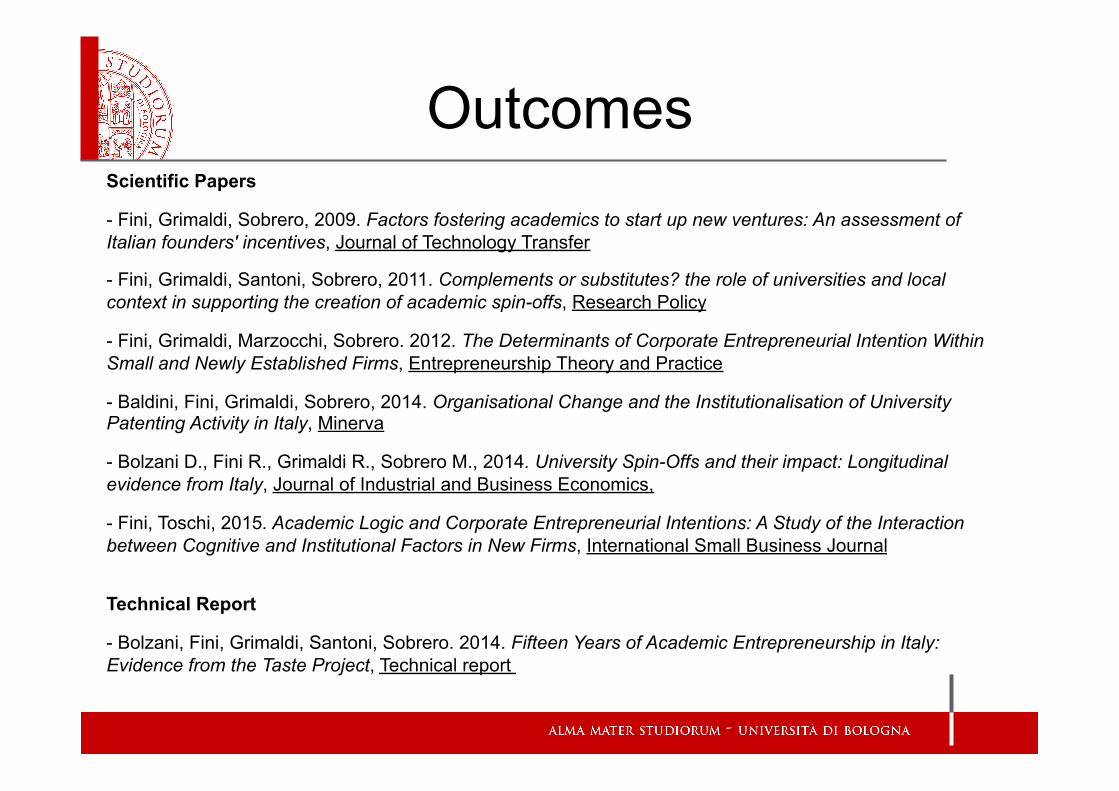
Outcomes Scientific Papers
- Fini, Grimaldi, Sobrero, 2009. Factors fostering academics to start up new ventures: An assessment of Italian founders' incentives, Journal of Technology Transfer
- Fini, Grimaldi, Santoni, Sobrero, 2011. Complements or substitutes? the role of universities and local context in supporting the creation of academic spin-offs, Research Policy
- Fini, Grimaldi, Marzocchi, Sobrero. 2012. The Determinants of Corporate Entrepreneurial Intention Within Small and Newly Established Firms, Entrepreneurship Theory and Practice
- Baldini, Fini, Grimaldi, Sobrero, 2014. Organisational Change and the Institutionalisation of University Patenting Activity in Italy, Minerva
- Bolzani D., Fini R., Grimaldi R., Sobrero M., 2014. University Spin-Offs and their impact: Longitudinal evidence from Italy, Journal of Industrial and Business Economics,
- Fini, Toschi, 2015. Academic Logic and Corporate Entrepreneurial Intentions: A Study of the Interaction between Cognitive and Institutional Factors in New Firms, International Small Business Journal
Technical Report
- Bolzani, Fini, Grimaldi, Santoni, Sobrero. 2014. Fifteen Years of Academic Entrepreneurship in Italy: Evidence from the Taste Project, Technical report
The TASTE Project: Some Evidence
Content
• Characteristics
• Shareholders and Equity Composition
• Innovation and Growth Strategies
• Performance
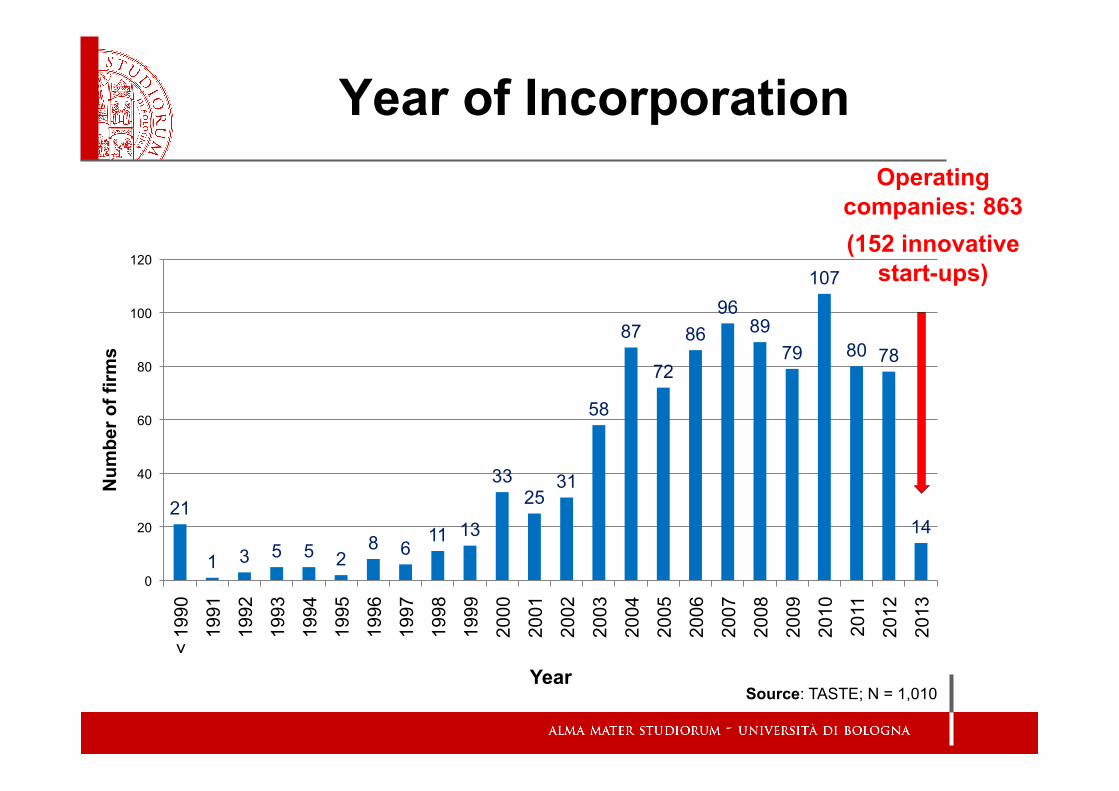
Year of Incorporation
21
1 3 5 5 2 8 6
11 13
33 25
31
58
87
72
86 96
89 79
107
80 78
14
0
20
40
60
80
100
120
< 19
90
1991
1992
1993
1994
1995
1996
1997
1998
1999
2000
2001
2002
2003
2004
2005
2006
2007
2008
2009
2010
2011
2012
2013
Num
ber o
f firm
s
Year
Operating companies: 863 (152 innovative
start-ups)
Source: TASTE; N = 1,010
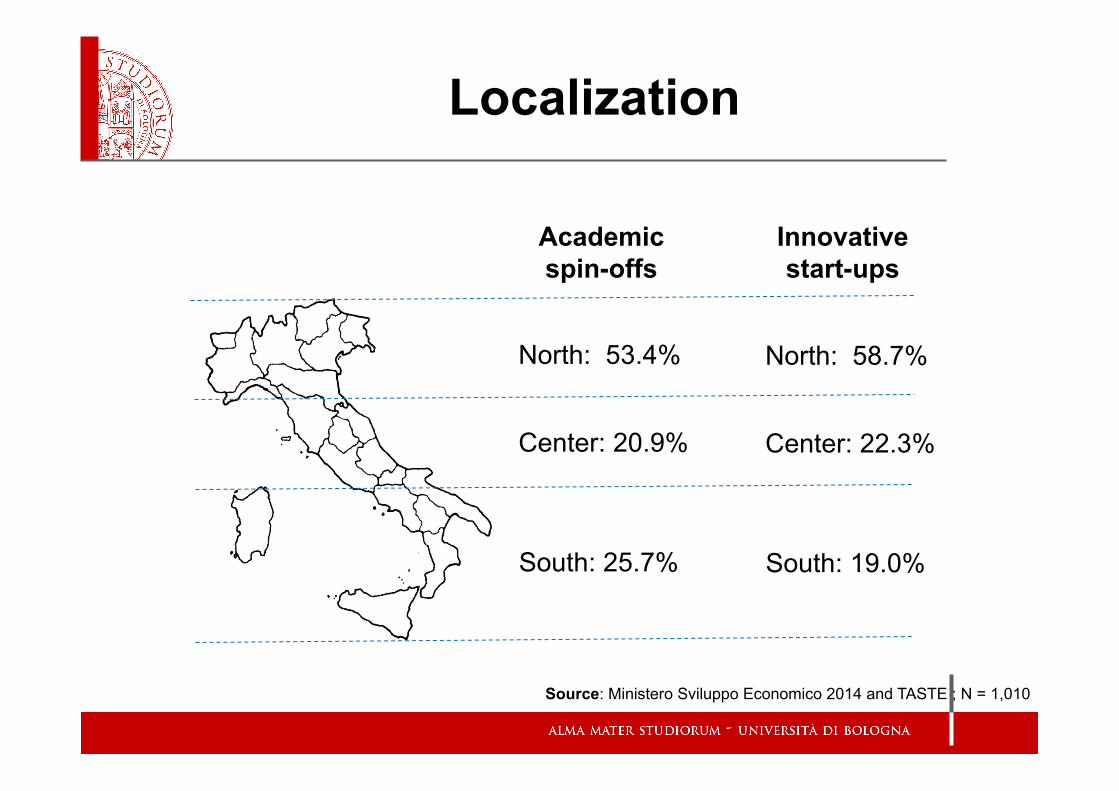
North: 53.4%
Center: 20.9%
South: 25.7%
Academic spin-offs
North: 58.7%
Center: 22.3%
South: 19.0%
Innovative start-ups
Localization
Source: Ministero Sviluppo Economico 2014 and TASTE ; N = 1,010
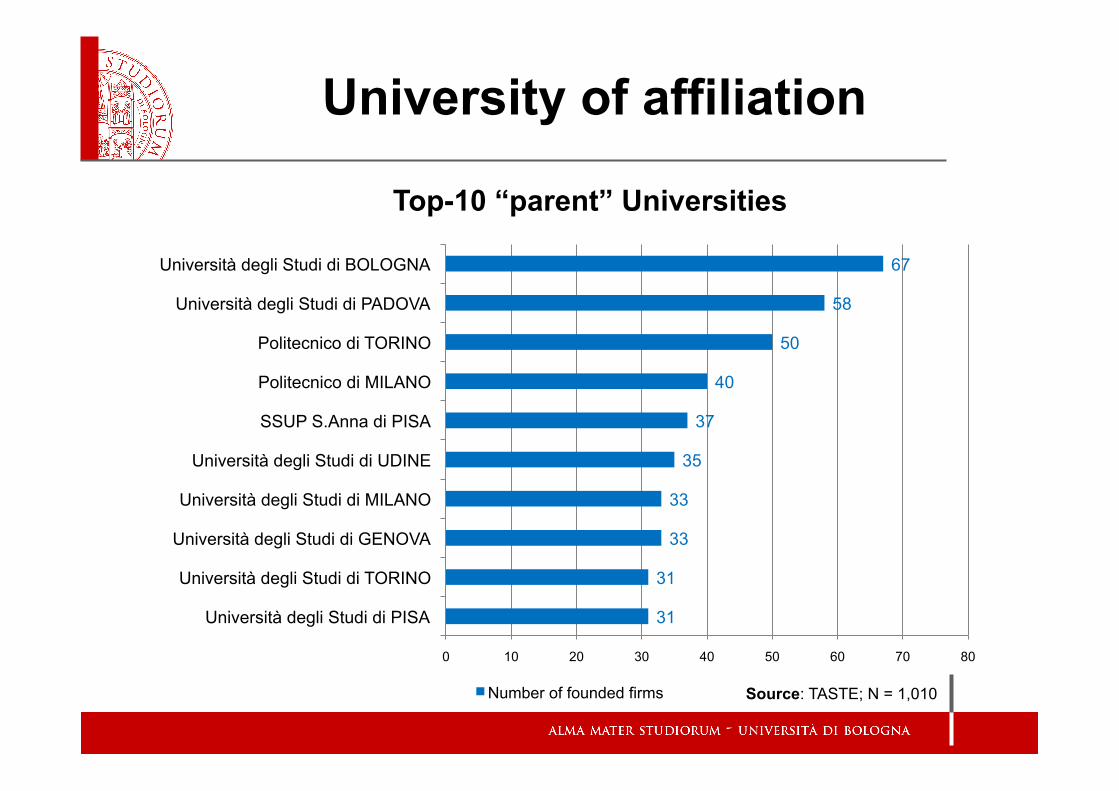
University of affiliation
31
31
33
33
35
37
40
50
58
67
0 10 20 30 40 50 60 70 80
Università degli Studi di PISA
Università degli Studi di TORINO
Università degli Studi di GENOVA
Università degli Studi di MILANO
Università degli Studi di UDINE
SSUP S.Anna di PISA
Politecnico di MILANO
Politecnico di TORINO
Università degli Studi di PADOVA
Università degli Studi di BOLOGNA
Number of founded firms
Top-10 “parent” Universities
Source: TASTE; N = 1,010
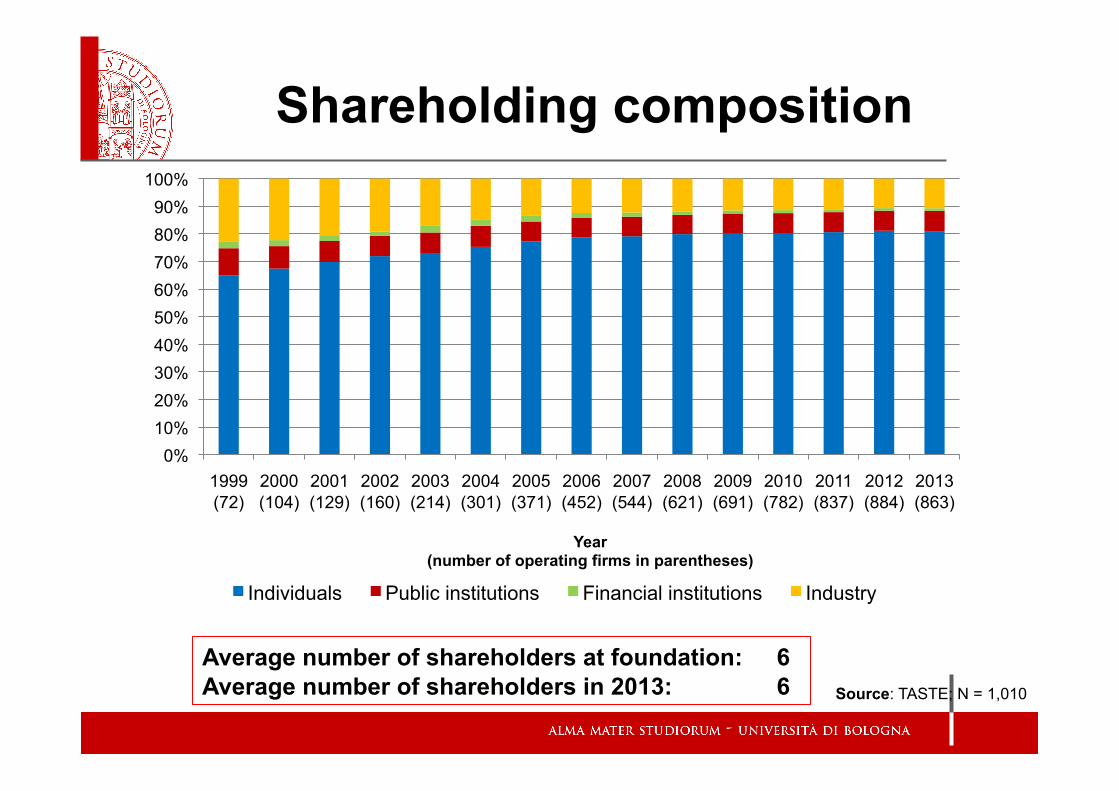
0% 10% 20% 30% 40% 50% 60% 70% 80% 90%
100%
1999 (72)
2000 (104)
2001 (129)
2002 (160)
2003 (214)
2004 (301)
2005 (371)
2006 (452)
2007 (544)
2008 (621)
2009 (691)
2010 (782)
2011 (837)
2012 (884)
2013 (863)
Year (number of operating firms in parentheses)
Individuals Public institutions Financial institutions Industry
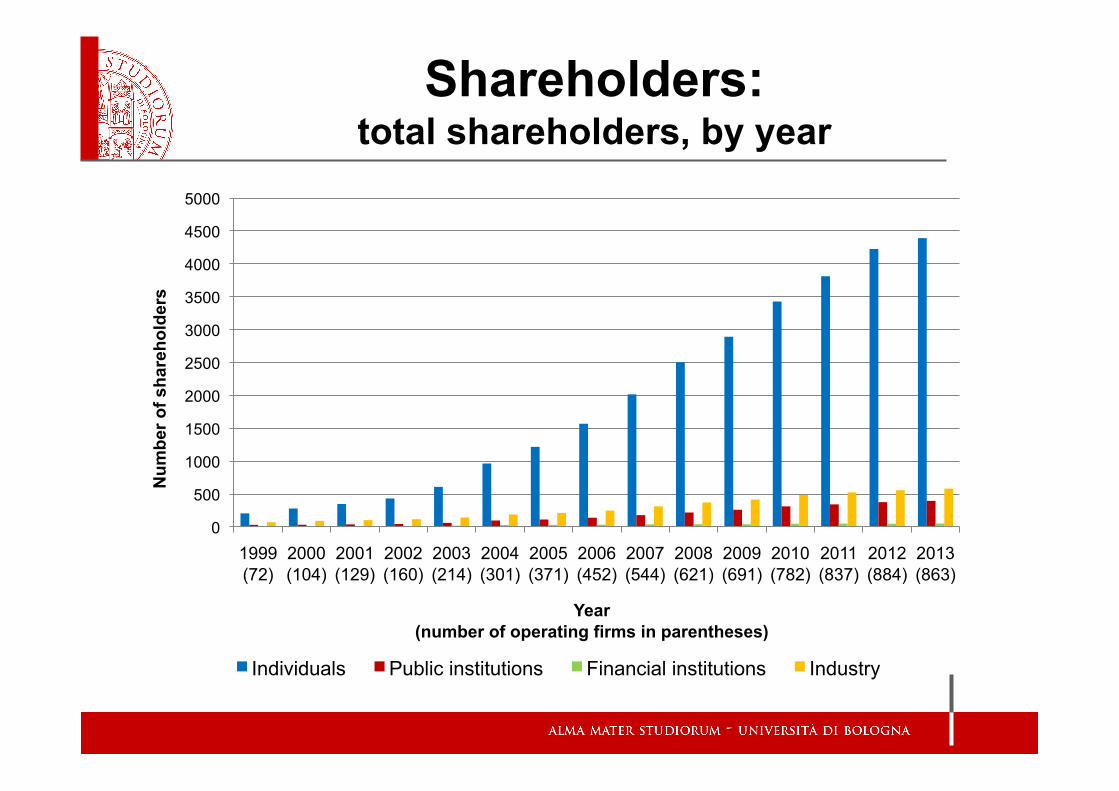
Shareholding composition
Average number of shareholders at foundation: 6 Average number of shareholders in 2013: 6 Source: TASTE; N = 1,010
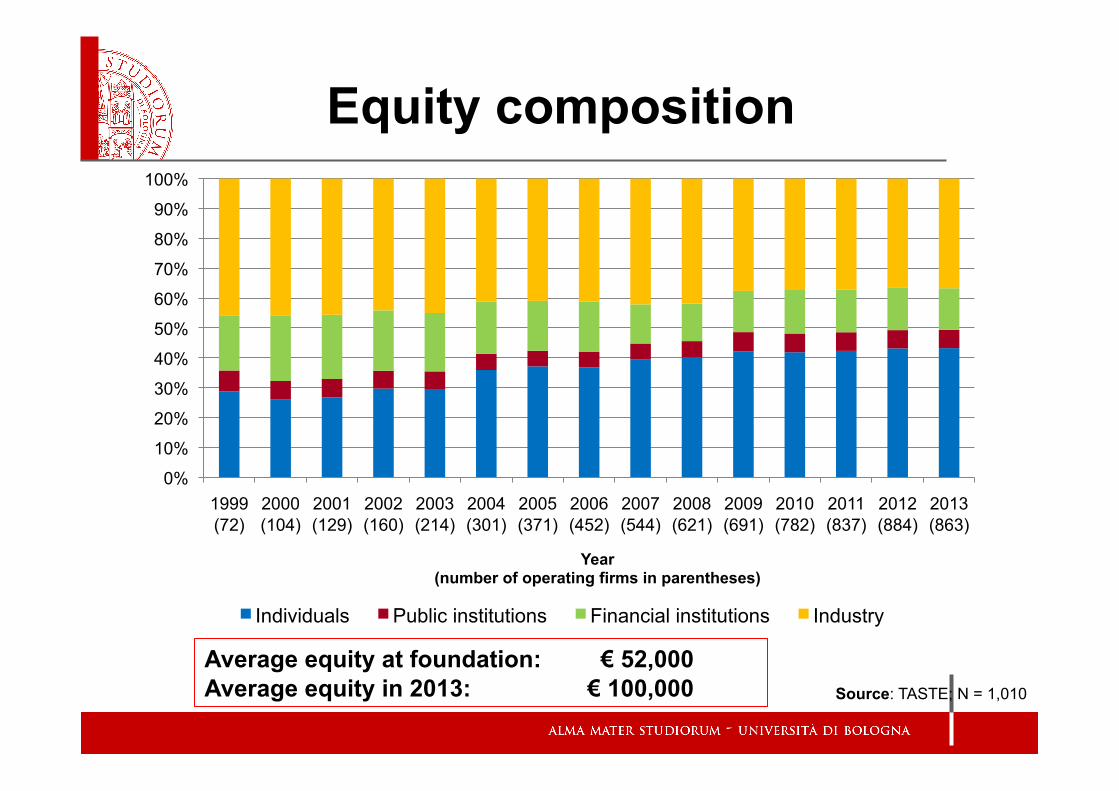
Equity composition
0%
10%
20%
30%
40%
50%
60%
70%
80%
90%
100%
1999 (72)
2000 (104)
2001 (129)
2002 (160)
2003 (214)
2004 (301)
2005 (371)
2006 (452)
2007 (544)
2008 (621)
2009 (691)
2010 (782)
2011 (837)
2012 (884)
2013 (863)
Year (number of operating firms in parentheses)
Individuals Public institutions Financial institutions Industry
Average equity at foundation: € 52,000 Average equity in 2013: € 100,000 Source: TASTE; N = 1,010
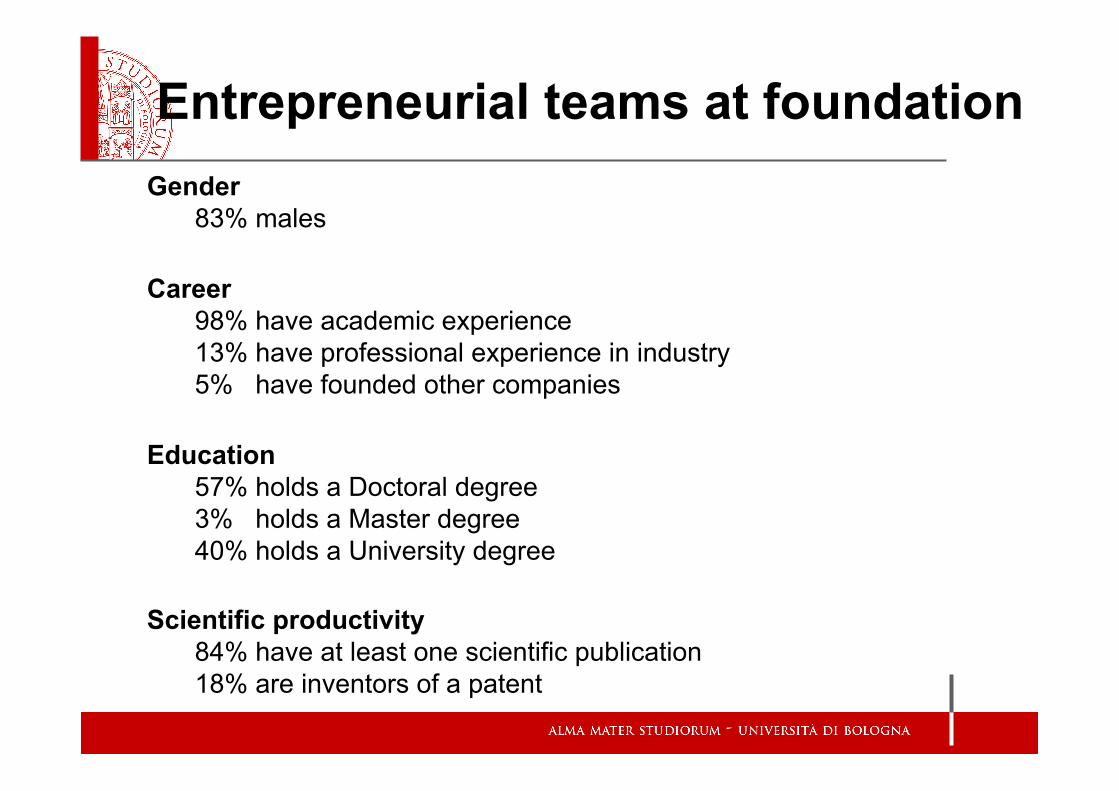
Entrepreneurial teams at foundation
Gender 83% males
Career 98% have academic experience 13% have professional experience in industry 5% have founded other companies
Education 57% holds a Doctoral degree 3% holds a Master degree 40% holds a University degree
Scientific productivity 84% have at least one scientific publication 18% are inventors of a patent
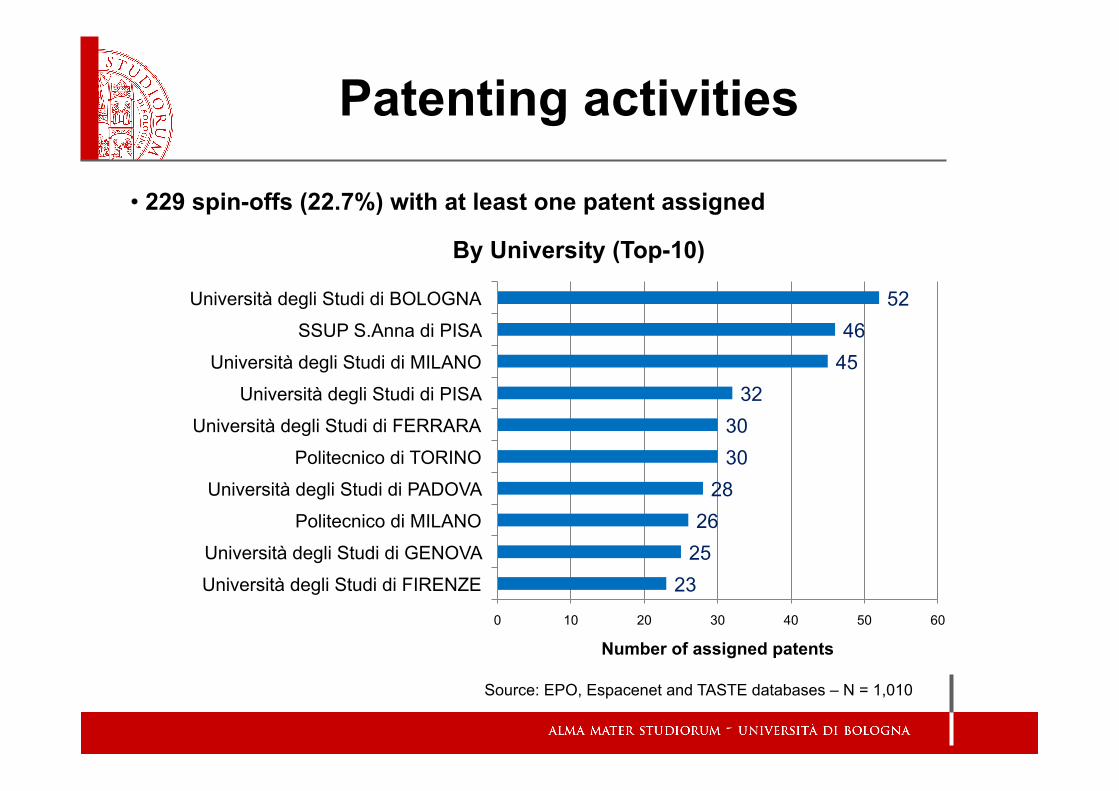
Patenting activities
• 229 spin-offs (22.7%) with at least one patent assigned
Source: EPO, Espacenet and TASTE databases – N = 1,010
By University (Top-10)
23 25 26
28 30 30
32 45 46
52
0 10 20 30 40 50 60
Università degli Studi di FIRENZE
Università degli Studi di GENOVA
Politecnico di MILANO
Università degli Studi di PADOVA
Politecnico di TORINO
Università degli Studi di FERRARA
Università degli Studi di PISA
Università degli Studi di MILANO
SSUP S.Anna di PISA
Università degli Studi di BOLOGNA
Number of assigned patents
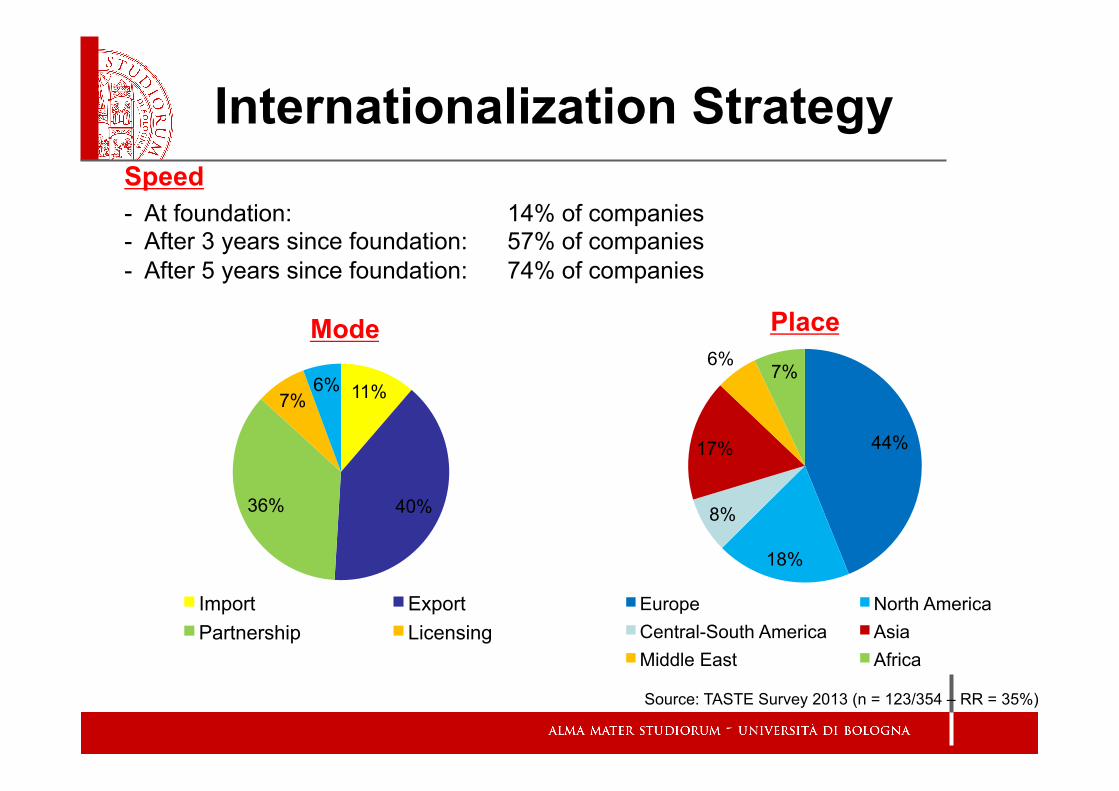
Internationalization Strategy Speed - At foundation: 14% of companies - After 3 years since foundation: 57% of companies - After 5 years since foundation: 74% of companies
Mode
11%
40% 36%
7% 6%
Import Export Partnership Licensing
Place
44%
18%
8%
17%
6% 7%
Europe North America Central-South America Asia Middle East Africa
Source: TASTE Survey 2013 (n = 123/354 – RR = 35%)
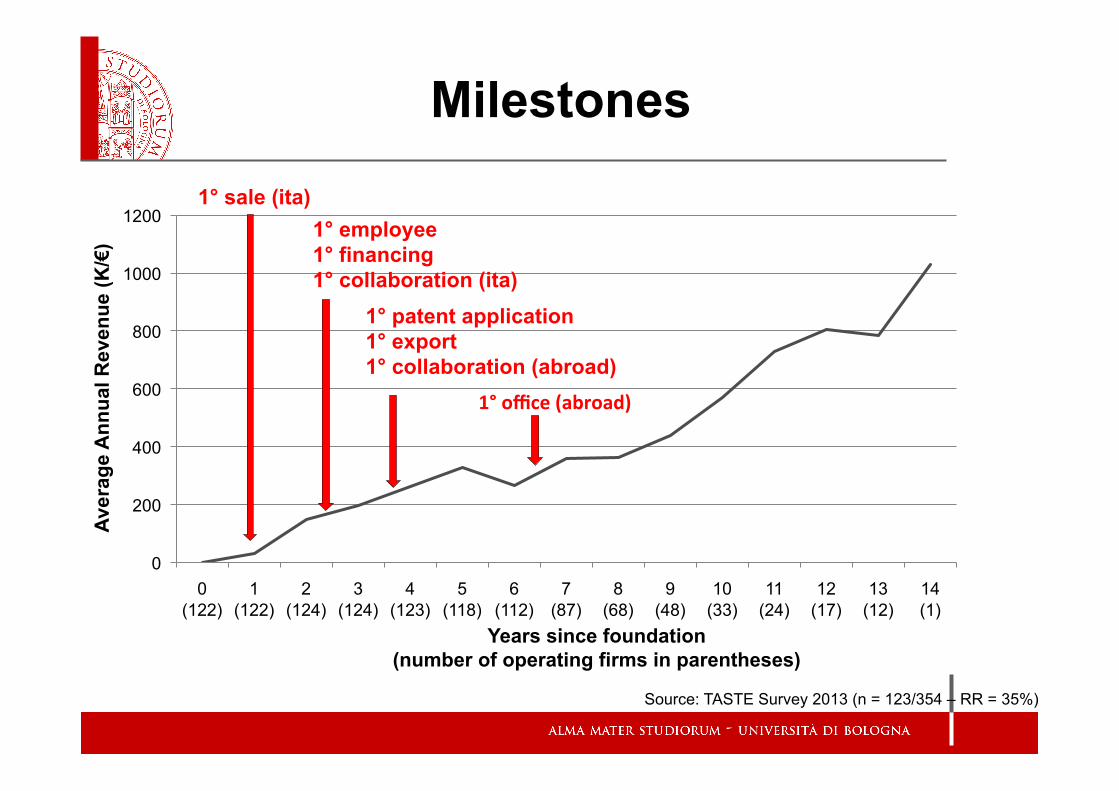
0
200
400
600
800
1000
1200
0 (122)
1 (122)
2 (124)
3 (124)
4 (123)
5 (118)
6 (112)
7 (87)
8 (68)
9 (48)
10 (33)
11 (24)
12 (17)
13 (12)
14 (1)
Aver
age
Ann
ual R
even
ue (K
/€)
Years since foundation (number of operating firms in parentheses)
1° office (abroad)
1° sale (ita) 1° employee 1° financing 1° collaboration (ita)
1° patent application 1° export 1° collaboration (abroad)
Milestones
Source: TASTE Survey 2013 (n = 123/354 – RR = 35%)
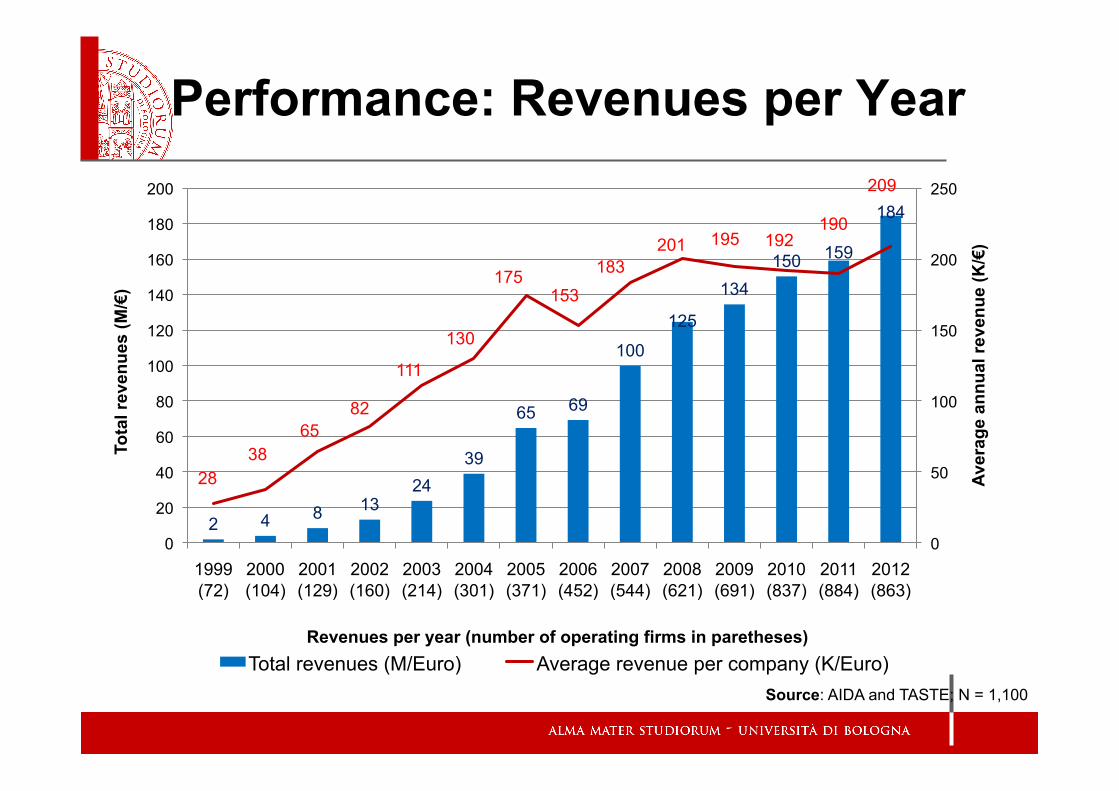
Performance: Revenues per Year
2 4 8 13 24
39
65 69
100
125
134 150 159
184
28 38
65 82
111
130
175 153
183 201 195 192
190
209
0
50
100
150
200
250
0
20
40
60
80
100
120
140
160
180
200
1999 (72)
2000 (104)
2001 (129)
2002 (160)
2003 (214)
2004 (301)
2005 (371)
2006 (452)
2007 (544)
2008 (621)
2009 (691)
2010 (837)
2011 (884)
2012 (863)
Aver
age
annu
al re
venu
e (K
/€)
Tota
l rev
enue
s (M
/€)
Revenues per year (number of operating firms in paretheses) Total revenues (M/Euro) Average revenue per company (K/Euro)
Source: AIDA and TASTE; N = 1,100
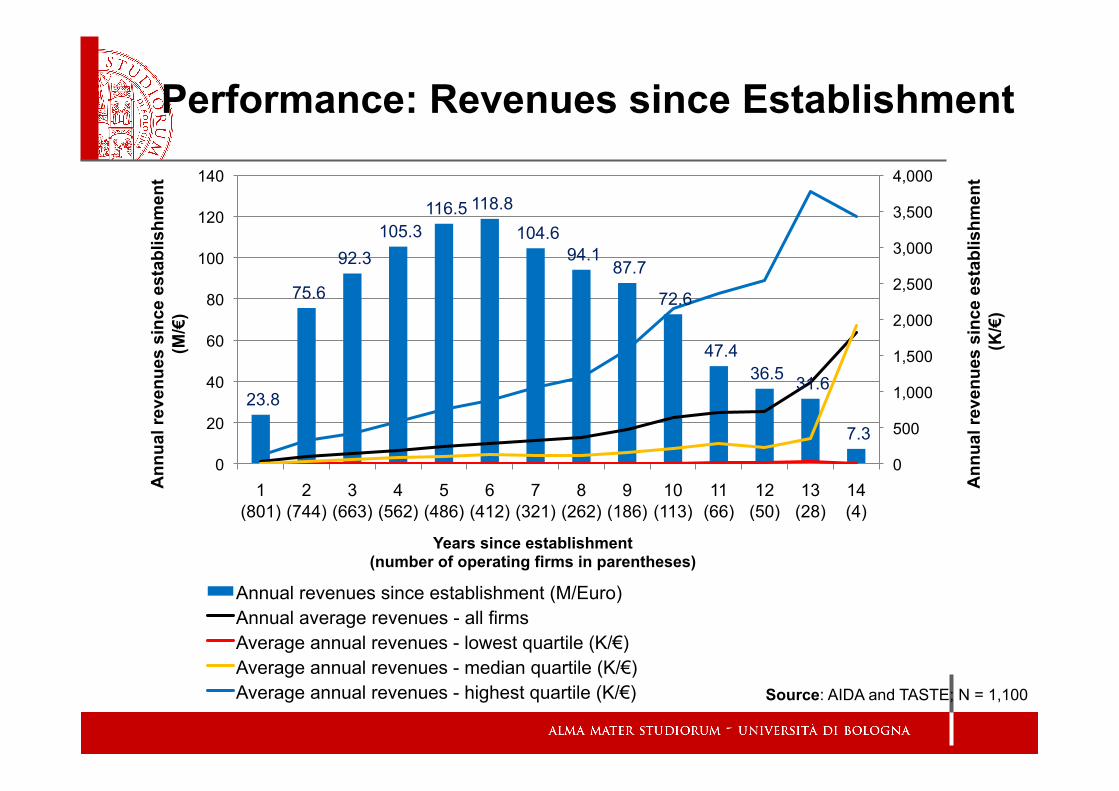
23.8
75.6
92.3 105.3
116.5 118.8
104.6 94.1
87.7
72.6
47.4 36.5 31.6
7.3
0
500
1,000
1,500
2,000
2,500
3,000
3,500
4,000
0
20
40
60
80
100
120
140
1 (801)
2 (744)
3 (663)
4 (562)
5 (486)
6 (412)
7 (321)
8 (262)
9 (186)
10 (113)
11 (66)
12 (50)
13 (28)
14 (4)
Ann
ual r
even
ues
sinc
e es
tabl
ishm
ent
(K/€
)
Ann
ual r
even
ues
sinc
e es
tabl
ishm
ent
(M/€
)
Years since establishment (number of operating firms in parentheses)
Annual revenues since establishment (M/Euro) Annual average revenues - all firms Average annual revenues - lowest quartile (K/€) Average annual revenues - median quartile (K/€) Average annual revenues - highest quartile (K/€)
Performance: Revenues since Establishment
Source: AIDA and TASTE; N = 1,100
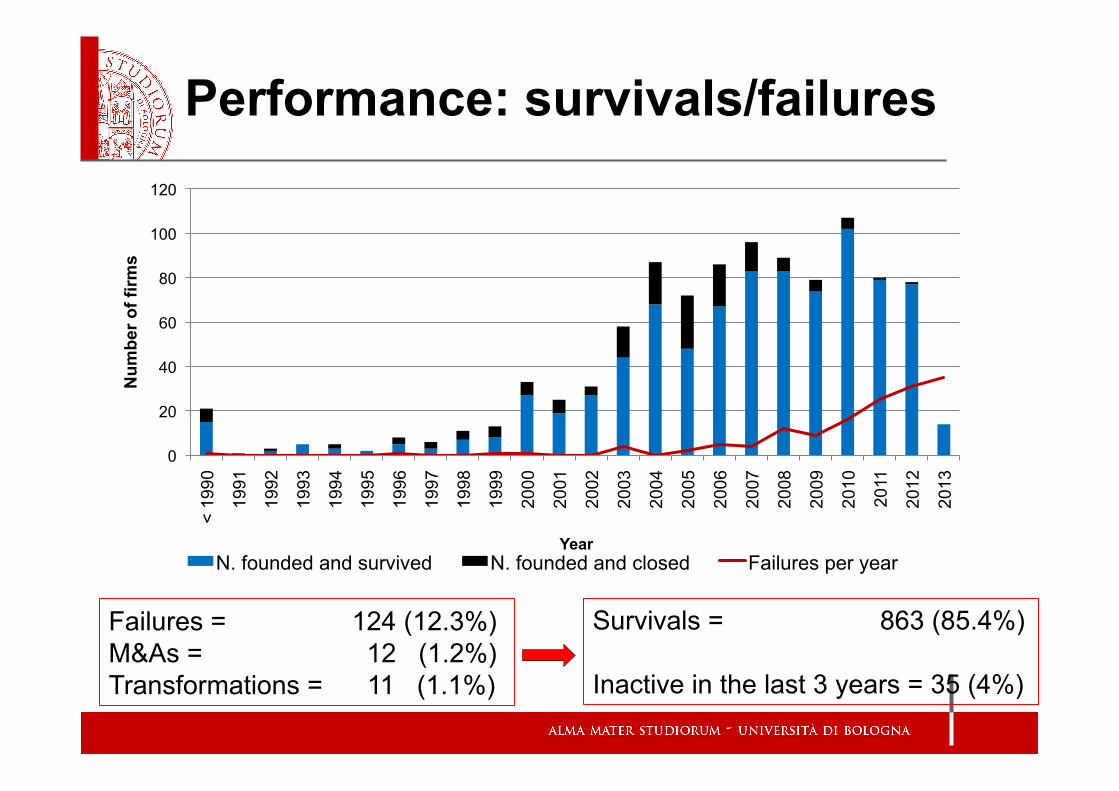
Performance: survivals/failures
Failures = 124 (12.3%) M&As = 12 (1.2%) Transformations = 11 (1.1%)
Survivals = 863 (85.4%)
Inactive in the last 3 years = 35 (4%)
0
20
40
60
80
100
120 <
1990
1991
1992
1993
1994
1995
1996
1997
1998
1999
2000
2001
2002
2003
2004
2005
2006
2007
2008
2009
2010
2011
2012
2013
Num
ber o
f firm
s
Year N. founded and survived N. founded and closed Failures per year
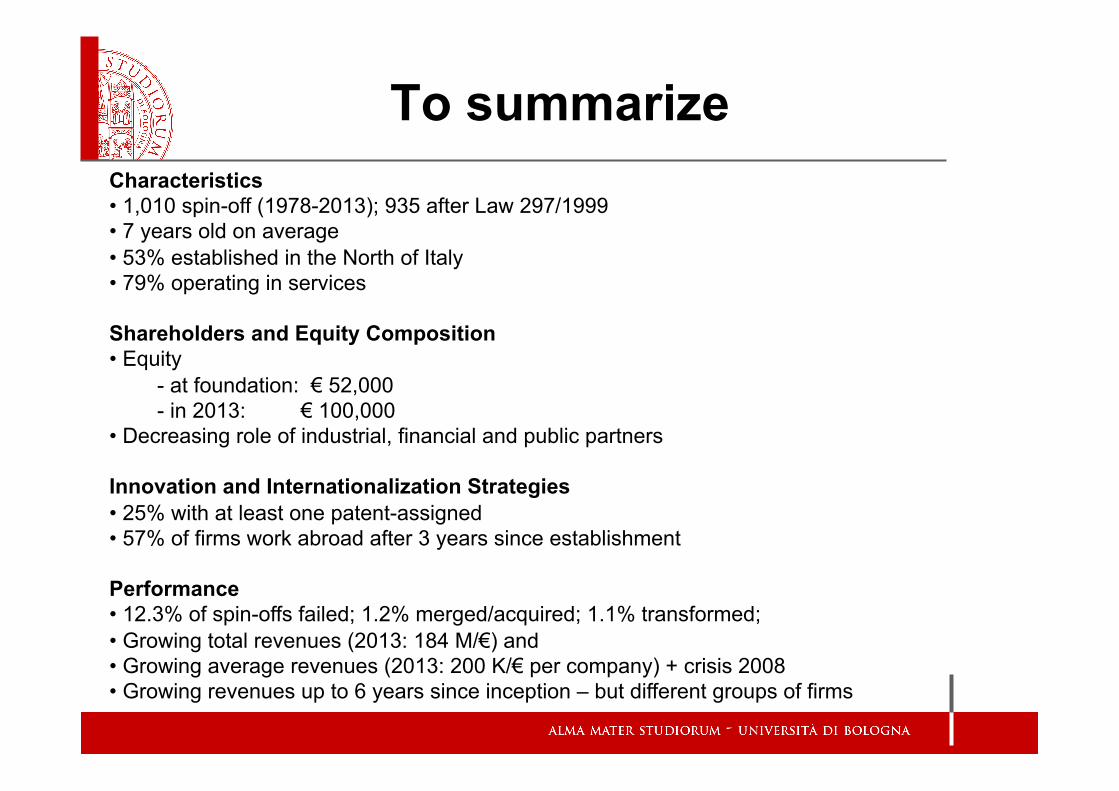
To summarize Characteristics • 1,010 spin-off (1978-2013); 935 after Law 297/1999 • 7 years old on average • 53% established in the North of Italy • 79% operating in services
Shareholders and Equity Composition • Equity
- at foundation: € 52,000 - in 2013: € 100,000
• Decreasing role of industrial, financial and public partners
Innovation and Internationalization Strategies • 25% with at least one patent-assigned • 57% of firms work abroad after 3 years since establishment
Performance • 12.3% of spin-offs failed; 1.2% merged/acquired; 1.1% transformed; • Growing total revenues (2013: 184 M/€) and • Growing average revenues (2013: 200 K/€ per company) + crisis 2008 • Growing revenues up to 6 years since inception – but different groups of firms
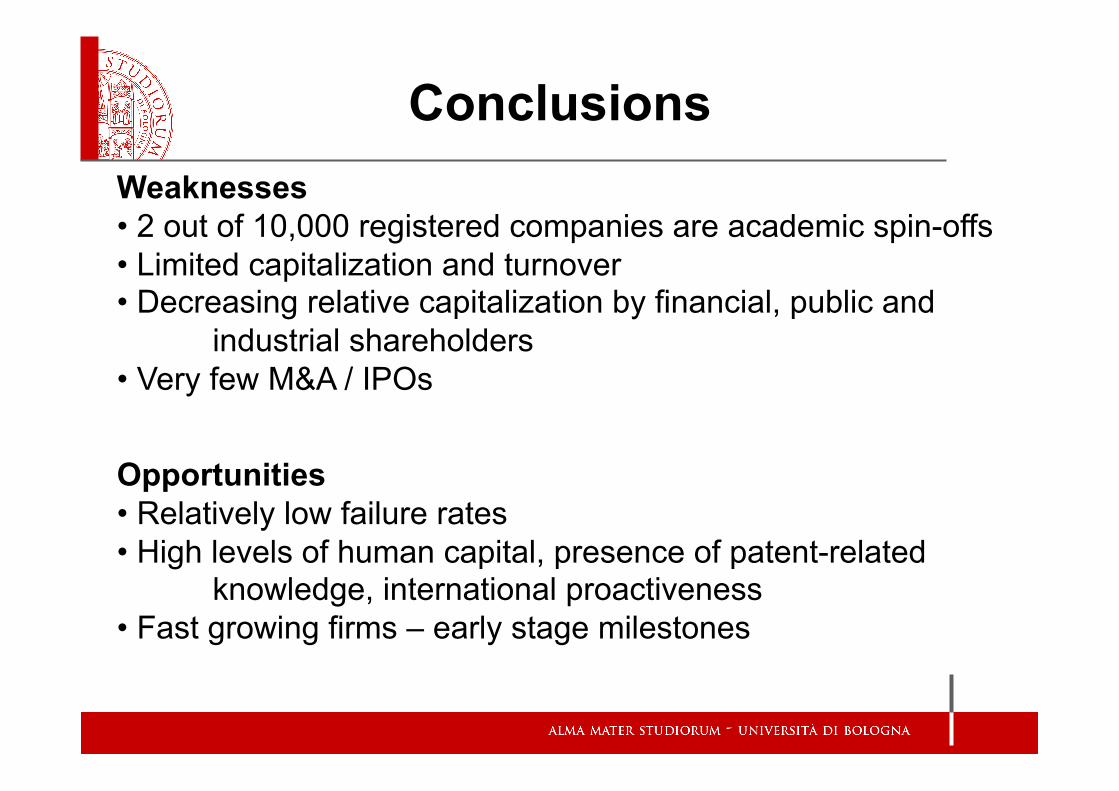
Conclusions Weaknesses • 2 out of 10,000 registered companies are academic spin-offs • Limited capitalization and turnover • Decreasing relative capitalization by financial, public and
industrial shareholders • Very few M&A / IPOs
Opportunities • Relatively low failure rates • High levels of human capital, presence of patent-related
knowledge, international proactiveness • Fast growing firms – early stage milestones
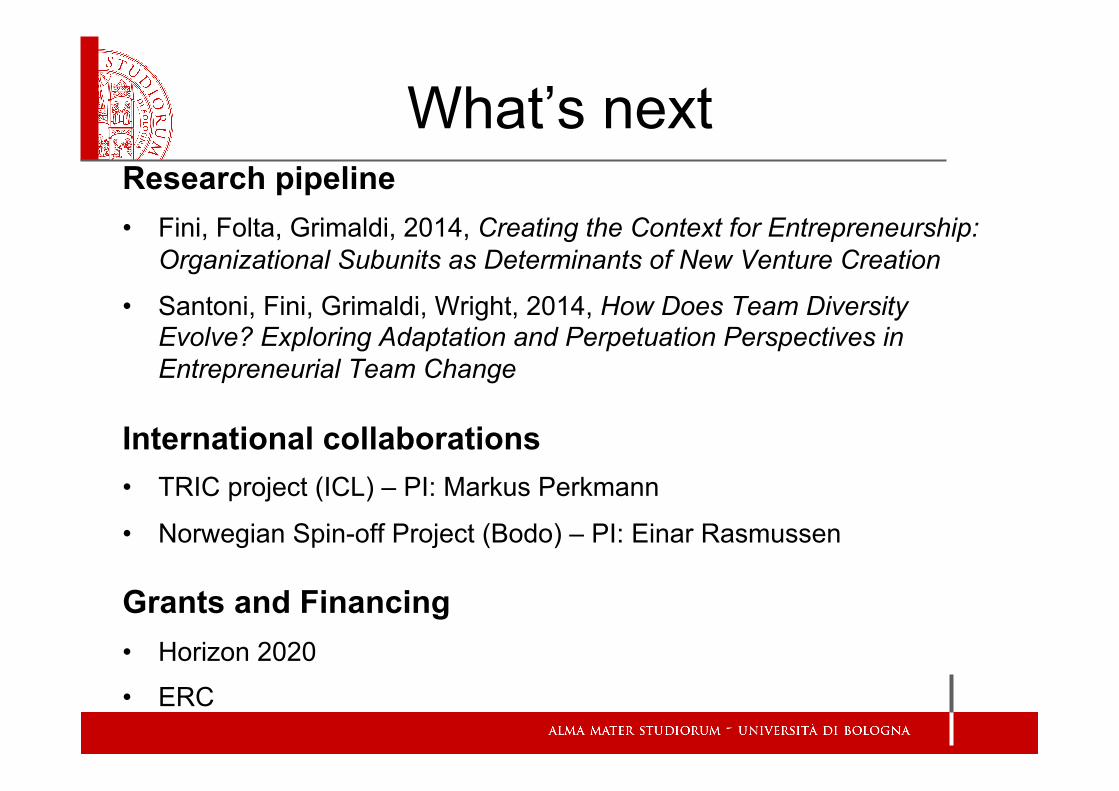
What’s next Research pipeline • Fini, Folta, Grimaldi, 2014, Creating the Context for Entrepreneurship:
Organizational Subunits as Determinants of New Venture Creation
• Santoni, Fini, Grimaldi, Wright, 2014, How Does Team Diversity Evolve? Exploring Adaptation and Perpetuation Perspectives in Entrepreneurial Team Change
International collaborations • TRIC project (ICL) – PI: Markus Perkmann
• Norwegian Spin-off Project (Bodo) – PI: Einar Rasmussen
Grants and Financing • Horizon 2020
• ERC
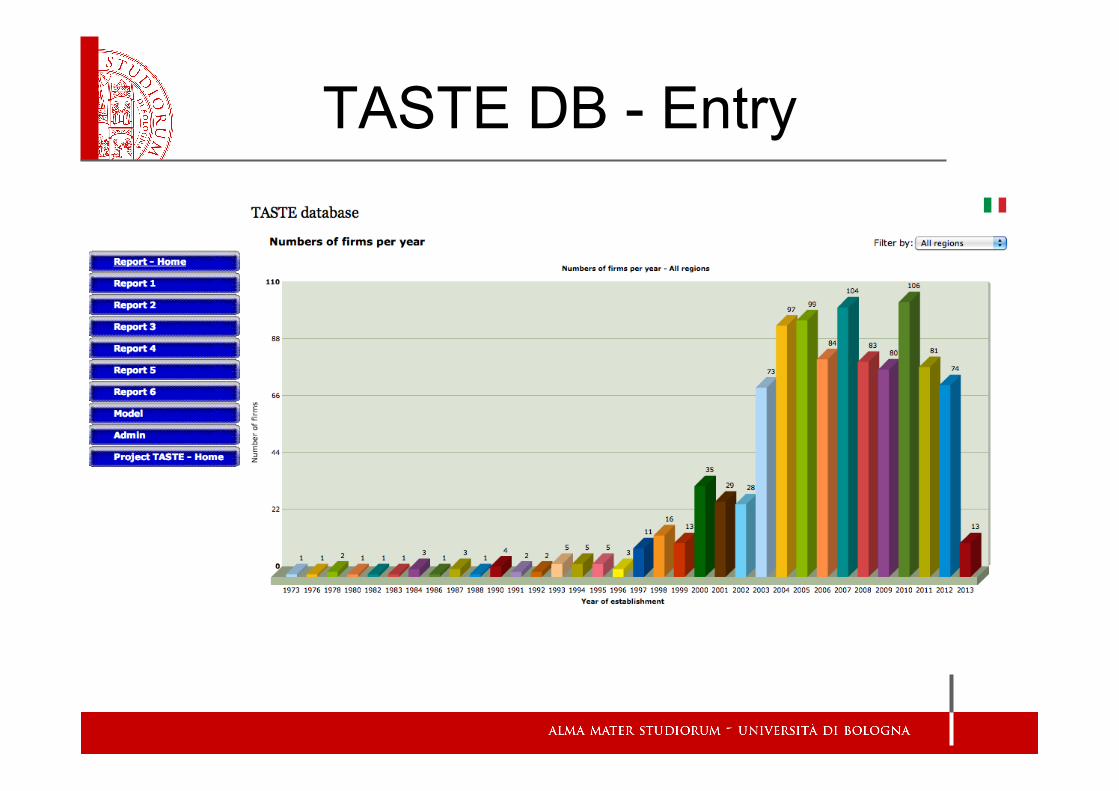
TASTE DB - Entry
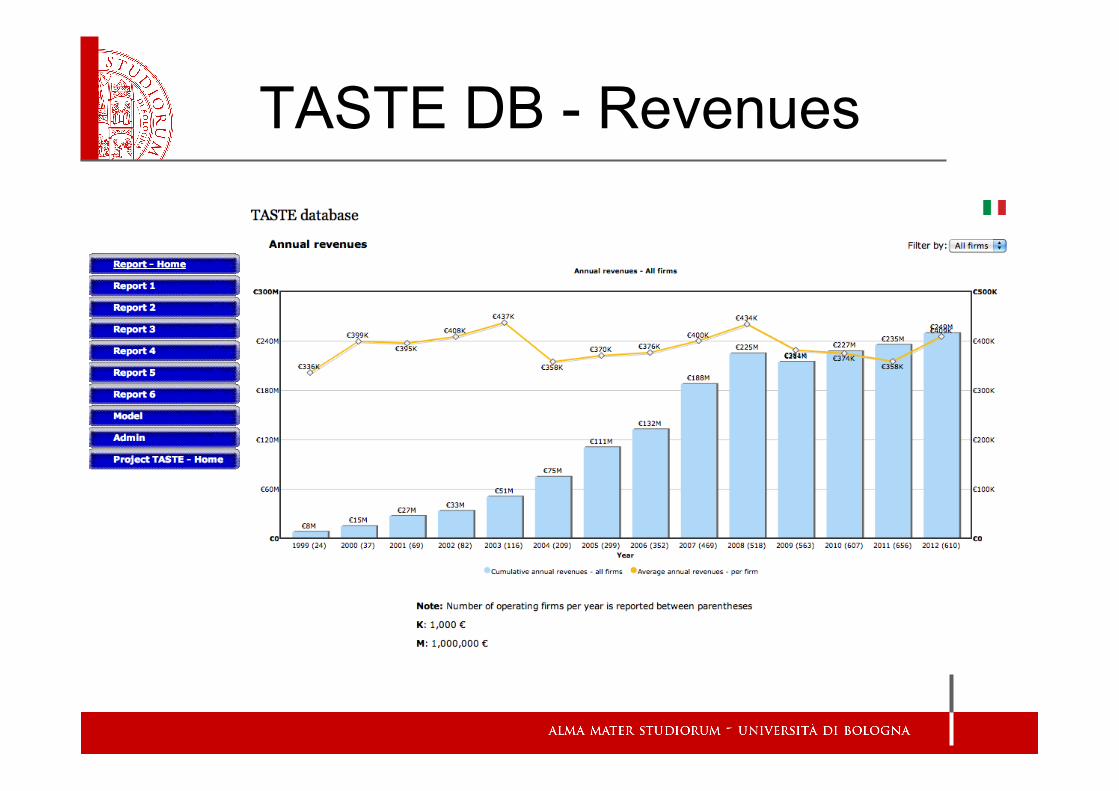
TASTE DB - Revenues
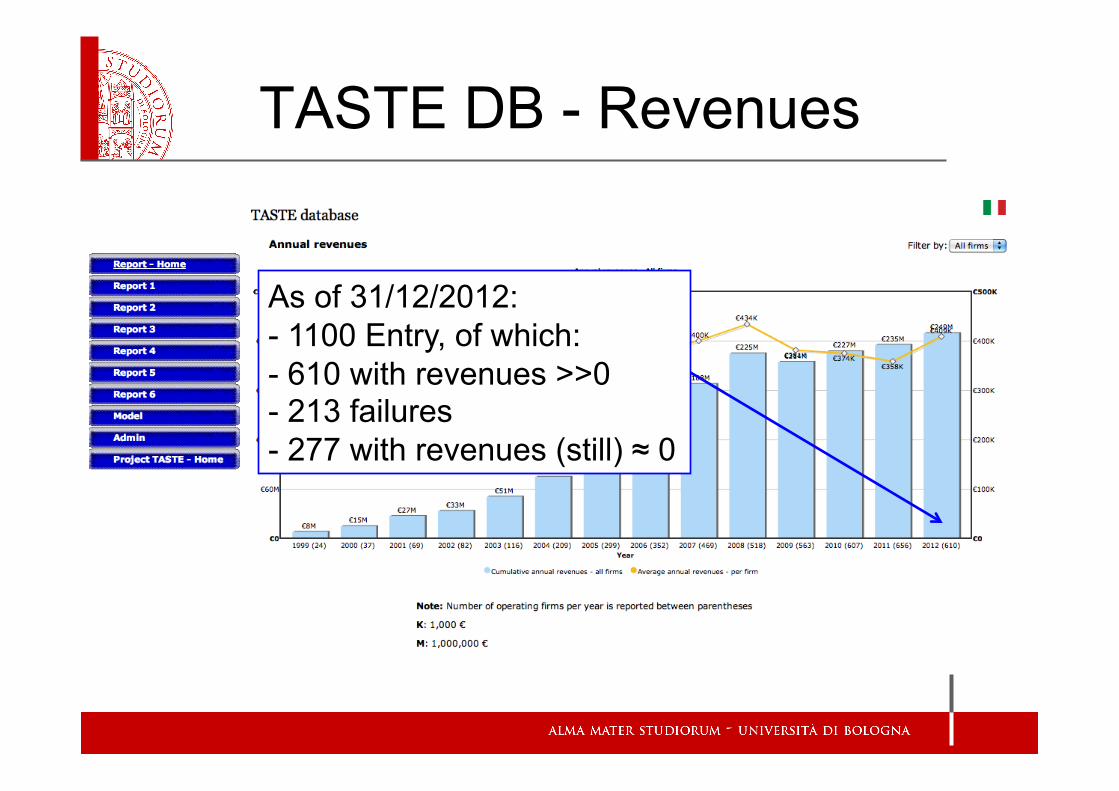
TASTE DB - Revenues
As of 31/12/2012: - 1100 Entry, of which: - 610 with revenues >>0 - 213 failures - 277 with revenues (still) ≈ 0
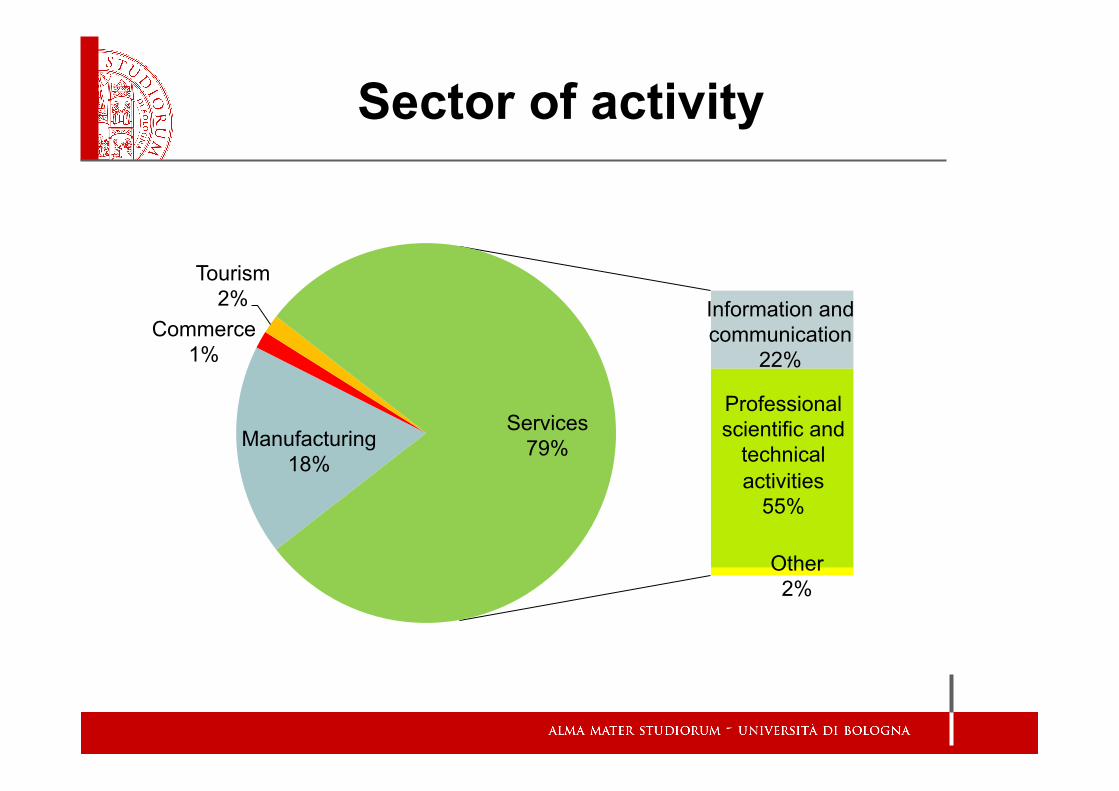
Manufacturing 18%
Commerce 1%
Tourism 2% Information and
communication 22%
Professional scientific and
technical activities
55%
Other 2%
Services 79%
Sector of activity
0
500
1000
1500
2000
2500
3000
3500
4000
4500
5000
1999 (72)
2000 (104)
2001 (129)
2002 (160)
2003 (214)
2004 (301)
2005 (371)
2006 (452)
2007 (544)
2008 (621)
2009 (691)
2010 (782)
2011 (837)
2012 (884)
2013 (863)
Num
ber o
f sha
reho
lder
s
Year (number of operating firms in parentheses)
Individuals Public institutions Financial institutions Industry
Shareholders: total shareholders, by year
0
500
1000
1500
2000
2500
3000
3500
4000
4500
5000
1999 (72)
2000 (104)
2001 (129)
2002 (160)
2003 (214)
2004 (301)
2005 (371)
2006 (452)
2007 (544)
2008 (621)
2009 (691)
2010 (782)
2011 (837)
2012 (884)
2013 (863)
Num
ber o
f ind
ivid
uals
Year (number of operating firms in parentheses)
Academic entrepreneurs Non-academic entrepreneurs
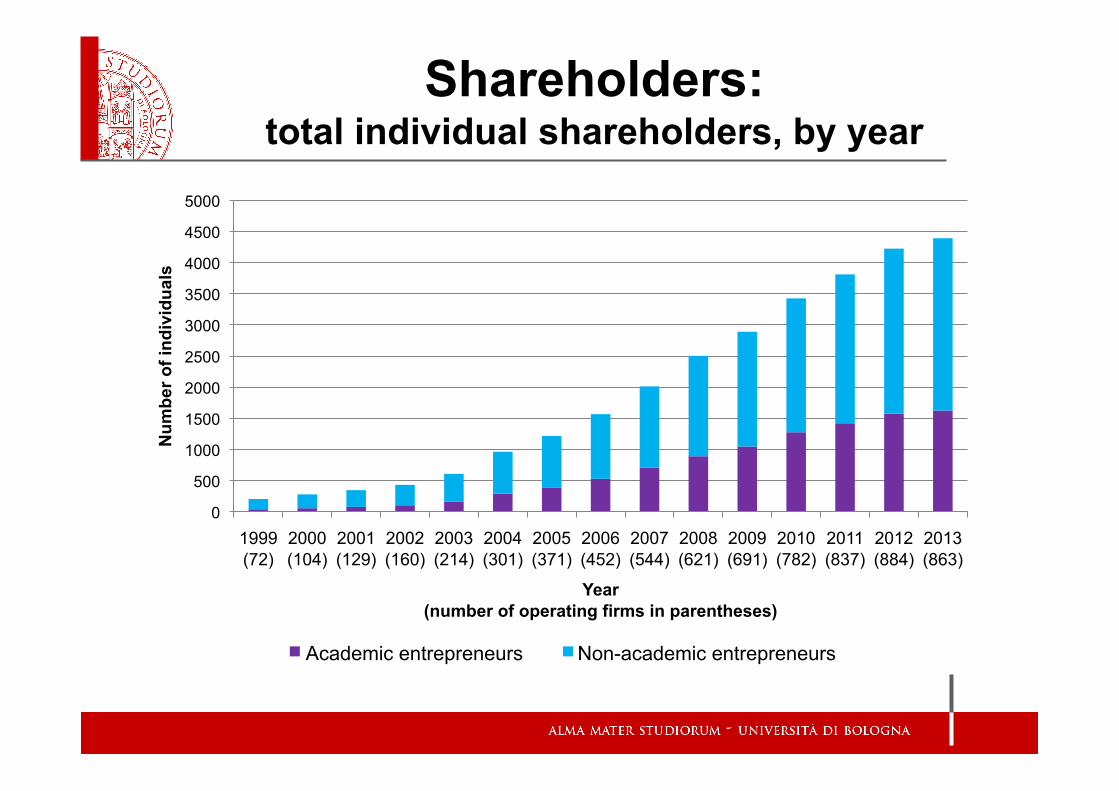
Shareholders: total individual shareholders, by year
0
5
10
15
20
25
30 19
99
2000
2001
2002
2003
2004
2005
2006
2007
2008
2009
2010
2011
2012
2013
Num
ber o
f par
tner
s
Venture Capitalist Bank Financial bodies
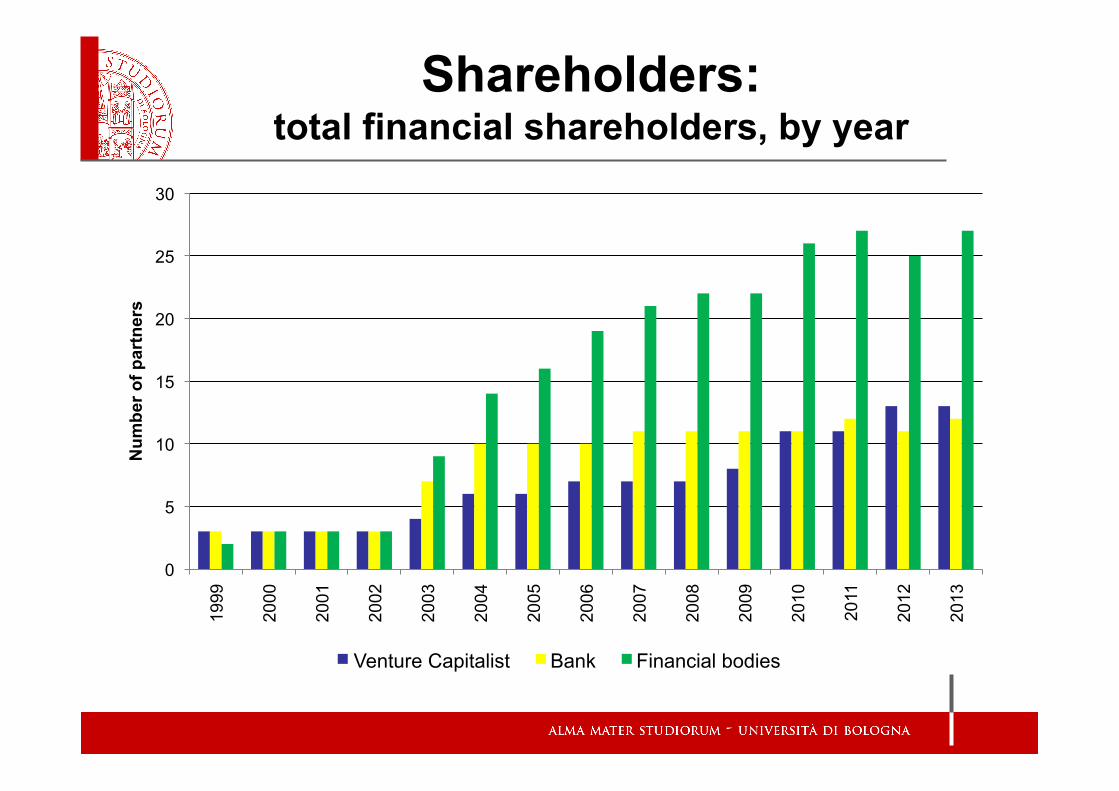
Shareholders: total financial shareholders, by year
0
50
100
150
200
250
300
350
1999
2000
2001
2002
2003
2004
2005
2006
2007
2008
2009
2010
2011
2012
2013
Num
ber o
f par
tner
s
Incubator Science/Tech Park Public Body Research Body University Public Research Centers
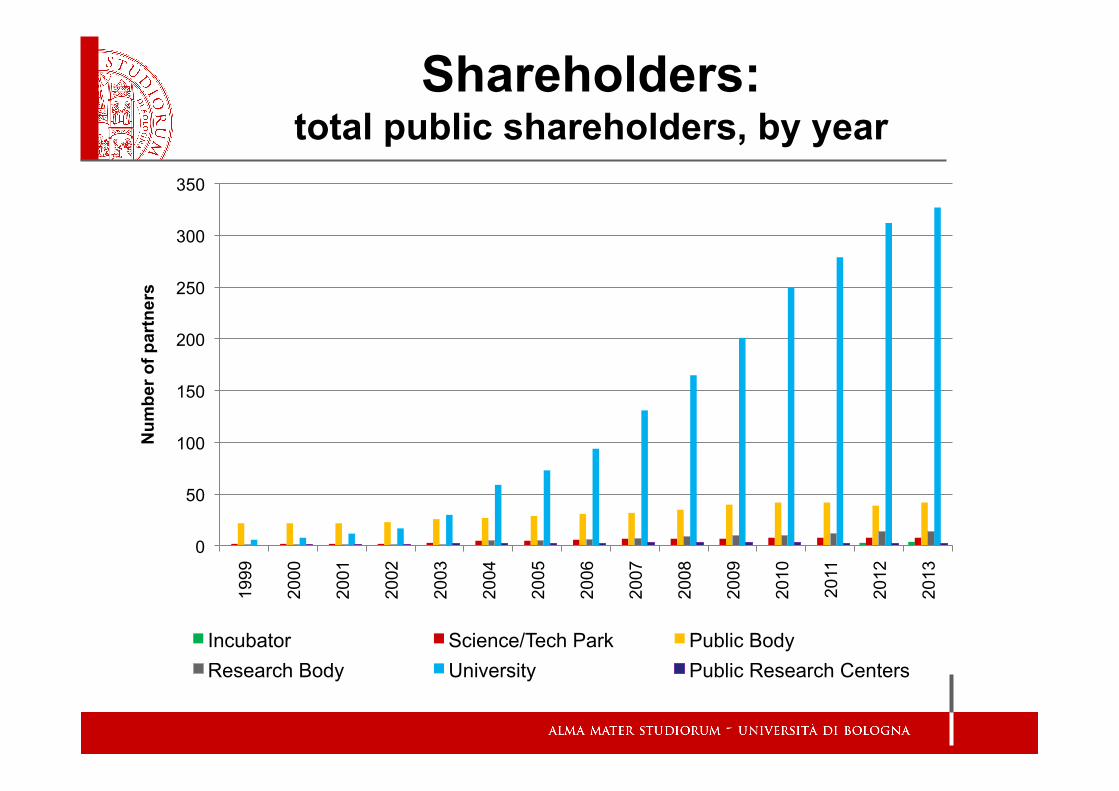
Shareholders: total public shareholders, by year
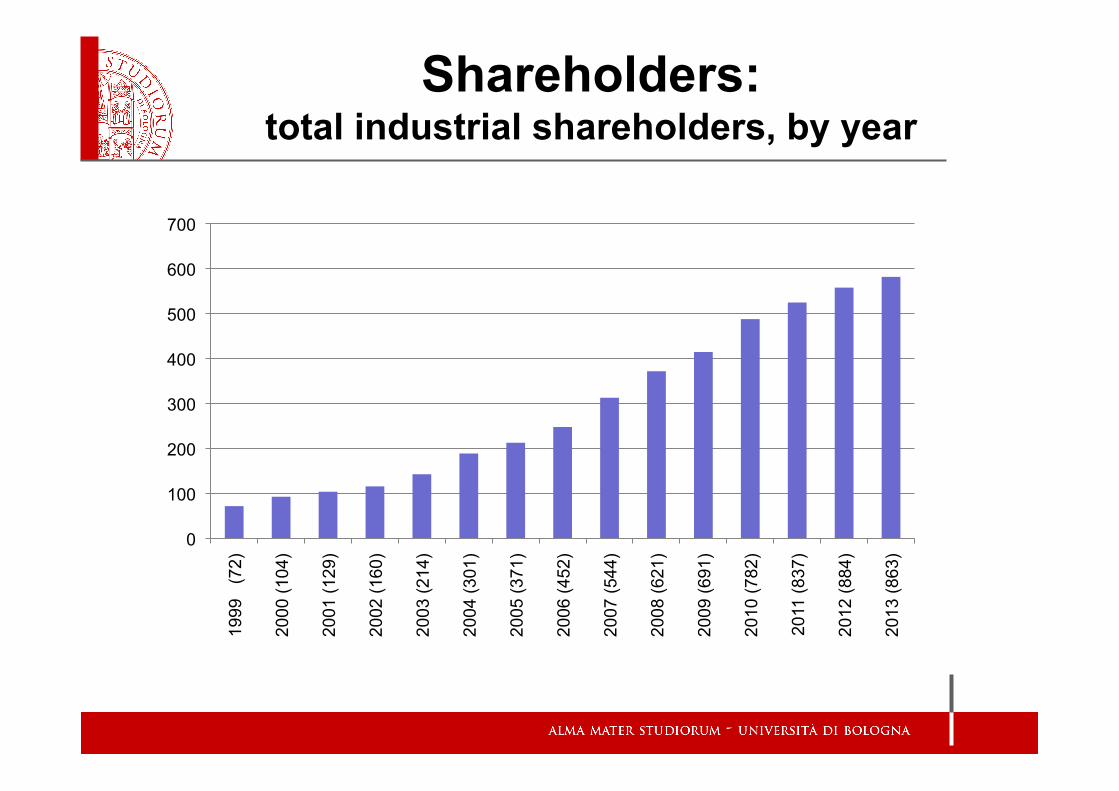
Shareholders: total industrial shareholders, by year
0
100
200
300
400
500
600
700 19
99
(72)
2000
(104
)
2001
(129
)
2002
(160
)
2003
(214
)
2004
(301
)
2005
(371
)
2006
(452
)
2007
(544
)
2008
(621
)
2009
(691
)
2010
(782
)
2011
(837
)
2012
(884
)
2013
(863
)
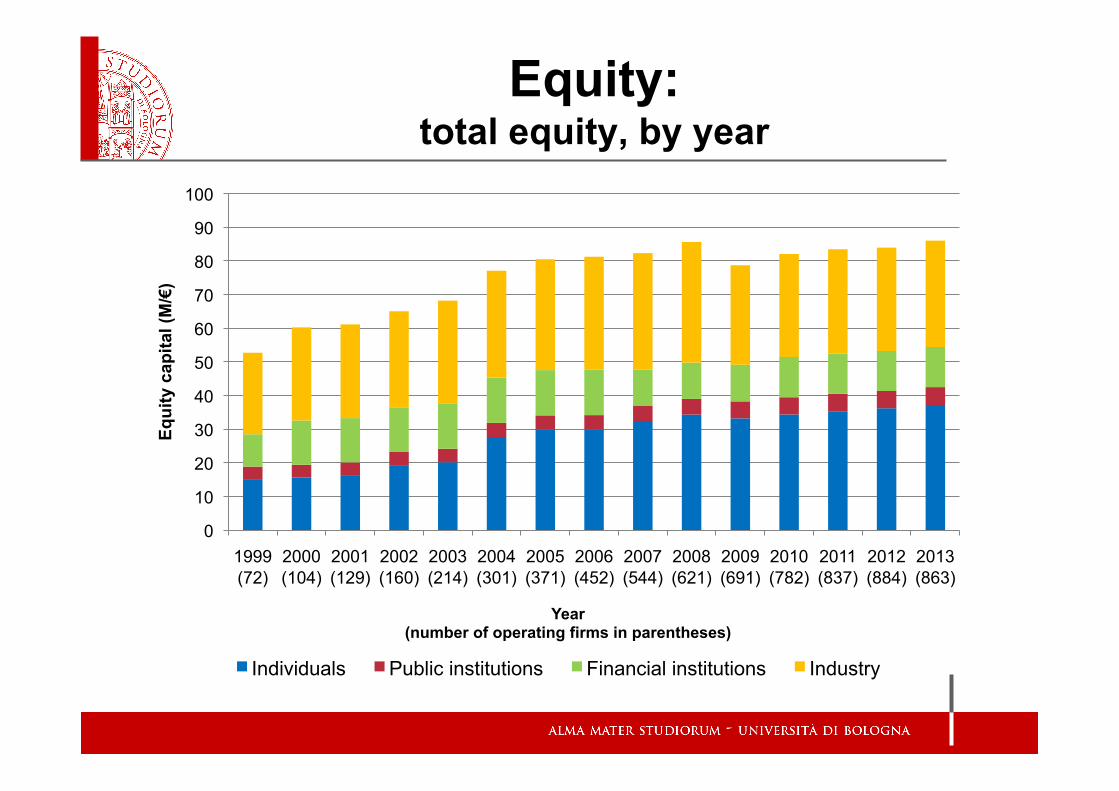
Equity: total equity, by year
0
10
20
30
40
50
60
70
80
90
100
1999 (72)
2000 (104)
2001 (129)
2002 (160)
2003 (214)
2004 (301)
2005 (371)
2006 (452)
2007 (544)
2008 (621)
2009 (691)
2010 (782)
2011 (837)
2012 (884)
2013 (863)
Equi
ty c
apita
l (M
/€)
Year (number of operating firms in parentheses)
Individuals Public institutions Financial institutions Industry
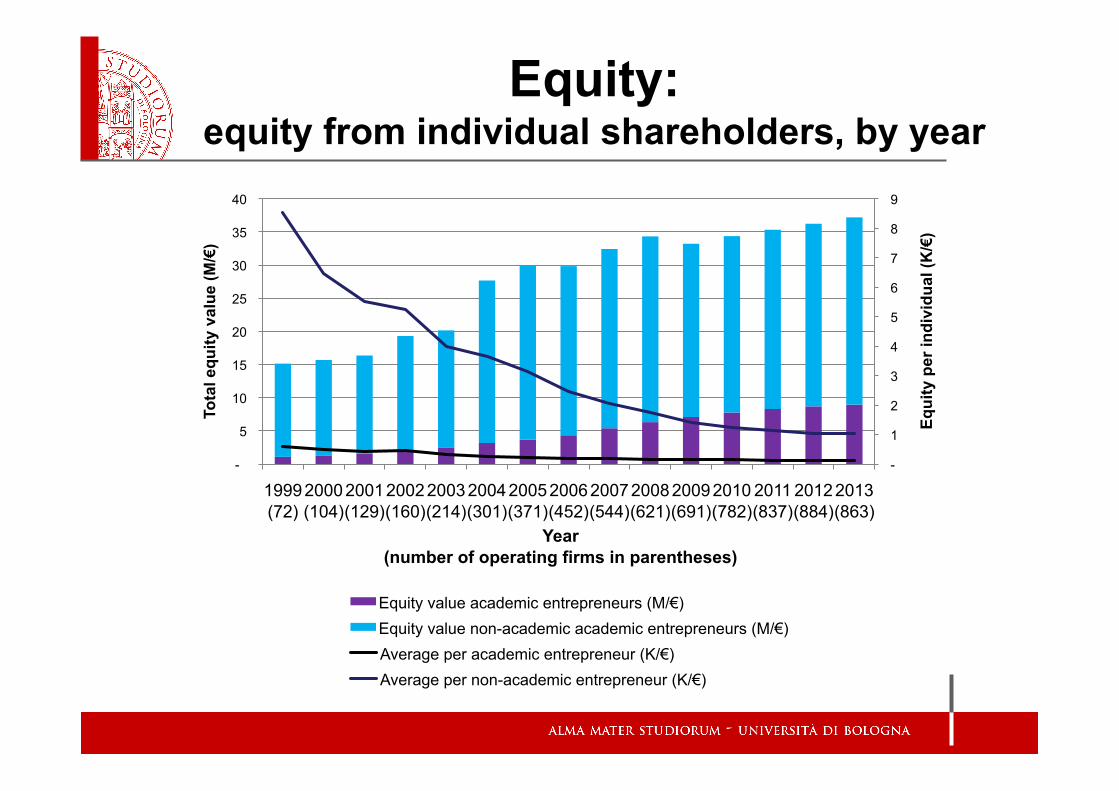
Equity: equity from individual shareholders, by year
-
1
2
3
4
5
6
7
8
9
-
5
10
15
20
25
30
35
40
1999 (72)
2000 (104)
2001 (129)
2002 (160)
2003 (214)
2004 (301)
2005 (371)
2006 (452)
2007 (544)
2008 (621)
2009 (691)
2010 (782)
2011 (837)
2012 (884)
2013 (863)
Equi
ty p
er in
divi
dual
(K/€
)
Tota
l equ
ity v
alue
(M/€
)
Year (number of operating firms in parentheses)
Equity value academic entrepreneurs (M/€) Equity value non-academic academic entrepreneurs (M/€) Average per academic entrepreneur (K/€) Average per non-academic entrepreneur (K/€)
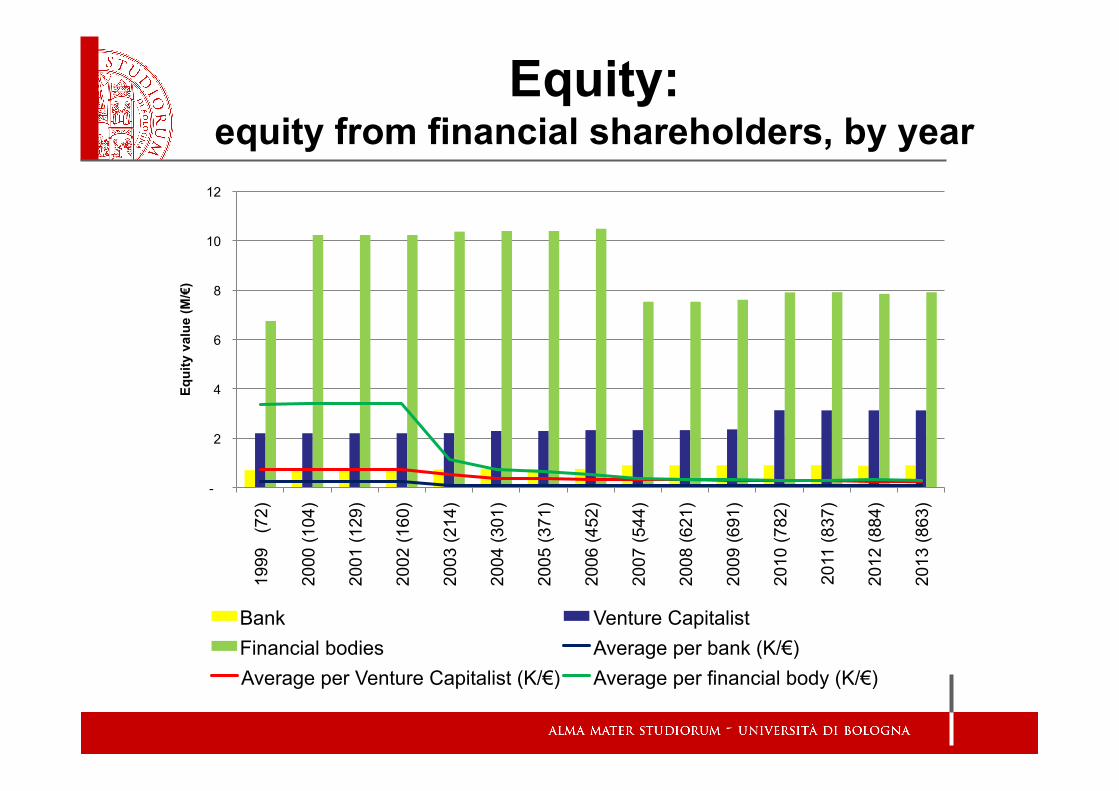
Equity: equity from financial shareholders, by year
-
2
4
6
8
10
12
1999
(7
2)
2000
(104
)
2001
(129
)
2002
(160
)
2003
(214
)
2004
(301
)
2005
(371
)
2006
(452
)
2007
(544
)
2008
(621
)
2009
(691
)
2010
(782
)
2011
(837
)
2012
(884
)
2013
(863
)
Equi
ty v
alue
(M/€
)
Bank Venture Capitalist Financial bodies Average per bank (K/€) Average per Venture Capitalist (K/€) Average per financial body (K/€)
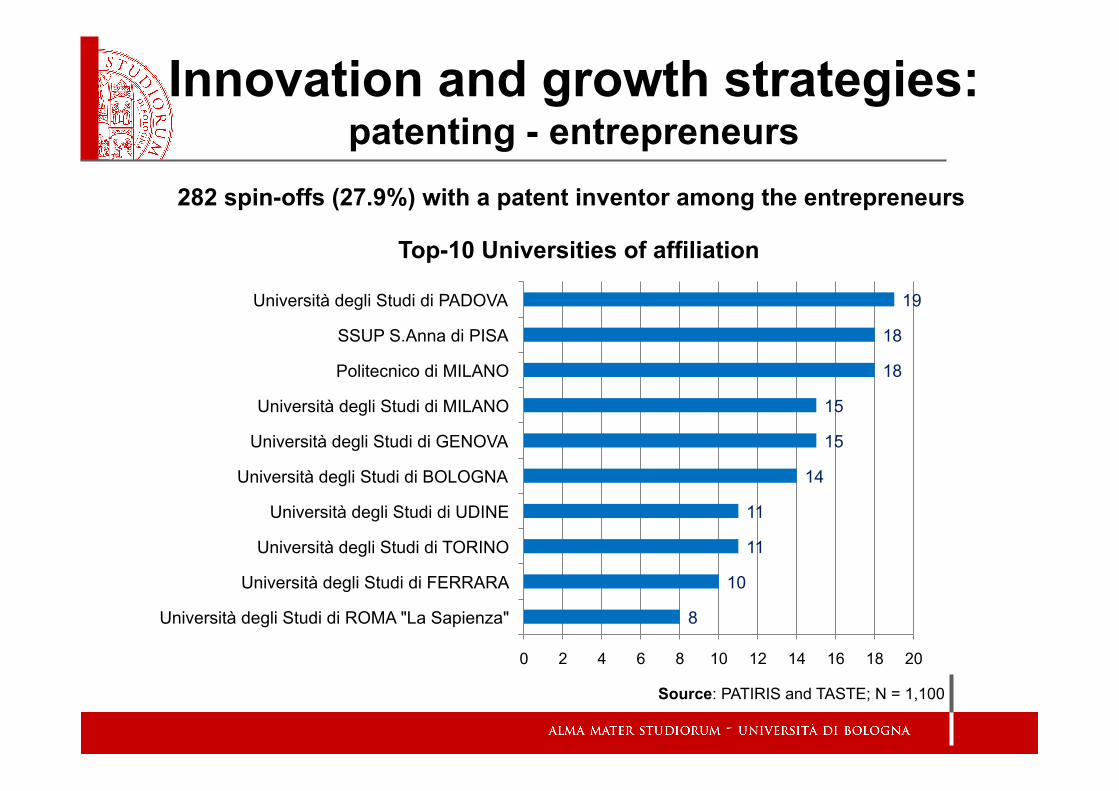
Innovation and growth strategies: patenting - entrepreneurs
8
10
11
11
14
15
15
18
18
19
0 2 4 6 8 10 12 14 16 18 20
Università degli Studi di ROMA "La Sapienza"
Università degli Studi di FERRARA
Università degli Studi di TORINO
Università degli Studi di UDINE
Università degli Studi di BOLOGNA
Università degli Studi di GENOVA
Università degli Studi di MILANO
Politecnico di MILANO
SSUP S.Anna di PISA
Università degli Studi di PADOVA
282 spin-offs (27.9%) with a patent inventor among the entrepreneurs
Source: PATIRIS and TASTE; N = 1,100
Top-10 Universities of affiliation
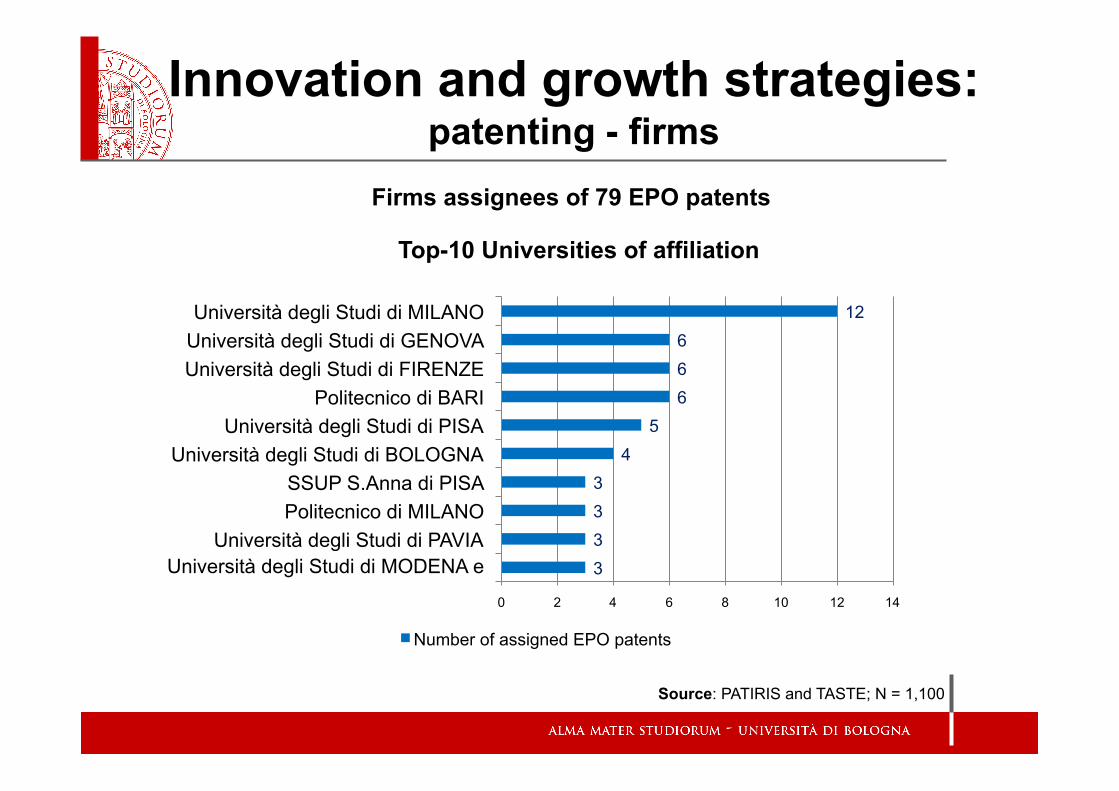
Innovation and growth strategies: patenting - firms
Firms assignees of 79 EPO patents
Source: PATIRIS and TASTE; N = 1,100
Top-10 Universities of affiliation
3 3 3 3
4 5
6 6 6
12
0 2 4 6 8 10 12 14
Università degli Studi di MODENA e REGGIO EMILIA
Università degli Studi di PAVIA Politecnico di MILANO SSUP S.Anna di PISA
Università degli Studi di BOLOGNA Università degli Studi di PISA
Politecnico di BARI Università degli Studi di FIRENZE Università degli Studi di GENOVA Università degli Studi di MILANO
Number of assigned EPO patents
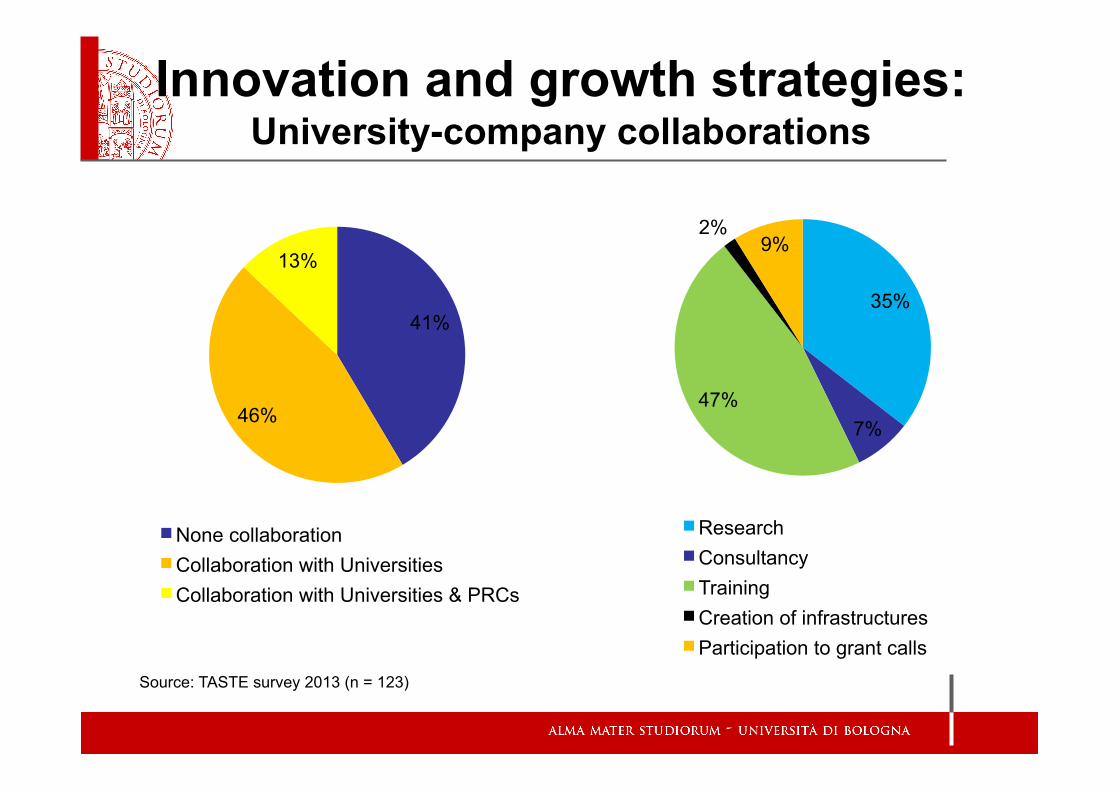
Innovation and growth strategies: University-company collaborations
41%
46%
13%
None collaboration Collaboration with Universities Collaboration with Universities & PRCs
35%
7% 47%
2% 9%
Research Consultancy Training Creation of infrastructures Participation to grant calls
Source: TASTE survey 2013 (n = 123)
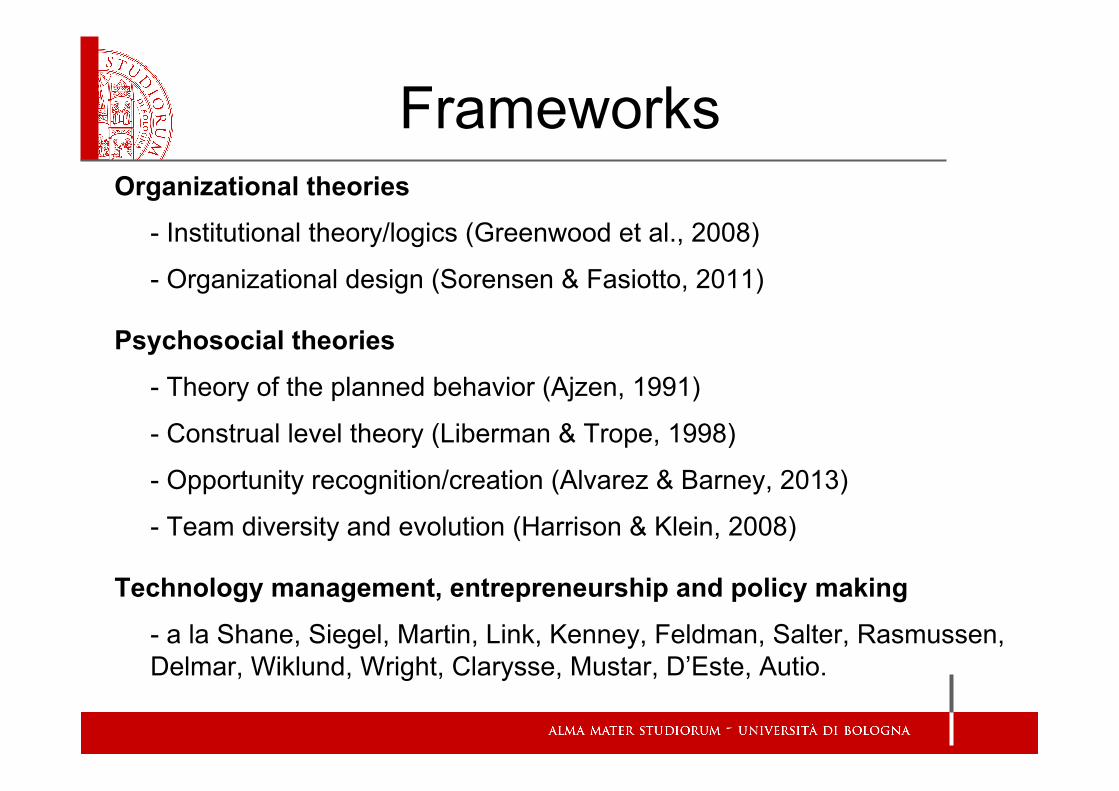
Frameworks Organizational theories
- Institutional theory/logics (Greenwood et al., 2008)
- Organizational design (Sorensen & Fasiotto, 2011)
Psychosocial theories
- Theory of the planned behavior (Ajzen, 1991)
- Construal level theory (Liberman & Trope, 1998)
- Opportunity recognition/creation (Alvarez & Barney, 2013)
- Team diversity and evolution (Harrison & Klein, 2008)
Technology management, entrepreneurship and policy making
- a la Shane, Siegel, Martin, Link, Kenney, Feldman, Salter, Rasmussen, Delmar, Wiklund, Wright, Clarysse, Mustar, D’Este, Autio.
Projects Project Iris:
- Italian Research on Innovation Systems - http://patiris.uibm.gov.it/home (Patiris) - FIRB Financing - 2005 – 2009 - PI: Maurizio Sobrero
Project Taste: - TAking STock: External engagement by academics - www2.sa.unibo.it/taste - FP7-PEOPLE-CIG MARIE CURIE Financing - 2012 – 2016 - PI: Riccardo Fini
Focus • Focus on:
– Commercialization activities by academics • spin-off, patenting, external collaborations
– University and local context support mechanisms: • policies, TTOs, incubators
– Researchers’ careers and scientific productivity
– Student entrepreneurship