Embed Size (px)
Citation preview
1
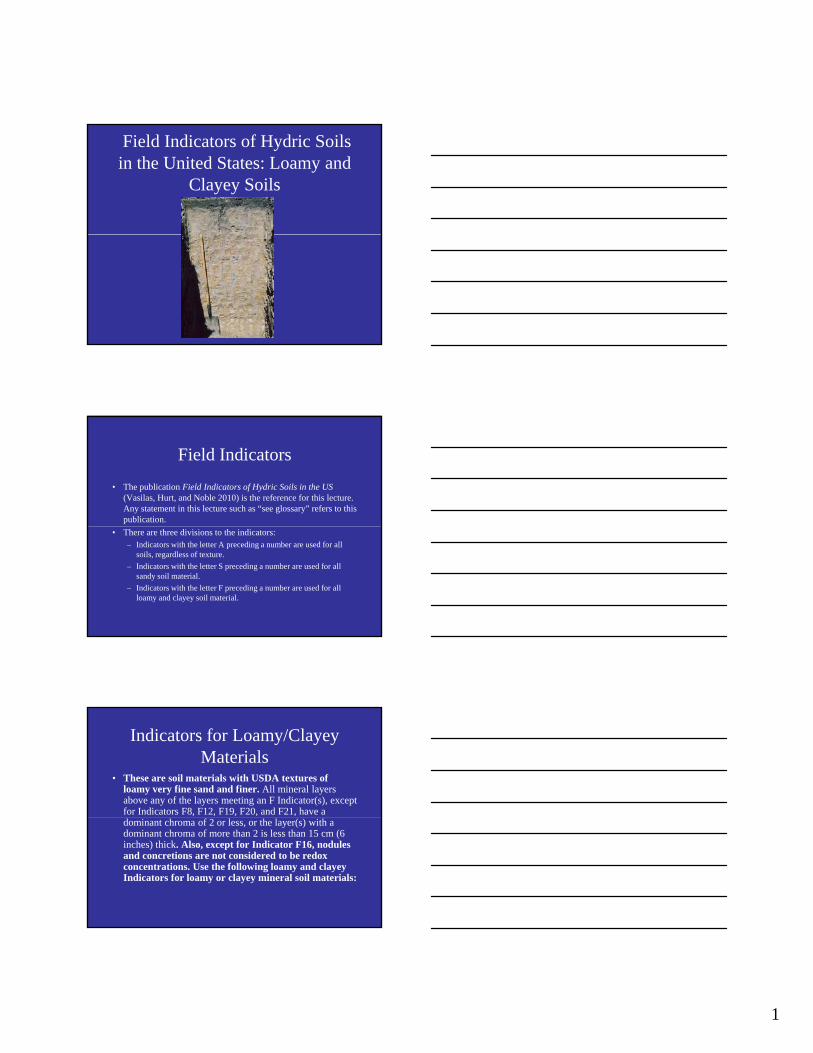
Field Indicators of Hydric Soils in the United States: Loamy and
Clayey Soils
Field Indicators
• The publication Field Indicators of Hydric Soils in the US(Vasilas, Hurt, and Noble 2010) is the reference for this lecture. Any statement in this lecture such as “see glossary” refers to this publication.
• There are three divisions to the indicators:– Indicators with the letter A preceding a number are used for all
soils, regardless of texture.
– Indicators with the letter S preceding a number are used for all sandy soil material.
– Indicators with the letter F preceding a number are used for all loamy and clayey soil material.
Indicators for Loamy/Clayey Materials
• These are soil materials with USDA textures of loamy very fine sand and finer. All mineral layers above any of the layers meeting an F Indicator(s), except for Indicators F8, F12, F19, F20, and F21, have a dominant chroma of 2 or less, or the layer(s) with a dominant chroma of more than 2 is less than 15 cm (6 inches) thick. Also, except for Indicator F16, nodules and concretions are not considered to be redox concentrations. Use the following loamy and clayey Indicators for loamy or clayey mineral soil materials:
2
F1. Loamy Mucky Mineral
• For use in all LRRs except N, R, Q, S, V, W, X, and Y, those using A7 (LRRs P, T, U, and Z), and MLRA 1 of LRR A. A mucky modified mineral layer 10 cm (4 inches) or more thick starting within 15 cm (6 inches) of the soil surface.
• Loamy Mucky Mineral User Notes: "Mucky" is a USDA texture modifier for• Loamy Mucky Mineral User Notes: "Mucky" is a USDA texture modifier for mineral soils. The organic carbon is at least 8 percent but can range to as high as 18 percent. The percentage requirement is dependent upon the clay content of the soil; the higher the clay content, the higher the organic carbon requirement. An example is mucky sandy loam, which has at least 8 percent organic carbon but not more than about 14 percent organic carbon.
• See the discussion under indicator A7 for field identification clues.
• An example of this indicator is unavailable; its utility is unknown.
F2. Loamy Gleyed Matrix
• For use in all LRRs except W, X, and Y. A gleyed matrix that occupies 60% or more of a layer starting within 30 cm (12 inches) of the soil surface.
• Loamy Gleyed Matrix User Notes: Gley colors are not synonymous with gray colors Gley colors are those colors that are found on the gley pagescolors. Gley colors are those colors that are found on the gley pages (Gretag/Macbeth. 2000). They have hue N, 10Y, 5GY, 10GY, 5G, 10G, 5BG, 10BG, 5B, 10B, or 5PB, with value 4 or more. The gleyed matrix only has to be present within 30 cm (12 inches) of the surface. Soils with gleyed matrices are saturated for a significant duration, this is why no thickness of the layer is required. See glossary for the definition of gleyed matrix. Note there is no required thickness of the gleyed matrix. This is because any amounts of gleying within the upper 12 inches would indicate a very wet soil that is reduced for long periods.
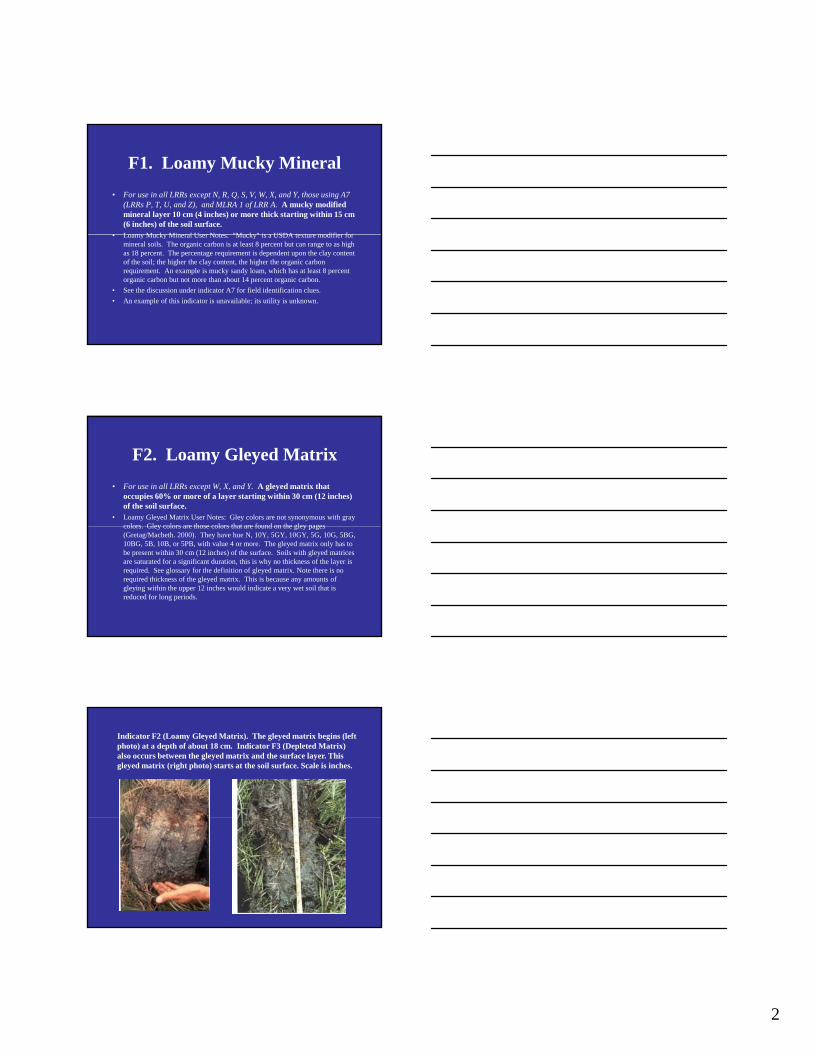
Indicator F2 (Loamy Gleyed Matrix). The gleyed matrix begins (left photo) at a depth of about 18 cm. Indicator F3 (Depleted Matrix) also occurs between the gleyed matrix and the surface layer. This gleyed matrix (right photo) starts at the soil surface. Scale is inches.
3
F3. Depleted Matrix• For use in all LRRs except W, X, and Y. A layer with a depleted matrix that has
60% or more chroma 2 or less that has a minimum thickness of either:– a. 5 cm (2 inches) if 5 cm (2 inches) is entirely within the upper 15 cm (6
inches) of the soil, or– b. 15 cm (6 inches) and starts within 25 cm (10 inches) of the soil surface.
• Depleted Matrix User Notes: A depleted matrix requires a value of 4 or more and chroma 2 or less. Redox concentrations including iron/manganese soft masses and/or pore linings are required in soils with matrix colors of 4/1, 4/2, and 5/2. A, E and calcic horizons may have low chromas and high values and may therefore be mistaken for a depleted matrix; however, they are excluded from the concept of depleted matrix unless common or many, distinct or prominent redox concentrations as soft masses or pore linings are present. See glossary for the complete definition of depleted matrix. The low chroma matrix must be due to wetness and not a relict or parent material feature.
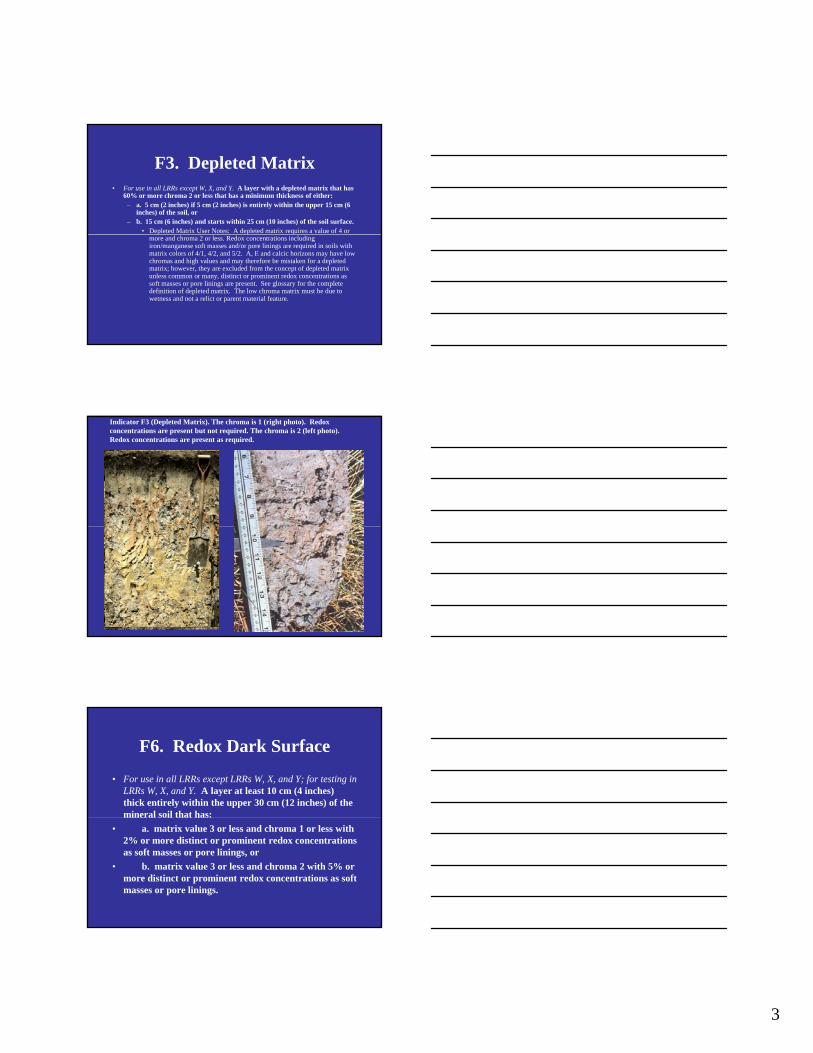
Indicator F3 (Depleted Matrix). The chroma is 1 (right photo). Redox concentrations are present but not required. The chroma is 2 (left photo). Redox concentrations are present as required.
F6. Redox Dark Surface
• For use in all LRRs except LRRs W, X, and Y; for testing in LRRs W, X, and Y. A layer at least 10 cm (4 inches) thick entirely within the upper 30 cm (12 inches) of the mineral soil that has:
• a. matrix value 3 or less and chroma 1 or less with 2% or more distinct or prominent redox concentrations as soft masses or pore linings, or
• b. matrix value 3 or less and chroma 2 with 5% or more distinct or prominent redox concentrations as soft masses or pore linings.
4
Redox Dark Surface User Notes:
• This is a very common indicator used to delineate wetlands in soils with dark-colored surface layers. Redox concentrations in high organic-content mineral soils with dark surfaces are often small and difficult to see. The organic matter masks some or all of the concentrations that may be present. Careful examination is required to see what are often brownish redox concentrations in the darkenedsee what are often brownish redox concentrations in the darkened materials. If the soil is saturated at the time of sampling, it may be necessary to let it dry at least to a moist condition for redox features to become visible.
• Soils that are wet because of ponding or have a shallow, perched layer of saturation may have any color below the dark surface. It is recommended that delineators evaluate the hydrologic source and examine and describe the layer below the dark-colored epipedon when applying this indicator.
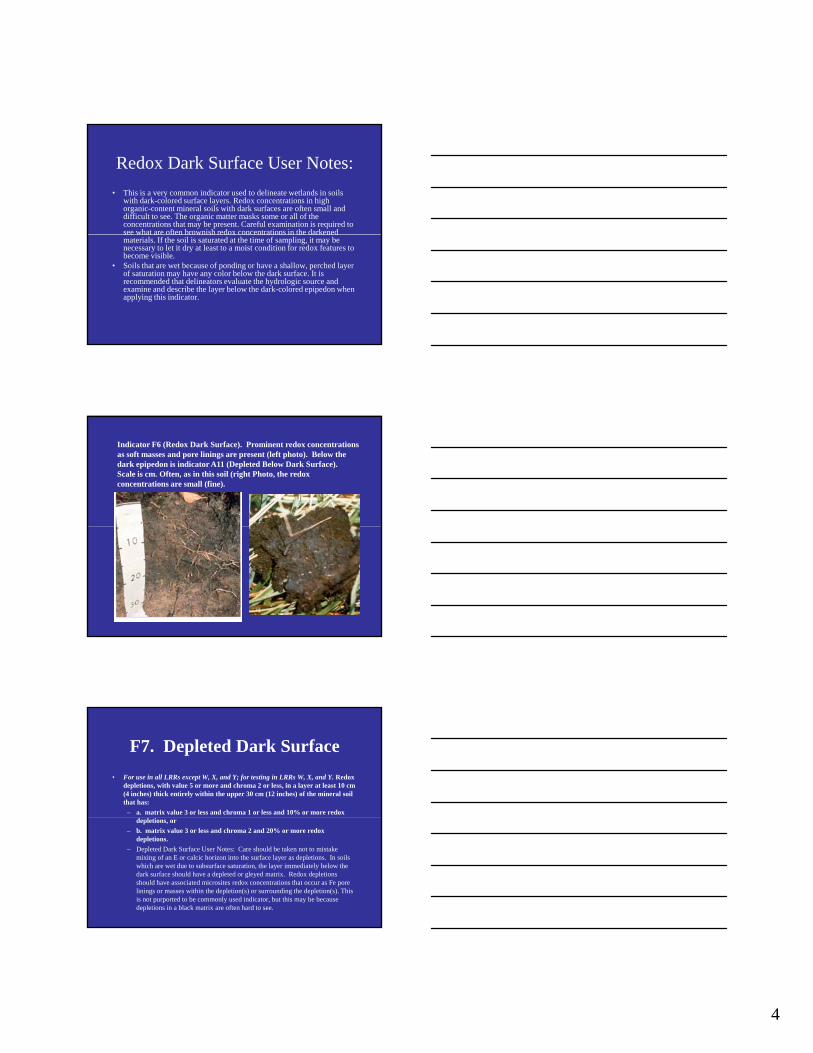
Indicator F6 (Redox Dark Surface). Prominent redox concentrations as soft masses and pore linings are present (left photo). Below the dark epipedon is indicator A11 (Depleted Below Dark Surface). Scale is cm. Often, as in this soil (right Photo, the redox concentrations are small (fine).
F7. Depleted Dark Surface
• For use in all LRRs except W, X, and Y; for testing in LRRs W, X, and Y. Redox depletions, with value 5 or more and chroma 2 or less, in a layer at least 10 cm (4 inches) thick entirely within the upper 30 cm (12 inches) of the mineral soil that has:
– a. matrix value 3 or less and chroma 1 or less and 10% or more redox depletions, or
– b. matrix value 3 or less and chroma 2 and 20% or more redox depletions.
– Depleted Dark Surface User Notes: Care should be taken not to mistake mixing of an E or calcic horizon into the surface layer as depletions. In soils which are wet due to subsurface saturation, the layer immediately below the dark surface should have a depleted or gleyed matrix. Redox depletions should have associated microsites redox concentrations that occur as Fe pore linings or masses within the depletion(s) or surrounding the depletion(s). This is not purported to be commonly used indicator, but this may be because depletions in a black matrix are often hard to see.
5
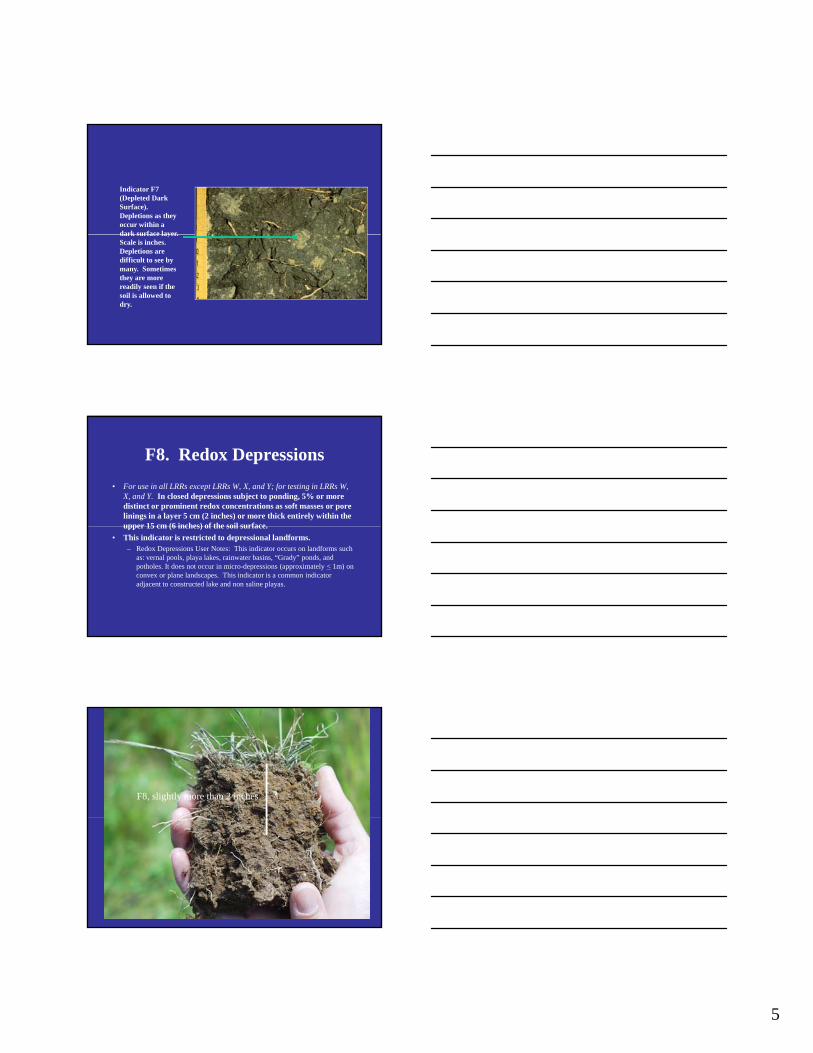
Indicator F7 (Depleted Dark Surface). Depletions as they occur within a dark surface layerdark surface layer. Scale is inches. Depletions are difficult to see by many. Sometimes they are more readily seen if the soil is allowed to dry.
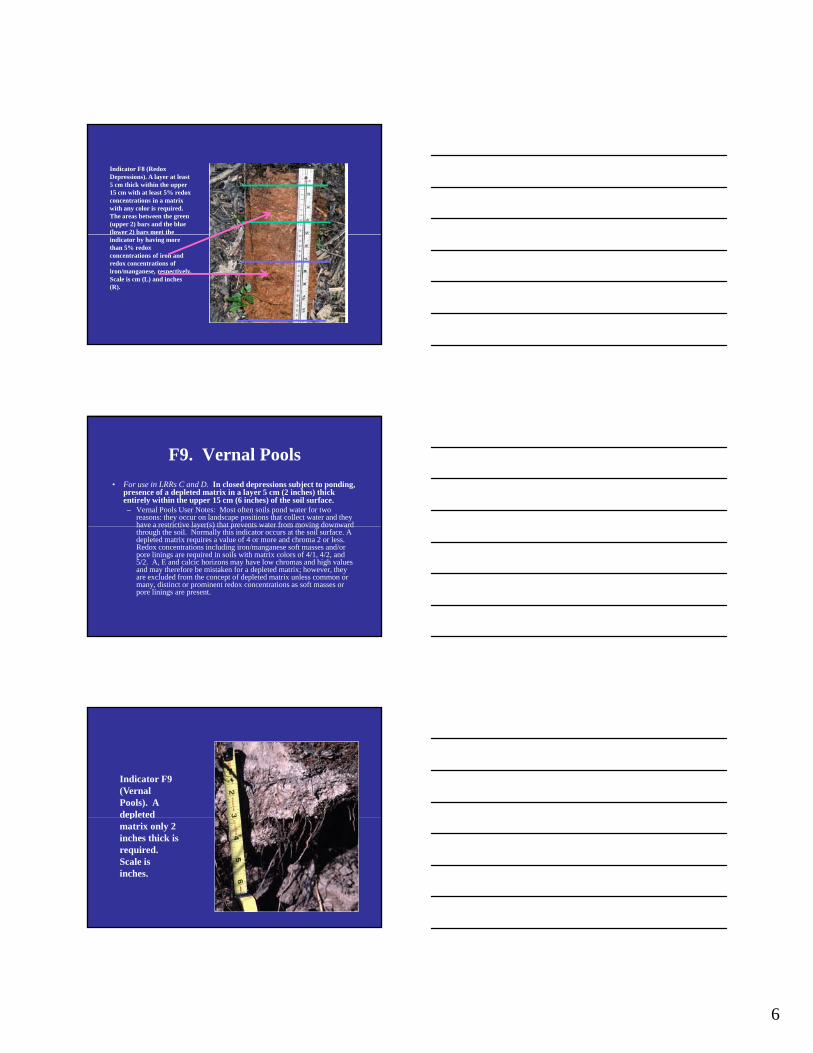
F8. Redox Depressions
• For use in all LRRs except LRRs W, X, and Y; for testing in LRRs W, X, and Y. In closed depressions subject to ponding, 5% or more distinct or prominent redox concentrations as soft masses or pore linings in a layer 5 cm (2 inches) or more thick entirely within the upper 15 cm (6 inches) of the soil surfaceupper 15 cm (6 inches) of the soil surface.
• This indicator is restricted to depressional landforms.– Redox Depressions User Notes: This indicator occurs on landforms such
as: vernal pools, playa lakes, rainwater basins, “Grady” ponds, and potholes. It does not occur in micro-depressions (approximately < 1m) on convex or plane landscapes. This indicator is a common indicator adjacent to constructed lake and non saline playas.
F8, slightly more than 2 inches
6
Indicator F8 (Redox Depressions). A layer at least 5 cm thick within the upper 15 cm with at least 5% redox concentrations in a matrix with any color is required. The areas between the green (upper 2) bars and the blue (lower 2) bars meet the ( )indicator by having more than 5% redox concentrations of iron and redox concentrations of iron/manganese, respectively. Scale is cm (L) and inches (R).
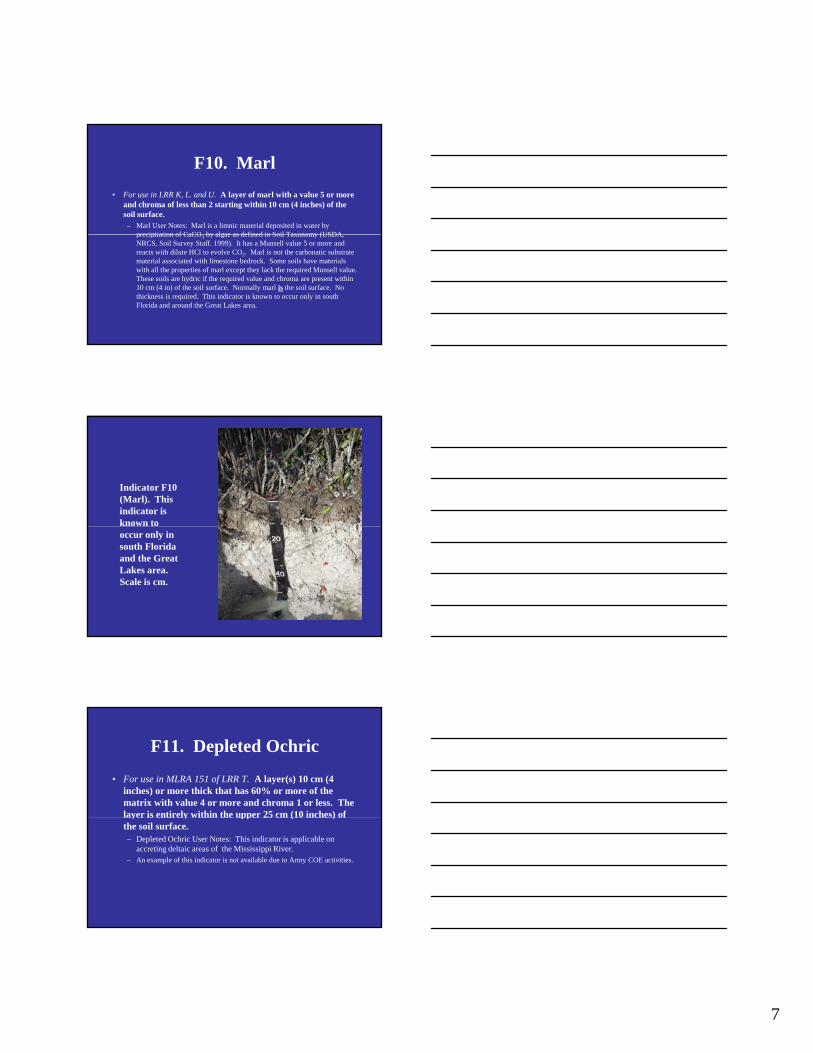
F9. Vernal Pools
• For use in LRRs C and D. In closed depressions subject to ponding, presence of a depleted matrix in a layer 5 cm (2 inches) thick entirely within the upper 15 cm (6 inches) of the soil surface.– Vernal Pools User Notes: Most often soils pond water for two
reasons: they occur on landscape positions that collect water and they have a restrictive layer(s) that prevents water from moving downwardhave a restrictive layer(s) that prevents water from moving downward through the soil. Normally this indicator occurs at the soil surface. A depleted matrix requires a value of 4 or more and chroma 2 or less. Redox concentrations including iron/manganese soft masses and/or pore linings are required in soils with matrix colors of 4/1, 4/2, and 5/2. A, E and calcic horizons may have low chromas and high values and may therefore be mistaken for a depleted matrix; however, they are excluded from the concept of depleted matrix unless common or many, distinct or prominent redox concentrations as soft masses or pore linings are present.
Indicator F9 (Vernal Pools). A depleted pmatrix only 2 inches thick is required. Scale is inches.
7
F10. Marl
• For use in LRR K, L. and U. A layer of marl with a value 5 or more and chroma of less than 2 starting within 10 cm (4 inches) of the soil surface.
– Marl User Notes: Marl is a limnic material deposited in water by precipitation of CaCO by algae as defined in Soil Taxonomy (USDAprecipitation of CaCO3 by algae as defined in Soil Taxonomy (USDA, NRCS, Soil Survey Staff. 1999). It has a Munsell value 5 or more and reacts with dilute HCl to evolve CO2. Marl is not the carbonatic substrate material associated with limestone bedrock. Some soils have materials with all the properties of marl except they lack the required Munsell value. These soils are hydric if the required value and chroma are present within 10 cm (4 in) of the soil surface. Normally marl is the soil surface. No thickness is required. This indicator is known to occur only in south Florida and around the Great Lakes area.
Indicator F10 (Marl). This indicator is known to occur only in south Florida and the Great Lakes area. Scale is cm.
F11. Depleted Ochric
• For use in MLRA 151 of LRR T. A layer(s) 10 cm (4 inches) or more thick that has 60% or more of the matrix with value 4 or more and chroma 1 or less. The layer is entirely within the upper 25 cm (10 inches) of y y pp ( )the soil surface.– Depleted Ochric User Notes: This indicator is applicable on
accreting deltaic areas of the Mississippi River.– An example of this indicator is not available due to Army COE activities.
8
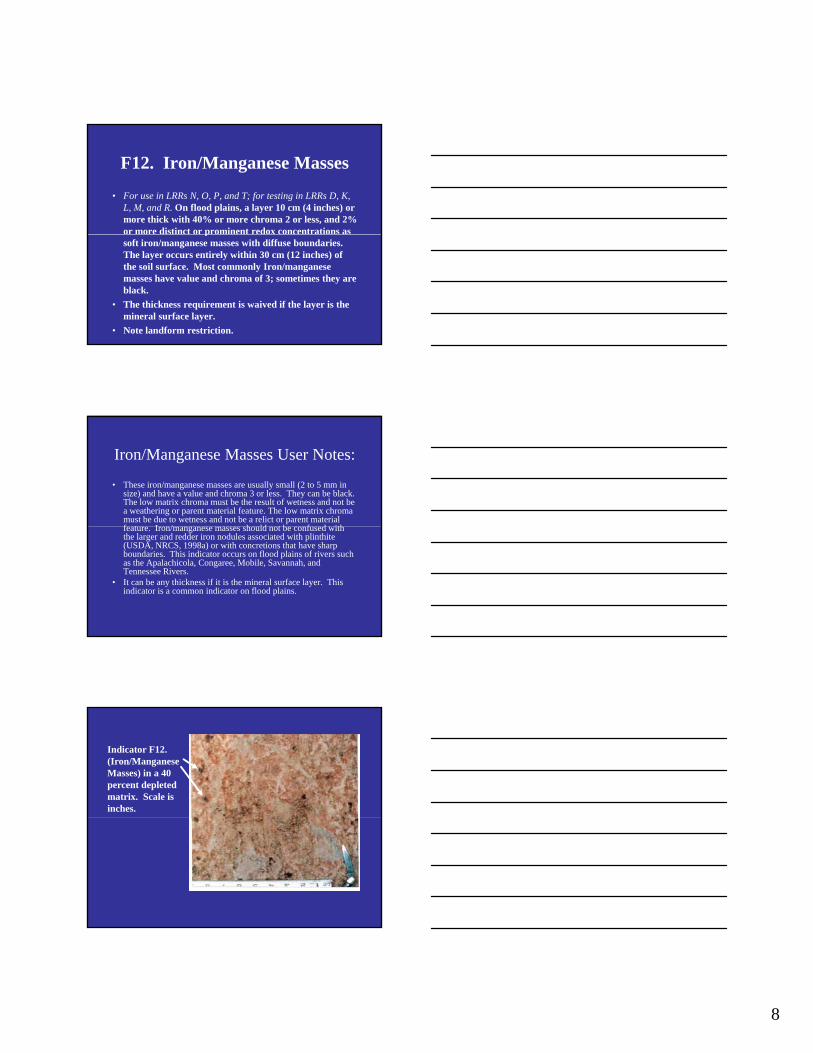
F12. Iron/Manganese Masses
• For use in LRRs N, O, P, and T; for testing in LRRs D, K, L, M, and R. On flood plains, a layer 10 cm (4 inches) or more thick with 40% or more chroma 2 or less, and 2% or more distinct or prominent redox concentrations as psoft iron/manganese masses with diffuse boundaries. The layer occurs entirely within 30 cm (12 inches) of the soil surface. Most commonly Iron/manganese masses have value and chroma of 3; sometimes they are black.
• The thickness requirement is waived if the layer is the mineral surface layer.
• Note landform restriction.
Iron/Manganese Masses User Notes:
• These iron/manganese masses are usually small (2 to 5 mm in size) and have a value and chroma 3 or less. They can be black. The low matrix chroma must be the result of wetness and not be a weathering or parent material feature. The low matrix chroma must be due to wetness and not be a relict or parent material f t I / h ld t b f d ithfeature. Iron/manganese masses should not be confused with the larger and redder iron nodules associated with plinthite (USDA, NRCS, 1998a) or with concretions that have sharp boundaries. This indicator occurs on flood plains of rivers such as the Apalachicola, Congaree, Mobile, Savannah, and Tennessee Rivers.
• It can be any thickness if it is the mineral surface layer. This indicator is a common indicator on flood plains.
Indicator F12. (Iron/Manganese Masses) in a 40 percent depleted matrix. Scale is inches.
9
F12. Iron/Manganese Masses
10 cm (4 inches)
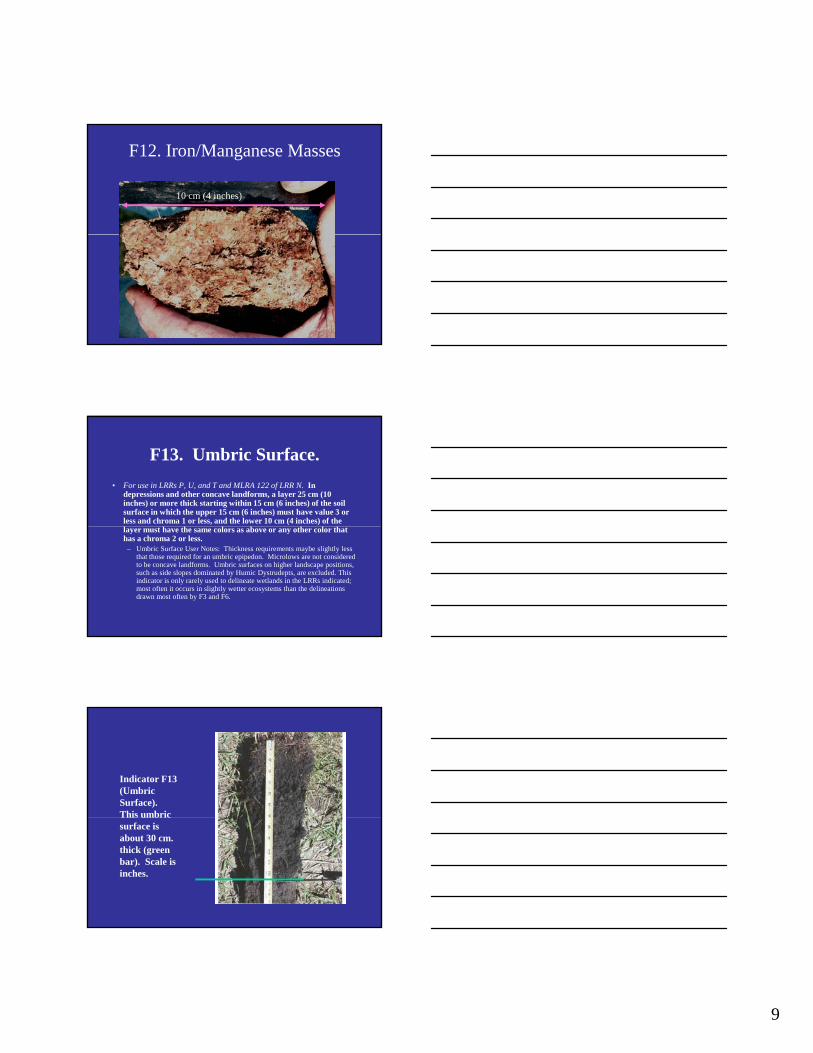
F13. Umbric Surface.
• For use in LRRs P, U, and T and MLRA 122 of LRR N. In depressions and other concave landforms, a layer 25 cm (10 inches) or more thick starting within 15 cm (6 inches) of the soil surface in which the upper 15 cm (6 inches) must have value 3 or less and chroma 1 or less, and the lower 10 cm (4 inches) of the layer must have the same colors as above or any other color that has a chroma 2 or less.
– Umbric Surface User Notes: Thickness requirements maybe slightly less that those required for an umbric epipedon. Microlows are not considered to be concave landforms. Umbric surfaces on higher landscape positions, such as side slopes dominated by Humic Dystrudepts, are excluded. This indicator is only rarely used to delineate wetlands in the LRRs indicated; most often it occurs in slightly wetter ecosystems than the delineations drawn most often by F3 and F6.
Indicator F13 (Umbric Surface). This umbric surface is about 30 cm. thick (green bar). Scale is inches.
10
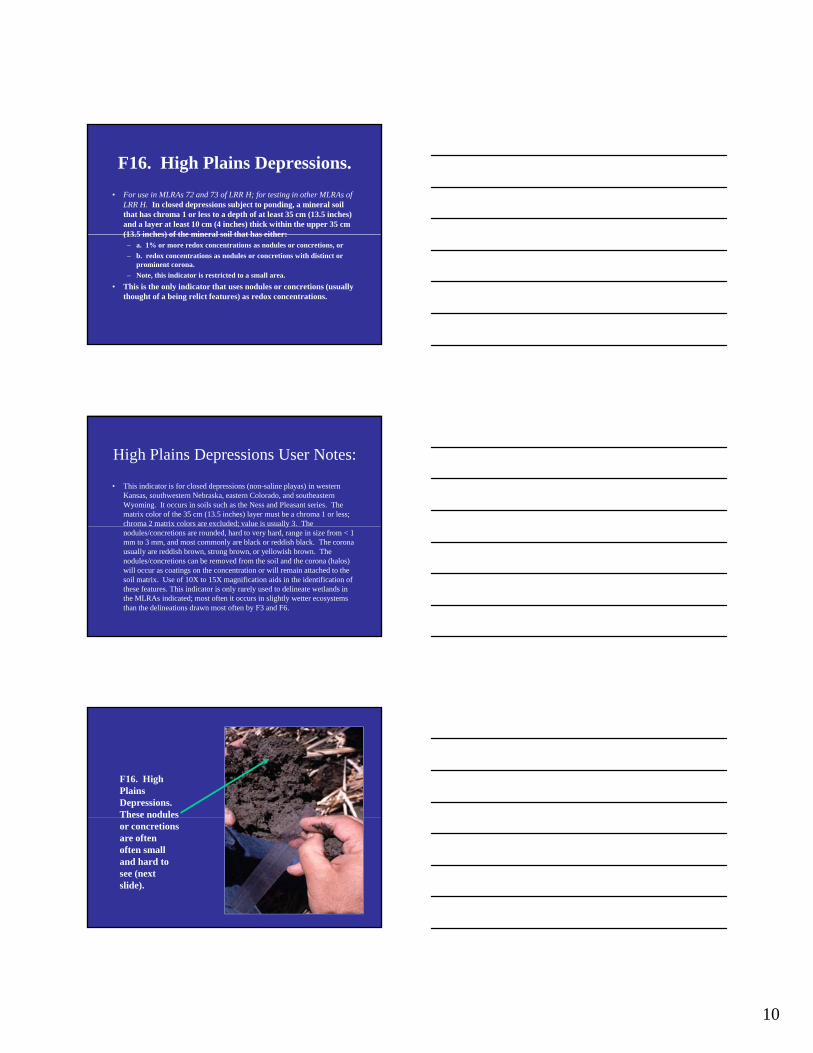
F16. High Plains Depressions.
• For use in MLRAs 72 and 73 of LRR H; for testing in other MLRAs of LRR H. In closed depressions subject to ponding, a mineral soil that has chroma 1 or less to a depth of at least 35 cm (13.5 inches) and a layer at least 10 cm (4 inches) thick within the upper 35 cm (13 5 inches) of the mineral soil that has either:(13.5 inches) of the mineral soil that has either:
– a. 1% or more redox concentrations as nodules or concretions, or
– b. redox concentrations as nodules or concretions with distinct or prominent corona.
– Note, this indicator is restricted to a small area.
• This is the only indicator that uses nodules or concretions (usually thought of a being relict features) as redox concentrations.
High Plains Depressions User Notes:
• This indicator is for closed depressions (non-saline playas) in western Kansas, southwestern Nebraska, eastern Colorado, and southeastern Wyoming. It occurs in soils such as the Ness and Pleasant series. The matrix color of the 35 cm (13.5 inches) layer must be a chroma 1 or less; chroma 2 matrix colors are excluded; value is usually 3. The ; ynodules/concretions are rounded, hard to very hard, range in size from < 1 mm to 3 mm, and most commonly are black or reddish black. The corona usually are reddish brown, strong brown, or yellowish brown. The nodules/concretions can be removed from the soil and the corona (halos) will occur as coatings on the concentration or will remain attached to the soil matrix. Use of 10X to 15X magnification aids in the identification of these features. This indicator is only rarely used to delineate wetlands in the MLRAs indicated; most often it occurs in slightly wetter ecosystems than the delineations drawn most often by F3 and F6.
F16. High Plains Depressions. These nodules or concretions are often often small and hard to see (next slide).
11
F17 Delta Ochric
• For use in MLRA 151 of LRR T. A layer 10 cm (4 inches) or more thick that has 60% or more of the matrix with value 4 or more and chroma 2 or less with no redox concentrations This2 or less with no redox concentrations. This layer occurs entirely within the upper 30 cm (12 inches) of the soil surface.
• Delta Ochric User Notes: This indicator is applicable in accreting areas of the Mississippi River Delta; however, due to Army COE activities this indicator no longer exists.
F18 Reduced Vertic
• For use in MLRA 150 of LRR T; for testing in all LRRs with Vertisols and Vertic intergrades. In Vertisols and Vertic intergrades, a positive reaction to alpha-alpha-Dipyridyl that: (a) is the dominant (60% or more)
diti f l t l t 4 i h thi k ithi thcondition of a layer at least 4 inches thick within the upper 12 inches (or at least 2 inches thick within the upper 6 inches) of the mineral or muck soil surface, (b) occurs for at least 7 continuous days and 28 cumulative days, and (c) occurs during a normal (within 16-84% of probable precipitation) or drier season and month.
12
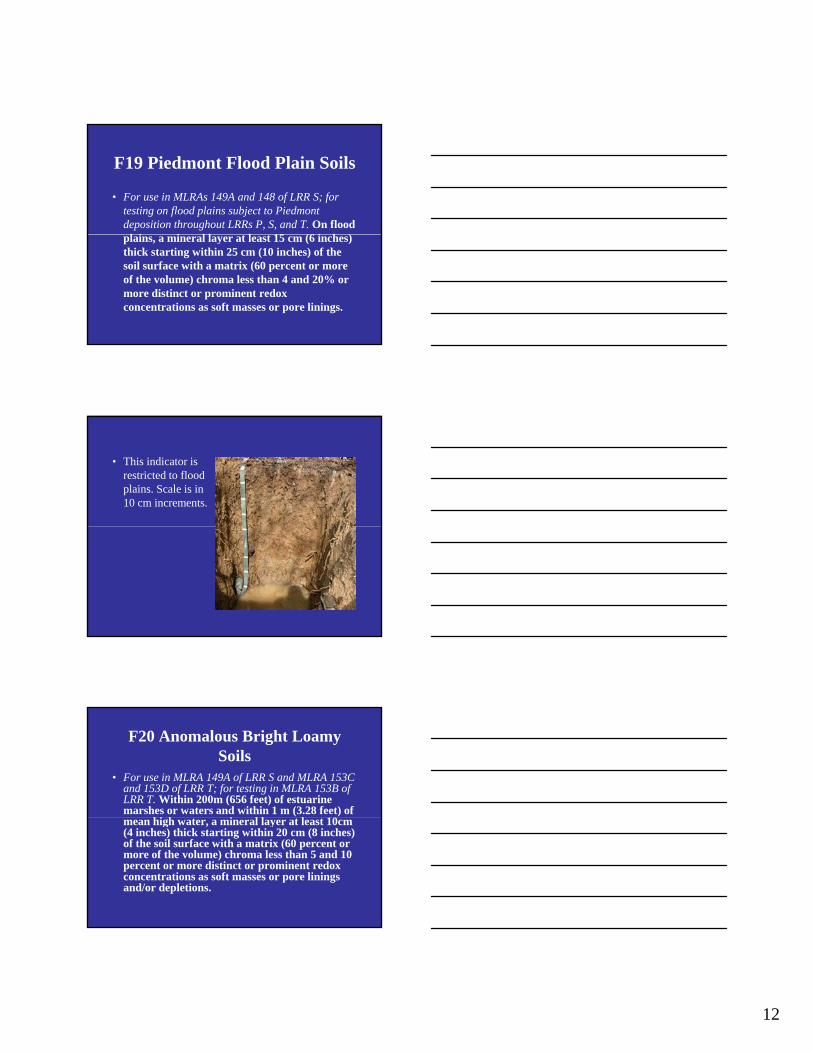
F19 Piedmont Flood Plain Soils
• For use in MLRAs 149A and 148 of LRR S; for testing on flood plains subject to Piedmont deposition throughout LRRs P, S, and T. On flood
l i i l l l 15 (6 i h )plains, a mineral layer at least 15 cm (6 inches) thick starting within 25 cm (10 inches) of the soil surface with a matrix (60 percent or more of the volume) chroma less than 4 and 20% or more distinct or prominent redox concentrations as soft masses or pore linings.
• This indicator is restricted to flood plains. Scale is in 10 cm increments.
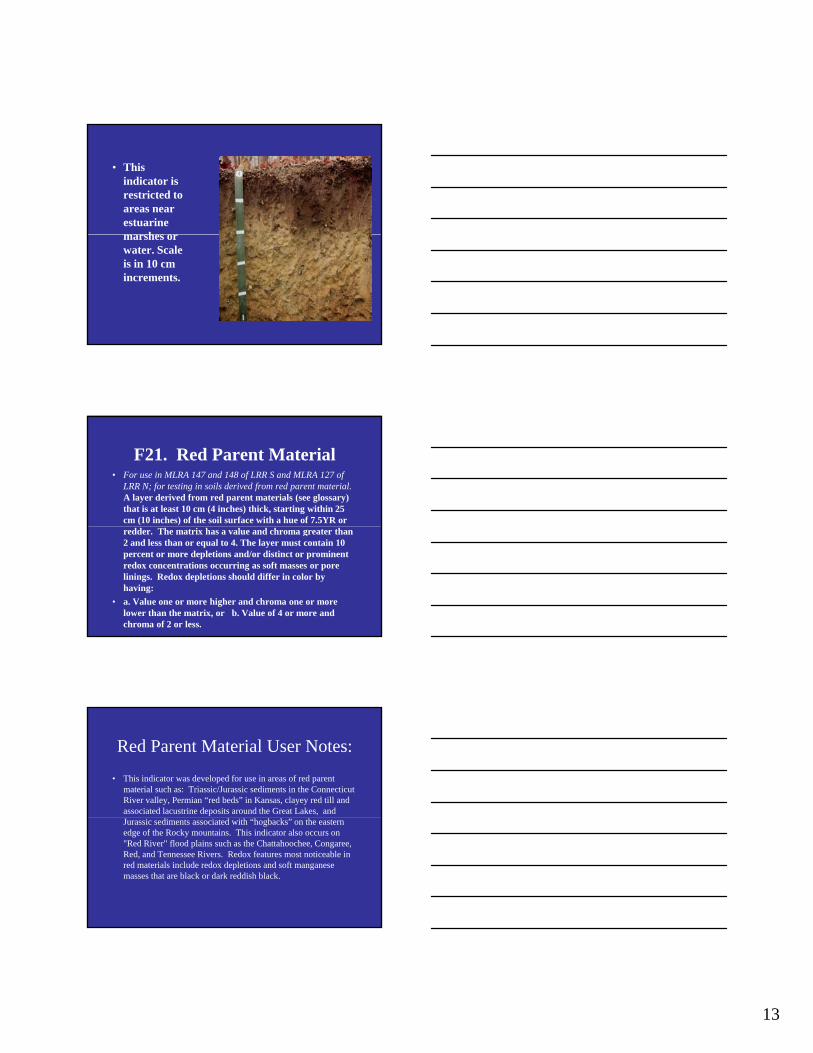
F20 Anomalous Bright Loamy Soils
• For use in MLRA 149A of LRR S and MLRA 153C and 153D of LRR T; for testing in MLRA 153B of LRR T. Within 200m (656 feet) of estuarine marshes or waters and within 1 m (3.28 feet) of
hi h i l l l 10mean high water, a mineral layer at least 10cm (4 inches) thick starting within 20 cm (8 inches) of the soil surface with a matrix (60 percent or more of the volume) chroma less than 5 and 10 percent or more distinct or prominent redox concentrations as soft masses or pore linings and/or depletions.
13
• This indicator is restricted to areas near estuarine marshes ormarshes or water. Scale is in 10 cm increments.
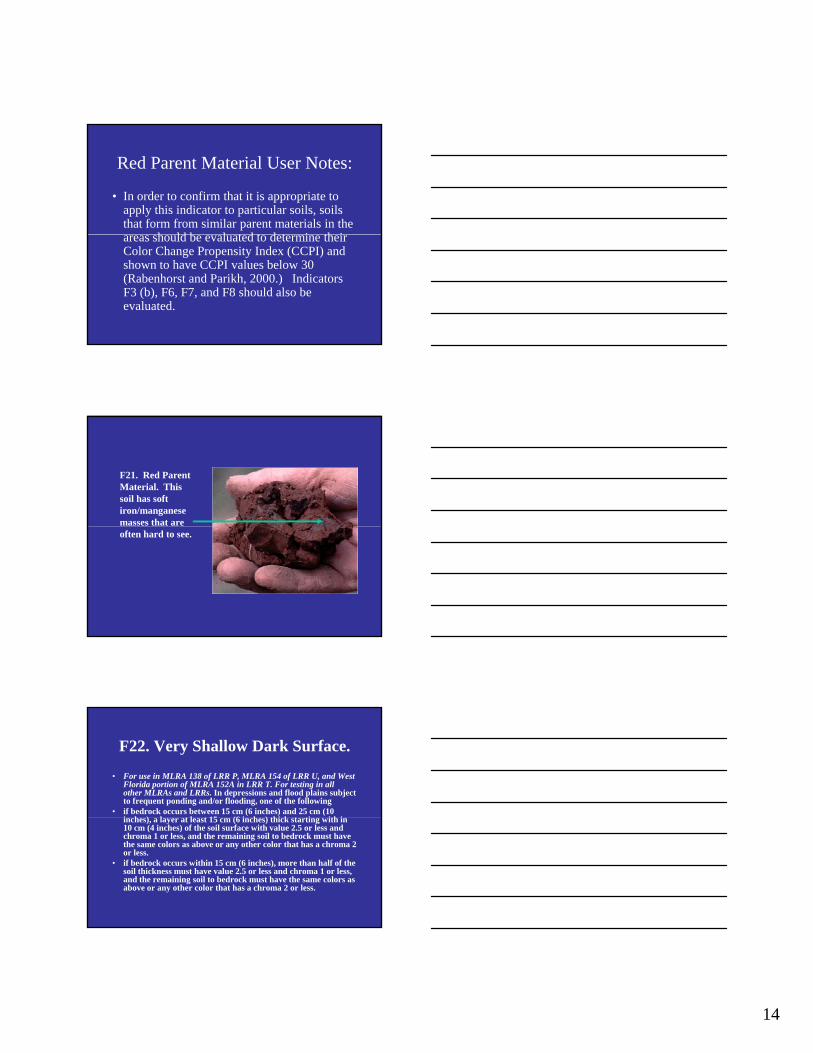
F21. Red Parent Material• For use in MLRA 147 and 148 of LRR S and MLRA 127 of
LRR N; for testing in soils derived from red parent material.A layer derived from red parent materials (see glossary) that is at least 10 cm (4 inches) thick, starting within 25 cm (10 inches) of the soil surface with a hue of 7.5YR or redder. The matrix has a value and chroma greater than 2 and less than or equal to 4. The layer must contain 10 percent or more depletions and/or distinct or prominent redox concentrations occurring as soft masses or pore linings. Redox depletions should differ in color by having:
• a. Value one or more higher and chroma one or more lower than the matrix, or b. Value of 4 or more and chroma of 2 or less.
Red Parent Material User Notes:
• This indicator was developed for use in areas of red parent material such as: Triassic/Jurassic sediments in the Connecticut River valley, Permian “red beds” in Kansas, clayey red till and associated lacustrine deposits around the Great Lakes, and Jurassic sediments associated with “hogbacks” on the eastern edge of the Rocky mountains. This indicator also occurs on "Red River" flood plains such as the Chattahoochee, Congaree, Red, and Tennessee Rivers. Redox features most noticeable in red materials include redox depletions and soft manganese masses that are black or dark reddish black.
14
Red Parent Material User Notes:
• In order to confirm that it is appropriate to apply this indicator to particular soils, soils that form from similar parent materials in the
h ld b l t d t d t i th iareas should be evaluated to determine their Color Change Propensity Index (CCPI) and shown to have CCPI values below 30 (Rabenhorst and Parikh, 2000.) Indicators F3 (b), F6, F7, and F8 should also be evaluated.
F21. Red Parent Material. This soil has soft iron/manganese masses that are often hard to see.
F22. Very Shallow Dark Surface.
• For use in MLRA 138 of LRR P, MLRA 154 of LRR U, and West Florida portion of MLRA 152A in LRR T. For testing in all other MLRAs and LRRs. In depressions and flood plains subject to frequent ponding and/or flooding, one of the following
• if bedrock occurs between 15 cm (6 inches) and 25 cm (10 i h ) l t l t 15 (6 i h ) thi k t ti ith iinches), a layer at least 15 cm (6 inches) thick starting with in 10 cm (4 inches) of the soil surface with value 2.5 or less and chroma 1 or less, and the remaining soil to bedrock must have the same colors as above or any other color that has a chroma 2 or less.
• if bedrock occurs within 15 cm (6 inches), more than half of the soil thickness must have value 2.5 or less and chroma 1 or less, and the remaining soil to bedrock must have the same colors as above or any other color that has a chroma 2 or less.
15
Summary of the “F” indicators
• These indicators are to identify hydric soils that occur in loamy/clayey soil material. The entire soil does not have to be loamy or clayey, just the
f h il i d b h ifipart of the soil as required by each specific indicator. This material does not feel gritty. F1, F6, F7, F10, F13, and F16 are difficult to easily identify. It may be best to work with a local wetland scientist familiar with your region.
TEST INDICATORS OF HYDRIC SOILS
• The 42 (for use) Indicators should be tested for use in LRRs other than those listed. Other Indicators for testing are listed in Field Indicators of Hydric Soils in the United States. There are h i dithree test indicators.
• TA4. Alaska Color Change. For testing in LRRs W,X, and Y.
• TA5. Alaska Alpine Swales. For testing in LRRs W,X, and Y.
• TA6. Mesic Spodic. For testing in MLRA 144A and 145 of LRR R and 149B of LRR S.
Problem Hydric Soils
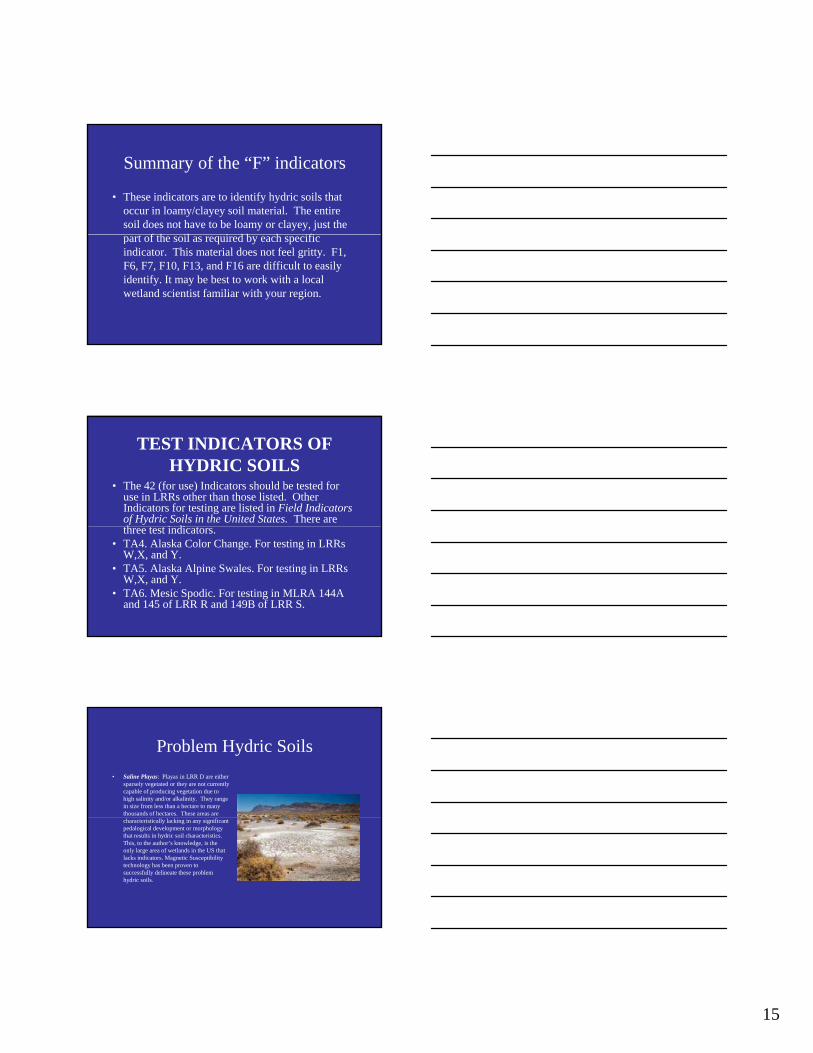
• Saline Playas: Playas in LRR D are either sparsely vegetated or they are not currently capable of producing vegetation due to high salinity and/or alkalinity. They range in size from less than a hectare to many thousands of hectares. These areas are characteristically lacking in any significant pedalogical development or morphology that results in hydric soil characteristics. This, to the author’s knowledge, is the only large area of wetlands in the US that lacks indicators. Magnetic Susceptibility technology has been proven to successfully delineate these problem hydric soils.
16
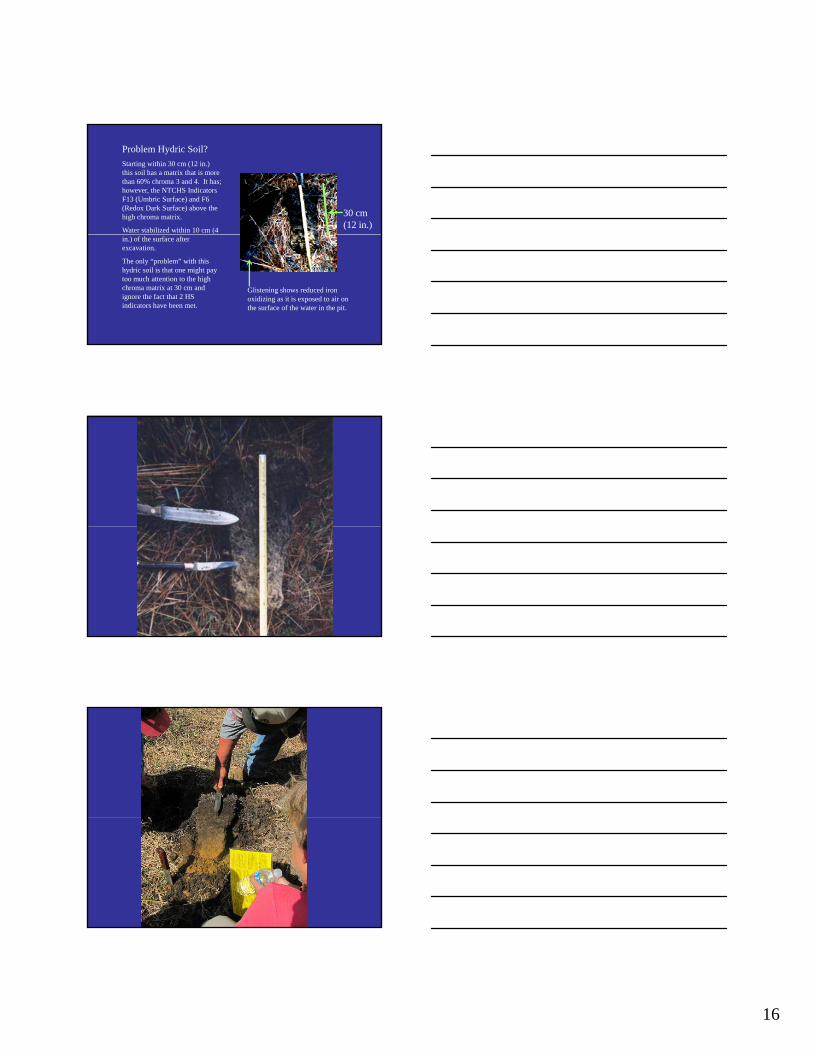
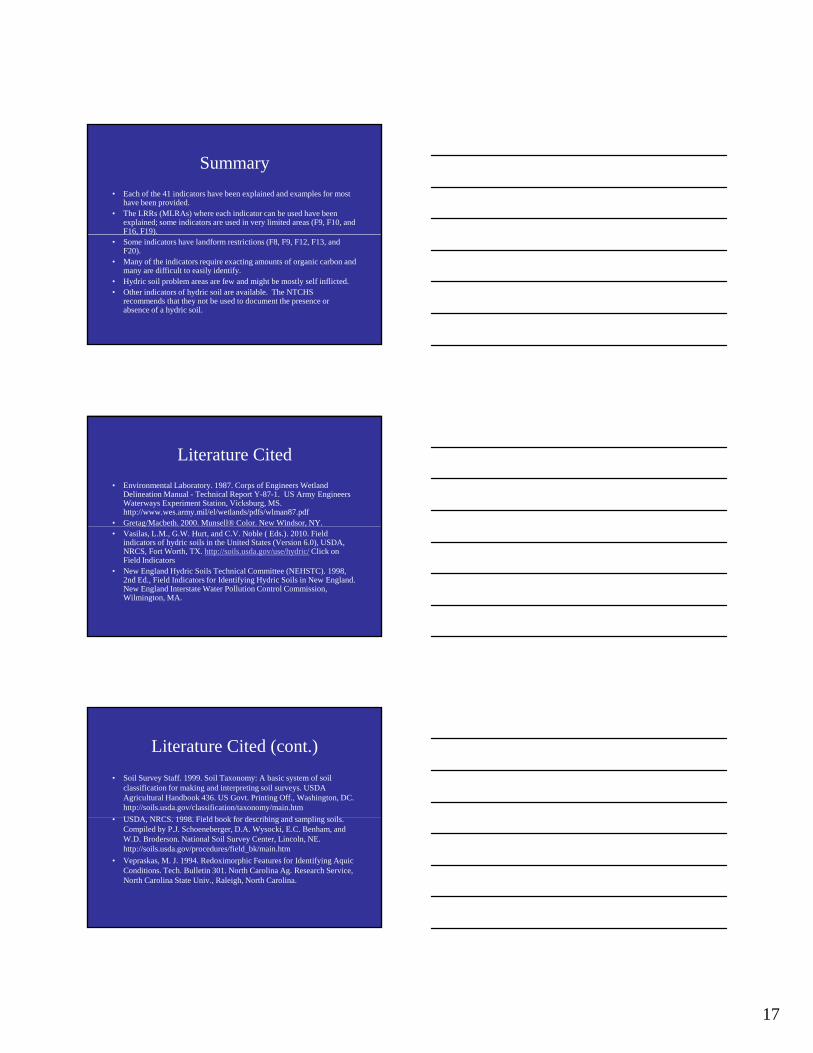
Problem Hydric Soil?
Starting within 30 cm (12 in.) this soil has a matrix that is more than 60% chroma 3 and 4. It has; however, the NTCHS Indicators F13 (Umbric Surface) and F6 (Redox Dark Surface) above the high chroma matrix.
Water stabilized within 10 cm (4
30 cm (12 in.)
in.) of the surface after excavation.
The only “problem” with this hydric soil is that one might pay too much attention to the high chroma matrix at 30 cm and ignore the fact that 2 HS indicators have been met.
Glistening shows reduced iron oxidizing as it is exposed to air on the surface of the water in the pit.
17
Summary
• Each of the 41 indicators have been explained and examples for most have been provided.
• The LRRs (MLRAs) where each indicator can be used have been explained; some indicators are used in very limited areas (F9, F10, and F16, F19)., )
• Some indicators have landform restrictions (F8, F9, F12, F13, and F20).
• Many of the indicators require exacting amounts of organic carbon and many are difficult to easily identify.
• Hydric soil problem areas are few and might be mostly self inflicted. • Other indicators of hydric soil are available. The NTCHS
recommends that they not be used to document the presence or absence of a hydric soil.
Literature Cited
• Environmental Laboratory. 1987. Corps of Engineers Wetland Delineation Manual - Technical Report Y-87-1. US Army Engineers Waterways Experiment Station, Vicksburg, MS. http://www.wes.army.mil/el/wetlands/pdfs/wlman87.pdf
• Gretag/Macbeth. 2000. Munsell® Color. New Windsor, NY.g ,• Vasilas, L.M., G.W. Hurt, and C.V. Noble ( Eds.). 2010. Field
indicators of hydric soils in the United States (Version 6.0), USDA, NRCS, Fort Worth, TX. http://soils.usda.gov/use/hydric/ Click on Field Indicators
• New England Hydric Soils Technical Committee (NEHSTC). 1998, 2nd Ed., Field Indicators for Identifying Hydric Soils in New England. New England Interstate Water Pollution Control Commission, Wilmington, MA.
Literature Cited (cont.)
• Soil Survey Staff. 1999. Soil Taxonomy: A basic system of soil classification for making and interpreting soil surveys. USDA Agricultural Handbook 436. US Govt. Printing Off., Washington, DC. http://soils.usda.gov/classification/taxonomy/main.htm
USDA NRCS 1998 Fi ld b k f d ibi d li il• USDA, NRCS. 1998. Field book for describing and sampling soils. Compiled by P.J. Schoeneberger, D.A. Wysocki, E.C. Benham, and W.D. Broderson. National Soil Survey Center, Lincoln, NE. http://soils.usda.gov/procedures/field_bk/main.htm
• Vepraskas, M. J. 1994. Redoximorphic Features for Identifying Aquic Conditions. Tech. Bulletin 301. North Carolina Ag. Research Service, North Carolina State Univ., Raleigh, North Carolina.