Embed Size (px)
Citation preview
United StatesDepartment ofAgriculture
Natural Resources Conservation Service
In cooperation with the National Technical Committee for Hydric Soils
Field Indicators of Hydric Soils in the United StatesA Guide for Identifying and Delineating Hydric Soils, Version 8.1, 2017


Field Indicators of Hydric Soils in the United States
A Guide for Identifying and Delineating Hydric Soils,Version 8.1, 2017
(Including corrections to version 8.0, 2016, on pages 21, 25, and 34)
United States Department of Agriculture,Natural Resources Conservation Service,
in cooperation with the National Technical Committee for Hydric Soils
Edited by L.M. Vasilas, Soil Scientist, NRCS, Washington, DC; G.W. Hurt, Soil Scientist, University of Florida, Gainesville, FL; and J.F. Berkowitz, Soil Scientist, USACE, Vicksburg, MS
ii
In accordance with Federal civil rights law and U.S. Department of Agriculture (USDA) civil rights regulations and policies, the USDA, its Agencies, offices, and employees, and institutions participating in or administering USDA programs are prohibited from discriminating based on race, color, national origin, religion, sex, gender identity (including gender expression), sexual orientation, disability, age, marital status, family/parental status, income derived from a public assistance program, political beliefs, or reprisal or retaliation for prior civil rights activity, in any program or activity conducted or funded by USDA (not all bases apply to all programs). Remedies and complaint filing deadlines vary by program or incident.
Persons with disabilities who require alternative means of communication for program information (e.g., Braille, large print, audiotape, American Sign Language, etc.) should contact the responsible Agency or USDA’s TARGET Center at (202) 720-2600 (voice and TTY) or contact USDA through the Federal Relay Service at (800) 877-8339. Additionally, program information may be made available in languages other than English.
To file a program discrimination complaint, complete the USDA Program Discrimination Complaint Form, AD-3027, found online at How to File a Program Discrimination Complaint (https://www.ascr.usda.gov/how-file-program-discrimination-complaint) and at any USDA office or write a letter addressed to USDA and provide in the letter all of the information requested in the form. To request a copy of the complaint form, call (866) 632-9992. Submit your completed form or letter to USDA by: (1) mail: U.S. Department of Agriculture, Office of the Assistant Secretary for Civil Rights, 1400 Independence Avenue, SW, Washington, D.C. 20250-9410; (2) fax: (202) 690-7442; or (3) email: [email protected].
USDA is an equal opportunity provider, employer, and lender.
Copies of this publication can be obtained from:
NRCS Distribution Center [email protected]
Information contained in this publication and additional information concerning hydric soils are maintained on the website at http://www.nrcs.usda.gov/wps/portal/nrcs/main/soils/use/hydric/.
Citation: United States Department of Agriculture, Natural Resources Conservation Service. 2016. Field Indicators of Hydric Soils in the United States, Version 8.0. L.M. Vasilas, G.W. Hurt, and J.F. Berkowitz (eds.). USDA, NRCS, in cooperation with the National Technical Committee for Hydric Soils.
Cover: A typical landscape and profile of a hydric soil meeting the requirements of indicator F3, Depleted Matrix. Note the close-up of a ped showing a gray matrix with redox concentrations characteristic of soils meeting this field indicator. The Depleted Matrix indicator is the most commonly used indicator in the United States.
iii
Foreword
Field Indicators of Hydric Soils in the United States has been developed by soil scientists of the Natural Resources Conservation Service (NRCS) in cooperation with the U.S. Fish and Wildlife Service (FWS); the U.S. Army Corps of Engineers (COE); the Environmental Protection Agency (EPA); various regional, state, and local agencies; universities; and the private sector. The editors recognize that this guide could not have been developed without the efforts of many individuals. Included in this publication are the hydric soil indicators approved by the NRCS and the National Technical Committee for Hydric Soils (NTCHS) for use in identifying, delineating, and verifying hydric soils in the field. Also included are indicators designated as test indicators, which are not approved for use but are to be tested so that their utility can be determined.

v
Contents
Foreword ..................................................................................................................... iiiIndex to Indicators ...................................................................................................... viField Indicators of Hydric Soils in the United States,Version 8.0, 2016 .................1
Introduction ...............................................................................................................1Concept .....................................................................................................................2Procedure .................................................................................................................3General Guidance for Using the Indicators ...............................................................5To Comment on the Indicators ..................................................................................6
Field Indicators of Hydric Soils ..................................................................................9All Soils .....................................................................................................................9Sandy Soils ............................................................................................................16Loamy and Clayey Soils ..........................................................................................20
Test Indicators of Hydric Soils .................................................................................29All Soils ...................................................................................................................29Sandy Soils .............................................................................................................30Loamy and Clayey Soils ..........................................................................................30
References .................................................................................................................31Glossary .....................................................................................................................33Appendices ................................................................................................................43
Appendix 1: Use Indicators by Land Resource Regions (LRRs) and Certain Major Land Resource Areas (MLRAs) ..............................................................43
Appendix 2: Test Indicators by Land Resource Regions (LRRs) and Certain Major Land Resource Regions (MLRAs) ..........................................................44
Appendix 3: Indicators That Have Been Deleted or Are No Longer Approved for Use ..............................................................................................................45
vi
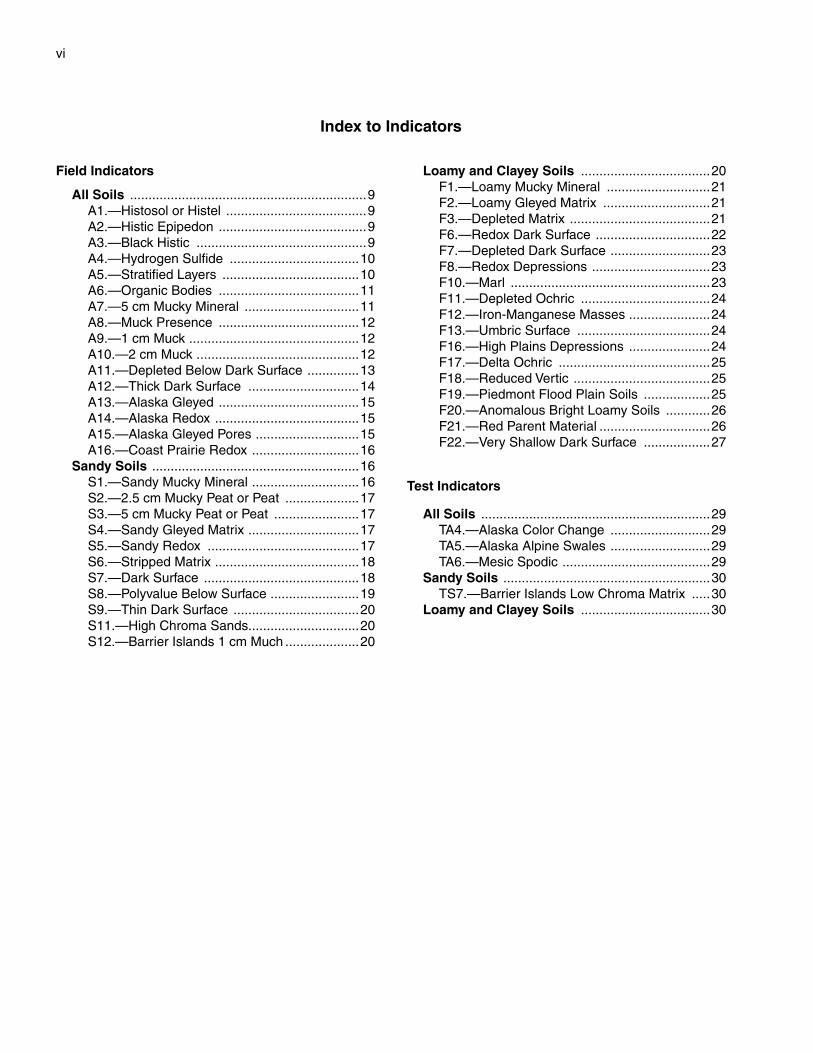
Index to Indicators
Field Indicators
All Soils ................................................................9A1.—Histosol or Histel ......................................9A2.—Histic Epipedon ........................................9A3.—Black Histic ..............................................9A4.—Hydrogen Sulfide ...................................10A5.—Stratified Layers .....................................10A6.—Organic Bodies ......................................11A7.—5 cm Mucky Mineral ...............................11A8.—Muck Presence ......................................12A9.—1 cm Muck ..............................................12A10.—2 cm Muck ............................................12A11.—Depleted Below Dark Surface ..............13A12.—Thick Dark Surface ..............................14A13.—Alaska Gleyed ......................................15A14.—Alaska Redox .......................................15A15.—Alaska Gleyed Pores ............................15A16.—Coast Prairie Redox .............................16
Sandy Soils ........................................................16S1.—Sandy Mucky Mineral .............................16S2.—2.5 cm Mucky Peat or Peat ....................17S3.—5 cm Mucky Peat or Peat .......................17S4.—Sandy Gleyed Matrix ..............................17S5.—Sandy Redox .........................................17S6.—Stripped Matrix .......................................18S7.—Dark Surface ..........................................18S8.—Polyvalue Below Surface ........................19S9.—Thin Dark Surface ..................................20S11.—High Chroma Sands..............................20S12.—Barrier Islands 1 cm Much ....................20
Loamy and Clayey Soils ...................................20F1.—Loamy Mucky Mineral ............................21F2.—Loamy Gleyed Matrix .............................21F3.—Depleted Matrix ......................................21F6.—Redox Dark Surface ...............................22F7.—Depleted Dark Surface ...........................23F8.—Redox Depressions ................................23F10.—Marl ......................................................23F11.—Depleted Ochric ...................................24F12.—Iron-Manganese Masses ......................24F13.—Umbric Surface ....................................24F16.—High Plains Depressions ......................24F17.—Delta Ochric .........................................25F18.—Reduced Vertic .....................................25F19.—Piedmont Flood Plain Soils ..................25F20.—Anomalous Bright Loamy Soils ............26F21.—Red Parent Material ..............................26F22.—Very Shallow Dark Surface ..................27
Test Indicators
All Soils ..............................................................29TA4.—Alaska Color Change ...........................29TA5.—Alaska Alpine Swales ...........................29TA6.—Mesic Spodic ........................................29
Sandy Soils ........................................................30TS7.—Barrier Islands Low Chroma Matrix .....30
Loamy and Clayey Soils ...................................30
1
Field Indicators of Hydric Soils in the United States,Version 8.0, 2016
IntroductionField Indicators of Hydric Soils in the United States
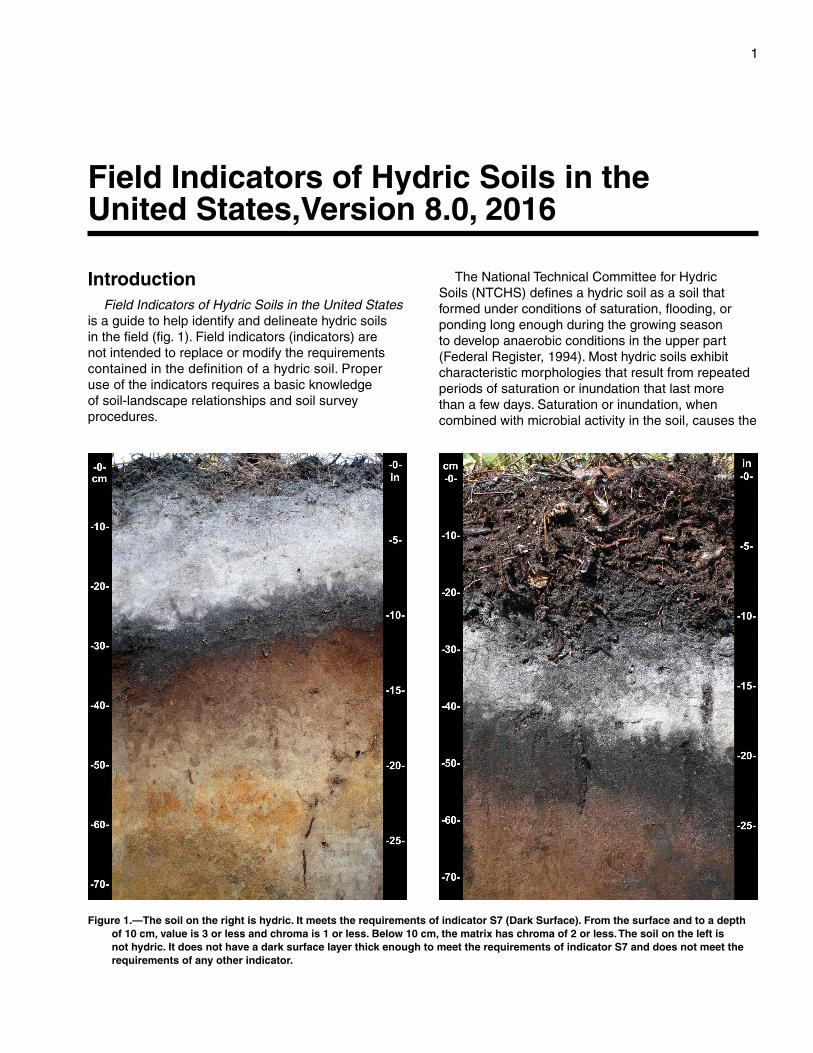
is a guide to help identify and delineate hydric soils in the field (fig. 1). Field indicators (indicators) are not intended to replace or modify the requirements contained in the definition of a hydric soil. Proper use of the indicators requires a basic knowledge of soil-landscape relationships and soil survey procedures.
Figure 1.—The soil on the right is hydric. It meets the requirements of indicator S7 (Dark Surface). From the surface and to a depth of 10 cm, value is 3 or less and chroma is 1 or less. Below 10 cm, the matrix has chroma of 2 or less. The soil on the left is not hydric. It does not have a dark surface layer thick enough to meet the requirements of indicator S7 and does not meet the requirements of any other indicator.
The National Technical Committee for Hydric Soils (NTCHS) defines a hydric soil as a soil that formed under conditions of saturation, flooding, or ponding long enough during the growing season to develop anaerobic conditions in the upper part (Federal Register, 1994). Most hydric soils exhibit characteristic morphologies that result from repeated periods of saturation or inundation that last more than a few days. Saturation or inundation, when combined with microbial activity in the soil, causes the

2 Field Indicators of
depletion of oxygen. Prolonged anaerobic conditions promote certain biogeochemical processes, such as the accumulation of organic matter and the reduction, translocation, or accumulation of iron and other reducible elements. These processes result in distinctive characteristics that persist in the soil during both wet and dry periods, making them particularly useful for identifying hydric soils in the field. The indicators are used to identify the hydric soil component of wetlands; however, there are some hydric soils that lack any of the currently listed indicators. Therefore, the lack of any listed indicator does not prevent classification of the soil as hydric. Such soils should be studied and their characteristic morphologies identified for inclusion in this guide.
The indicators are designed to be regionally specific. The description of each indicator identifies the land resource regions (LRRs) and/or major land resource areas (MLRAs) in which the indicator can be applied. The geographic extent of LRRs and MLRAs is defined in U.S. Department of Agriculture Handbook 296 (USDA, NRCS, 2006b). See the map or LRRs (fig. 6, page 7) and the list of LRR-specific indicators (Appendices 1 and 2).
The list of indicators is dynamic; changes and additions are anticipated with new research and field testing. The section “To Comment on the Indicators” provides guidance on how to recommend deletions, additions, and other changes. Any modifications to the indicators must be approved by NRCS and the NTCHS. The current version of the indicators is available on the NRCS hydric soils website (http://www.nrcs.usda.gov/wps/portal/nrcs/main/soils/use/hydric/).
ConceptHydric soil indicators are formed predominantly by
the accumulation or loss of iron, manganese, sulfur, or carbon compounds under saturated and anaerobic conditions. The processes and the soil features that develop under these conditions are described in the following paragraphs.
Iron and Manganese Reduction, Translocation, and Accumulation
In an anaerobic environment, soil microbes reduce iron from the ferric (Fe3+) to the ferrous (Fe2+) form and manganese from the manganic (Mn4+) to the manganous (Mn2+) form. Of the two, evidence of iron reduction is more commonly observed in soils. Areas in the soil where iron is reduced often develop
characteristic bluish gray or greenish gray colors known as gley (colors with value of 4 or more on the gley pages in the Munsell color book). Ferric iron is insoluble, but ferrous iron enters the soil solution, where it may be moved or translocated to other areas of the soil. Areas that have lost iron typically develop characteristic gray or reddish gray colors and are known as redox depletions. If a soil reverts to an aerobic state, iron that is in solution will oxidize and become concentrated in patches as soft masses and along root channels or other pores. These areas of oxidized iron are called redox concentrations. Since water movement in these saturated or inundated soils can be multidirectional, redox depletions and concentrations can occur anywhere in the soil and have irregular shapes and sizes. Soils that are saturated and contain ferrous iron at the time of sampling may change color upon exposure to the air, as ferrous iron is rapidly converted to ferric iron in the presence of oxygen. Such soils are said to have a reduced matrix (Vepraskas, 1994). Redox concentrations, depletions, and reduced matrixes are collectively referred to as redoximorphic features.
While indicators related to iron or manganese depletions and/or concentrations are most common in hydric soils, they cannot form in soils with parent materials that are low in Fe or Mn content. Soils that formed in such materials may have low-chroma colors that are not related to saturation and reduction. Such soils may have hydric soil morphological features that formed through accumulation of organic matter.
Sulfate Reduction
Sulfur is one of the last elements to be reduced by microbes in an anaerobic environment. The microbes convert sulfate (SO4
2-) to hydrogen sulfide gas (H2S). This conversion results in a very pronounced “rotten egg” odor in some soils that are inundated or saturated for long periods. In soils that are not saturated or inundated, sulfate is not reduced and there is no rotten egg odor. The presence of hydrogen sulfide is a strong indicator of a hydric soil, but this indicator occurs only in very wet portions of the landsscape, in soils that contain sulfur-bearing compounds.
Organic-Matter Accumulation
Soil microbes use carbon compounds that occur in organic matter as an energy source. The rate at which soil microbes use organic carbon, however, is considerably lower in a saturated and anaerobic environment than under aerobic conditions. Therefore,
3Hydric Soils
in saturated soils, partially decomposed organic matter may accumulate. The result in wetlands is often the development of thick organic surface horizons, such as peat or muck, or dark organic-rich mineral surface layers.
Determining the Texture of Soil Materials High in Organic Carbon
Soil materials fall into three categories based upon the organic carbon content: organic soil, mucky mineral soil, and mineral soil. In lieu of laboratory data, the following field estimation method can be used to categorize soil material that is wet or nearly saturated with water. This method may be inconclusive with loamy or clayey mineral soils. Gently rub the wet soil material between forefinger and thumb. If upon the first or second rub the material feels gritty, it is mineral soil material. If after the second rub the material feels greasy, it is either mucky mineral or organic soil material. Gently rub the material two or three more times. If after these additional rubs it feels gritty or plastic, it is mucky mineral soil material; if it still feels greasy, it is organic soil material.
If the material is organic soil material, a further division should be made. Organic soil materials are classified as muck, mucky peat, or peat. Differentiating criteria are based on the percentage of visible fibers observable with a hand lens in an undisturbed state and after rubbing between thumb and fingers 10 times. Muck, mucky peat, and peat correspond to the textures sapric, hemic, and fibric. If there is a conflict between unrubbed and rubbed fiber content, rubbed content is used. Live roots are not considered.
Cautions
A soil that is drained or protected (for instance, by dikes or levees) meets the definition of a hydric soil if the upper part formed under anaerobic conditions in an unaltered state. Drained or protected hydric soils generally have one or more of the indicators. Not all areas that have hydric soils qualify as wetlands. For example, a soil that formed under anaerobic conditions but no longer has wetland hydrology or supports hydrophytic vegetation still meets the definition of a hydric soil. However, the area will not meet the requirements of a wetland determined by the three factor approach (presence of hydric soils, wetland hydrology, and hydrophytic vegetation).
There are hydric soils with morphologies that are difficult to interpret. These include soils with black, gray, or red parent material; soils with high pH; soils
high or low in content of organic matter; recently developed hydric soils; and soils high in iron inputs. In some cases we do not currently have indicators to assist in the identification of hydric soils in these situations. As long as the soil meets the definition of a hydric soil, the lack of an indicator does not preclude the soil from being hydric.
The indicators were developed mostly to identify the boundary of hydric soil areas and generally work best on the margins. For example, redoximorphic features are most likely to occur in soils that cycle between anaerobic (reduced) and aerobic (oxidized) conditions. In some cases, portions of an area under near-constant saturation will not display an indicator.
Morphological features of hydric soils indicate that saturation and anaerobic conditions have existed under either contemporary or former hydrologic regimes. Where soil morphology seems inconsistent with the landscape, vegetation, or observable hydrology, it may be necessary to obtain the assistance of an experienced soil or wetland scientist to determine whether the soil is hydric.
Procedure
Observe and Document the Site
Before making any decision about the presence or absence of hydric soils, the overall site and how it interacts with the soil should be considered. The steps below, while not required to identify a hydric soil, can help to explain why a hydric soil is or is not present. Always look at the landscape features of the immediate site and compare them to the surrounding areas. Try to contrast the features of wet and dry sites that are in close proximity. When observing slope features, look first at the area immediately around the sampling point. For example, a nearly level bench or depression at the sampling point may be more important to the wetness of the site than the overall landform on which the bench or depression occurs. Understanding how water moves across the site helps to clarify the reasons for the presence or absence of hydric soil indicators.
Observe and Document the Soil
To observe and document a hydric soil, first remove from the soil surface any woody material larger than 2 cm in cross section that cannot be crushed or shredded when rubbed. Do not remove the organic surface layers of the soil, which generally consist of plant remains in various stages of decomposition. Dig
4 Field Indicators of
a hole and describe the soil profile. In general, the hole should be dug to the depth needed to document an indicator or to confirm the absence of indicators. For most soils, the recommended excavation depth is approximately 20 inches (50 cm) from the soil surface, although a shallower soil pit may suffice for some indicators (e.g., A2, Histic Epipedon). Digging may be difficult in some areas because of rocks or hardpans. Use the completed profile description to determine which hydric soil indicators have been met (USDA, NRCS, 2006a).
For soils with thick, dark surface layers, deeper examination may be required when field indicators are not observed at a depth of ≤20 inches (50 cm) from the soil surface. The accumulation of organic matter in these soils may mask redoximorphic features in the surface layers. Examination to a depth of 40 inches (1 m) or more may be needed to determine whether the soils meet the requirements of indicator A12 (Thick Dark Surface). A soil auger or probe may be useful for sampling soil materials below a depth of 20 inches.
Whenever possible, excavate the soil deep enough to determine if there are layers or materials present that might restrict soil drainage. This determination will help to indicate why the soil may or may not be hydric. After a sufficient number of exploratory excavations have been made to determine the soil hydrologic relationships at the site, subsequent excavations can be limited to the depth needed to identify hydric soil indicators. Consider taking photographs of both the soil and the overall site, including a clearly marked measurement scale in pictures of soil profiles.
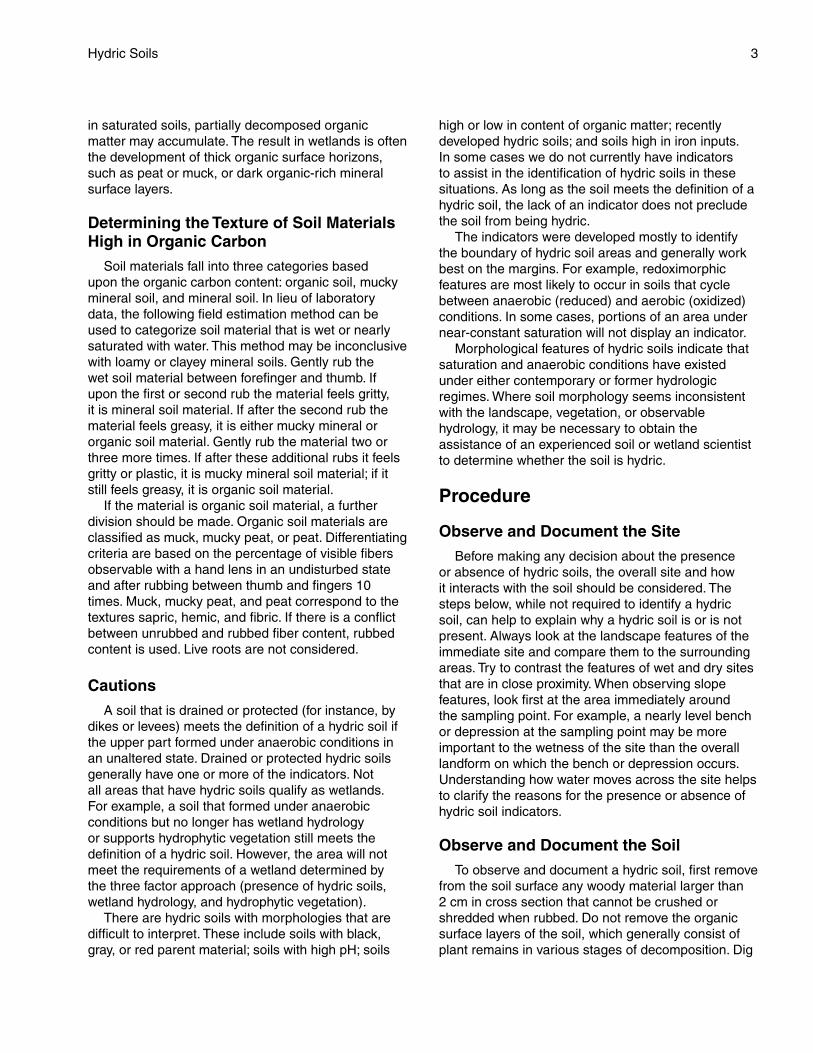
In LRRs R, W, X, and Y, start observations at the actual surface for indicators A1, A2, and A3; start observations at the muck or mineral surface for A11 and A12 and for testing indicators that allow muck; and start observations at the mineral surface for all other indicators. In LRRs F, G, H, and M, start observations at the actual soil surface if the soil is sandy or when applying indicators A1, A2, and A3 and at the muck or mineral surface for the remaining field indicators. In the remaining LRRs, start observations at the top of the muck or mineral surface (underneath any peat and/or mucky peat material), except for areas of indicators A1, A2, and A3, where observations begin at the actual soil surface (fig. 2 ).
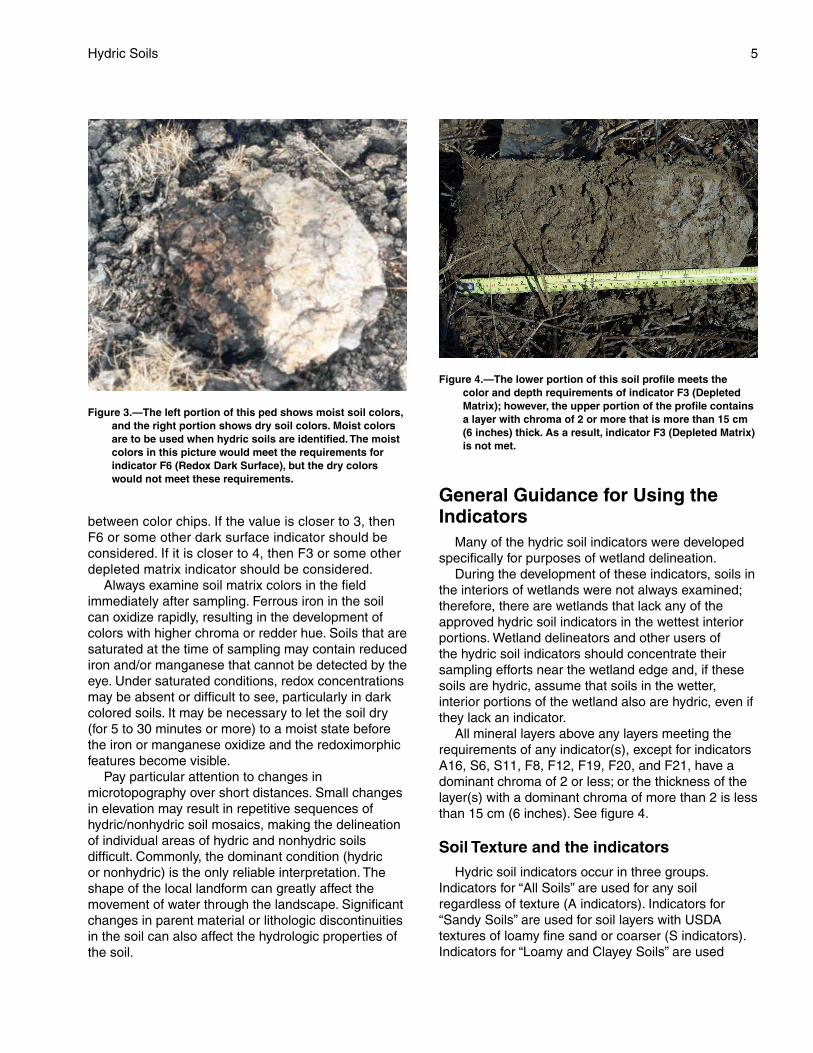
All colors noted in this guide refer to moist Munsell colors (X-Rite, 2009). Dry soils should be moistened until the color no longer changes, and wet soils should be allowed to dry until they no longer glisten (fig. 3). Care should be taken to avoid over-moistening dry soil.
Figure 2.— The soil profile above consists of an 8 cm (3.14 inches) layer of peat and/or mucky peat underlain by a 1 cm (0.4 inches) layer of muck. The remaining soil layers are sandy soil material. In LRRs R, W, X, and Y, observations would begin below the peat, mucky peat, and muck layers (9 cm). In LRRs, F, G, H, and M, observations would start at the actual soil surface. In all remaining LRRs, observations would begin at the muck surface (8 cm).
Soil chromas specified in the indicators do not have decimal points; however, intermediate colors do occur. Colors should not be rounded to make the chroma meet the requirements of an indicator. A soil matrix with chroma between 2 and 3 should be described as having chroma of 2+. It does not have chroma of 2 and would not meet the requirements of any indicator that requires chroma of 2 or less. Value should be rounded to the nearest color chip when using the indicators. For example, a color in between a value of 3 and 4 should be rounded and not excluded from meeting either F3 Depleted Matrix or F6 Redox Dark Surface because the color occurs
5Hydric Soils
between color chips. If the value is closer to 3, then F6 or some other dark surface indicator should be considered. If it is closer to 4, then F3 or some other depleted matrix indicator should be considered.
Always examine soil matrix colors in the field immediately after sampling. Ferrous iron in the soil can oxidize rapidly, resulting in the development of colors with higher chroma or redder hue. Soils that are saturated at the time of sampling may contain reduced iron and/or manganese that cannot be detected by the eye. Under saturated conditions, redox concentrations may be absent or difficult to see, particularly in dark colored soils. It may be necessary to let the soil dry (for 5 to 30 minutes or more) to a moist state before the iron or manganese oxidize and the redoximorphic features become visible.
Pay particular attention to changes in microtopography over short distances. Small changes in elevation may result in repetitive sequences of hydric/nonhydric soil mosaics, making the delineation of individual areas of hydric and nonhydric soils difficult. Commonly, the dominant condition (hydric or nonhydric) is the only reliable interpretation. The shape of the local landform can greatly affect the movement of water through the landscape. Significant changes in parent material or lithologic discontinuities in the soil can also affect the hydrologic properties of the soil.
Figure 3.—The left portion of this ped shows moist soil colors, and the right portion shows dry soil colors. Moist colors are to be used when hydric soils are identified. The moist colors in this picture would meet the requirements for indicator F6 (Redox Dark Surface), but the dry colors would not meet these requirements.
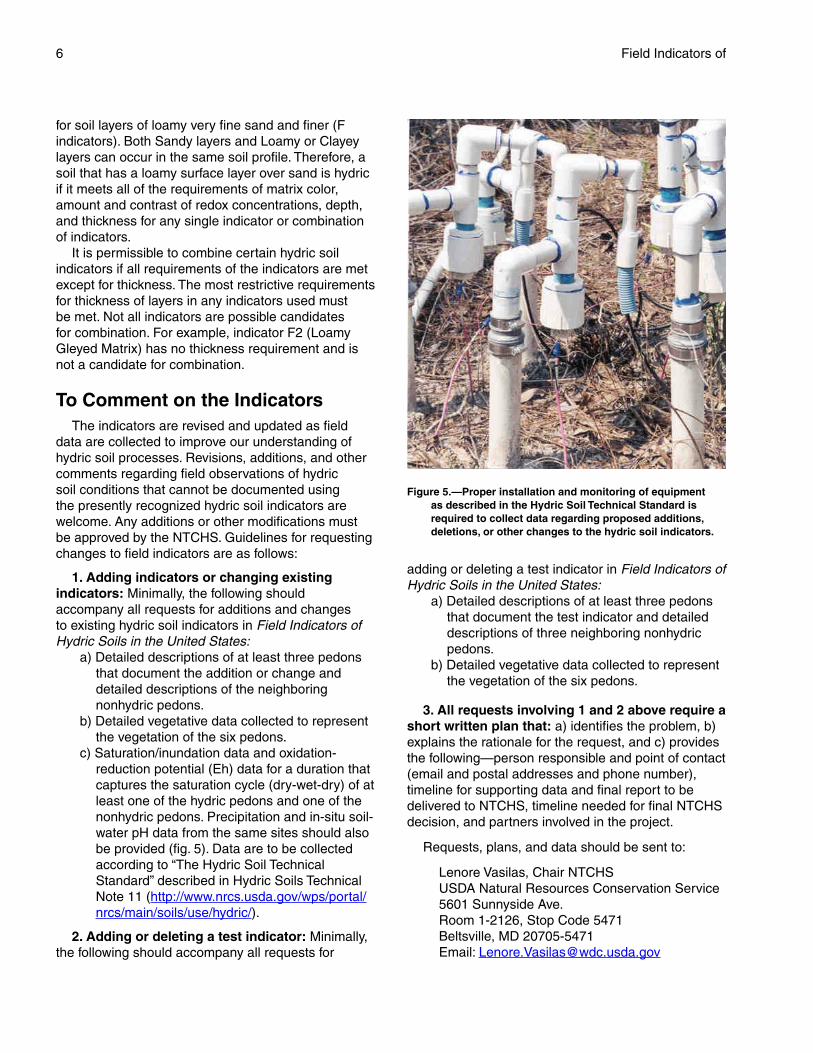
Figure 4.—The lower portion of this soil profile meets the color and depth requirements of indicator F3 (Depleted Matrix); however, the upper portion of the profile contains a layer with chroma of 2 or more that is more than 15 cm (6 inches) thick. As a result, indicator F3 (Depleted Matrix) is not met.
General Guidance for Using the Indicators
Many of the hydric soil indicators were developed specifically for purposes of wetland delineation.
During the development of these indicators, soils in the interiors of wetlands were not always examined; therefore, there are wetlands that lack any of the approved hydric soil indicators in the wettest interior portions. Wetland delineators and other users of the hydric soil indicators should concentrate their sampling efforts near the wetland edge and, if these soils are hydric, assume that soils in the wetter, interior portions of the wetland also are hydric, even if they lack an indicator.
All mineral layers above any layers meeting the requirements of any indicator(s), except for indicators A16, S6, S11, F8, F12, F19, F20, and F21, have a dominant chroma of 2 or less; or the thickness of the layer(s) with a dominant chroma of more than 2 is less than 15 cm (6 inches). See figure 4.
Soil Texture and the indicators
Hydric soil indicators occur in three groups. Indicators for “All Soils” are used for any soil regardless of texture (A indicators). Indicators for “Sandy Soils” are used for soil layers with USDA textures of loamy fine sand or coarser (S indicators). Indicators for “Loamy and Clayey Soils” are used
6 Field Indicators of
for soil layers of loamy very fine sand and finer (F indicators). Both Sandy layers and Loamy or Clayey layers can occur in the same soil profile. Therefore, a soil that has a loamy surface layer over sand is hydric if it meets all of the requirements of matrix color, amount and contrast of redox concentrations, depth, and thickness for any single indicator or combination of indicators.
It is permissible to combine certain hydric soil indicators if all requirements of the indicators are met except for thickness. The most restrictive requirements for thickness of layers in any indicators used must be met. Not all indicators are possible candidates for combination. For example, indicator F2 (Loamy Gleyed Matrix) has no thickness requirement and is not a candidate for combination.
To Comment on the IndicatorsThe indicators are revised and updated as field
data are collected to improve our understanding of hydric soil processes. Revisions, additions, and other comments regarding field observations of hydric soil conditions that cannot be documented using the presently recognized hydric soil indicators are welcome. Any additions or other modifications must be approved by the NTCHS. Guidelines for requesting changes to field indicators are as follows:
1. Adding indicators or changing existing indicators: Minimally, the following should accompany all requests for additions and changes to existing hydric soil indicators in Field Indicators of Hydric Soils in the United States:
a) Detailed descriptions of at least three pedons that document the addition or change and detailed descriptions of the neighboring nonhydric pedons.
b) Detailed vegetative data collected to represent the vegetation of the six pedons.
c) Saturation/inundation data and oxidation-reduction potential (Eh) data for a duration that captures the saturation cycle (dry-wet-dry) of at least one of the hydric pedons and one of the nonhydric pedons. Precipitation and in-situ soil-water pH data from the same sites should also be provided (fig. 5). Data are to be collected according to “The Hydric Soil Technical Standard” described in Hydric Soils Technical Note 11 (http://www.nrcs.usda.gov/wps/portal/nrcs/main/soils/use/hydric/).
2. Adding or deleting a test indicator: Minimally, the following should accompany all requests for
Figure 5. —Proper installation and monitoring of equipment as described in the Hydric Soil Technical Standard is required to collect data regarding proposed additions, deletions, or other changes to the hydric soil indicators.
adding or deleting a test indicator in Field Indicators of Hydric Soils in the United States:
a) Detailed descriptions of at least three pedons that document the test indicator and detailed descriptions of three neighboring nonhydric pedons.
b) Detailed vegetative data collected to represent the vegetation of the six pedons.
3. All requests involving 1 and 2 above require a short written plan that: a) identifies the problem, b) explains the rationale for the request, and c) provides the following—person responsible and point of contact (email and postal addresses and phone number), timeline for supporting data and final report to be delivered to NTCHS, timeline needed for final NTCHS decision, and partners involved in the project.
Requests, plans, and data should be sent to:
Lenore Vasilas, Chair NTCHS USDA Natural Resources Conservation Service5601 Sunnyside Ave.Room 1-2126, Stop Code 5471Beltsville, MD 20705-5471Email: [email protected]

7H
ydric Soils
Fig
ure 6.—
Map
of U
SD
A lan
d reso
urce reg
ion
s.

9
Field Indicators of Hydric Soils
The indicator descriptions in this section are structured as follows:
1. Alpha-numeric listing (A, S, or F indicators)2. Short name3. Applicable land resource regions (LRRs)4. Description of the field indicator5. User notes
For example, A2 is the alpha numeric listing for the second indicator for All Soils; Histic Epipedon is the short name; “For use in all LRRs” indicates the applicable LRRs; and “a histic epipedon underlain by mineral soil material with chroma of 2 or less” is the description. The helpful user notes follow the indicator.
All Soils“All Soils” refers to soils with any USDA soil texture.
All mineral layers above any of the layers meeting the requirements of any A indicator(s), except for indicator A16, have a dominant chroma of 2 or less, or the thickness of the layer(s) with a dominant chroma of more than 2 is less than 15 cm (6 inches). In addition, nodules and concretions are not considered to be redox concentrations for the application of the indicators. Use the following A-indicators in all soil layers, regardless of texture.
A1.—Histosol (for use in all LRRs) or Histel (for use in LRRs with permafrost). Classifies as a Histosol (except Folist) or as a Histel (except Folistel).
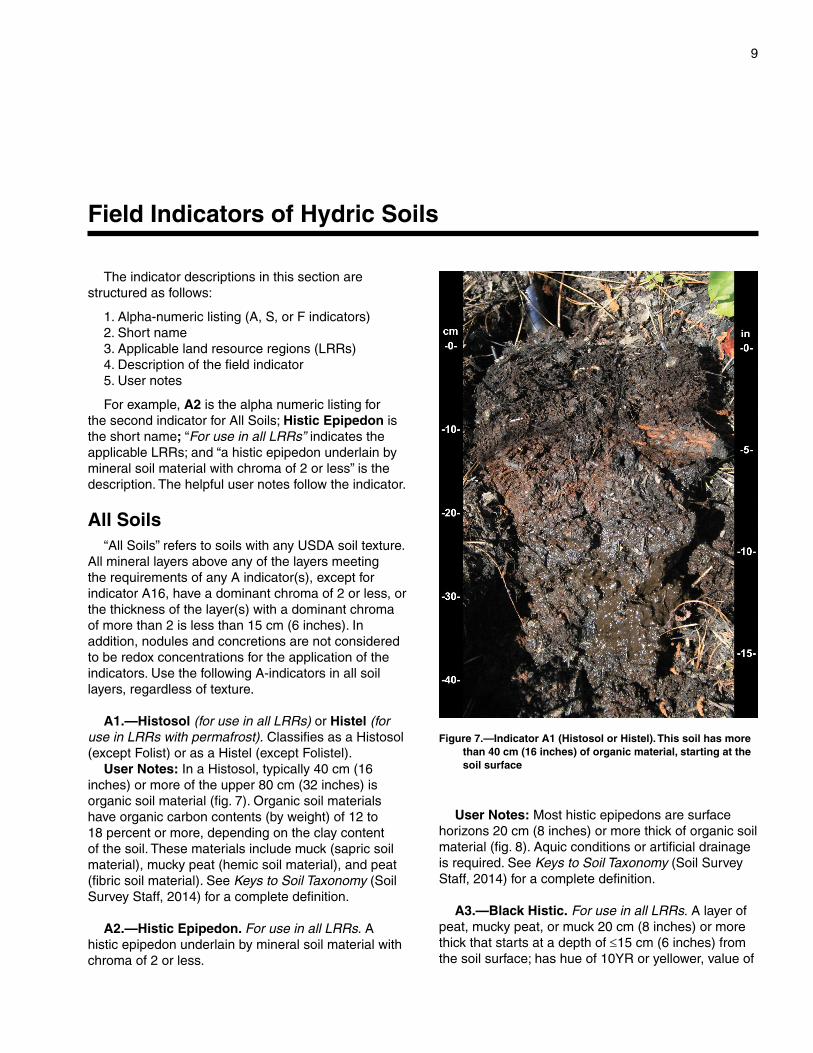
User Notes: In a Histosol, typically 40 cm (16 inches) or more of the upper 80 cm (32 inches) is organic soil material (fig. 7). Organic soil materials have organic carbon contents (by weight) of 12 to 18 percent or more, depending on the clay content of the soil. These materials include muck (sapric soil material), mucky peat (hemic soil material), and peat (fibric soil material). See Keys to Soil Taxonomy (Soil Survey Staff, 2014) for a complete definition.
A2.—Histic Epipedon. For use in all LRRs. A histic epipedon underlain by mineral soil material with chroma of 2 or less.
Figure 7.—Indicator A1 (Histosol or Histel). This soil has more than 40 cm (16 inches) of organic material, starting at the soil surface
User Notes: Most histic epipedons are surface horizons 20 cm (8 inches) or more thick of organic soil material (fig. 8). Aquic conditions or artificial drainage is required. See Keys to Soil Taxonomy (Soil Survey Staff, 2014) for a complete definition.
A3.—Black Histic. For use in all LRRs. A layer of peat, mucky peat, or muck 20 cm (8 inches) or more thick that starts at a depth of ≤15 cm (6 inches) from the soil surface; has hue of 10YR or yellower, value of
10 Field Indicators of
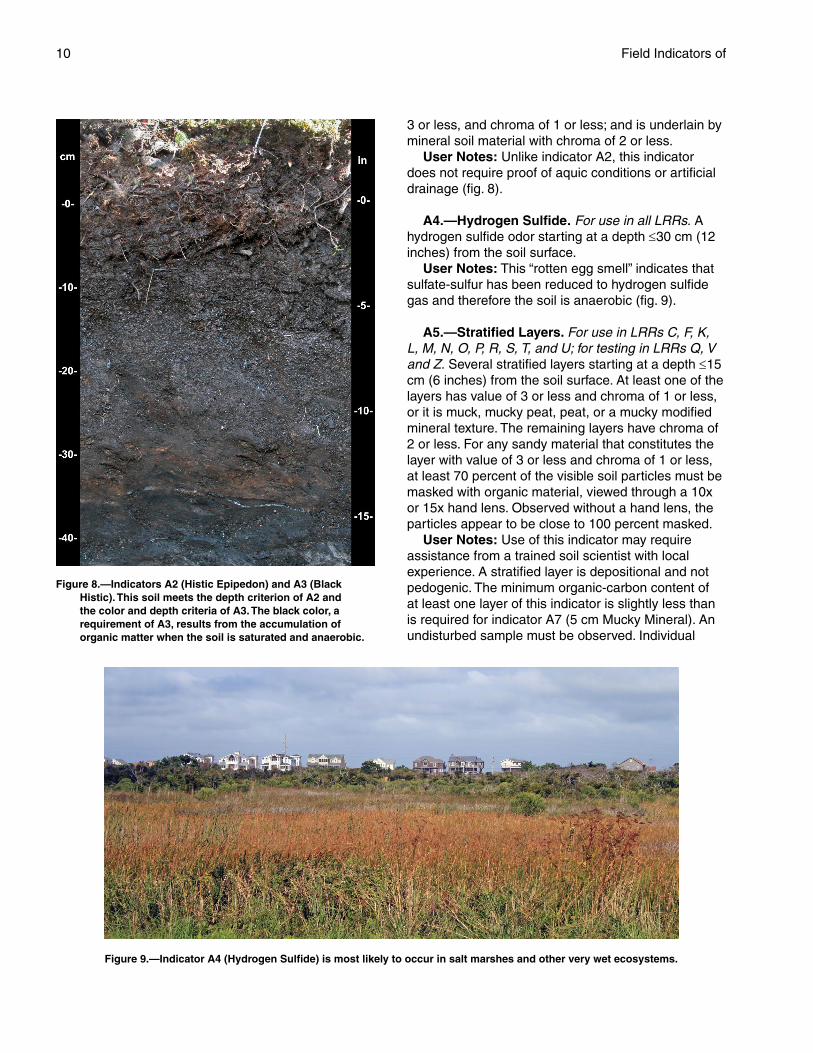
Figure 8.—Indicators A2 (Histic Epipedon) and A3 (Black Histic). This soil meets the depth criterion of A2 and the color and depth criteria of A3. The black color, a requirement of A3, results from the accumulation of organic matter when the soil is saturated and anaerobic.
3 or less, and chroma of 1 or less; and is underlain by mineral soil material with chroma of 2 or less.
User Notes: Unlike indicator A2, this indicator does not require proof of aquic conditions or artificial drainage (fig. 8).
A4.—Hydrogen Sulfide. For use in all LRRs. A hydrogen sulfide odor starting at a depth ≤30 cm (12 inches) from the soil surface.
User Notes: This “rotten egg smell” indicates that sulfate-sulfur has been reduced to hydrogen sulfide gas and therefore the soil is anaerobic (fig. 9).
A5.—Stratified Layers. For use in LRRs C, F, K, L, M, N, O, P, R, S, T, and U; for testing in LRRs Q, V and Z. Several stratified layers starting at a depth ≤15 cm (6 inches) from the soil surface. At least one of the layers has value of 3 or less and chroma of 1 or less, or it is muck, mucky peat, peat, or a mucky modified mineral texture. The remaining layers have chroma of 2 or less. For any sandy material that constitutes the layer with value of 3 or less and chroma of 1 or less, at least 70 percent of the visible soil particles must be masked with organic material, viewed through a 10x or 15x hand lens. Observed without a hand lens, the particles appear to be close to 100 percent masked.
User Notes: Use of this indicator may require assistance from a trained soil scientist with local experience. A stratified layer is depositional and not pedogenic. The minimum organic-carbon content of at least one layer of this indicator is slightly less than is required for indicator A7 (5 cm Mucky Mineral). An undisturbed sample must be observed. Individual
Figure 9. —Indicator A4 (Hydrogen Sulfide) is most likely to occur in salt marshes and other very wet ecosystems.
11Hydric Soils
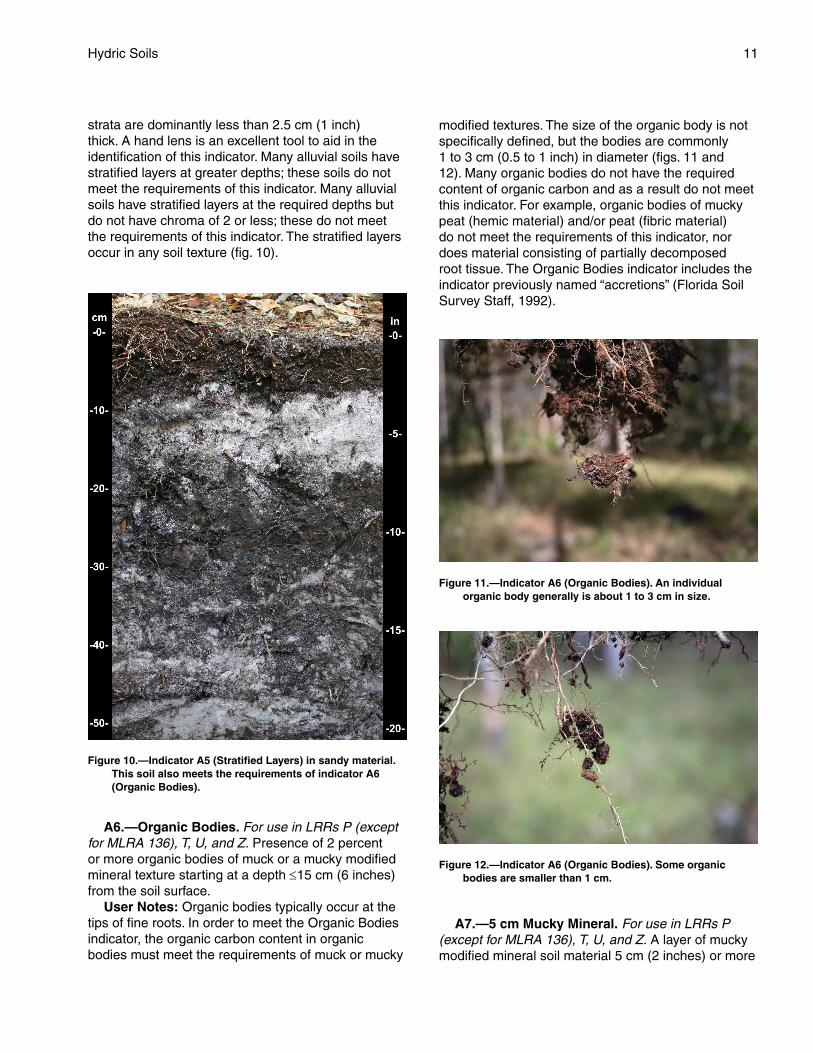
strata are dominantly less than 2.5 cm (1 inch) thick. A hand lens is an excellent tool to aid in the identification of this indicator. Many alluvial soils have stratified layers at greater depths; these soils do not meet the requirements of this indicator. Many alluvial soils have stratified layers at the required depths but do not have chroma of 2 or less; these do not meet the requirements of this indicator. The stratified layers occur in any soil texture (fig. 10).
Figure 10.—Indicator A5 (Stratified Layers) in sandy material. This soil also meets the requirements of indicator A6 (Organic Bodies).
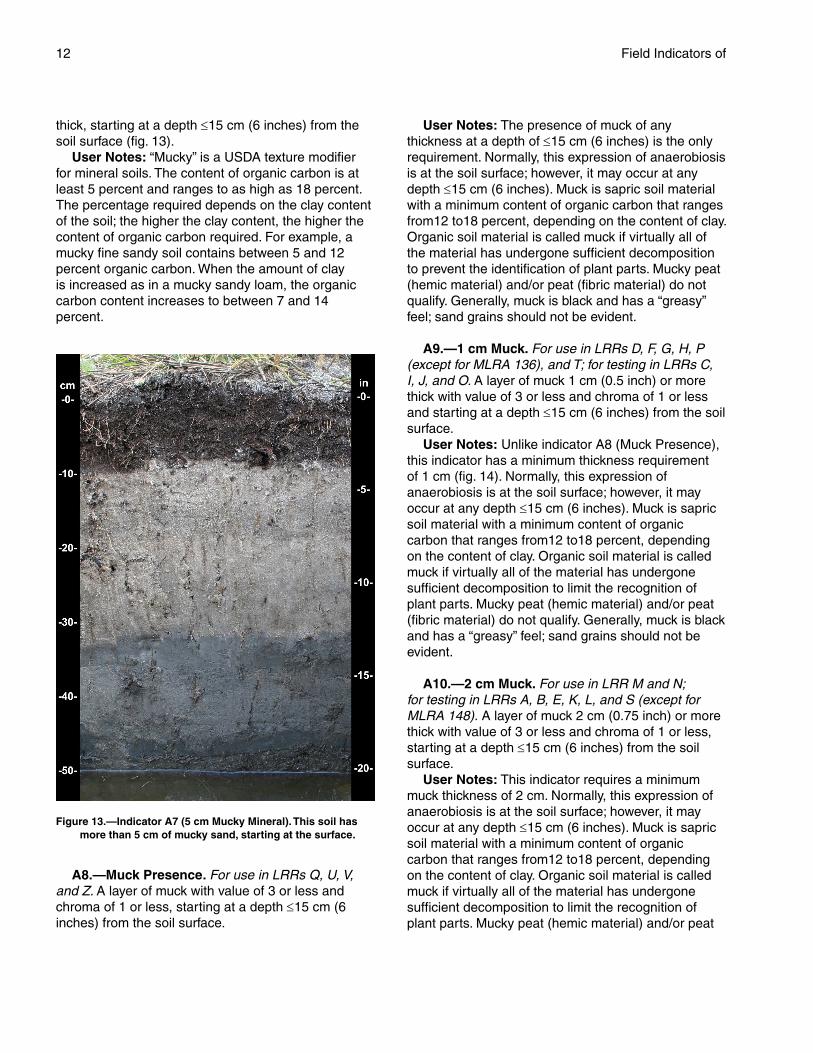
A6.—Organic Bodies. For use in LRRs P (except for MLRA 136), T, U, and Z. Presence of 2 percent or more organic bodies of muck or a mucky modified mineral texture starting at a depth ≤15 cm (6 inches) from the soil surface.
User Notes: Organic bodies typically occur at the tips of fine roots. In order to meet the Organic Bodies indicator, the organic carbon content in organic bodies must meet the requirements of muck or mucky
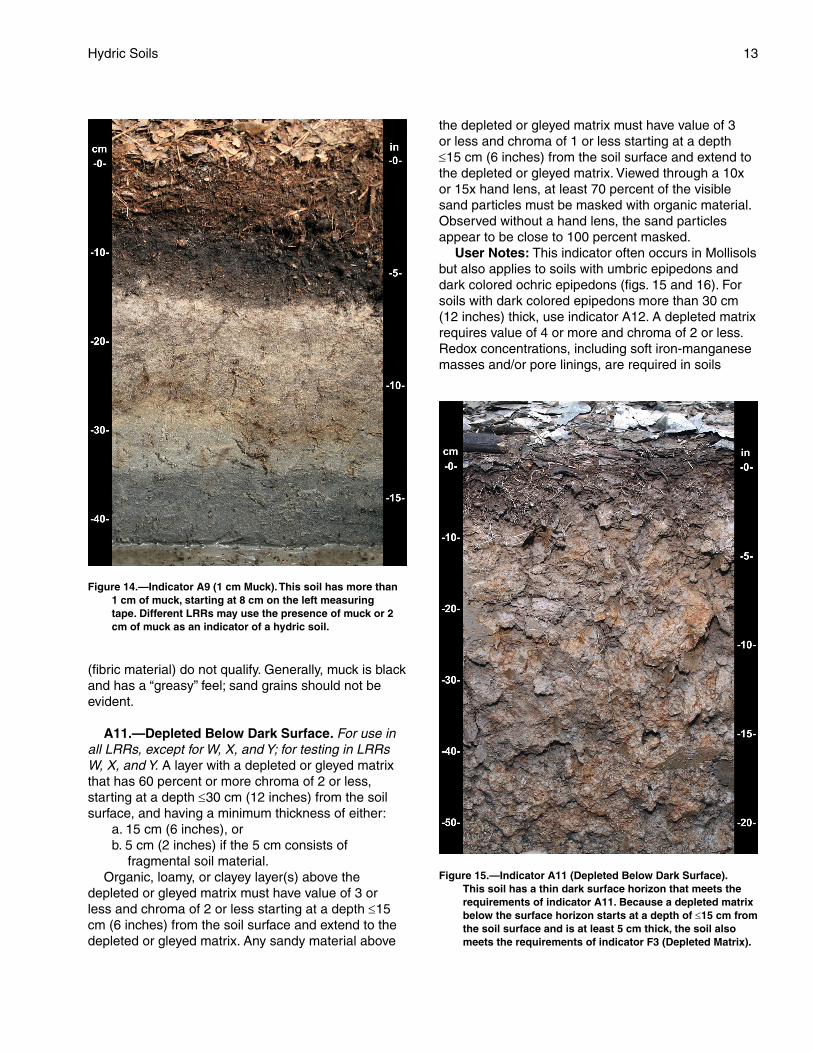
modified textures. The size of the organic body is not specifically defined, but the bodies are commonly 1 to 3 cm (0.5 to 1 inch) in diameter (figs. 11 and 12). Many organic bodies do not have the required content of organic carbon and as a result do not meet this indicator. For example, organic bodies of mucky peat (hemic material) and/or peat (fibric material) do not meet the requirements of this indicator, nor does material consisting of partially decomposed root tissue. The Organic Bodies indicator includes the indicator previously named “accretions” (Florida Soil Survey Staff, 1992).
Figure 11. —Indicator A6 (Organic Bodies). An individual organic body generally is about 1 to 3 cm in size.
Figure 12. —Indicator A6 (Organic Bodies). Some organic bodies are smaller than 1 cm.
A7.—5 cm Mucky Mineral. For use in LRRs P (except for MLRA 136), T, U, and Z. A layer of mucky modified mineral soil material 5 cm (2 inches) or more
12 Field Indicators of
thick, starting at a depth ≤15 cm (6 inches) from the soil surface (fig. 13).
User Notes: “Mucky” is a USDA texture modifier for mineral soils. The content of organic carbon is at least 5 percent and ranges to as high as 18 percent. The percentage required depends on the clay content of the soil; the higher the clay content, the higher the content of organic carbon required. For example, a mucky fine sandy soil contains between 5 and 12 percent organic carbon. When the amount of clay is increased as in a mucky sandy loam, the organic carbon content increases to between 7 and 14 percent.
Figure 13.—Indicator A7 (5 cm Mucky Mineral). This soil has more than 5 cm of mucky sand, starting at the surface.
A8.—Muck Presence. For use in LRRs Q, U, V, and Z. A layer of muck with value of 3 or less and chroma of 1 or less, starting at a depth ≤15 cm (6 inches) from the soil surface.
User Notes: The presence of muck of any thickness at a depth of ≤15 cm (6 inches) is the only requirement. Normally, this expression of anaerobiosis is at the soil surface; however, it may occur at any depth ≤15 cm (6 inches). Muck is sapric soil material with a minimum content of organic carbon that ranges from12 to18 percent, depending on the content of clay. Organic soil material is called muck if virtually all of the material has undergone sufficient decomposition to prevent the identification of plant parts. Mucky peat (hemic material) and/or peat (fibric material) do not qualify. Generally, muck is black and has a “greasy” feel; sand grains should not be evident.
A9.—1 cm Muck. For use in LRRs D, F, G, H, P (except for MLRA 136), and T; for testing in LRRs C, I, J, and O. A layer of muck 1 cm (0.5 inch) or more thick with value of 3 or less and chroma of 1 or less and starting at a depth ≤15 cm (6 inches) from the soil surface.
User Notes: Unlike indicator A8 (Muck Presence), this indicator has a minimum thickness requirement of 1 cm (fig. 14). Normally, this expression of anaerobiosis is at the soil surface; however, it may occur at any depth ≤15 cm (6 inches). Muck is sapric soil material with a minimum content of organic carbon that ranges from12 to18 percent, depending on the content of clay. Organic soil material is called muck if virtually all of the material has undergone sufficient decomposition to limit the recognition of plant parts. Mucky peat (hemic material) and/or peat (fibric material) do not qualify. Generally, muck is black and has a “greasy” feel; sand grains should not be evident.
A10.—2 cm Muck. For use in LRR M and N; for testing in LRRs A, B, E, K, L, and S (except for MLRA 148). A layer of muck 2 cm (0.75 inch) or more thick with value of 3 or less and chroma of 1 or less, starting at a depth ≤15 cm (6 inches) from the soil surface.
User Notes: This indicator requires a minimum muck thickness of 2 cm. Normally, this expression of anaerobiosis is at the soil surface; however, it may occur at any depth ≤15 cm (6 inches). Muck is sapric soil material with a minimum content of organic carbon that ranges from12 to18 percent, depending on the content of clay. Organic soil material is called muck if virtually all of the material has undergone sufficient decomposition to limit the recognition of plant parts. Mucky peat (hemic material) and/or peat
13Hydric Soils
(fibric material) do not qualify. Generally, muck is black and has a “greasy” feel; sand grains should not be evident.
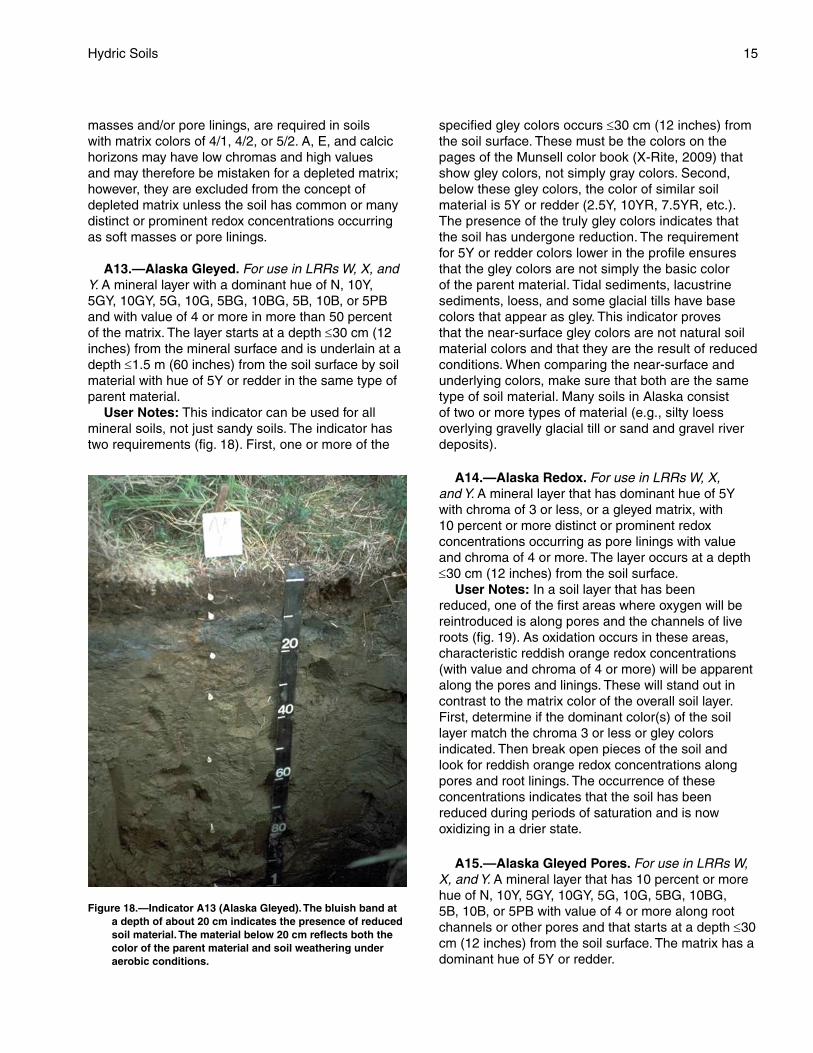
A11.—Depleted Below Dark Surface. For use in all LRRs, except for W, X, and Y; for testing in LRRs W, X, and Y. A layer with a depleted or gleyed matrix that has 60 percent or more chroma of 2 or less, starting at a depth ≤30 cm (12 inches) from the soil surface, and having a minimum thickness of either:
a. 15 cm (6 inches), or b. 5 cm (2 inches) if the 5 cm consists of
fragmental soil material.Organic, loamy, or clayey layer(s) above the
depleted or gleyed matrix must have value of 3 or less and chroma of 2 or less starting at a depth ≤15 cm (6 inches) from the soil surface and extend to the depleted or gleyed matrix. Any sandy material above
the depleted or gleyed matrix must have value of 3 or less and chroma of 1 or less starting at a depth ≤15 cm (6 inches) from the soil surface and extend to the depleted or gleyed matrix. Viewed through a 10x or 15x hand lens, at least 70 percent of the visible sand particles must be masked with organic material. Observed without a hand lens, the sand particles appear to be close to 100 percent masked.
User Notes: This indicator often occurs in Mollisols but also applies to soils with umbric epipedons and dark colored ochric epipedons (figs. 15 and 16). For soils with dark colored epipedons more than 30 cm (12 inches) thick, use indicator A12. A depleted matrix requires value of 4 or more and chroma of 2 or less. Redox concentrations, including soft iron-manganese masses and/or pore linings, are required in soils
Figure 14.—Indicator A9 (1 cm Muck). This soil has more than 1 cm of muck, starting at 8 cm on the left measuring tape. Different LRRs may use the presence of muck or 2 cm of muck as an indicator of a hydric soil.
Figure 15.—Indicator A11 (Depleted Below Dark Surface). This soil has a thin dark surface horizon that meets the requirements of indicator A11. Because a depleted matrix below the surface horizon starts at a depth of ≤15 cm from the soil surface and is at least 5 cm thick, the soil also meets the requirements of indicator F3 (Depleted Matrix).

14 Field Indicators of
with matrix colors of 4/1, 4/2, or 5/2. A, E, and calcic horizons may have low chromas and high values and may therefore be mistaken for a depleted matrix; however, they are excluded from the concept of depleted matrix unless the soil has common or many distinct or prominent redox concentrations occurring as soft masses or pore linings.
A12.—Thick Dark Surface. For use in all LRRs. A layer at least 15 cm (6 inches) thick with a depleted or gleyed matrix that has 60 percent or more chroma of 2 or less starting below 30 cm (12 inches) of the surface. The layer(s) above the depleted or gleyed matrix and starting at a depth ≤15 cm (6 inches) from the soil surface must have value of 2.5 or less and
chroma of 1 or less to a depth of at least 30 cm (12 inches) and value of 3 or less and chroma of 1 or less in any remaining layers above the depleted or gleyed matrix. In any sandy material above the depleted or gleyed matrix, at least 70 percent of the visible soil particles must be masked with organic material, viewed through a 10x or 15x hand lens. Observed without a hand lens, the particles appear to be close to 100 percent masked.
User Notes: This indicator applies to soils that have a black layer 30 cm (12 inches) or more thick and have value of 3 or less and chroma of 1 or less in any remaining layers directly above a depleted or gleyed matrix (fig. 17). This indicator is most often associated with overthickened soils in concave landscape positions. A depleted matrix requires value of 4 or more and chroma of 2 or less. Redox concentrations, including soft iron-manganese
Figure 16.—Indicator A11 (Depleted Below Dark Surface). This soil has a thick dark surface horizon that meets the requirements of indicator A11. Unlike the matrix in figure 15, the depleted matrix below the dark surface horizon in this soil starts at a depth of about 29 cm, which is too deep to meet the requirements of indicator F3 (Depleted Matrix). Indicator A11 allows a deeper depleted matrix than indicator F3.
Figure 17.—Indicator A12 (Thick Dark Surface). Deep observation is needed to determine whether a soil meets the requirements of this indicator. In this soil, depth to the depleted matrix is about 55 cm.
15Hydric Soils
masses and/or pore linings, are required in soils with matrix colors of 4/1, 4/2, or 5/2. A, E, and calcic horizons may have low chromas and high values and may therefore be mistaken for a depleted matrix; however, they are excluded from the concept of depleted matrix unless the soil has common or many distinct or prominent redox concentrations occurring as soft masses or pore linings.
A13.—Alaska Gleyed. For use in LRRs W, X, and Y. A mineral layer with a dominant hue of N, 10Y, 5GY, 10GY, 5G, 10G, 5BG, 10BG, 5B, 10B, or 5PB and with value of 4 or more in more than 50 percent of the matrix. The layer starts at a depth ≤30 cm (12 inches) from the mineral surface and is underlain at a depth ≤1.5 m (60 inches) from the soil surface by soil material with hue of 5Y or redder in the same type of parent material.
User Notes: This indicator can be used for all mineral soils, not just sandy soils. The indicator has two requirements (fig. 18). First, one or more of the
Figure 18. —Indicator A13 (Alaska Gleyed). The bluish band at a depth of about 20 cm indicates the presence of reduced soil material. The material below 20 cm reflects both the color of the parent material and soil weathering under aerobic conditions.
specified gley colors occurs ≤30 cm (12 inches) from the soil surface. These must be the colors on the pages of the Munsell color book (X-Rite, 2009) that show gley colors, not simply gray colors. Second, below these gley colors, the color of similar soil material is 5Y or redder (2.5Y, 10YR, 7.5YR, etc.). The presence of the truly gley colors indicates that the soil has undergone reduction. The requirement for 5Y or redder colors lower in the profile ensures that the gley colors are not simply the basic color of the parent material. Tidal sediments, lacustrine sediments, loess, and some glacial tills have base colors that appear as gley. This indicator proves that the near-surface gley colors are not natural soil material colors and that they are the result of reduced conditions. When comparing the near-surface and underlying colors, make sure that both are the same type of soil material. Many soils in Alaska consist of two or more types of material (e.g., silty loess overlying gravelly glacial till or sand and gravel river deposits).
A14.—Alaska Redox. For use in LRRs W, X, and Y. A mineral layer that has dominant hue of 5Y with chroma of 3 or less, or a gleyed matrix, with 10 percent or more distinct or prominent redox concentrations occurring as pore linings with value and chroma of 4 or more. The layer occurs at a depth ≤30 cm (12 inches) from the soil surface.
User Notes: In a soil layer that has been reduced, one of the first areas where oxygen will be reintroduced is along pores and the channels of live roots (fig. 19). As oxidation occurs in these areas, characteristic reddish orange redox concentrations (with value and chroma of 4 or more) will be apparent along the pores and linings. These will stand out in contrast to the matrix color of the overall soil layer. First, determine if the dominant color(s) of the soil layer match the chroma 3 or less or gley colors indicated. Then break open pieces of the soil and look for reddish orange redox concentrations along pores and root linings. The occurrence of these concentrations indicates that the soil has been reduced during periods of saturation and is now oxidizing in a drier state.
A15.—Alaska Gleyed Pores. For use in LRRs W, X, and Y. A mineral layer that has 10 percent or more hue of N, 10Y, 5GY, 10GY, 5G, 10G, 5BG, 10BG, 5B, 10B, or 5PB with value of 4 or more along root channels or other pores and that starts at a depth ≤30 cm (12 inches) from the soil surface. The matrix has a dominant hue of 5Y or redder.
16 Field Indicators of
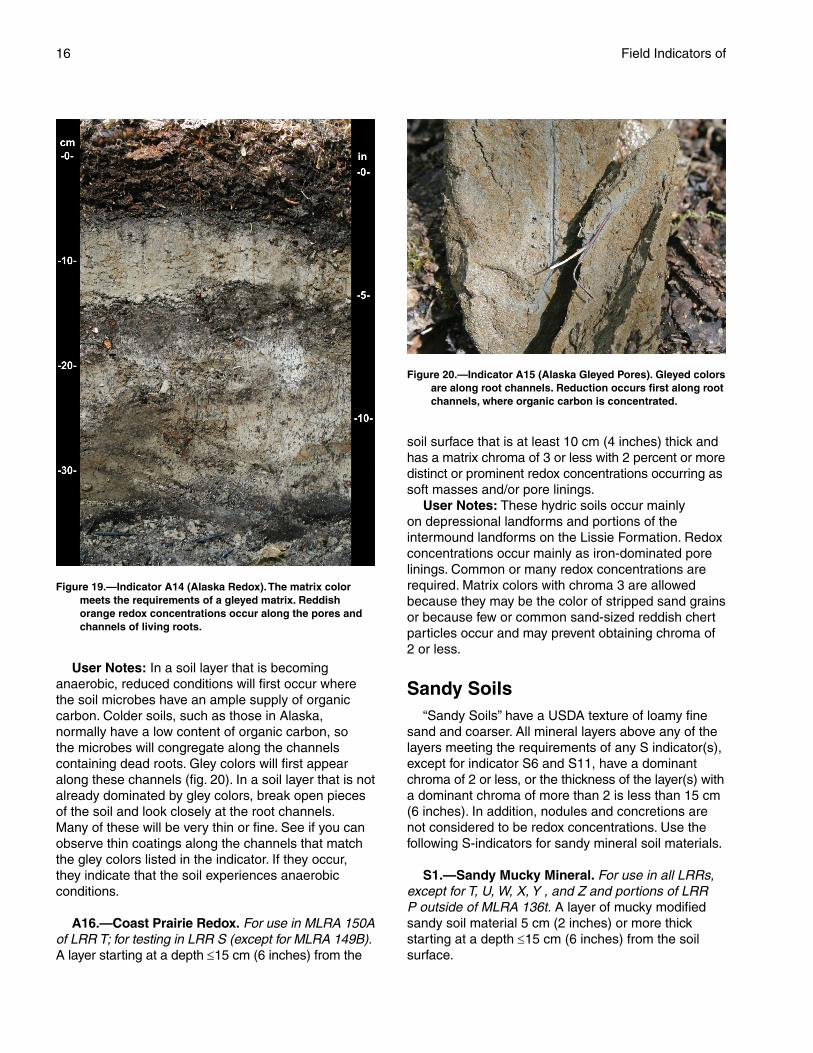
Figure 19.—Indicator A14 (Alaska Redox). The matrix color meets the requirements of a gleyed matrix. Reddish orange redox concentrations occur along the pores and channels of living roots.
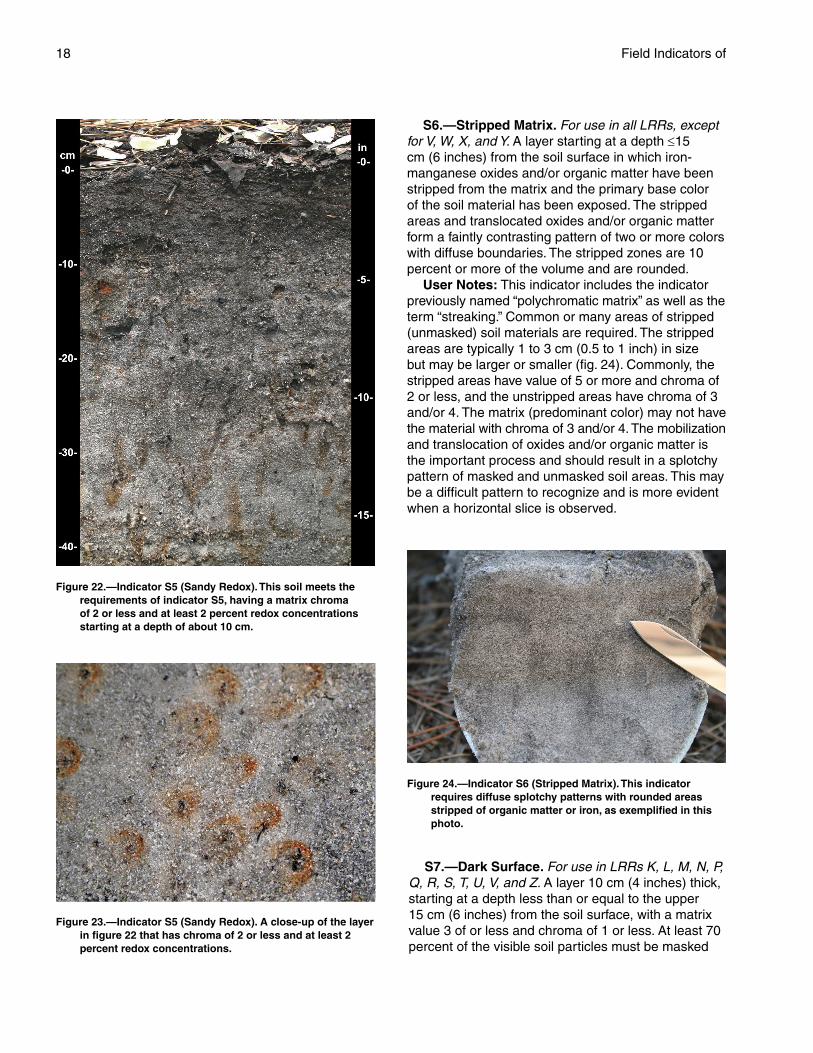
User Notes: In a soil layer that is becoming anaerobic, reduced conditions will first occur where the soil microbes have an ample supply of organic carbon. Colder soils, such as those in Alaska, normally have a low content of organic carbon, so the microbes will congregate along the channels containing dead roots. Gley colors will first appear along these channels (fig. 20). In a soil layer that is not already dominated by gley colors, break open pieces of the soil and look closely at the root channels. Many of these will be very thin or fine. See if you can observe thin coatings along the channels that match the gley colors listed in the indicator. If they occur, they indicate that the soil experiences anaerobic conditions.
A16.—Coast Prairie Redox. For use in MLRA 150A of LRR T; for testing in LRR S (except for MLRA 149B). A layer starting at a depth ≤15 cm (6 inches) from the
Figure 20.—Indicator A15 (Alaska Gleyed Pores). Gleyed colors are along root channels. Reduction occurs first along root channels, where organic carbon is concentrated.
soil surface that is at least 10 cm (4 inches) thick and has a matrix chroma of 3 or less with 2 percent or more distinct or prominent redox concentrations occurring as soft masses and/or pore linings.
User Notes: These hydric soils occur mainly on depressional landforms and portions of the intermound landforms on the Lissie Formation. Redox concentrations occur mainly as iron-dominated pore linings. Common or many redox concentrations are required. Matrix colors with chroma 3 are allowed because they may be the color of stripped sand grains or because few or common sand-sized reddish chert particles occur and may prevent obtaining chroma of 2 or less.
Sandy Soils “Sandy Soils” have a USDA texture of loamy fine
sand and coarser. All mineral layers above any of the layers meeting the requirements of any S indicator(s), except for indicator S6 and S11, have a dominant chroma of 2 or less, or the thickness of the layer(s) with a dominant chroma of more than 2 is less than 15 cm (6 inches). In addition, nodules and concretions are not considered to be redox concentrations. Use the following S-indicators for sandy mineral soil materials.
S1.—Sandy Mucky Mineral. For use in all LRRs, except for T, U, W, X, Y , and Z and portions of LRR P outside of MLRA 136t. A layer of mucky modified sandy soil material 5 cm (2 inches) or more thick starting at a depth ≤15 cm (6 inches) from the soil surface.

17Hydric Soils
User Notes: “Mucky” is a USDA texture modifier for mineral soils. The content of organic carbon is at least 5 percent and ranges to as high as 14 percent for sandy soils. The percent required depends on the clay content of the soil; the higher the clay content, the higher the content of organic carbon required. For example, a mucky fine sandy soil contains between 5 and 12 percent organic carbon.
S2.—2.5 cm Mucky Peat or Peat. For use in LRRs G and H. A layer of mucky peat or peat 2.5 cm (1 inch) or more thick with value of 4 or less and chroma of 3 or less, starting at a depth ≤15 cm (6 inches) from the soil surface, and underlain by sandy soil material.
User Notes: Mucky peat (hemic soil material) and peat (fibric soil material) have a minimum organic carbon content of 12 to 18 percent, depending on the content of clay. Organic soil material is called peat if virtually all of the plant remains are sufficiently intact to permit identification of plant remains. Mucky peat is at an intermediate stage of decomposition between peat and highly decomposed muck. To ascertain if mucky peat and/or peat are present, determine the percentage of rubbed fibers.
S3.—5 cm Mucky Peat or Peat. For use in LRRs F and M; for testing in LRRs K, L, and R. A layer of mucky peat or peat 5 cm (2 inches) or more thick with value of 3 or less and chroma of 2 or less, starting at a depth ≤15 cm (6 inches) from the soil surface, and underlain by sandy soil material.
User Notes: Mucky peat (hemic soil material) and peat (fibric soil material) have a minimum organic carbon content of 12 to 18 percent, depending on the content of clay. Organic soil material is called peat if virtually all of the plant remains are sufficiently intact to permit identification of plant remains. Mucky peat is at an intermediate stage of decomposition between peat and highly decomposed muck. To ascertain if mucky peat and/or peat are present, determine the percentage of rubbed fibers.
S4.—Sandy Gleyed Matrix. For use in all LRRs, except for W, X, and Y. A gleyed matrix that occupies 60 percent or more of a layer starting at a depth ≤15 cm (6 inches) from the soil surface.
User Notes: Gley colors are not synonymous with gray colors (fig. 21). They are the colors on the gley color pages in the Munsell color book (X-Rite, 2009) that have hue of N, 10Y, 5GY, 10GY, 5G, 10G, 5BG, 10BG, 5B, 10B, or 5PB and value of 4 or more. For this indicator, the gleyed matrix only has to be present
at a depth ≤15 cm (6 inches) from the surface. Soils with gleyed matrices are saturated for periods of a significant duration; as a result, there is no thickness requirement for the layer.
S5.—Sandy Redox. For use in all LRRs, except for Q, V, W, X, and Y. A layer starting at a depth ≤15 cm (6 inches) from the soil surface that is at least 10 cm (4 inches) thick and has a matrix with 60 percent or more chroma of 2 or less and 2 percent or more distinct or prominent redox concentrations occurring as soft masses and/or pore linings.
User Notes: “Distinct” and “prominent” are defined in the Glossary. Redox concentrations include iron and manganese masses (reddish mottles) and pore linings (Vepraskas, 1994). Included within the concept of redox concentrations are iron-manganese bodies occurring as soft masses with diffuse boundaries. Common (2 to less than 20 percent) or many (20 percent or more) redox concentrations are required (USDA, NRCS, 2002). If the soil is saturated at the time of sampling, it may be necessary to let it dry to a moist condition for redox features to become visible (figs. 22 and 23). This is a very common indicator of hydric soils and is often used to identify the hydric/nonhydric soil boundary in sandy soils.
Figure 21.—Indicator S4 (Sandy Gleyed Matrix). The gleyed matrix begins at the surface of the soil.
18 Field Indicators of
Figure 22.—Indicator S5 (Sandy Redox). This soil meets the requirements of indicator S5, having a matrix chroma of 2 or less and at least 2 percent redox concentrations starting at a depth of about 10 cm.
Figure 23.—Indicator S5 (Sandy Redox). A close-up of the layer in figure 22 that has chroma of 2 or less and at least 2 percent redox concentrations.
S6.—Stripped Matrix. For use in all LRRs, except for V, W, X, and Y. A layer starting at a depth ≤15 cm (6 inches) from the soil surface in which iron-manganese oxides and/or organic matter have been stripped from the matrix and the primary base color of the soil material has been exposed. The stripped areas and translocated oxides and/or organic matter form a faintly contrasting pattern of two or more colors with diffuse boundaries. The stripped zones are 10 percent or more of the volume and are rounded.
User Notes: This indicator includes the indicator previously named “polychromatic matrix” as well as the term “streaking.” Common or many areas of stripped (unmasked) soil materials are required. The stripped areas are typically 1 to 3 cm (0.5 to 1 inch) in size but may be larger or smaller (fig. 24). Commonly, the stripped areas have value of 5 or more and chroma of 2 or less, and the unstripped areas have chroma of 3 and/or 4. The matrix (predominant color) may not have the material with chroma of 3 and/or 4. The mobilization and translocation of oxides and/or organic matter is the important process and should result in a splotchy pattern of masked and unmasked soil areas. This may be a difficult pattern to recognize and is more evident when a horizontal slice is observed.
Figure 24.—Indicator S6 (Stripped Matrix). This indicator requires diffuse splotchy patterns with rounded areas stripped of organic matter or iron, as exemplified in this photo.
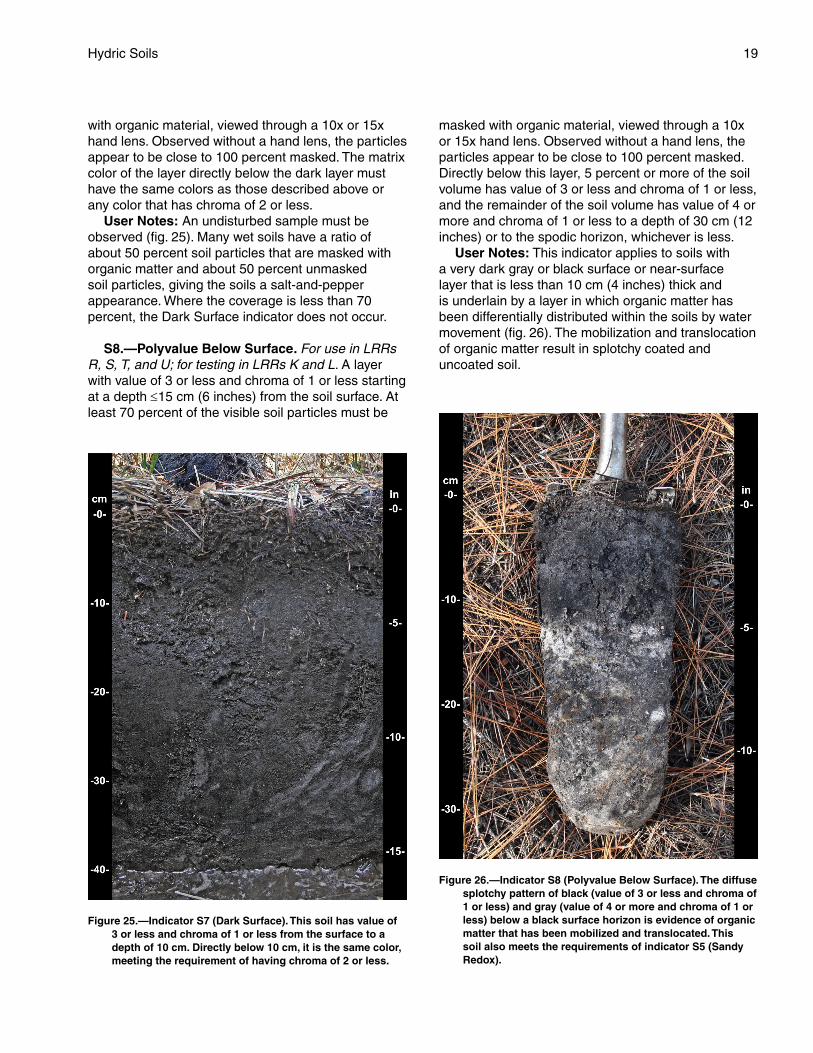
S7.—Dark Surface. For use in LRRs K, L, M, N, P, Q, R, S, T, U, V, and Z. A layer 10 cm (4 inches) thick, starting at a depth less than or equal to the upper 15 cm (6 inches) from the soil surface, with a matrix value 3 of or less and chroma of 1 or less. At least 70 percent of the visible soil particles must be masked
19Hydric Soils
with organic material, viewed through a 10x or 15x hand lens. Observed without a hand lens, the particles appear to be close to 100 percent masked. The matrix color of the layer directly below the dark layer must have the same colors as those described above or any color that has chroma of 2 or less.
User Notes: An undisturbed sample must be observed (fig. 25). Many wet soils have a ratio of about 50 percent soil particles that are masked with organic matter and about 50 percent unmasked soil particles, giving the soils a salt-and-pepper appearance. Where the coverage is less than 70 percent, the Dark Surface indicator does not occur.
S8.—Polyvalue Below Surface. For use in LRRs R, S, T, and U; for testing in LRRs K and L. A layer with value of 3 or less and chroma of 1 or less starting at a depth ≤15 cm (6 inches) from the soil surface. At least 70 percent of the visible soil particles must be
Figure 25.—Indicator S7 (Dark Surface). This soil has value of 3 or less and chroma of 1 or less from the surface to a depth of 10 cm. Directly below 10 cm, it is the same color, meeting the requirement of having chroma of 2 or less.
masked with organic material, viewed through a 10x or 15x hand lens. Observed without a hand lens, the particles appear to be close to 100 percent masked. Directly below this layer, 5 percent or more of the soil volume has value of 3 or less and chroma of 1 or less, and the remainder of the soil volume has value of 4 or more and chroma of 1 or less to a depth of 30 cm (12 inches) or to the spodic horizon, whichever is less.
User Notes: This indicator applies to soils with a very dark gray or black surface or near-surface layer that is less than 10 cm (4 inches) thick and is underlain by a layer in which organic matter has been differentially distributed within the soils by water movement (fig. 26). The mobilization and translocation of organic matter result in splotchy coated and uncoated soil.
Figure 26.—Indicator S8 (Polyvalue Below Surface). The diffuse splotchy pattern of black (value of 3 or less and chroma of 1 or less) and gray (value of 4 or more and chroma of 1 or less) below a black surface horizon is evidence of organic matter that has been mobilized and translocated. This soil also meets the requirements of indicator S5 (Sandy Redox).
20 Field Indicators of
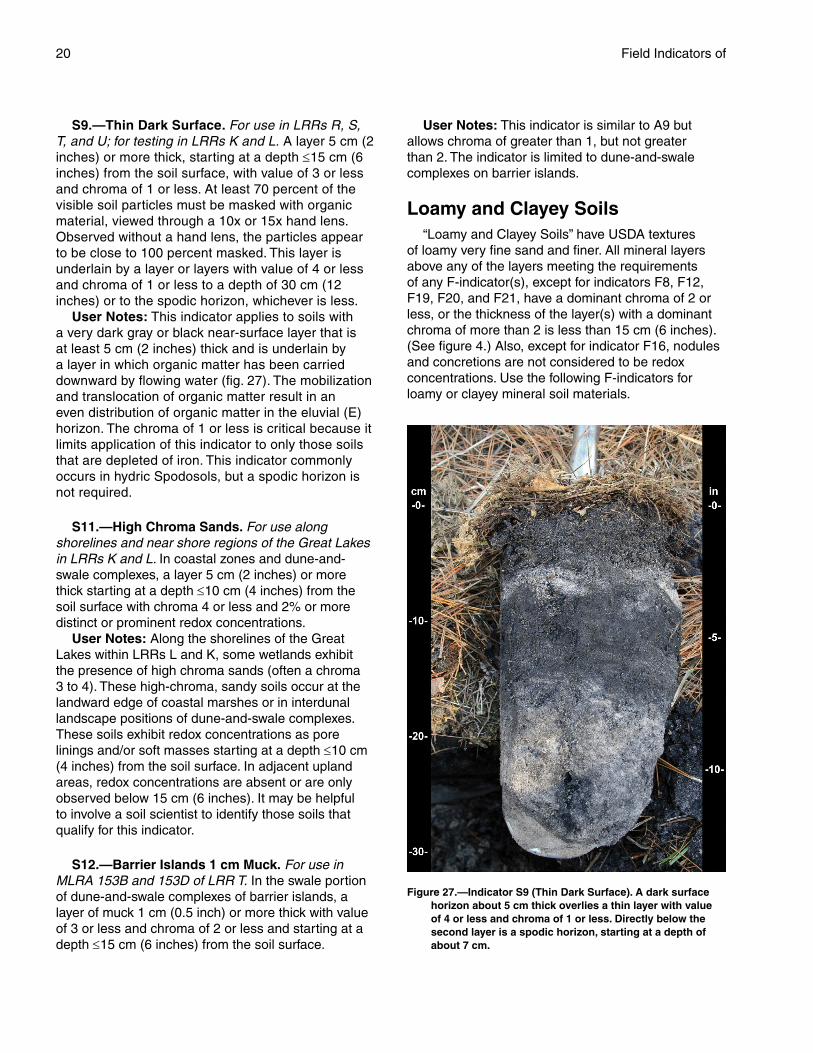
S9.—Thin Dark Surface. For use in LRRs R, S, T, and U; for testing in LRRs K and L. A layer 5 cm (2 inches) or more thick, starting at a depth ≤15 cm (6 inches) from the soil surface, with value of 3 or less and chroma of 1 or less. At least 70 percent of the visible soil particles must be masked with organic material, viewed through a 10x or 15x hand lens. Observed without a hand lens, the particles appear to be close to 100 percent masked. This layer is underlain by a layer or layers with value of 4 or less and chroma of 1 or less to a depth of 30 cm (12 inches) or to the spodic horizon, whichever is less.
User Notes: This indicator applies to soils with a very dark gray or black near-surface layer that is at least 5 cm (2 inches) thick and is underlain by a layer in which organic matter has been carried downward by flowing water (fig. 27). The mobilization and translocation of organic matter result in an even distribution of organic matter in the eluvial (E) horizon. The chroma of 1 or less is critical because it limits application of this indicator to only those soils that are depleted of iron. This indicator commonly occurs in hydric Spodosols, but a spodic horizon is not required.
S11.—High Chroma Sands. For use along shorelines and near shore regions of the Great Lakes in LRRs K and L. In coastal zones and dune-and-swale complexes, a layer 5 cm (2 inches) or more thick starting at a depth ≤10 cm (4 inches) from the soil surface with chroma 4 or less and 2% or more distinct or prominent redox concentrations.
User Notes: Along the shorelines of the Great Lakes within LRRs L and K, some wetlands exhibit the presence of high chroma sands (often a chroma 3 to 4). These high-chroma, sandy soils occur at the landward edge of coastal marshes or in interdunal landscape positions of dune-and-swale complexes. These soils exhibit redox concentrations as pore linings and/or soft masses starting at a depth ≤10 cm (4 inches) from the soil surface. In adjacent upland areas, redox concentrations are absent or are only observed below 15 cm (6 inches). It may be helpful to involve a soil scientist to identify those soils that qualify for this indicator.
S12.—Barrier Islands 1 cm Muck. For use in MLRA 153B and 153D of LRR T. In the swale portion of dune-and-swale complexes of barrier islands, a layer of muck 1 cm (0.5 inch) or more thick with value of 3 or less and chroma of 2 or less and starting at a depth ≤15 cm (6 inches) from the soil surface.
User Notes: This indicator is similar to A9 but allows chroma of greater than 1, but not greater than 2. The indicator is limited to dune-and-swale complexes on barrier islands.
Loamy and Clayey Soils“Loamy and Clayey Soils” have USDA textures
of loamy very fine sand and finer. All mineral layers above any of the layers meeting the requirements of any F-indicator(s), except for indicators F8, F12, F19, F20, and F21, have a dominant chroma of 2 or less, or the thickness of the layer(s) with a dominant chroma of more than 2 is less than 15 cm (6 inches). (See figure 4.) Also, except for indicator F16, nodules and concretions are not considered to be redox concentrations. Use the following F-indicators for loamy or clayey mineral soil materials.
Figure 27.—Indicator S9 (Thin Dark Surface). A dark surface horizon about 5 cm thick overlies a thin layer with value of 4 or less and chroma of 1 or less. Directly below the second layer is a spodic horizon, starting at a depth of about 7 cm.
21Hydric Soils
F1.—Loamy Mucky Mineral. For use in all LRRs, except for N, Q, R, S, V, W, X, and Y, those using A7 (LRRs P, T, U, and Z), and MLRA 1 of LRR A. A layer of mucky modified loamy or clayey soil material 10 cm (4 inches) or more thick starting at a depth ≤15 cm (6 inches) from the soil surface.
User Notes: “Mucky” is a USDA texture modifier for mineral soils. The content of organic carbon is at least 8 percent but can range to as high as 18 percent. The percentage required depends on the clay content of the soil; the higher the clay content, the higher the content of organic carbon required. For example, mucky sandy loam requires between 8 and 14 percent organic carbon.
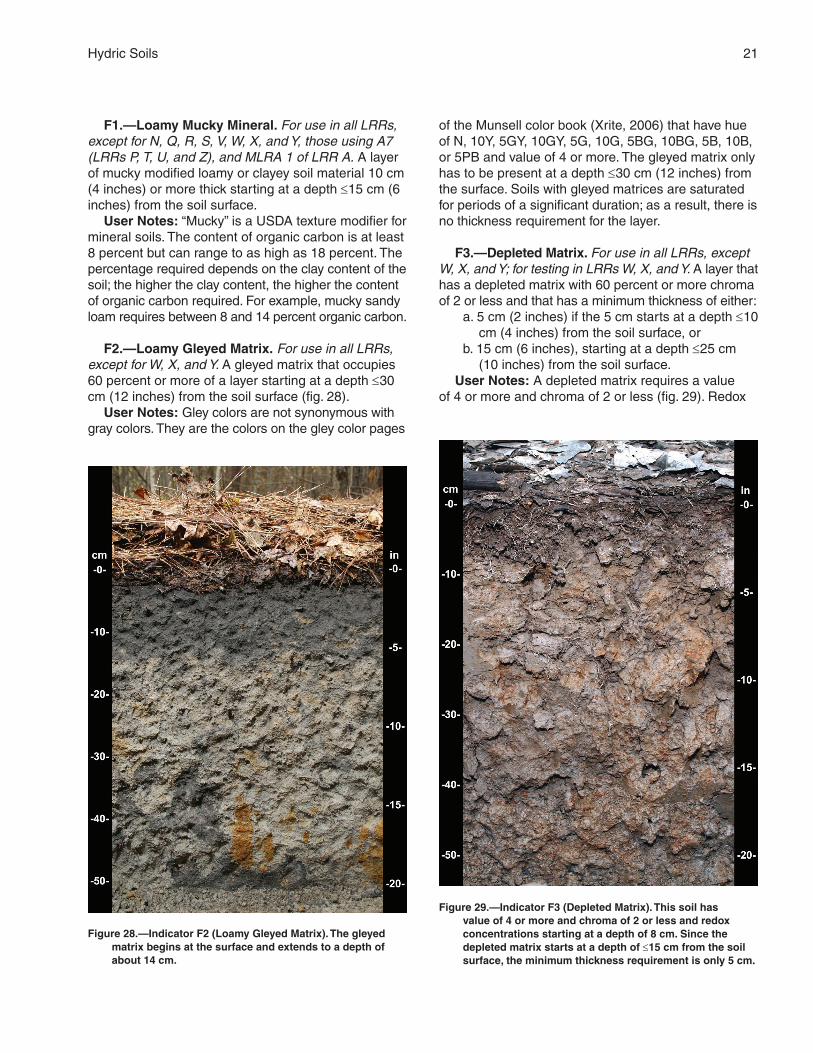
F2.—Loamy Gleyed Matrix. For use in all LRRs, except for W, X, and Y. A gleyed matrix that occupies 60 percent or more of a layer starting at a depth ≤30 cm (12 inches) from the soil surface (fig. 28).
User Notes: Gley colors are not synonymous with gray colors. They are the colors on the gley color pages
of the Munsell color book (Xrite, 2006) that have hue of N, 10Y, 5GY, 10GY, 5G, 10G, 5BG, 10BG, 5B, 10B, or 5PB and value of 4 or more. The gleyed matrix only has to be present at a depth ≤30 cm (12 inches) from the surface. Soils with gleyed matrices are saturated for periods of a significant duration; as a result, there is no thickness requirement for the layer.
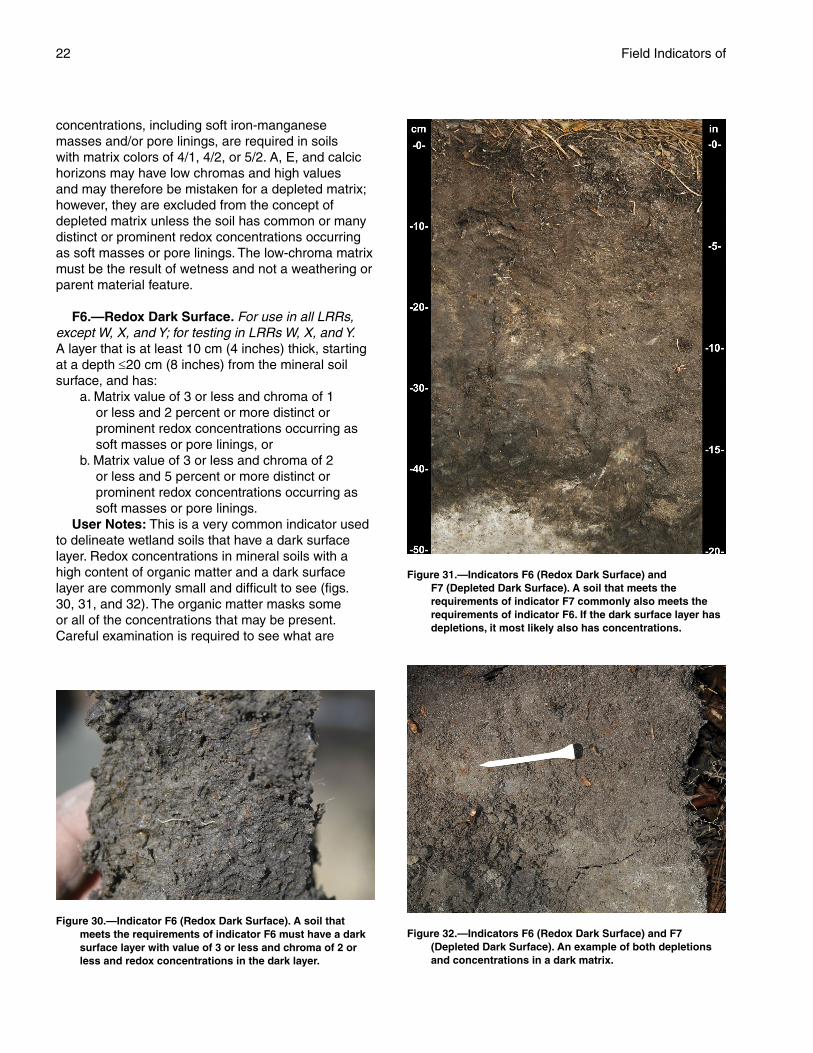
F3.—Depleted Matrix. For use in all LRRs, except W, X, and Y; for testing in LRRs W, X, and Y. A layer that has a depleted matrix with 60 percent or more chroma of 2 or less and that has a minimum thickness of either:
a. 5 cm (2 inches) if the 5 cm starts at a depth ≤10 cm (4 inches) from the soil surface, or
b. 15 cm (6 inches), starting at a depth ≤25 cm (10 inches) from the soil surface.
User Notes: A depleted matrix requires a value of 4 or more and chroma of 2 or less (fig. 29). Redox
Figure 28.—Indicator F2 (Loamy Gleyed Matrix). The gleyed matrix begins at the surface and extends to a depth of about 14 cm.
Figure 29.—Indicator F3 (Depleted Matrix). This soil has value of 4 or more and chroma of 2 or less and redox concentrations starting at a depth of 8 cm. Since the depleted matrix starts at a depth of ≤15 cm from the soil surface, the minimum thickness requirement is only 5 cm.
22 Field Indicators of
concentrations, including soft iron-manganese masses and/or pore linings, are required in soils with matrix colors of 4/1, 4/2, or 5/2. A, E, and calcic horizons may have low chromas and high values and may therefore be mistaken for a depleted matrix; however, they are excluded from the concept of depleted matrix unless the soil has common or many distinct or prominent redox concentrations occurring as soft masses or pore linings. The low-chroma matrix must be the result of wetness and not a weathering or parent material feature.
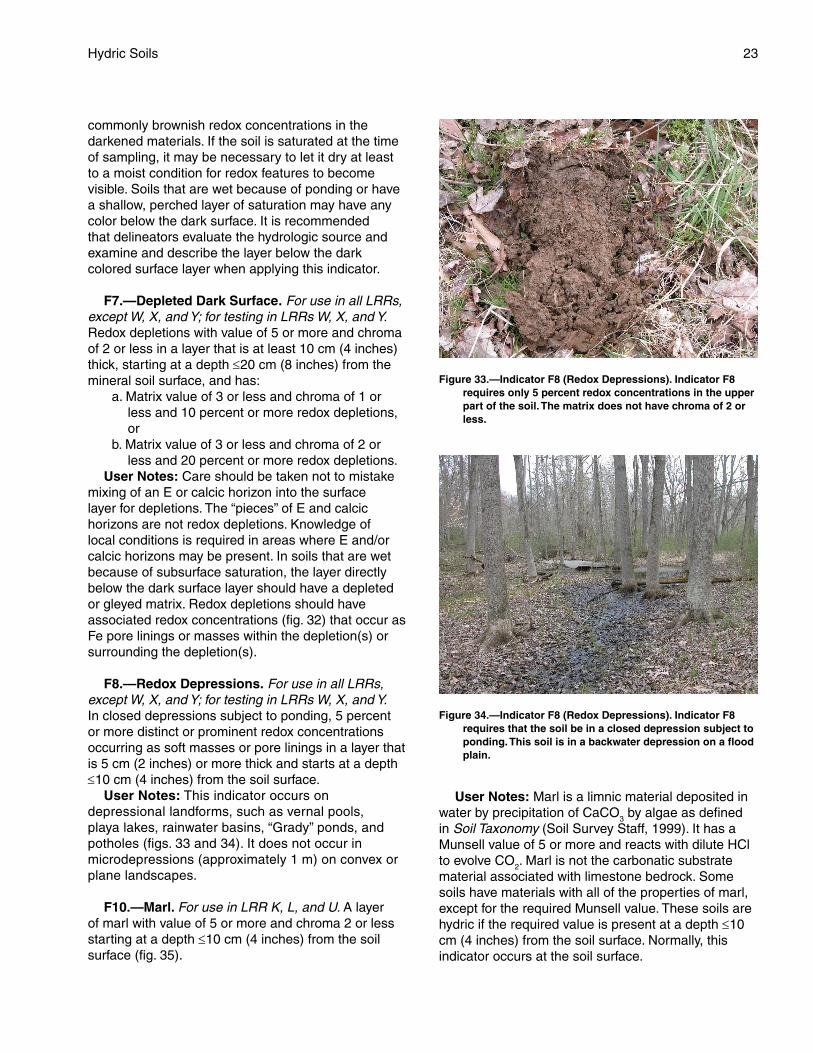
F6.—Redox Dark Surface. For use in all LRRs, except W, X, and Y; for testing in LRRs W, X, and Y. A layer that is at least 10 cm (4 inches) thick, starting at a depth ≤20 cm (8 inches) from the mineral soil surface, and has:
a. Matrix value of 3 or less and chroma of 1 or less and 2 percent or more distinct or prominent redox concentrations occurring as soft masses or pore linings, or
b. Matrix value of 3 or less and chroma of 2 or less and 5 percent or more distinct or prominent redox concentrations occurring as soft masses or pore linings.
User Notes: This is a very common indicator used to delineate wetland soils that have a dark surface layer. Redox concentrations in mineral soils with a high content of organic matter and a dark surface layer are commonly small and difficult to see (figs. 30, 31, and 32). The organic matter masks some or all of the concentrations that may be present. Careful examination is required to see what are
Figure 30.—Indicator F6 (Redox Dark Surface). A soil that meets the requirements of indicator F6 must have a dark surface layer with value of 3 or less and chroma of 2 or less and redox concentrations in the dark layer.
Figure 31.—Indicators F6 (Redox Dark Surface) and F7 (Depleted Dark Surface). A soil that meets the requirements of indicator F7 commonly also meets the requirements of indicator F6. If the dark surface layer has depletions, it most likely also has concentrations.
Figure 32.—Indicators F6 (Redox Dark Surface) and F7 (Depleted Dark Surface). An example of both depletions and concentrations in a dark matrix.
23Hydric Soils
commonly brownish redox concentrations in the darkened materials. If the soil is saturated at the time of sampling, it may be necessary to let it dry at least to a moist condition for redox features to become visible. Soils that are wet because of ponding or have a shallow, perched layer of saturation may have any color below the dark surface. It is recommended that delineators evaluate the hydrologic source and examine and describe the layer below the dark colored surface layer when applying this indicator.
F7.—Depleted Dark Surface. For use in all LRRs, except W, X, and Y; for testing in LRRs W, X, and Y. Redox depletions with value of 5 or more and chroma of 2 or less in a layer that is at least 10 cm (4 inches) thick, starting at a depth ≤20 cm (8 inches) from the mineral soil surface, and has:
a. Matrix value of 3 or less and chroma of 1 or less and 10 percent or more redox depletions, or
b. Matrix value of 3 or less and chroma of 2 or less and 20 percent or more redox depletions.
User Notes: Care should be taken not to mistake mixing of an E or calcic horizon into the surface layer for depletions. The “pieces” of E and calcic horizons are not redox depletions. Knowledge of local conditions is required in areas where E and/or calcic horizons may be present. In soils that are wet because of subsurface saturation, the layer directly below the dark surface layer should have a depleted or gleyed matrix. Redox depletions should have associated redox concentrations (fig. 32) that occur as Fe pore linings or masses within the depletion(s) or surrounding the depletion(s).
F8.—Redox Depressions. For use in all LRRs, except W, X, and Y; for testing in LRRs W, X, and Y. In closed depressions subject to ponding, 5 percent or more distinct or prominent redox concentrations occurring as soft masses or pore linings in a layer that is 5 cm (2 inches) or more thick and starts at a depth ≤10 cm (4 inches) from the soil surface.
User Notes: This indicator occurs on depressional landforms, such as vernal pools, playa lakes, rainwater basins, “Grady” ponds, and potholes (figs. 33 and 34). It does not occur in microdepressions (approximately 1 m) on convex or plane landscapes.
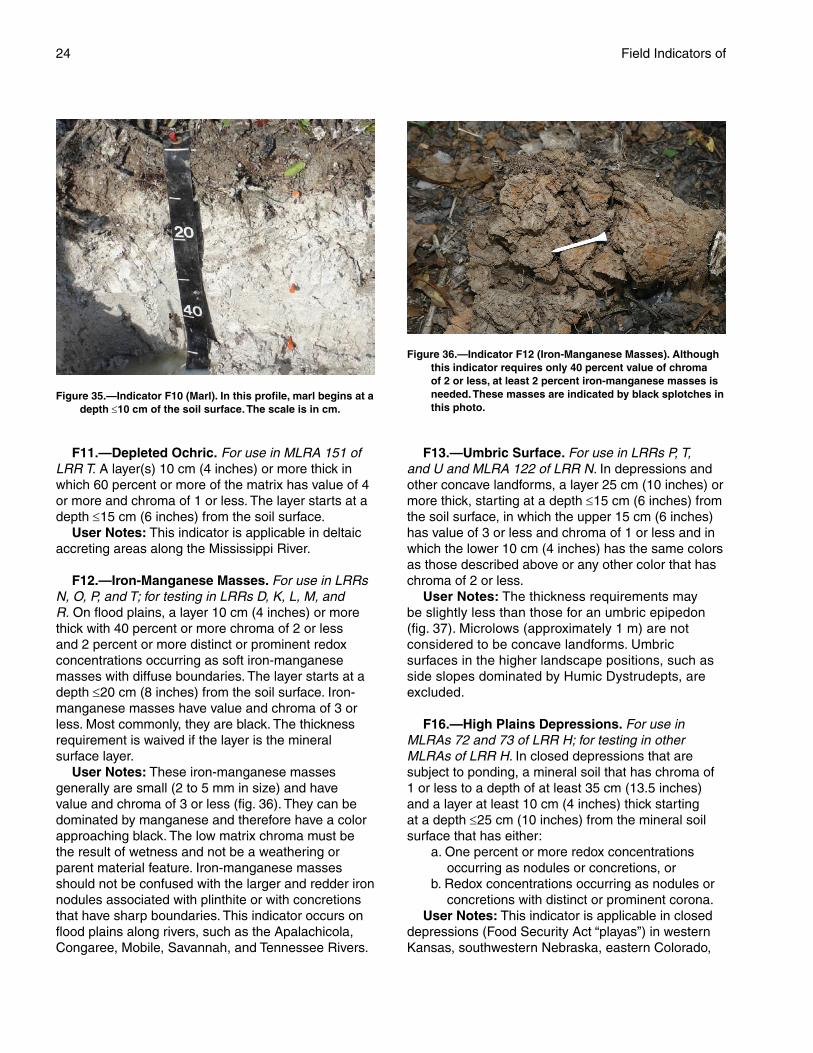
F10.—Marl. For use in LRR K, L, and U. A layer of marl with value of 5 or more and chroma 2 or less starting at a depth ≤10 cm (4 inches) from the soil surface (fig. 35).
Figure 33.—Indicator F8 (Redox Depressions). Indicator F8 requires only 5 percent redox concentrations in the upper part of the soil. The matrix does not have chroma of 2 or less.
Figure 34.—Indicator F8 (Redox Depressions). Indicator F8 requires that the soil be in a closed depression subject to ponding. This soil is in a backwater depression on a flood plain.
User Notes: Marl is a limnic material deposited in water by precipitation of CaCO3 by algae as defined in Soil Taxonomy (Soil Survey Staff, 1999). It has a Munsell value of 5 or more and reacts with dilute HCl to evolve CO2. Marl is not the carbonatic substrate material associated with limestone bedrock. Some soils have materials with all of the properties of marl, except for the required Munsell value. These soils are hydric if the required value is present at a depth ≤10 cm (4 inches) from the soil surface. Normally, this indicator occurs at the soil surface.
24 Field Indicators of
F11.—Depleted Ochric. For use in MLRA 151 of LRR T. A layer(s) 10 cm (4 inches) or more thick in which 60 percent or more of the matrix has value of 4 or more and chroma of 1 or less. The layer starts at a depth ≤15 cm (6 inches) from the soil surface.
User Notes: This indicator is applicable in deltaic accreting areas along the Mississippi River.
F12.—Iron-Manganese Masses. For use in LRRs N, O, P, and T; for testing in LRRs D, K, L, M, and R. On flood plains, a layer 10 cm (4 inches) or more thick with 40 percent or more chroma of 2 or less and 2 percent or more distinct or prominent redox concentrations occurring as soft iron-manganese masses with diffuse boundaries. The layer starts at a depth ≤20 cm (8 inches) from the soil surface. Iron-manganese masses have value and chroma of 3 or less. Most commonly, they are black. The thickness requirement is waived if the layer is the mineral surface layer.
User Notes: These iron-manganese masses generally are small (2 to 5 mm in size) and have value and chroma of 3 or less (fig. 36). They can be dominated by manganese and therefore have a color approaching black. The low matrix chroma must be the result of wetness and not be a weathering or parent material feature. Iron-manganese masses should not be confused with the larger and redder iron nodules associated with plinthite or with concretions that have sharp boundaries. This indicator occurs on flood plains along rivers, such as the Apalachicola, Congaree, Mobile, Savannah, and Tennessee Rivers.
Figure 35.—Indicator F10 (Marl). In this profile, marl begins at a depth ≤10 cm of the soil surface. The scale is in cm.
Figure 36.—Indicator F12 (Iron-Manganese Masses). Although this indicator requires only 40 percent value of chroma of 2 or less, at least 2 percent iron-manganese masses is needed. These masses are indicated by black splotches in this photo.
F13.—Umbric Surface. For use in LRRs P, T, and U and MLRA 122 of LRR N. In depressions and other concave landforms, a layer 25 cm (10 inches) or more thick, starting at a depth ≤15 cm (6 inches) from the soil surface, in which the upper 15 cm (6 inches) has value of 3 or less and chroma of 1 or less and in which the lower 10 cm (4 inches) has the same colors as those described above or any other color that has chroma of 2 or less.
User Notes: The thickness requirements may be slightly less than those for an umbric epipedon (fig. 37). Microlows (approximately 1 m) are not considered to be concave landforms. Umbric surfaces in the higher landscape positions, such as side slopes dominated by Humic Dystrudepts, are excluded.
F16.—High Plains Depressions. For use in MLRAs 72 and 73 of LRR H; for testing in other MLRAs of LRR H. In closed depressions that are subject to ponding, a mineral soil that has chroma of 1 or less to a depth of at least 35 cm (13.5 inches) and a layer at least 10 cm (4 inches) thick starting at a depth ≤25 cm (10 inches) from the mineral soil surface that has either:
a. One percent or more redox concentrations occurring as nodules or concretions, or
b. Redox concentrations occurring as nodules or concretions with distinct or prominent corona.
User Notes: This indicator is applicable in closed depressions (Food Security Act “playas”) in western Kansas, southwestern Nebraska, eastern Colorado,
25Hydric Soils
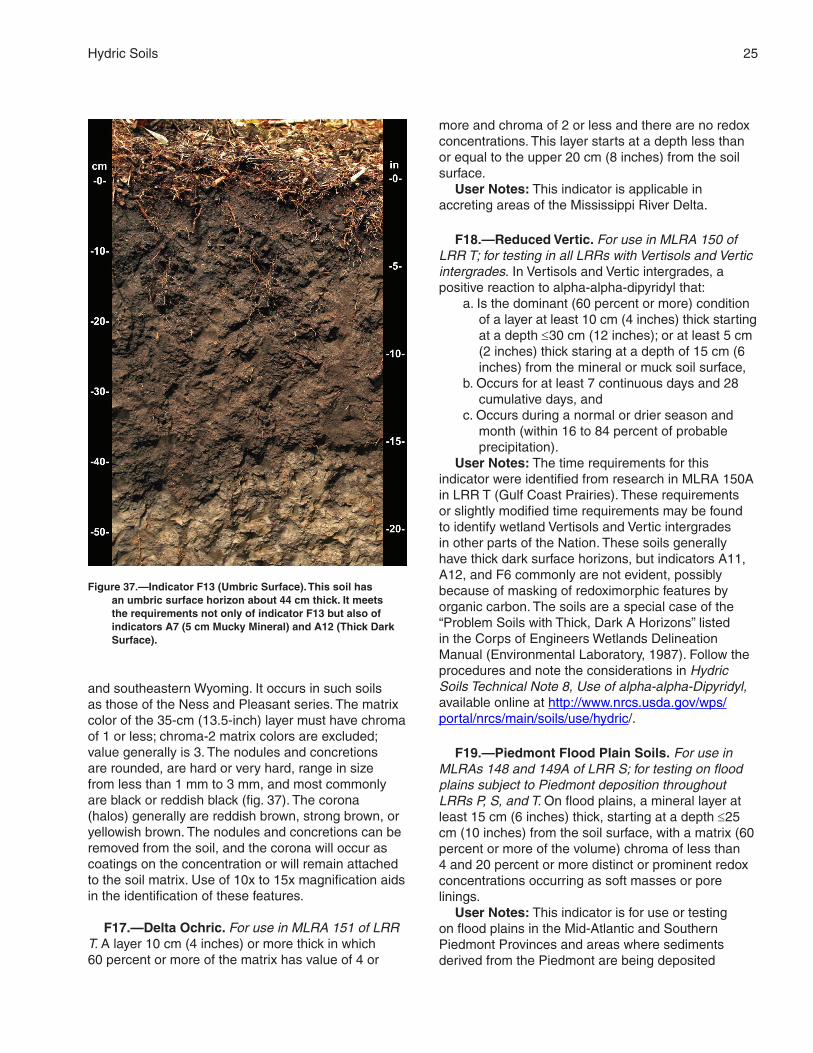
and southeastern Wyoming. It occurs in such soils as those of the Ness and Pleasant series. The matrix color of the 35-cm (13.5-inch) layer must have chroma of 1 or less; chroma-2 matrix colors are excluded; value generally is 3. The nodules and concretions are rounded, are hard or very hard, range in size from less than 1 mm to 3 mm, and most commonly are black or reddish black (fig. 37). The corona (halos) generally are reddish brown, strong brown, or yellowish brown. The nodules and concretions can be removed from the soil, and the corona will occur as coatings on the concentration or will remain attached to the soil matrix. Use of 10x to 15x magnification aids in the identification of these features.
F17.—Delta Ochric. For use in MLRA 151 of LRR T. A layer 10 cm (4 inches) or more thick in which 60 percent or more of the matrix has value of 4 or
Figure 37.—Indicator F13 (Umbric Surface). This soil has an umbric surface horizon about 44 cm thick. It meets the requirements not only of indicator F13 but also of indicators A7 (5 cm Mucky Mineral) and A12 (Thick Dark Surface).
more and chroma of 2 or less and there are no redox concentrations. This layer starts at a depth less than or equal to the upper 20 cm (8 inches) from the soil surface.
User Notes: This indicator is applicable in accreting areas of the Mississippi River Delta.
F18.—Reduced Vertic. For use in MLRA 150 of LRR T; for testing in all LRRs with Vertisols and Vertic intergrades. In Vertisols and Vertic intergrades, a positive reaction to alpha-alpha-dipyridyl that:
a. Is the dominant (60 percent or more) condition of a layer at least 10 cm (4 inches) thick starting at a depth ≤30 cm (12 inches); or at least 5 cm (2 inches) thick staring at a depth of 15 cm (6 inches) from the mineral or muck soil surface,
b. Occurs for at least 7 continuous days and 28 cumulative days, and
c. Occurs during a normal or drier season and month (within 16 to 84 percent of probable precipitation).
User Notes: The time requirements for this indicator were identified from research in MLRA 150A in LRR T (Gulf Coast Prairies). These requirements or slightly modified time requirements may be found to identify wetland Vertisols and Vertic intergrades in other parts of the Nation. These soils generally have thick dark surface horizons, but indicators A11, A12, and F6 commonly are not evident, possibly because of masking of redoximorphic features by organic carbon. The soils are a special case of the “Problem Soils with Thick, Dark A Horizons” listed in the Corps of Engineers Wetlands Delineation Manual (Environmental Laboratory, 1987). Follow the procedures and note the considerations in Hydric Soils Technical Note 8, Use of alpha-alpha-Dipyridyl, available online at http://www.nrcs.usda.gov/wps/portal/nrcs/main/soils/use/hydric/.
F19.—Piedmont Flood Plain Soils. For use in MLRAs 148 and 149A of LRR S; for testing on flood plains subject to Piedmont deposition throughout LRRs P, S, and T. On flood plains, a mineral layer at least 15 cm (6 inches) thick, starting at a depth ≤25 cm (10 inches) from the soil surface, with a matrix (60 percent or more of the volume) chroma of less than 4 and 20 percent or more distinct or prominent redox concentrations occurring as soft masses or pore linings.
User Notes: This indicator is for use or testing on flood plains in the Mid-Atlantic and Southern Piedmont Provinces and areas where sediments derived from the Piedmont are being deposited

26 Field Indicators of
on flood plains on the Coastal Plain (fig. 38). This indicator does not apply to stream terraces, which are associated with a historic stream level and are representative of an abandoned flood plain. While these soils are found on flood plains, flooding may be rare and groundwater is often the source of hydrology.
Figure 38.—Indicator F19 (Piedmont Flood Plain Soils). This indicator is restricted to active flood plains. It does not require a matrix color with chroma of 2 or less.
F20.—Anomalous Bright Loamy Soils. For use in MLRA 149A of LRR S and MLRAs 153C and 153D of LRR T; for testing in MLRA 153B of LRR T. Within 200 meters (656 feet) from estuarine marshes or water and at a depth ≤1 m (3.28 feet) of mean high water, a mineral layer at least 10 cm (4 inches) thick, starting at a depth ≤20 cm (8 inches) from the soil surface, with a matrix (60 percent or more of the volume) chroma of less than 5 and 10 percent or more distinct or prominent redox concentrations occurring as soft masses or pore linings and/or depletions.
User Notes: These soils are expected to occur on linear or convex landforms that are adjacent to estuarine marshes or water (fig. 39).
F21.—Red Parent Material. For use in MLRA 127 of LRR N; MLRA 145 of LRR R; and MLRAs 147 and 148 of LRR S; for testing in all soils derived from red parent materials. A layer derived from red parent materials (see Glossary) that is at least 10 cm (4 inches) thick, starting at a depth ≤25 cm (10 Inches) from the soil surface with a hue of 7.5YR or redder. The matrix has a value and chroma greater than 2 and less than or equal to 4. The layer must contain 10 percent or more depletions and/or distinct or
Figure 39.—Indicator F20 (Anomalous Bright Loamy Soils). This indicator is restricted to areas near estuarine marshes or water. It does not require a matrix color with chroma of 2 or less.
prominent concentrations occurring as soft masses or pore linings. Redox depletions should differ in color by having:
a. A minimum difference of one value higher and one chroma lower than the matrix, or
b. Value of 4 or more and chroma of 2 or less (fig. 40).
User Notes: This indicator was developed for use in areas of red parent material, such as residuum in the Piedmont Province Triassic lowlands section or the Paleozoic “red beds” of the Appalachian Mountains, and in alluvium or colluvium derived from these materials. This indicator may occur along the Red River (Arkansas and Louisiana). In glaciated areas, the indicator may form in glacial till, outwash, deltaic sediments, or glaciolacustrine sediments derived from similar parent materials in the area. Soils potentially derived from red parent materials

27Hydric Soils
Figure 40.—Indicator F21 (Red Parent Material). This indicator should be used only in areas of red parent material that is resistant to reduction. Not all red soils formed in red parent material.
should be evaluated to determine the Color Change Propensity Index (CPPI) and be shown to have CCPI values below 30 (Rabenhorst and Parikh, 2000). In landscapes where mixing or stratification of parent materials occur, it cannot be assumed that sediment overlying red parent material is derived solely from that parent material. The total percentage of all redox concentrations and redox depletions must add up to at least 10 percent to meet the threshold for this indicator.
This indicator is typically found at the boundary between hydric and non-hydric soils. Other, more common indicators may be found on the interior (fig. 41). It may be helpful to involve a soil scientist familiar with these soils to identify those soils that qualify for this indicator.
F22.—Very Shallow Dark Surface. For use in MLRA 138 and West Florida portions of MLRA 152A of LRR T and MLRA 154 of LRR U; for testing in all other MLRAs and LRRs. In depressions and flood plains subject to frequent ponding and/or flooding, one of the following must be observed:
a. If bedrock occurs between 15 cm (6 inches) and 25 cm (10 inches) of the soil surface, a layer at least 15 cm (6 inches) thick starting at
a depth ≤10 cm (4 inches) from the soil surface with value 2.5 or less and chroma 1 or less, and the remaining soil to bedrock must have the same colors as above or any other color that has chroma 2 or less.
Or,b. If bedrock occurs at a depth ≤15 cm (6 inches)
from the soil surface, more than half of the soil thickness must have value 2.5 or less and chroma 1 or less, and the remaining soil to bedrock must have the same color as above or any other color that has a chroma 2 or less.
Figure 41.—Indicator F3 (Depleted Matrix) in red parent material. If a soil that formed in red parent material stays wet and anaerobic long enough, it may develop the indicator F3.


29
Test Indicators of Hydric Soils
The indicators listed under the heading “Field Indicators of Hydric Soils” should be tested for use in LRRs other than those listed. Other indicators for testing are listed below. The test indicators are not to be used for the purpose of delineating hydric soils. Users of the indicators are encouraged to submit descriptions of other soil morphologies that they think are indicative of hydric soils along with supporting data for inclusion in subsequent editions of Field Indicators of Hydric Soils in the United States.
All SoilsTA4.—Alaska Color Change. For testing in LRRs
W, X, and Y. A mineral layer 10 cm (4 inches) or more thick, starting at a depth ≤30 cm (12 inches) from the surface, that has a matrix value of 4 or more and chroma of 2 or less and that within 30 minutes becomes redder by one or more Munsell unit in hue and/or chroma when exposed to air.
User Notes: The soil should be at or near saturation when examined. Care must be taken to immediately obtain an accurate color of the soil sample upon excavation. The colors should then be closely examined again after several minutes. Do not allow the sample to begin drying, as drying will result in a color change. Care must be taken to closely observe the colors. As always, do not obtain colors while wearing sunglasses. Colors must be obtained in the field under natural lighting and not under artificial light. Also, look for the presence of other indicators.
TA5.—Alaska Alpine Swales. For testing in LRRs W, X, and Y. On concave landforms, the presence of a surface mineral layer 10 cm (4 inches) or more thick having hue of 10YR or yellower, value of 2.5 or less, and chroma of 2 or less. The dark surface layer is at least twice as thick as the mineral surface layer of soils in the adjacent convex micro-positions.
User Notes: Soils with this indicator occur in concave areas where moisture accumulates. In these areas the source of the hydrology is meltwater from adjacent snowpacks that persist well into
the growing season. The landscape generally is a complex microtopography of concave depressions and adjacent convex microhighs. Soils should be examined in both landscape positions and compared. If both positions have a mineral surface layer of the same color, but the dark surface layer is at least twice as thick in the concave position, the soil in the concave position is considered hydric. Make sure that there is reasonable evidence of the hydrology source, including either direct observation of the melting snowpack or aerial imagery that shows snowpack at that location earlier in the growing season.
TA6.—Mesic Spodic. For testing in MLRAs 144A and 145 of LRR R and MLRA 149B of LRR S. A layer 5 cm (2 inches) or more thick, starting at a depth ≤15 cm (6 inches) from the mineral soil surface, that has value of 3 or less and chroma of 2 or less and is underlain by either:
a. One or more layers 8 cm (3 inches) or more thick occurring at a depth ≤30 cm (12 inches) from the mineral soil surface, having value and chroma of 3 or less, and showing evidence of spodic development; or
b. One or more layers 5 cm (2 inches) or more thick occurring at a depth ≤30 cm (12 inches) from the mineral soil surface, having value of 4 or more and chroma of 2 or less, and directly underlain by a layer(s) 8 cm (3 inches) or more thick having value and chroma of 3 or less and showing evidence of spodic development.
User Notes: This indicator is used to identify wet soils that have spodic materials or that meet the definition of Spodosols. The layer that has value of 4 or more and chroma of 2 or less is typically described as an E or Eg horizon (typically having a color pattern referred to as stripped or partially stripped matrices). The layers with evidence of the accumulation of translocated organic matter typically are described as Bh, Bhs, Bhsm, Bsm, or Bs horizons. These layers typically have several color patterns or cementation indicative of translocated iron, aluminum, and/or organic matter.
30
Sandy SoilsTS7.—Barrier Islands Low Chroma Matrix. For
testing in MLRA 153B and 153D of LRR T. In the swale portion of the swale-and-dune complexes of barrier islands, a surface layer 1 cm (0.5 inches) or more thick with value 4 or less and chroma 2 or less. Below the dark surface, one or more layers 10 cm (4 inches) or more thick occurs with a dominant hue of 2.5Y or yellower and value 4 or more and chroma less than 2 starting at a depth ≤15 cm (6 inches) from the soil surface.
User Notes: The requirement of a dark surface layer above the low chroma layer excludes sediments from recent depositional events (especially common
in overwash areas) which are not hydric. Low chroma colors in recent deposits are likely due to the nature of the parent material and not related to hydrology. There is no color requirement for any layer(s) between the dark surface and the low chroma matrix. This indicator is limited to sandy soils in dune-and-swale complexes of barrier islands.
Loamy and Clayey SoilsAs of this printing, no test indicators are approved
for loamy and clayey soils. To propose a new test indicator, contact the National Technical Committee for Hydric Soils.
31
References
Elless, M.P., and M.C. Rabenhorst. 1994. Hematite in the shales of the Triassic Culpeper Basin of Maryland. Soil Science 158:150–154.
Elless, M.P., M.C. Rabenhorst, and B.R. James. 1996. Redoximorphic features in soils of the Triassic Culpeper Basin. Soil Science 161:58–69.
Environmental Laboratory. 1987. Corps of Engineers wetlands delineation manual. United States Army Corps of Engineers. Waterways Experiment Station Technical Report Y-87-1.
Federal Register. July 13, 1994. Changes in Hydric Soils of the United States. Washington, DC. (Definition of hydric soils.)
Florida Soil Survey Staff. 1992. Soil and water relationships of Florida’s ecological communities. G.W. Hurt (editor). USDA, Soil Conservation Service, Gainesville, FL.
Mausbach, M.J., and J.l. Richardson. 1994. Biogeochemical processes in hydric soils. Current Topics in Wetland Biogeochemistry 1:68–127. Wetlands Biogeochemistry Institute, Louisiana State University, Baton Rouge, LA.
National Research Council. 1995. Wetlands: Characteristics and boundaries. National Academy Press, Washington, DC.
National Technical Committee for Hydric Soils (NTCHS). Use of alpha-alpha-dipyridyl. Hydric Soils Technical Note 8. https://www.nrcs.usda.gov/wps/portal/nrcs/detail/soils/use/hydric/?cid=nrcs142p2_053983 (accessed 19 September 2016).
National Technical Committee for Hydric Soils (NTCHS). 2015. The hydric soil technical standard. Hydric Soils Technical Note 11. https://www.nrcs.usda.gov/Internet/FSE_DOCUMENTS/nrcs142p2_051608.pdf (accessed 19 September 2016).
Rabenhorst, M.C., and S. Parikh. 2000. Propensity of soils to develop redoximorphic color changes. Soil Science Society of America Journal 64:1904–1910.
Schoeneberger, P.J., D.A.Wysocki, E.C Benham, and W.D. Broderson (editors). 2002. Field book for describing and sampling soils, version 2.0. Natural Resources Conservation Service, National Soil Survey Center, Lincoln, NE.
Soil Science Society of America. 1993. Proceedings of the Symposium on Soil Color, October 21-26, 1990, San Antonio, TX. J.M. Bigham and E.J. Coilkosz (editors). Soil Science Society of America, Madison, WI, Special Publication 31.
Soil Science Society of America. 2001. Glossary of soil science terms. Soil Science Society of America, Madison, WI. https://www.soils.org/publications/soils-glossary (accessed 19 September 2016).
Soil Survey Division Staff. 1993. Soil Survey Manual. Soil Conservation Service. U.S. Department of Agriculture Handbook 18. http://www.nrcs.usda.gov/wps/portal/nrcs/detail/soils/ref/?cid=nrcs142p2_054262 (accessed 19 September 2016).
32
Soil Survey Staff. 1999. Soil Taxonomy: A basic system of soil classification for making and interpreting soil surveys. U.S. Department of Agriculture Handbook 436. http://www.nrcs.usda.gov/wps/portal/nrcs/main/soils/survey/class/taxonomy/ (accessed 19 September 2016).
Soil Survey Staff. 2014. Keys to soil taxonomy, 12th ed. USDA, Natural Resources Conservation Service. http://www.nrcs.usda.gov/wps/portal/nrcs/detail/soils/survey/class/taxonomy/?cid=nrcs142p2_053580 (accessed 19 September 2016).
United States Department of Agriculture, Natural Resources Conservation Service. 1996. Field indicators of hydric soils in the United States, version 3.2. G.W. Hurt, P.M. Whited, and R.F. Pringle (editors). In cooperation with the National Technical Committee for Hydric Soils.
United States Department of Agriculture, Natural Resources Conservation Service. 1998. Field indicators of hydric soils in the United States, version 4.0. G.W. Hurt, P.M. Whited, and R.F. Pringle (editors). In cooperation with the National Technical Committee for Hydric Soils.
United States Department of Agriculture, Natural Resources Conservation Service. 2002. Field indicators of hydric soils in the United States, version 5.0. G.W. Hurt, P.M. Whited, and R.F. Pringle (editors). In cooperation with the National Technical Committee for Hydric Soils.
United States Department of Agriculture, Natural Resources Conservation Service. 2006a. Field indicators of hydric soils in the United States, version 6.0. G.W. Hurt and L.M. Vasilas (editors). In cooperation with the National Technical Committee for Hydric Soils.
United States Department of Agriculture, Natural Resources Conservation Service. 2006b. Land resource regions and major land resource areas of the United States, the Caribbean, and the Pacific Basin. 2006b. U.S. Department of Agriculture Handbook 296. http://www.nrcs.usda.gov/wps/portal/nrcs/detail/soils/survey/?cid=nrcs142p2_053624 (accessed 19 September 2016).
United States Department of Agriculture, Natural Resources Conservation Service. 2010. Field indicators of hydric soils in the United States, version 7.0. L.M. Vasilas, G.W. Hurt, and C.V. Noble (eds.). In cooperation with the National Technical Committee for Hydric Soils.
United States Department of Agriculture, Natural Resources Conservation Service. 2008. National Food Security Act manual. Fourth Edition. M_180_TOC.
United States Department of Agriculture, Natural Resources Conservation Service. 2010. National soil survey handbook, title 430-VI. http://www.nrcs.usda.gov/wps/portal/nrcs/detail/soils/ref/?cid=nrcs142p2_054242 (accessed 19 September 2016).
Vepraskas, M.J. 1994. Redoximorphic features for identifying aquic conditions. Technical Bulletin 301. North Carolina Agricultural Research Service, North Carolina State University, Raleigh, NC.
X-Rite. 2009. Munsell® soil color charts: Revised edition. X-Rite. Grand Rapids, MI.
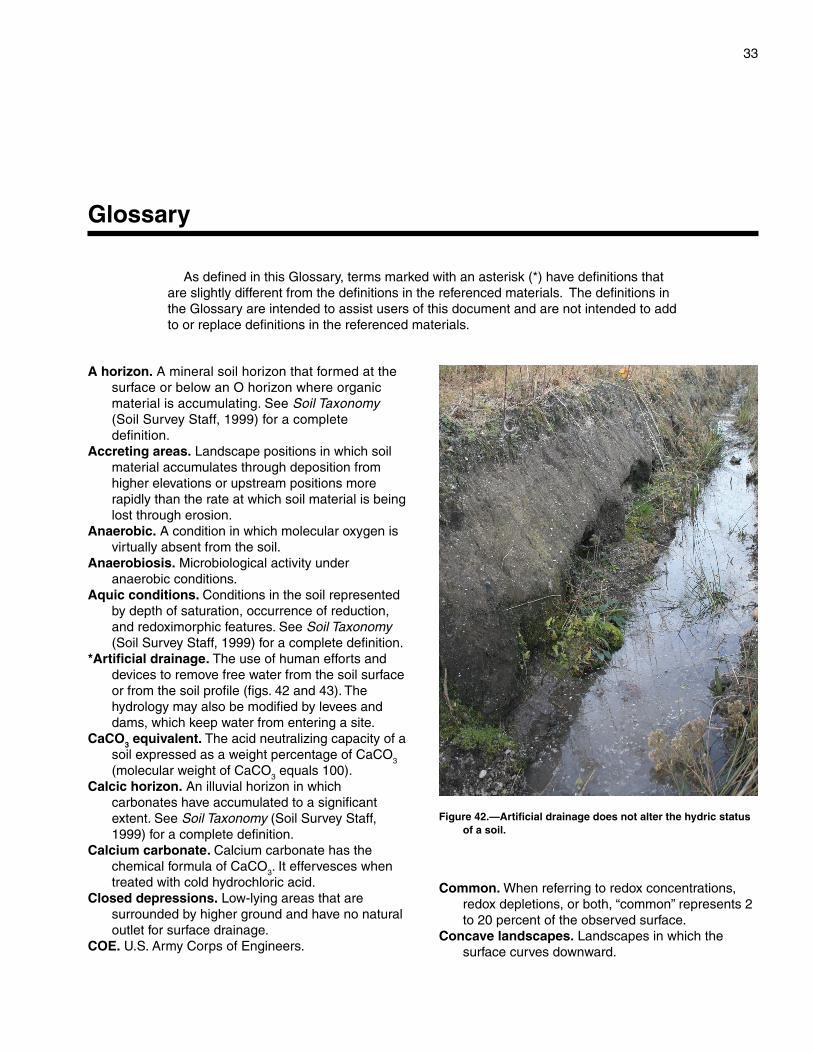
33
Glossary
As defined in this Glossary, terms marked with an asterisk (*) have definitions that are slightly different from the definitions in the referenced materials. The definitions in the Glossary are intended to assist users of this document and are not intended to add to or replace definitions in the referenced materials.
A horizon. A mineral soil horizon that formed at the surface or below an O horizon where organic material is accumulating. See Soil Taxonomy (Soil Survey Staff, 1999) for a complete definition.
Accreting areas. Landscape positions in which soil material accumulates through deposition from higher elevations or upstream positions more rapidly than the rate at which soil material is being lost through erosion.
Anaerobic. A condition in which molecular oxygen is virtually absent from the soil.
Anaerobiosis. Microbiological activity under anaerobic conditions.
Aquic conditions. Conditions in the soil represented by depth of saturation, occurrence of reduction, and redoximorphic features. See Soil Taxonomy (Soil Survey Staff, 1999) for a complete definition.
*Artificial drainage. The use of human efforts and devices to remove free water from the soil surface or from the soil profile (figs. 42 and 43). The hydrology may also be modified by levees and dams, which keep water from entering a site.
CaCO3 equivalent. The acid neutralizing capacity of a soil expressed as a weight percentage of CaCO3 (molecular weight of CaCO3 equals 100).
Calcic horizon. An illuvial horizon in which carbonates have accumulated to a significant extent. See Soil Taxonomy (Soil Survey Staff, 1999) for a complete definition.
Calcium carbonate. Calcium carbonate has the chemical formula of CaCO3. It effervesces when treated with cold hydrochloric acid.
Closed depressions. Low-lying areas that are surrounded by higher ground and have no natural outlet for surface drainage.
COE. U.S. Army Corps of Engineers.
Figure 42.—Artificial drainage does not alter the hydric status of a soil.
Common. When referring to redox concentrations, redox depletions, or both, “common” represents 2 to 20 percent of the observed surface.
Concave landscapes. Landscapes in which the surface curves downward.
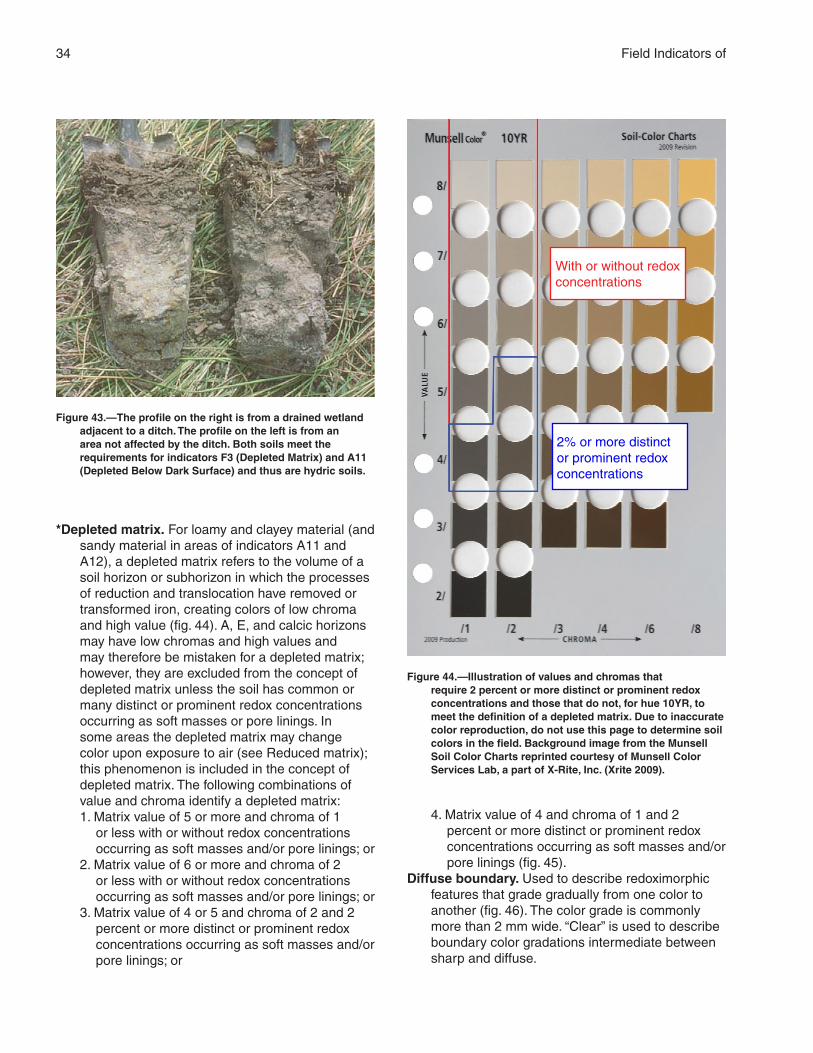
34 Field Indicators of
Figure 43.—The profile on the right is from a drained wetland adjacent to a ditch. The profile on the left is from an area not affected by the ditch. Both soils meet the requirements for indicators F3 (Depleted Matrix) and A11 (Depleted Below Dark Surface) and thus are hydric soils.
*Depleted matrix. For loamy and clayey material (and sandy material in areas of indicators A11 and A12), a depleted matrix refers to the volume of a soil horizon or subhorizon in which the processes of reduction and translocation have removed or transformed iron, creating colors of low chroma and high value (fig. 44). A, E, and calcic horizons may have low chromas and high values and may therefore be mistaken for a depleted matrix; however, they are excluded from the concept of depleted matrix unless the soil has common or many distinct or prominent redox concentrations occurring as soft masses or pore linings. In some areas the depleted matrix may change color upon exposure to air (see Reduced matrix); this phenomenon is included in the concept of depleted matrix. The following combinations of value and chroma identify a depleted matrix:1. Matrix value of 5 or more and chroma of 1
or less with or without redox concentrations occurring as soft masses and/or pore linings; or
2. Matrix value of 6 or more and chroma of 2 or less with or without redox concentrations occurring as soft masses and/or pore linings; or
3. Matrix value of 4 or 5 and chroma of 2 and 2 percent or more distinct or prominent redox concentrations occurring as soft masses and/or pore linings; or
4. Matrix value of 4 and chroma of 1 and 2 percent or more distinct or prominent redox concentrations occurring as soft masses and/or pore linings (fig. 45).
Diffuse boundary. Used to describe redoximorphic features that grade gradually from one color to another (fig. 46). The color grade is commonly more than 2 mm wide. “Clear” is used to describe boundary color gradations intermediate between sharp and diffuse.
Figure 44.—Illustration of values and chromas that require 2 percent or more distinct or prominent redox concentrations and those that do not, for hue 10YR, to meet the definition of a depleted matrix. Due to inaccurate color reproduction, do not use this page to determine soil colors in the field. Background image from the Munsell Soil Color Charts reprinted courtesy of Munsell Color Services Lab, a part of X-Rite, Inc. (Xrite 2009).
With or without redox concentrations
2% or more distinct or prominent redox concentrations
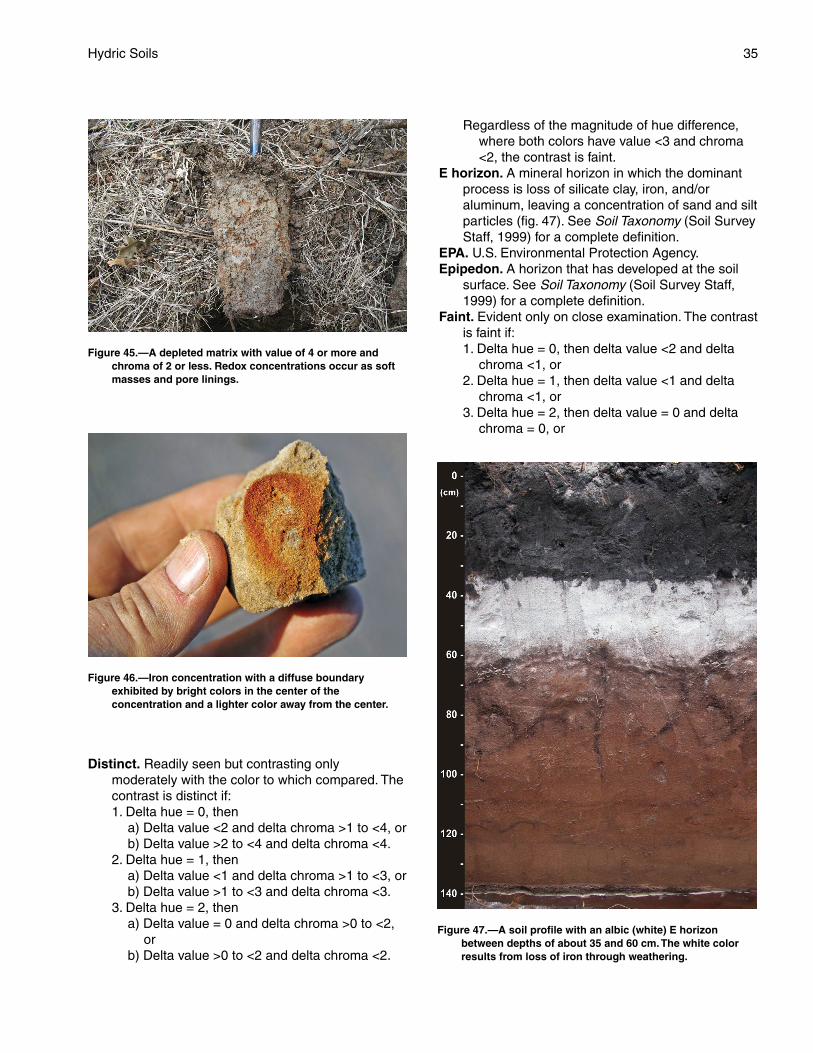
35Hydric Soils
Figure 45.—A depleted matrix with value of 4 or more and chroma of 2 or less. Redox concentrations occur as soft masses and pore linings.
Figure 46. —Iron concentration with a diffuse boundary exhibited by bright colors in the center of the concentration and a lighter color away from the center.
Distinct. Readily seen but contrasting only moderately with the color to which compared. The contrast is distinct if:1. Delta hue = 0, then
a) Delta value <2 and delta chroma >1 to <4, orb) Delta value >2 to <4 and delta chroma <4.
2. Delta hue = 1, thena) Delta value <1 and delta chroma >1 to <3, orb) Delta value >1 to <3 and delta chroma <3.
3. Delta hue = 2, thena) Delta value = 0 and delta chroma >0 to <2,
orb) Delta value >0 to <2 and delta chroma <2.
Regardless of the magnitude of hue difference, where both colors have value <3 and chroma <2, the contrast is faint.
E horizon. A mineral horizon in which the dominant process is loss of silicate clay, iron, and/or aluminum, leaving a concentration of sand and silt particles (fig. 47). See Soil Taxonomy (Soil Survey Staff, 1999) for a complete definition.
EPA. U.S. Environmental Protection Agency.Epipedon. A horizon that has developed at the soil
surface. See Soil Taxonomy (Soil Survey Staff, 1999) for a complete definition.
Faint. Evident only on close examination. The contrast is faint if:1. Delta hue = 0, then delta value <2 and delta
chroma <1, or2. Delta hue = 1, then delta value <1 and delta
chroma <1, or3. Delta hue = 2, then delta value = 0 and delta
chroma = 0, or
Figure 47.—A soil profile with an albic (white) E horizon between depths of about 35 and 60 cm. The white color results from loss of iron through weathering.

36 Field Indicators of
Any delta hue if both colors have value <3 and chroma <2 (fig. 48).
Upper Threshold for Faint
Delta Delta DeltaHue Value Chroma0 ≤2 ≤11 ≤1 ≤12 0 0
Hue Value ChromaAny ≤3 ≤2
Any feature above the upper threshold for faint features would be considered either distinct or prominent. If an indicator requires distinct or prominent features then those features at or below the faint threshold do not count.
Figure 48.—Relationships among the hues of the Munsell Color System. Solid lines represent hues contained in the Munsell Soil Color Charts (2009). Dotted lines represent all other possible 2.5-unit steps. Moving from one hue line to the adjacent hue line represents a delta hue of 1 (2.5 units). Moving from hue N to any other hue the delta hue is 1. Adapted from the Soil Survey Manual (Soil Survey Staff, 1993).
Fe-Mn concretions. Firm to extremely firm, irregularly shaped bodies with sharp to diffuse boundaries. When broken in half, concretions have concentric layers. See Vepraskas (1994) for a complete discussion.
Fe-Mn nodules. Firm to extremely firm, irregularly shaped bodies with sharp to diffuse boundaries. When broken in half, nodules do not have visibly
organized internal structure. See Vepraskas (1994) for a complete discussion.
Few. When referring to redox concentrations, redox depletions, or both, “few” represents less than 2 percent of the observed surface.
Fibric. See Peat.Flood plain. The nearly level plain that borders a
stream and is subject to inundation under flood-stage conditions unless protected artificially. It is usually a constructional landform built of sediment deposited during overflow and lateral migration of the stream.
Fragmental soil material. Soil material that consists of 90 percent or more rock fragments. Less than 10 percent of the soil consists of particles 2 mm or smaller.
Frequently flooded or ponded. A frequency class in which flooding or ponding is likely to occur often under usual weather conditions (a chance of more than 50 percent in any year, or more than 50 times in 100 years).
FWS. U.S. Department of the Interior, Fish and Wildlife Service.
*g. A horizon suffix indicating that the horizon is gray because of wetness but not necessarily that it is gleyed. All gleyed matrices (defined below) should have the suffix “g”; however, not all horizons with the “g” suffix are gleyed. For example, a horizon with the color 10YR 6/2 that is at least seasonally wet, with or without other redoximorphic features, should have the “g” suffix.
Glauconitic. Refers to a mineral aggregate that contains a micaceous mineral resulting in a characteristic green color, e.g., glauconitic shale or clay (fig. 49).
*Gleyed matrix. Soils with a gleyed matrix have the following combinations of hue, value, and chroma (the soils are not glauconitic):1. 10Y, 5GY, 10GY, 10G, 5BG, 10BG, 5B, 10B, or
5PB with value of 4 or more and chroma of 1; or
2. 5G with value of 4 or more and chroma of 1 or 2; or
3. N with value of 4 or more; or In some places the gleyed matrix may change color upon exposure to air. (See Reduced matrix). This phenomenon is included in the concept of gleyed matrix (figs. 50 and 51).
*Hemic. See Mucky peat.Histels. Organic soils that overlie permafrost
and show evidence of cryoturbation. See Soil Taxonomy (Soil Survey Staff, 1999) for a complete definition.
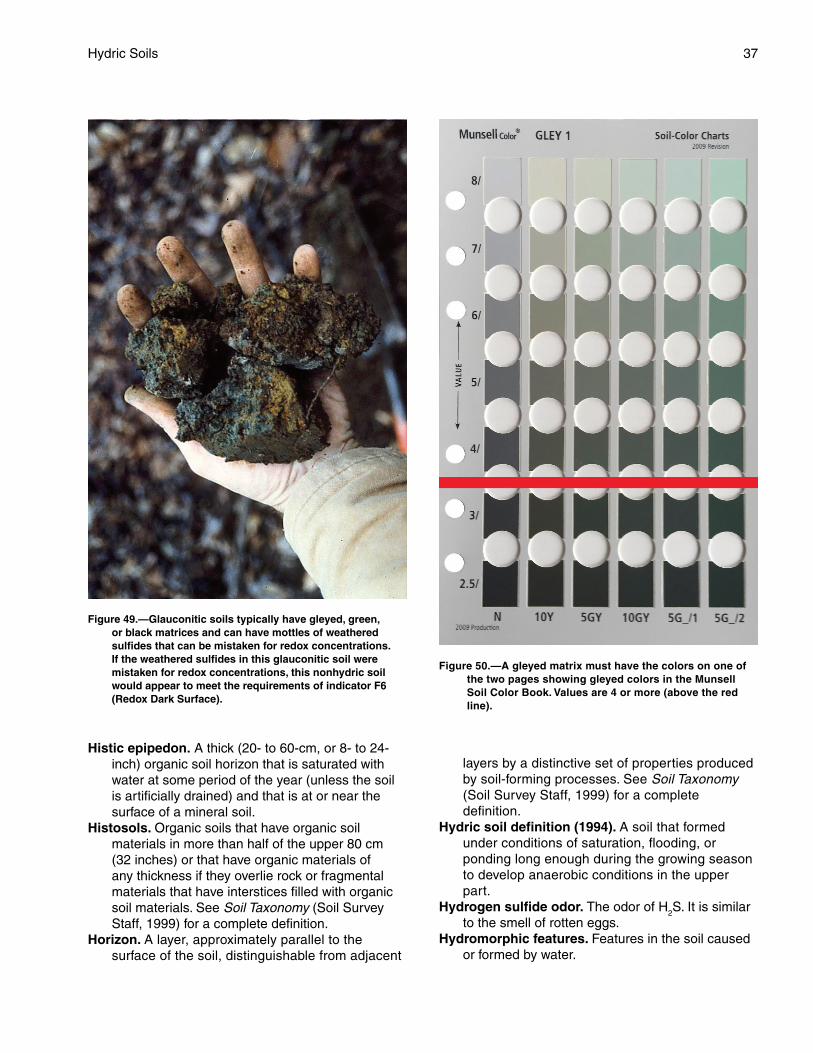
37Hydric Soils
Figure 49.—Glauconitic soils typically have gleyed, green, or black matrices and can have mottles of weathered sulfides that can be mistaken for redox concentrations. If the weathered sulfides in this glauconitic soil were mistaken for redox concentrations, this nonhydric soil would appear to meet the requirements of indicator F6 (Redox Dark Surface).
Histic epipedon. A thick (20- to 60-cm, or 8- to 24- inch) organic soil horizon that is saturated with water at some period of the year (unless the soil is artificially drained) and that is at or near the surface of a mineral soil.
Histosols. Organic soils that have organic soil materials in more than half of the upper 80 cm (32 inches) or that have organic materials of any thickness if they overlie rock or fragmental materials that have interstices filled with organic soil materials. See Soil Taxonomy (Soil Survey Staff, 1999) for a complete definition.
Horizon. A layer, approximately parallel to the surface of the soil, distinguishable from adjacent
Figure 50.—A gleyed matrix must have the colors on one of the two pages showing gleyed colors in the Munsell Soil Color Book. Values are 4 or more (above the red line).
layers by a distinctive set of properties produced by soil-forming processes. See Soil Taxonomy (Soil Survey Staff, 1999) for a complete definition.
Hydric soil definition (1994). A soil that formed under conditions of saturation, flooding, or ponding long enough during the growing season to develop anaerobic conditions in the upper part.
Hydrogen sulfide odor. The odor of H2S. It is similar to the smell of rotten eggs.
Hydromorphic features. Features in the soil caused or formed by water.
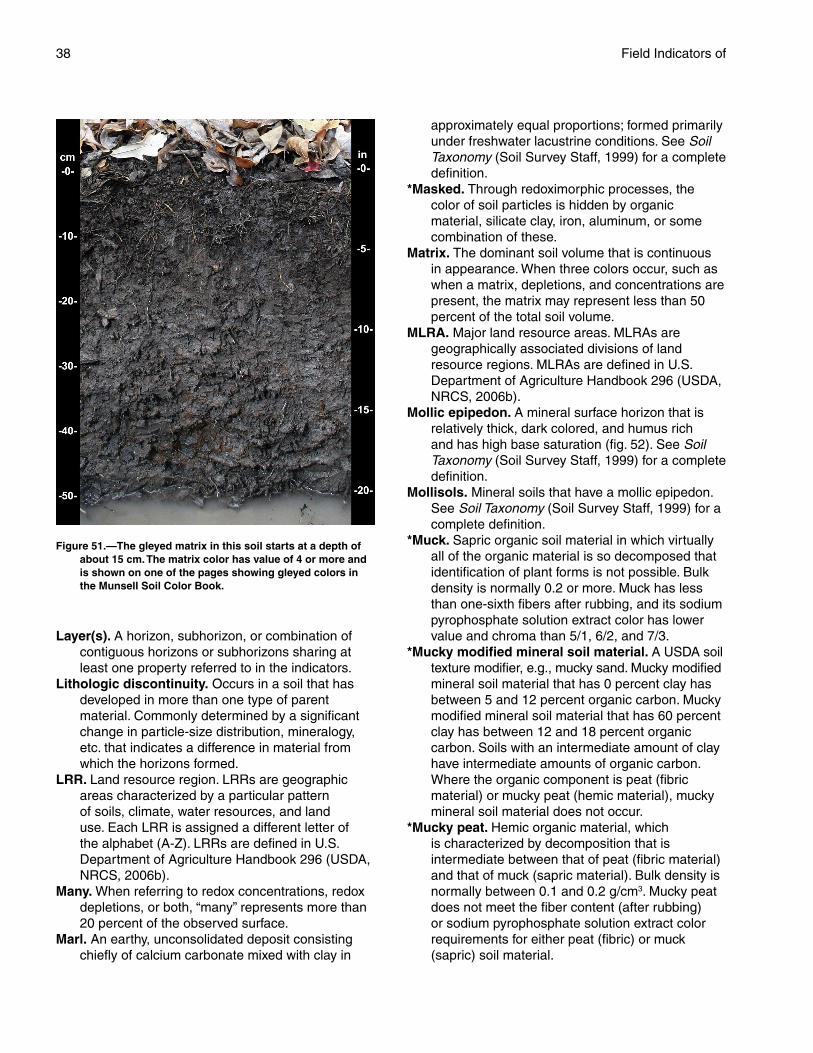
38 Field Indicators of
Figure 51.—The gleyed matrix in this soil starts at a depth of about 15 cm. The matrix color has value of 4 or more and is shown on one of the pages showing gleyed colors in the Munsell Soil Color Book.
Layer(s). A horizon, subhorizon, or combination of contiguous horizons or subhorizons sharing at least one property referred to in the indicators.
Lithologic discontinuity. Occurs in a soil that has developed in more than one type of parent material. Commonly determined by a significant change in particle-size distribution, mineralogy, etc. that indicates a difference in material from which the horizons formed.
LRR. Land resource region. LRRs are geographic areas characterized by a particular pattern of soils, climate, water resources, and land use. Each LRR is assigned a different letter of the alphabet (A-Z). LRRs are defined in U.S. Department of Agriculture Handbook 296 (USDA, NRCS, 2006b).
Many. When referring to redox concentrations, redox depletions, or both, “many” represents more than 20 percent of the observed surface.
Marl. An earthy, unconsolidated deposit consisting chiefly of calcium carbonate mixed with clay in
approximately equal proportions; formed primarily under freshwater lacustrine conditions. See Soil Taxonomy (Soil Survey Staff, 1999) for a complete definition.
*Masked. Through redoximorphic processes, the color of soil particles is hidden by organic material, silicate clay, iron, aluminum, or some combination of these.
Matrix. The dominant soil volume that is continuous in appearance. When three colors occur, such as when a matrix, depletions, and concentrations are present, the matrix may represent less than 50 percent of the total soil volume.
MLRA. Major land resource areas. MLRAs are geographically associated divisions of land resource regions. MLRAs are defined in U.S. Department of Agriculture Handbook 296 (USDA, NRCS, 2006b).
Mollic epipedon. A mineral surface horizon that is relatively thick, dark colored, and humus rich and has high base saturation (fig. 52). See Soil Taxonomy (Soil Survey Staff, 1999) for a complete definition.
Mollisols. Mineral soils that have a mollic epipedon. See Soil Taxonomy (Soil Survey Staff, 1999) for a complete definition.
*Muck. Sapric organic soil material in which virtually all of the organic material is so decomposed that identification of plant forms is not possible. Bulk density is normally 0.2 or more. Muck has less than one-sixth fibers after rubbing, and its sodium pyrophosphate solution extract color has lower value and chroma than 5/1, 6/2, and 7/3.
*Mucky modified mineral soil material. A USDA soil texture modifier, e.g., mucky sand. Mucky modified mineral soil material that has 0 percent clay has between 5 and 12 percent organic carbon. Mucky modified mineral soil material that has 60 percent clay has between 12 and 18 percent organic carbon. Soils with an intermediate amount of clay have intermediate amounts of organic carbon. Where the organic component is peat (fibric material) or mucky peat (hemic material), mucky mineral soil material does not occur.
*Mucky peat. Hemic organic material, which is characterized by decomposition that is intermediate between that of peat (fibric material) and that of muck (sapric material). Bulk density is normally between 0.1 and 0.2 g/cm3. Mucky peat does not meet the fiber content (after rubbing) or sodium pyrophosphate solution extract color requirements for either peat (fibric) or muck (sapric) soil material.
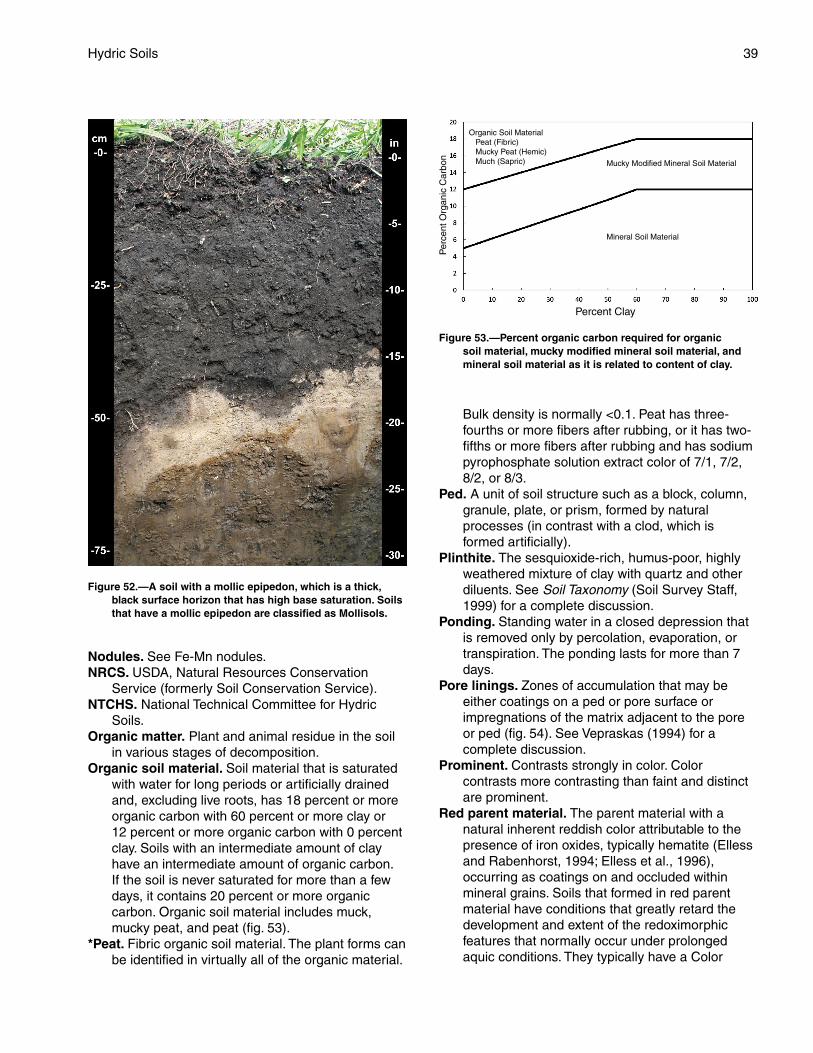
39Hydric Soils
Figure 52.—A soil with a mollic epipedon, which is a thick, black surface horizon that has high base saturation. Soils that have a mollic epipedon are classified as Mollisols.
Nodules. See Fe-Mn nodules.NRCS. USDA, Natural Resources Conservation
Service (formerly Soil Conservation Service).NTCHS. National Technical Committee for Hydric
Soils.Organic matter. Plant and animal residue in the soil
in various stages of decomposition.Organic soil material. Soil material that is saturated
with water for long periods or artificially drained and, excluding live roots, has 18 percent or more organic carbon with 60 percent or more clay or 12 percent or more organic carbon with 0 percent clay. Soils with an intermediate amount of clay have an intermediate amount of organic carbon. If the soil is never saturated for more than a few days, it contains 20 percent or more organic carbon. Organic soil material includes muck, mucky peat, and peat (fig. 53).
*Peat. Fibric organic soil material. The plant forms can be identified in virtually all of the organic material.
Percent Clay
Per
cent
Org
anic
Car
bon
Mineral Soil Material
Mucky Modified Mineral Soil Material
Organic Soil MaterialPeat (Fibric)Mucky Peat (Hemic)Much (Sapric)
Figure 53.—Percent organic carbon required for organic soil material, mucky modified mineral soil material, and mineral soil material as it is related to content of clay.
Bulk density is normally <0.1. Peat has three-fourths or more fibers after rubbing, or it has two-fifths or more fibers after rubbing and has sodium pyrophosphate solution extract color of 7/1, 7/2, 8/2, or 8/3.
Ped. A unit of soil structure such as a block, column, granule, plate, or prism, formed by natural processes (in contrast with a clod, which is formed artificially).
Plinthite. The sesquioxide-rich, humus-poor, highly weathered mixture of clay with quartz and other diluents. See Soil Taxonomy (Soil Survey Staff, 1999) for a complete discussion.
Ponding. Standing water in a closed depression that is removed only by percolation, evaporation, or transpiration. The ponding lasts for more than 7 days.
Pore linings. Zones of accumulation that may be either coatings on a ped or pore surface or impregnations of the matrix adjacent to the pore or ped (fig. 54). See Vepraskas (1994) for a complete discussion.
Prominent. Contrasts strongly in color. Color contrasts more contrasting than faint and distinct are prominent.
Red parent material. The parent material with a natural inherent reddish color attributable to the presence of iron oxides, typically hematite (Elless and Rabenhorst, 1994; Elless et al., 1996), occurring as coatings on and occluded within mineral grains. Soils that formed in red parent material have conditions that greatly retard the development and extent of the redoximorphic features that normally occur under prolonged aquic conditions. They typically have a Color

40 Field Indicators of
Figure 54.—A redox concentration occurring as a pore lining.
Change Propensity Index (CCPI) of <30 (Rabenhorst and Parikh, 2000). Most commonly, the material consists of dark red, consolidated Mesozoic or Paleozoic sedimentary rocks, such as shale, siltstone, and sandstone, or alluvial materials derived from such rocks. Assistance from a local soil scientist may be needed to determine where red parent material occurs.
Redox concentrations. Bodies of apparent accumulation of Fe-Mn oxides (figs. 54 and 55). Redox concentrations include soft masses, pore linings, nodules, and concretions. For the purposes of the indicators, nodules and concretions are excluded from the concept of redox concentrations unless otherwise specified by specific indicators. See Vepraskas (1994) for a complete discussion.
Redox depletions. Bodies of low chroma (2 or less) having value of 4 or more where Fe-Mn oxides have been stripped or where both Fe-Mn oxides and clay have been stripped (fig. 55). Redox depletions contrast distinctly or prominently with the matrix. See Vepraskas (1994) for a complete discussion.
Redoximorphic features. Features formed by the processes of reduction, translocation, and/or oxidation of Fe and Mn oxides (figs. 54 and 55); formerly called mottles and low-chroma colors. See Vepraskas (1994) for a complete discussion.
Reduced matrix. A soil matrix that has low chroma and high value, but in which the color changes in hue or chroma when the soil is exposed to air. See Vepraskas (1994) for a complete discussion.
*Reduction. For the purpose of the indicators, reduction occurs when the redox potential (Eh) is
Figure 55.—Redox concentrations occurring as soft masses and pore linings. Also, a redox depletion along a root channel.
below the ferric-ferrous iron threshold as adjusted for pH. In hydric soils, this is the point when the transformation of ferric iron (Fe3+) to ferrous iron (Fe2+) occurs.
Relict features. Soil morphological features that reflect past hydrologic conditions of saturation and anaerobiosis. See Vepraskas (1994) for a complete discussion.
*Sapric. See Muck.Saturation. Wetness characterized by zero or positive
pressure of the soil water. Almost all of the soil pores are filled with water.
Sharp boundary. Used to describe redoximorphic features that grade sharply from one color to another. The color grade is commonly less than 0.1 mm wide.
Soft masses. Noncemented redox concentrations, frequently within the soil matrix, that are of various shapes and cannot be removed as discrete units.
Soil texture. The relative proportions, by weight, of sand, silt, and clay particles in the soil material less than 2 mm in size.
Spodic horizon. A mineral soil horizon that is characterized by the illuvial accumulation of amorphous materials consisting of aluminum
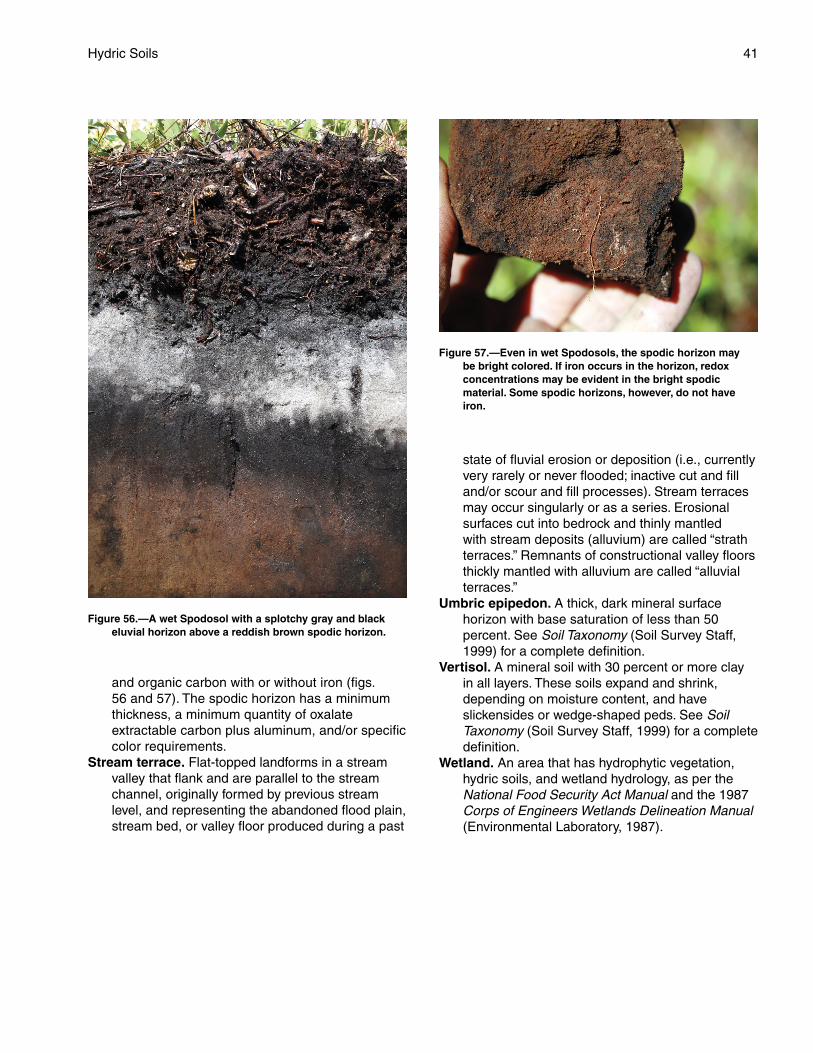
41Hydric Soils
Figure 56. —A wet Spodosol with a splotchy gray and black eluvial horizon above a reddish brown spodic horizon.
and organic carbon with or without iron (figs. 56 and 57). The spodic horizon has a minimum thickness, a minimum quantity of oxalate extractable carbon plus aluminum, and/or specific color requirements.
Stream terrace. Flat-topped landforms in a stream valley that flank and are parallel to the stream channel, originally formed by previous stream level, and representing the abandoned flood plain, stream bed, or valley floor produced during a past
Figure 57. —Even in wet Spodosols, the spodic horizon may be bright colored. If iron occurs in the horizon, redox concentrations may be evident in the bright spodic material. Some spodic horizons, however, do not have iron.
state of fluvial erosion or deposition (i.e., currently very rarely or never flooded; inactive cut and fill and/or scour and fill processes). Stream terraces may occur singularly or as a series. Erosional surfaces cut into bedrock and thinly mantled with stream deposits (alluvium) are called “strath terraces.” Remnants of constructional valley floors thickly mantled with alluvium are called “alluvial terraces.”
Umbric epipedon. A thick, dark mineral surface horizon with base saturation of less than 50 percent. See Soil Taxonomy (Soil Survey Staff, 1999) for a complete definition.
Vertisol. A mineral soil with 30 percent or more clay in all layers. These soils expand and shrink, depending on moisture content, and have slickensides or wedge-shaped peds. See Soil Taxonomy (Soil Survey Staff, 1999) for a complete definition.
Wetland. An area that has hydrophytic vegetation, hydric soils, and wetland hydrology, as per the National Food Security Act Manual and the 1987 Corps of Engineers Wetlands Delineation Manual (Environmental Laboratory, 1987).

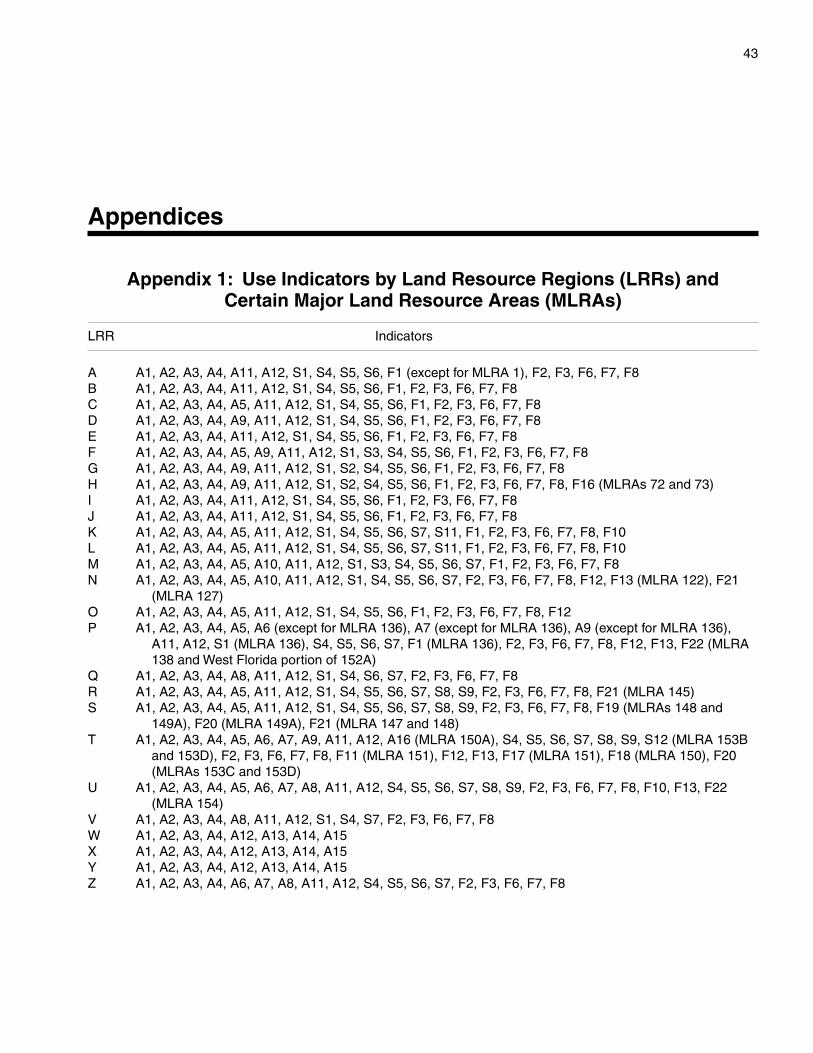
43
Appendices
Appendix 1: Use Indicators by Land Resource Regions (LRRs) and Certain Major Land Resource Areas (MLRAs)
LRR Indicators
A A1, A2, A3, A4, A11, A12, S1, S4, S5, S6, F1 (except for MLRA 1), F2, F3, F6, F7, F8B A1, A2, A3, A4, A11, A12, S1, S4, S5, S6, F1, F2, F3, F6, F7, F8C A1, A2, A3, A4, A5, A11, A12, S1, S4, S5, S6, F1, F2, F3, F6, F7, F8D A1, A2, A3, A4, A9, A11, A12, S1, S4, S5, S6, F1, F2, F3, F6, F7, F8E A1, A2, A3, A4, A11, A12, S1, S4, S5, S6, F1, F2, F3, F6, F7, F8F A1, A2, A3, A4, A5, A9, A11, A12, S1, S3, S4, S5, S6, F1, F2, F3, F6, F7, F8G A1, A2, A3, A4, A9, A11, A12, S1, S2, S4, S5, S6, F1, F2, F3, F6, F7, F8H A1, A2, A3, A4, A9, A11, A12, S1, S2, S4, S5, S6, F1, F2, F3, F6, F7, F8, F16 (MLRAs 72 and 73)I A1, A2, A3, A4, A11, A12, S1, S4, S5, S6, F1, F2, F3, F6, F7, F8J A1, A2, A3, A4, A11, A12, S1, S4, S5, S6, F1, F2, F3, F6, F7, F8K A1, A2, A3, A4, A5, A11, A12, S1, S4, S5, S6, S7, S11, F1, F2, F3, F6, F7, F8, F10L A1, A2, A3, A4, A5, A11, A12, S1, S4, S5, S6, S7, S11, F1, F2, F3, F6, F7, F8, F10M A1, A2, A3, A4, A5, A10, A11, A12, S1, S3, S4, S5, S6, S7, F1, F2, F3, F6, F7, F8N A1, A2, A3, A4, A5, A10, A11, A12, S1, S4, S5, S6, S7, F2, F3, F6, F7, F8, F12, F13 (MLRA 122), F21
(MLRA 127)O A1, A2, A3, A4, A5, A11, A12, S1, S4, S5, S6, F1, F2, F3, F6, F7, F8, F12P A1, A2, A3, A4, A5, A6 (except for MLRA 136), A7 (except for MLRA 136), A9 (except for MLRA 136),
A11, A12, S1 (MLRA 136), S4, S5, S6, S7, F1 (MLRA 136), F2, F3, F6, F7, F8, F12, F13, F22 (MLRA 138 and West Florida portion of 152A)
Q A1, A2, A3, A4, A8, A11, A12, S1, S4, S6, S7, F2, F3, F6, F7, F8R A1, A2, A3, A4, A5, A11, A12, S1, S4, S5, S6, S7, S8, S9, F2, F3, F6, F7, F8, F21 (MLRA 145)S A1, A2, A3, A4, A5, A11, A12, S1, S4, S5, S6, S7, S8, S9, F2, F3, F6, F7, F8, F19 (MLRAs 148 and
149A), F20 (MLRA 149A), F21 (MLRA 147 and 148)T A1, A2, A3, A4, A5, A6, A7, A9, A11, A12, A16 (MLRA 150A), S4, S5, S6, S7, S8, S9, S12 (MLRA 153B
and 153D), F2, F3, F6, F7, F8, F11 (MLRA 151), F12, F13, F17 (MLRA 151), F18 (MLRA 150), F20 (MLRAs 153C and 153D)
U A1, A2, A3, A4, A5, A6, A7, A8, A11, A12, S4, S5, S6, S7, S8, S9, F2, F3, F6, F7, F8, F10, F13, F22 (MLRA 154)
V A1, A2, A3, A4, A8, A11, A12, S1, S4, S7, F2, F3, F6, F7, F8W A1, A2, A3, A4, A12, A13, A14, A15X A1, A2, A3, A4, A12, A13, A14, A15Y A1, A2, A3, A4, A12, A13, A14, A15Z A1, A2, A3, A4, A6, A7, A8, A11, A12, S4, S5, S6, S7, F2, F3, F6, F7, F8
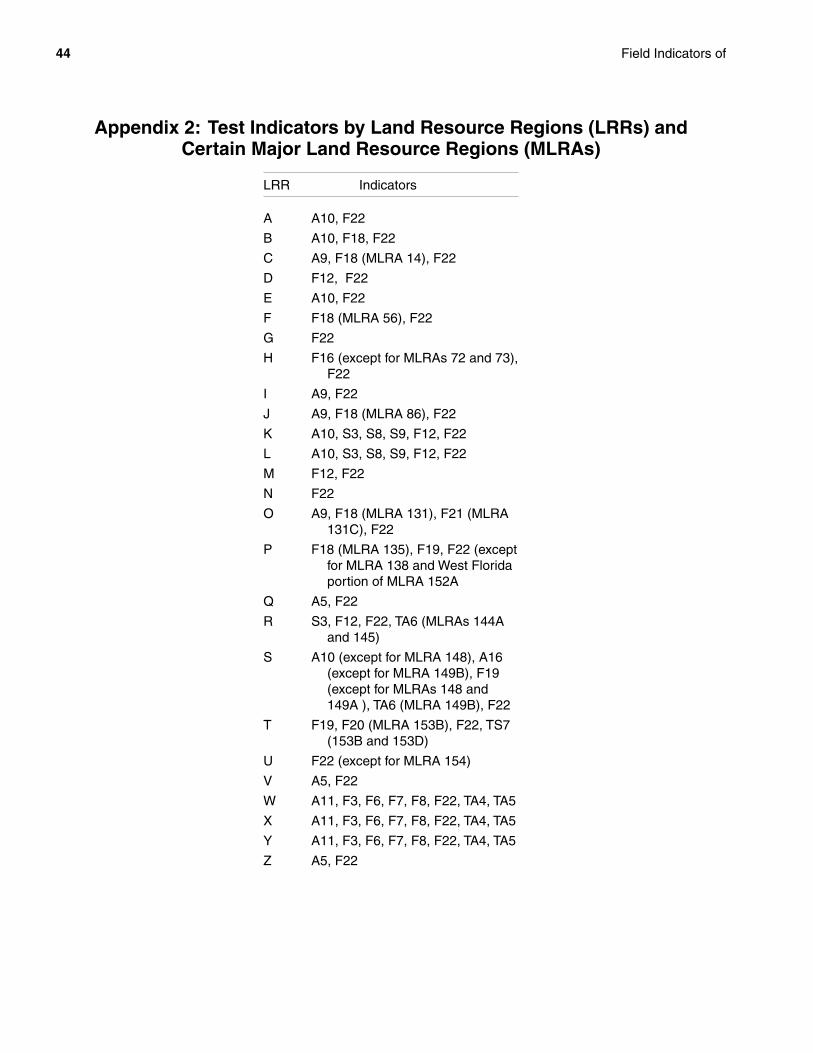
44 Field Indicators of
Appendix 2: Test Indicators by Land Resource Regions (LRRs) and Certain Major Land Resource Regions (MLRAs)
LRR Indicators
A A10, F22
B A10, F18, F22
C A9, F18 (MLRA 14), F22
D F12, F22
E A10, F22
F F18 (MLRA 56), F22
G F22
H F16 (except for MLRAs 72 and 73), F22
I A9, F22
J A9, F18 (MLRA 86), F22
K A10, S3, S8, S9, F12, F22
L A10, S3, S8, S9, F12, F22
M F12, F22
N F22
O A9, F18 (MLRA 131), F21 (MLRA 131C), F22
P F18 (MLRA 135), F19, F22 (except for MLRA 138 and West Florida portion of MLRA 152A
Q A5, F22
R S3, F12, F22, TA6 (MLRAs 144A and 145)
S A10 (except for MLRA 148), A16 (except for MLRA 149B), F19 (except for MLRAs 148 and 149A ), TA6 (MLRA 149B), F22
T F19, F20 (MLRA 153B), F22, TS7 (153B and 153D)
U F22 (except for MLRA 154)
V A5, F22
W A11, F3, F6, F7, F8, F22, TA4, TA5
X A11, F3, F6, F7, F8, F22, TA4, TA5
Y A11, F3, F6, F7, F8, F22, TA4, TA5
Z A5, F22
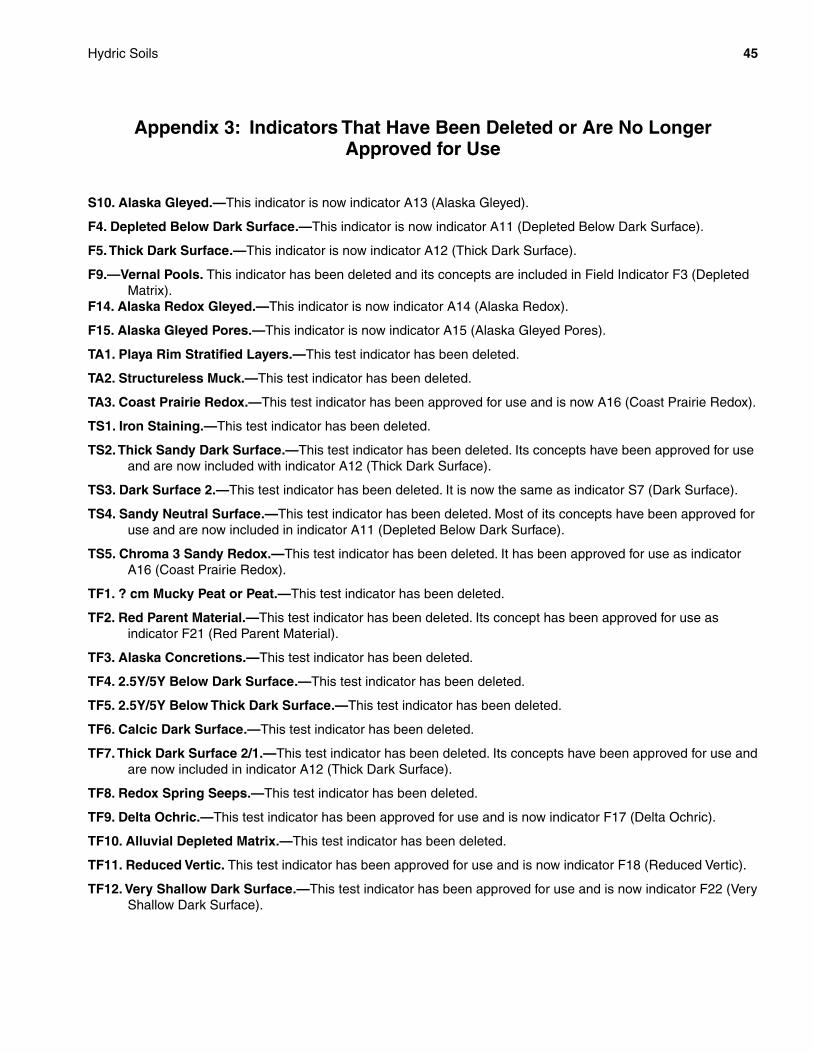
45Hydric Soils
Appendix 3: Indicators That Have Been Deleted or Are No Longer Approved for Use
S10. Alaska Gleyed.—This indicator is now indicator A13 (Alaska Gleyed).
F4. Depleted Below Dark Surface.—This indicator is now indicator A11 (Depleted Below Dark Surface).
F5. Thick Dark Surface.—This indicator is now indicator A12 (Thick Dark Surface).
F9.—Vernal Pools. This indicator has been deleted and its concepts are included in Field Indicator F3 (Depleted Matrix).
F14. Alaska Redox Gleyed.—This indicator is now indicator A14 (Alaska Redox).
F15. Alaska Gleyed Pores.—This indicator is now indicator A15 (Alaska Gleyed Pores).
TA1. Playa Rim Stratified Layers.—This test indicator has been deleted.
TA2. Structureless Muck.—This test indicator has been deleted.
TA3. Coast Prairie Redox.—This test indicator has been approved for use and is now A16 (Coast Prairie Redox).
TS1. Iron Staining.—This test indicator has been deleted.
TS2. Thick Sandy Dark Surface.—This test indicator has been deleted. Its concepts have been approved for use and are now included with indicator A12 (Thick Dark Surface).
TS3. Dark Surface 2.—This test indicator has been deleted. It is now the same as indicator S7 (Dark Surface).
TS4. Sandy Neutral Surface.—This test indicator has been deleted. Most of its concepts have been approved for use and are now included in indicator A11 (Depleted Below Dark Surface).
TS5. Chroma 3 Sandy Redox.—This test indicator has been deleted. It has been approved for use as indicator A16 (Coast Prairie Redox).
TF1. ? cm Mucky Peat or Peat.—This test indicator has been deleted.
TF2. Red Parent Material.—This test indicator has been deleted. Its concept has been approved for use as indicator F21 (Red Parent Material).
TF3. Alaska Concretions.—This test indicator has been deleted.
TF4. 2.5Y/5Y Below Dark Surface.—This test indicator has been deleted.
TF5. 2.5Y/5Y Below Thick Dark Surface.—This test indicator has been deleted.
TF6. Calcic Dark Surface.—This test indicator has been deleted.
TF7. Thick Dark Surface 2/1.—This test indicator has been deleted. Its concepts have been approved for use and are now included in indicator A12 (Thick Dark Surface).
TF8. Redox Spring Seeps.—This test indicator has been deleted.
TF9. Delta Ochric.—This test indicator has been approved for use and is now indicator F17 (Delta Ochric).
TF10. Alluvial Depleted Matrix.—This test indicator has been deleted.
TF11. Reduced Vertic. This test indicator has been approved for use and is now indicator F18 (Reduced Vertic).
TF12. Very Shallow Dark Surface.—This test indicator has been approved for use and is now indicator F22 (Very Shallow Dark Surface).


Accessibility StatementThe U.S. Department of Agriculture is committed to making its electronic and
information technologies accessible to individuals with disabilities by meeting or exceeding the requirements of Section 508 of the Rehabilitation Act (29 U.S.C. 794d), as amended in 1998. Section 508 is a federal law that requires agencies to provide individuals with disabilities equal access to electronic information and data comparable to those who do not have disabilities, unless an undue burden would be imposed on the agency. The Section 508 standards are the technical requirements and criteria that are used to measure conformance within this law. More information on Section 508 and the technical standards can be found at www.section508.gov.
If you require assistance or wish to report an issue related to the accessibility of any content on this website, please email [email protected]. If applicable, please include the web address or URL and the specific problems you have encountered. You may also contact a representative from the USDA Section 508 Coordination Team.