Embed Size (px)
Citation preview
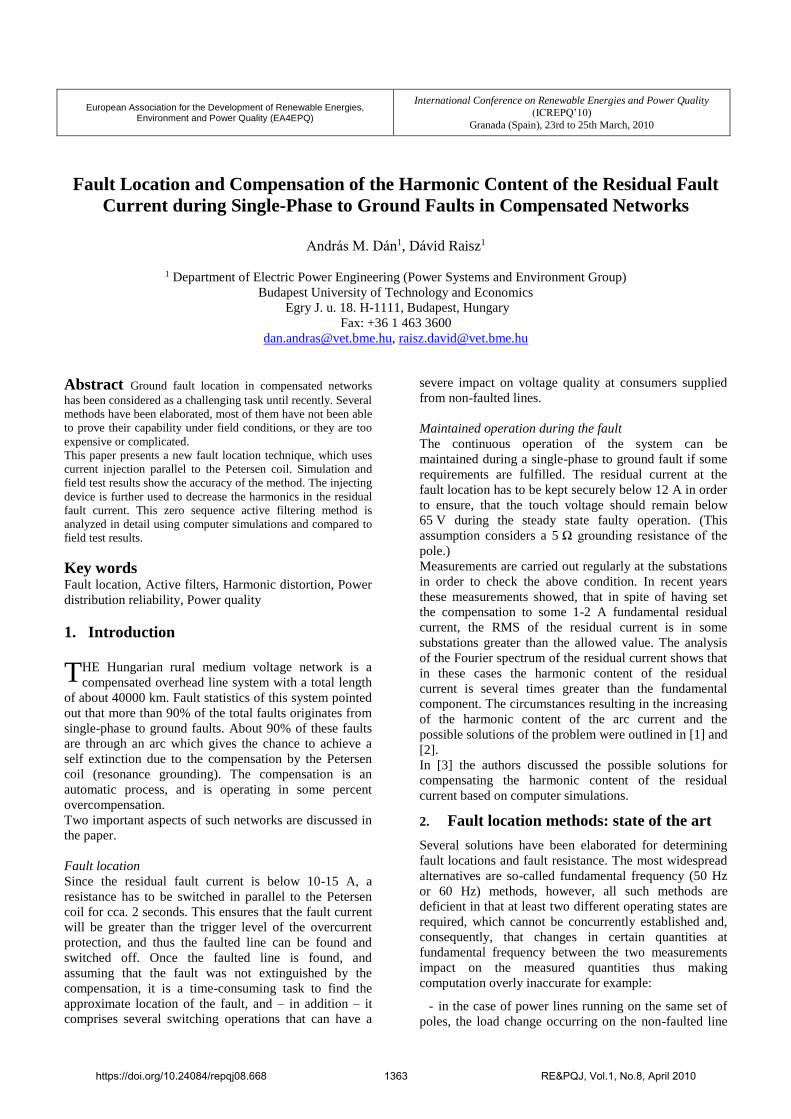
European Association for the Development of Renewable Energies, Environment and Power Quality (EA4EPQ)
International Conference on Renewable Energies and Power Quality
(ICREPQ’10)
Granada (Spain), 23rd to 25th March, 2010
Fault Location and Compensation of the Harmonic Content of the Residual Fault
Current during Single-Phase to Ground Faults in Compensated Networks
András M. Dán1, Dávid Raisz1
1 Department of Electric Power Engineering (Power Systems and Environment Group)
Budapest University of Technology and Economics
Egry J. u. 18. H-1111, Budapest, Hungary
Fax: +36 1 463 3600
[email protected], [email protected]
Abstract Ground fault location in compensated networks
has been considered as a challenging task until recently. Several
methods have been elaborated, most of them have not been able
to prove their capability under field conditions, or they are too
expensive or complicated.
This paper presents a new fault location technique, which uses
current injection parallel to the Petersen coil. Simulation and
field test results show the accuracy of the method. The injecting
device is further used to decrease the harmonics in the residual
fault current. This zero sequence active filtering method is
analyzed in detail using computer simulations and compared to
field test results.
Key words Fault location, Active filters, Harmonic distortion, Power
distribution reliability, Power quality
1. Introduction
HE Hungarian rural medium voltage network is a
compensated overhead line system with a total length
of about 40000 km. Fault statistics of this system pointed
out that more than 90% of the total faults originates from
single-phase to ground faults. About 90% of these faults
are through an arc which gives the chance to achieve a
self extinction due to the compensation by the Petersen
coil (resonance grounding). The compensation is an
automatic process, and is operating in some percent
overcompensation.
Two important aspects of such networks are discussed in
the paper.
Fault location
Since the residual fault current is below 10-15 A, a
resistance has to be switched in parallel to the Petersen
coil for cca. 2 seconds. This ensures that the fault current
will be greater than the trigger level of the overcurrent
protection, and thus the faulted line can be found and
switched off. Once the faulted line is found, and
assuming that the fault was not extinguished by the
compensation, it is a time-consuming task to find the
approximate location of the fault, and – in addition – it
comprises several switching operations that can have a
severe impact on voltage quality at consumers supplied
from non-faulted lines.
Maintained operation during the fault
The continuous operation of the system can be
maintained during a single-phase to ground fault if some
requirements are fulfilled. The residual current at the
fault location has to be kept securely below 12 A in order
to ensure, that the touch voltage should remain below
65 V during the steady state faulty operation. (This
assumption considers a 5 Ω grounding resistance of the
pole.)
Measurements are carried out regularly at the substations
in order to check the above condition. In recent years
these measurements showed, that in spite of having set
the compensation to some 1-2 A fundamental residual
current, the RMS of the residual current is in some
substations greater than the allowed value. The analysis
of the Fourier spectrum of the residual current shows that
in these cases the harmonic content of the residual
current is several times greater than the fundamental
component. The circumstances resulting in the increasing
of the harmonic content of the arc current and the
possible solutions of the problem were outlined in [1] and
[2].
In [3] the authors discussed the possible solutions for
compensating the harmonic content of the residual
current based on computer simulations.
2. Fault location methods: state of the art
Several solutions have been elaborated for determining
fault locations and fault resistance. The most widespread
alternatives are so-called fundamental frequency (50 Hz
or 60 Hz) methods, however, all such methods are
deficient in that at least two different operating states are
required, which cannot be concurrently established and,
consequently, that changes in certain quantities at
fundamental frequency between the two measurements
impact on the measured quantities thus making
computation overly inaccurate for example:
- in the case of power lines running on the same set of
poles, the load change occurring on the non-faulted line
T
https://doi.org/10.24084/repqj08.668 1363 RE&PQJ, Vol.1, No.8, April 2010
induces a voltage in the faulted one thus falsifying the
measurement being done thereon,
- during a short-circuit existing on the medium voltage
network (while measurements are being done), any short-
circuit happening on the high-voltage side results in a
zero sequence induction in medium voltage thus
falsifying the measurement being done on the medium
voltage side,
- the load varies on the faulted or non-faulted branches.
An additional deficiency of calculation involving
fundamental frequency quantities is that, for the benefit
of accuracy, measurement needs to be performed for a
long time (several seconds) due to the creation of various
operating states so, during measurement, there is a
considerable probability of
- the above-mentioned phenomena occurring,
- the fault location’s impedance value changes, which
likewise usually degrades accuracy in fault location
determination.
A deterministic direct method is described in [5],
however, this can only be used in the case of dedicated
cable lines. It relies on computer simulation and assumes
knowledge of all parameters as well as homogeneity over
the entire measured length. This known solution is
deficient in that it considers only fundamental frequency
(e.g. 60 Hz) signals, furthermore, it does not take into
account any measurement uncertainties, under realistic
circumstances probably works at a high error rate due to
computer simulation being used, and is suitable only for
determining cable faults so it does not facilitate use on
overhead lines or mixed networks.
A procedure described in [6] likewise represents the state
of the art and allows calculation of the fault location
distance in the case of single-phase to ground faults. The
procedure employs a fundamental frequency signal.
Measurement is based on forced changing of the zero
sequence impedance, utilizing measurement results
obtained for the two different values thereof.
Consequently, the fault has to exist for a relatively long
duration and, due to the use of a lumped parameter
model, experience shows that its accuracy is lower than if
distributed parameter lines were used. Additionally, the
procedure does not take into account positive and
negative sequence capacities whose ignorance likewise
reduces accuracy.
The procedure described in [7] involves detection of
single-phase to ground faults on radial distribution lines.
The solution has the same disadvantage as the method
described in [6].
[8] likewise deals with fault location which essence is
that a loop is created for a short duration using the
defective and a non-faulted branch whenever there is a
fault and that the fault location is determined based on
information (numerical measurement data) that can be
obtained from the loop configuration. The deficiency of
this known solution is that conditions for creating a loop
are not given in every case, as mentioned in [7],
furthermore, due to the usage of fundamental frequency
(e.g. 50 Hz) quantities, the disadvantages already
summarized in the introduction also appear in this
solution.
A procedure described in [9] is used to determine the
location of single-phase to ground faults in electric
distribution networks by processing transient signals.
This solution is deficient in that the transient process
depends on the fault location’s resistance, which renders
this procedure inaccurate, therefore, its use is not
expedient, which is even referred to in several later patent
descriptions.
The procedure and equipment described in [10] is used to
locate ground faults and to determine the distance
thereof. This method involves estimation of the fault
location resistance based on fundamental frequency zero
sequence voltage and current and fundamental frequency
phase voltage, therefore, the result is expected to be
inaccurate. In addition, the disadvantages described in the
introduction also appear in this method.
Fault location on electric lines described in [11] is based
on the travelling wave reflection method. The deficiency
of this known solution is that measurement needs to be
first conducted on a non-faulted, switched off and non-
operating line, for example during commissioning, which
makes subsequent installation circumstantial and the
measurements need to be repeated for example whenever
a new side-line is installed, furthermore, a generator
suitable for creating and coupling impulses shorter than
2 ns is required, which likewise makes practical use
difficult and significantly raises costs.
3. Fault Location Using Current injection
In the present paper a new method is proposed, where
fault location is performed by injecting current in parallel
to the Petersen coil. The frequency of the injected current
is chosen so that it does not coincide with any of the
harmonic or ripple control frequencies that are present at
the network. (The injected current can be composed of
multiple frequencies.) Therefore this method is
independent from the disturbing effects of external
circumstances to a great degree.
For the benefit of continuous power supply, this method
is implemented economically, employing a simple
design, adapted to the substation protection automation
system; it is more accurate than the known solutions,
employing real-time measurements of relatively short
duration. (The measurement takes approx. 1.5 s, which is
smaller than the time allowed before the resistance is
switched parallel to the Petersen coil.) Zero sequence
voltages and currents measured in the substation are the
input signals to the calculation procedure. The method is
described in detail in [12].
Simulation and Sensitivity Analysis
A 22 kV overhead line network has been modeled,
which was fed by a transformer having a nominal power
of Sn = 40 MVA and a drop of = 10 %; the R/X was
taken 0.1.
The geometry of the overhead line can be seen in Fig. 1:
https://doi.org/10.24084/repqj08.668 1364 RE&PQJ, Vol.1, No.8, April 2010
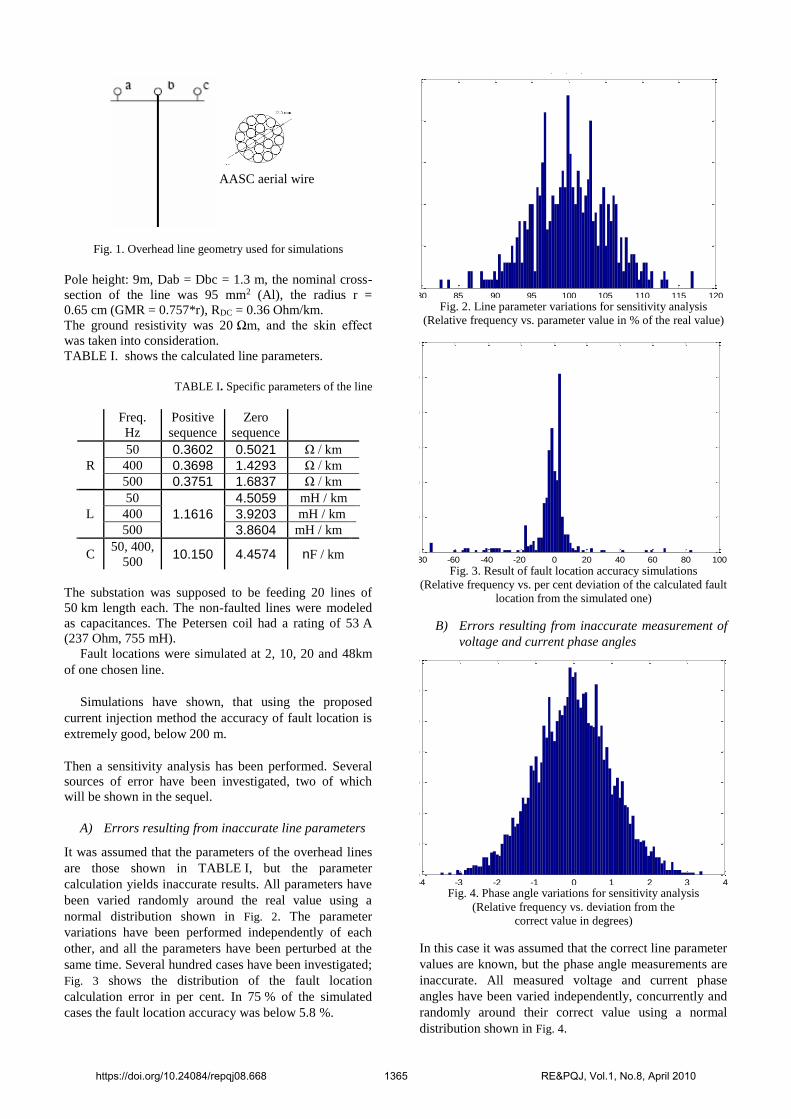
Fig. 1. Overhead line geometry used for simulations
Pole height: 9m, Dab = Dbc = 1.3 m, the nominal cross-
section of the line was 95 mm2 (Al), the radius r =
0.65 cm (GMR = 0.757*r), RDC = 0.36 Ohm/km.
The ground resistivity was 20 Ωm, and the skin effect
was taken into consideration.
TABLE I. shows the calculated line parameters.
TABLE I. Specific parameters of the line
Freq.
Hz
Positive
sequence
Zero
sequence
50 0.3602 0.5021 Ω / km
R 400 0.3698 1.4293 Ω / km
500 0.3751 1.6837 Ω / km
50
1.1616
4.5059 mH / km
L 400 3.9203 mH / km
500 3.8604 mH / km
C 50, 400,
500 10.150 4.4574 nF / km
The substation was supposed to be feeding 20 lines of
50 km length each. The non-faulted lines were modeled
as capacitances. The Petersen coil had a rating of 53 A
(237 Ohm, 755 mH).
Fault locations were simulated at 2, 10, 20 and 48km
of one chosen line.
Simulations have shown, that using the proposed
current injection method the accuracy of fault location is
extremely good, below 200 m.
Then a sensitivity analysis has been performed. Several
sources of error have been investigated, two of which
will be shown in the sequel.
A) Errors resulting from inaccurate line parameters
It was assumed that the parameters of the overhead lines
are those shown in TABLE I, but the parameter
calculation yields inaccurate results. All parameters have
been varied randomly around the real value using a
normal distribution shown in Fig. 2. The parameter
variations have been performed independently of each
other, and all the parameters have been perturbed at the
same time. Several hundred cases have been investigated;
Fig. 3 shows the distribution of the fault location
calculation error in per cent. In 75 % of the simulated
cases the fault location accuracy was below 5.8 %.
80 85 90 95 100 105 110 115 1200
5
10
15
20
25
Gyakoriság
Mért értékek abszolútértékének eltérése a valóságostól, %
Zárlatok 2, 10, 20, 48 km-nél
Fig. 2. Line parameter variations for sensitivity analysis
(Relative frequency vs. parameter value in % of the real value)
-80 -60 -40 -20 0 20 40 60 80 1000
20
40
60
80
100
120
Gyakoriság (
Összesen 5
12 e
set)
Számított zárlati hely távolság %
Az esetek 75%-ában 5.8252 % alatti a hiba
Fig. 3. Result of fault location accuracy simulations
(Relative frequency vs. per cent deviation of the calculated fault
location from the simulated one)
B) Errors resulting from inaccurate measurement of
voltage and current phase angles
-4 -3 -2 -1 0 1 2 3 40
20
40
60
80
100
120
140
Mért értékek szögének és a valódinak a különbsége, fok
Gyakoriság
Zárlatok 2, 10, 20, 48 km-nél
Fig. 4. Phase angle variations for sensitivity analysis
(Relative frequency vs. deviation from the
correct value in degrees)
In this case it was assumed that the correct line parameter
values are known, but the phase angle measurements are
inaccurate. All measured voltage and current phase
angles have been varied independently, concurrently and
randomly around their correct value using a normal
distribution shown in Fig. 4.
KöfKöf
Ötvözött alu sodrony
(AASC)
Ötvözött alu sodrony
(AASC)AASC aerial wire
https://doi.org/10.24084/repqj08.668 1365 RE&PQJ, Vol.1, No.8, April 2010
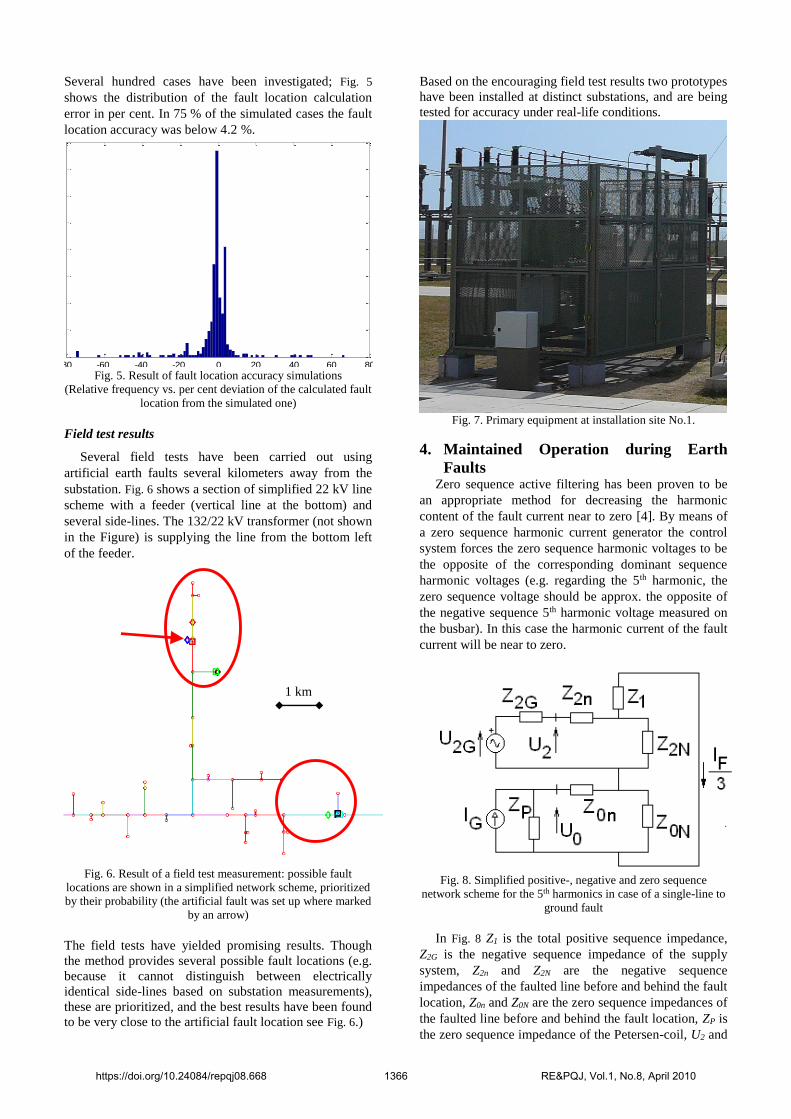
Several hundred cases have been investigated; Fig. 5
shows the distribution of the fault location calculation
error in per cent. In 75 % of the simulated cases the fault
location accuracy was below 4.2 %.
-80 -60 -40 -20 0 20 40 60 800
20
40
60
80
100
120
140
160
Gyakoriság (
Összesen 6
40 e
set)
Számított zárlati hely távolság %
Az esetek 75%-ában 4.1667 % alatti a hiba
Fig. 5. Result of fault location accuracy simulations
(Relative frequency vs. per cent deviation of the calculated fault
location from the simulated one)
Field test results
Several field tests have been carried out using
artificial earth faults several kilometers away from the
substation. Fig. 6 shows a section of simplified 22 kV line
scheme with a feeder (vertical line at the bottom) and
several side-lines. The 132/22 kV transformer (not shown
in the Figure) is supplying the line from the bottom left
of the feeder.
Fig. 6. Result of a field test measurement: possible fault
locations are shown in a simplified network scheme, prioritized
by their probability (the artificial fault was set up where marked
by an arrow)
The field tests have yielded promising results. Though
the method provides several possible fault locations (e.g.
because it cannot distinguish between electrically
identical side-lines based on substation measurements),
these are prioritized, and the best results have been found
to be very close to the artificial fault location see Fig. 6.)
Based on the encouraging field test results two prototypes
have been installed at distinct substations, and are being
tested for accuracy under real-life conditions.
Fig. 7. Primary equipment at installation site No.1.
4. Maintained Operation during Earth
Faults Zero sequence active filtering has been proven to be
an appropriate method for decreasing the harmonic
content of the fault current near to zero [4]. By means of
a zero sequence harmonic current generator the control
system forces the zero sequence harmonic voltages to be
the opposite of the corresponding dominant sequence
harmonic voltages (e.g. regarding the 5th harmonic, the
zero sequence voltage should be approx. the opposite of
the negative sequence 5th harmonic voltage measured on
the busbar). In this case the harmonic current of the fault
current will be near to zero.
Fig. 8. Simplified positive-, negative and zero sequence
network scheme for the 5th harmonics in case of a single-line to
ground fault
In Fig. 8 Z1 is the total positive sequence impedance,
Z2G is the negative sequence impedance of the supply
system, Z2n and Z2N are the negative sequence
impedances of the faulted line before and behind the fault
location, Z0n and Z0N are the zero sequence impedances of
the faulted line before and behind the fault location, ZP is
the zero sequence impedance of the Petersen-coil, U2 and
1 km
https://doi.org/10.24084/repqj08.668 1366 RE&PQJ, Vol.1, No.8, April 2010
U0 are the negative and zero sequence voltages at the
busbar, IF is the fault current. The dominant part of the 5th
harmonic currents and voltages in the non-faulted case
composes a negative sequence system, therefore the 5th
harmonic voltage generator exists only in the negative
sequence system. The zero sequence active filter can be
modeled as a controlled current source IG connected in
parallel to the Petersen coil.
The control algorithm seeks to minimize an error term
ΔU in order to decrease the 5th harmonic component in
the fault current.
The following definition of ΔU will be used:
20 UUU (1)
As an explanation of (1) consider, that
– Z1 can be neglected (i.e. the voltage drop at the
positive sequence network is negligible)
– Z0n can be neglected (as compared to ZP),
therefore U0 approximately equals the voltage
drop at Z0N
Thus from Fig. 8 it can be seen, that if 20 UU then
there will be no 5th harmonic current flowing through the
fault location.
Simulation and field test results are in good coincidence
and will be presented in the final paper in greater detail.
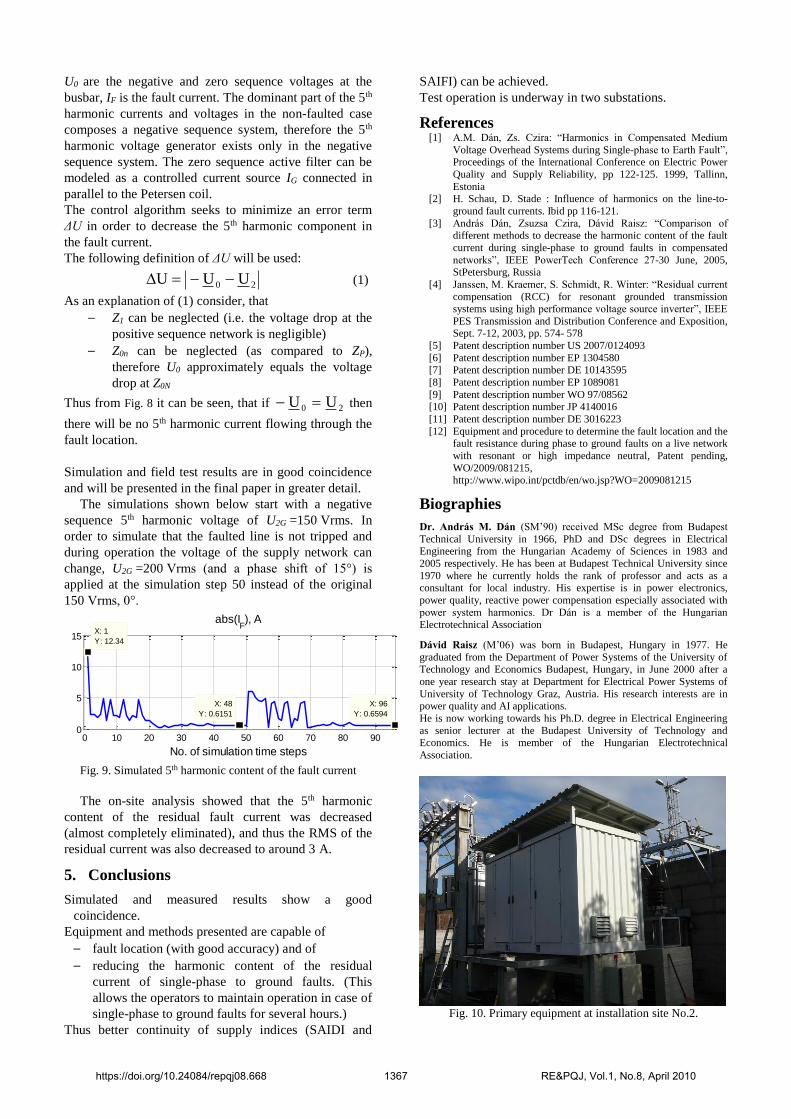
The simulations shown below start with a negative
sequence 5th harmonic voltage of U2G =150 Vrms. In
order to simulate that the faulted line is not tripped and
during operation the voltage of the supply network can
change, U2G =200 Vrms (and a phase shift of 15°) is
applied at the simulation step 50 instead of the original
150 Vrms, 0°. 0 10 20 30 40 50 60 70 80 90
0
50
100
150
200
U, V
0 10 20 30 40 50 60 70 80 900
5
10
15
X: 96
Y: 0.6594
X: 48
Y: 0.6151
X: 1
Y: 12.34
abs(IF), A
No. of simulation time steps
Fig. 9. Simulated 5th harmonic content of the fault current
The on-site analysis showed that the 5th harmonic
content of the residual fault current was decreased
(almost completely eliminated), and thus the RMS of the
residual current was also decreased to around 3 A.
5. Conclusions
Simulated and measured results show a good
coincidence.
Equipment and methods presented are capable of
– fault location (with good accuracy) and of
– reducing the harmonic content of the residual
current of single-phase to ground faults. (This
allows the operators to maintain operation in case of
single-phase to ground faults for several hours.)
Thus better continuity of supply indices (SAIDI and
SAIFI) can be achieved.
Test operation is underway in two substations.
References [1] A.M. Dán, Zs. Czira: “Harmonics in Compensated Medium
Voltage Overhead Systems during Single-phase to Earth Fault”, Proceedings of the International Conference on Electric Power
Quality and Supply Reliability, pp 122-125. 1999, Tallinn,
Estonia [2] H. Schau, D. Stade : Influence of harmonics on the line-to-
ground fault currents. Ibid pp 116-121.
[3] András Dán, Zsuzsa Czira, Dávid Raisz: “Comparison of different methods to decrease the harmonic content of the fault
current during single-phase to ground faults in compensated
networks”, IEEE PowerTech Conference 27-30 June, 2005, StPetersburg, Russia
[4] Janssen, M. Kraemer, S. Schmidt, R. Winter: “Residual current
compensation (RCC) for resonant grounded transmission systems using high performance voltage source inverter”, IEEE
PES Transmission and Distribution Conference and Exposition, Sept. 7-12, 2003, pp. 574- 578
[5] Patent description number US 2007/0124093
[6] Patent description number EP 1304580 [7] Patent description number DE 10143595
[8] Patent description number EP 1089081
[9] Patent description number WO 97/08562 [10] Patent description number JP 4140016
[11] Patent description number DE 3016223
[12] Equipment and procedure to determine the fault location and the fault resistance during phase to ground faults on a live network
with resonant or high impedance neutral, Patent pending,
WO/2009/081215, http://www.wipo.int/pctdb/en/wo.jsp?WO=2009081215
Biographies
Dr. András M. Dán (SM’90) received MSc degree from Budapest
Technical University in 1966, PhD and DSc degrees in Electrical Engineering from the Hungarian Academy of Sciences in 1983 and
2005 respectively. He has been at Budapest Technical University since
1970 where he currently holds the rank of professor and acts as a consultant for local industry. His expertise is in power electronics,
power quality, reactive power compensation especially associated with
power system harmonics. Dr Dán is a member of the Hungarian
Electrotechnical Association
Dávid Raisz (M’06) was born in Budapest, Hungary in 1977. He
graduated from the Department of Power Systems of the University of Technology and Economics Budapest, Hungary, in June 2000 after a
one year research stay at Department for Electrical Power Systems of
University of Technology Graz, Austria. His research interests are in power quality and AI applications.
He is now working towards his Ph.D. degree in Electrical Engineering
as senior lecturer at the Budapest University of Technology and Economics. He is member of the Hungarian Electrotechnical
Association.
Fig. 10. Primary equipment at installation site No.2.
https://doi.org/10.24084/repqj08.668 1367 RE&PQJ, Vol.1, No.8, April 2010
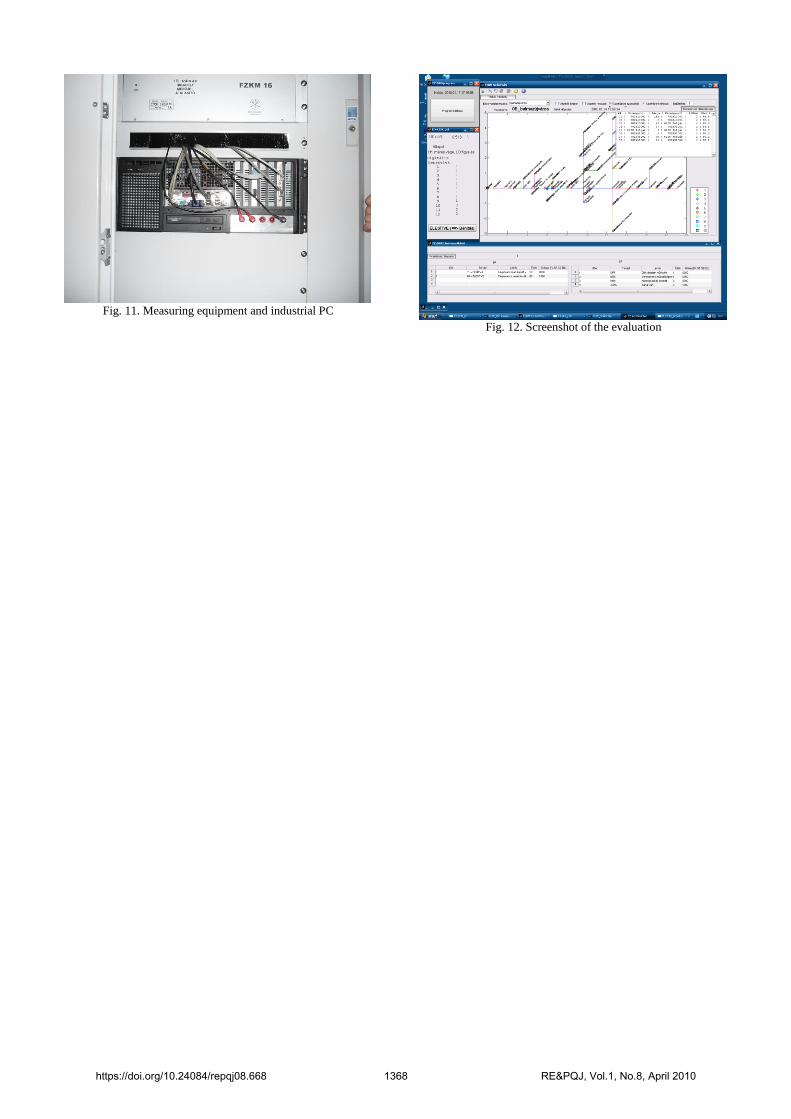
Fig. 11. Measuring equipment and industrial PC
Fig. 12. Screenshot of the evaluation
https://doi.org/10.24084/repqj08.668 1368 RE&PQJ, Vol.1, No.8, April 2010