Embed Size (px)
Citation preview
Article
Challenges with Harmonic Compensation at aRemote Bus in Offshore Wind Power Plant
Sanjay Chaudhary 1,†*, Cristian Lascu 1, Bakhtyar Hoseinzadeh 1, Remus Teodorescu 1, ŁukaszKocewiak 2, and Troels Sørensen 2
1 Department of Energy Technology, Aalborg University, Fredrik Bajers Vej 5, 9100 Aalborg, Denmark; [email protected], [email protected], [email protected], [email protected] 2 DONG Energy Wind Power, Fredericia, Denmark; [email protected], [email protected]
* Correspondence: [email protected]; Tel.: +45-2137 1034
† This paper is an extended version of our paper published in IEEE 16th International Conference on
Environment and Electrical Engineering (EEEIC) 2016.
Abstract: The interaction between the grid network and the offshore wind power plant (WPP)1
network can lead to the amplification of certain harmonics and potentially resonant conditions.2
Offshore WPP should limit the increment of harmonic voltage distortion at the point of connection3
to the grid network as well as within their internal network. The harmonic distortion should be4
limited within the planning level limits using harmonic compensation, which is usually achieved by5
using static filters. In this paper an active damping compensation strategy with a STATCOM using6
emulation of resistance at the harmonic frequencies of concern is analysed. Such a compensation is7
effective for the local bus, though the performance is not guaranteed at the remote bus. This paper8
investigates the challenges associated with remote harmonic compensation in the offshore WPP,9
which is connected to the onshore grid through long high-voltage cables and transformers. First, the10
harmonic distortion and the compensating effects of the filter are theoretically assessed. Afterwards,11
they are demonstrated using harmonic propagation studies and time domain simulations in PSCAD.12
13
Keywords: harmonic distortion; active power filter; resonance; damping; wind power plants14
1. Introduction15
Several large offshore wind power plants (WPP) have been installed in Europe and many more16
are under different stages of development. These usually comprise of type III or type IV wind turbines17
(WT) with power electronic converters and are connected to the ac network through High Voltage AC18
(HVAC) or High Voltage DC (HVDC) transmission systems. HVAC transmission systems are widely19
used in large scale WPPs closer to the shore, within 50-100 km from the shore [1], due to simple20
installation and maintenance, higher reliability and less complexity in comparison to HVDC systems.21
Anholt, Horns Rev and Nysted WPPs in Denmark and Barrow wind farm in United Kingdom are22
some of the WPPs HVAC connection to the grid [2,3].23
HVAC connection of Offshore Wind Power Plants (WPPs) typically comprise of long submarine24
and underground HVAC cables up to the point of grid connection and step up transformers.25
Meanwhile, huge number of medium voltage (MV) submarine cables of network collection of26
wind turbines should not be overlooked. The combination of the transformer inductance and the27
submarine cable capacitance might produce a resonant circuit, which may cause amplification of28
harmonics [4]. Harmonic emission level of power electronic based generation sources should meet29
Preprints (www.preprints.org) | NOT PEER-REVIEWED | Posted: 16 March 2017 doi:10.20944/preprints201703.0110.v1
2 of 17
the requirements mentioned in the relevant standards including recommended (IEEE and IEC) and30
planning (G5/4-1) limits [5–7].31
Power electronic converters and non-linear loads produce the major part of grid harmonics. Grid32
background harmonic at a particular terminal reflects the overall impact of aforementioned harmonic33
sources at that specific bus, e.g. the Point of Connection (POC). Existence of harmonics in the grid is34
inevitable even in the absence of WPP. Connection of WPP to the grid, influences the effective grid35
impedance at POC. Depending on the interaction between the WPP and grid impedances, there may36
be an amplification or an attenuation of the harmonic voltage distortion. New resonant modes may37
appear and/or the existing resonant modes may move to undesirable frequencies, thereby amplifying38
the harmonic distortion leading to poor power quality at the POC exceeding the permissible levels of39
harmonic distortion. Moreover, the injection of harmonics by built-in power electronic converters of40
WPPs, may also worsen the situation.41
Current work addresses magnification of grid background harmonic due to the interaction42
between the WPP and grid impedances. The main focus is devoted to the grid background harmonics43
as the main source of harmonics and the share of Wind Turbines (WTs) in current harmonic injection is44
considered as future works. Later on, active damping of harmonics is performed by the emulation of45
resistive behaviour by the STATCOM at particular frequencies. The research findings confirm that the46
harmonic compensation is efficient at the local bus. However, its performance is not guaranteed at the47
remote buses. Due to practical considerations and current state of the art of STATCOM technology,48
the STATCOM is not connected to the high voltage buses (POC and PCC) close to the grid. To meet the49
requirements of grid codes associated with harmonics, the harmonic level should be within the limits50
specified at the PCC or POC which appear to be the remote bus with respect to the point of connection51
of the STATCOM. This paper investigates the challenges and difficulties in harmonic mitigation and52
compliance with the power quality at such remote buses.53
This paper is organized as follows. The test WPP grid network is presented along with the54
mathematical analysis of the amplification or attenuation of harmonics and the effect of harmonic55
compensation in section 2. The effect of harmonic compensation upon the harmonic impedance of56
WPP network is illustrated in in section 3. The Nyquist criterion is applied to assess the overall57
stability of the compensation strategy in section 4. The results of the harmonic propagation studies58
and time domain simulation are presented in section 5. Finally, the paper is concluded in section 6.59
2. Test WPP Grid Network60
2.1. Wind power plant model61
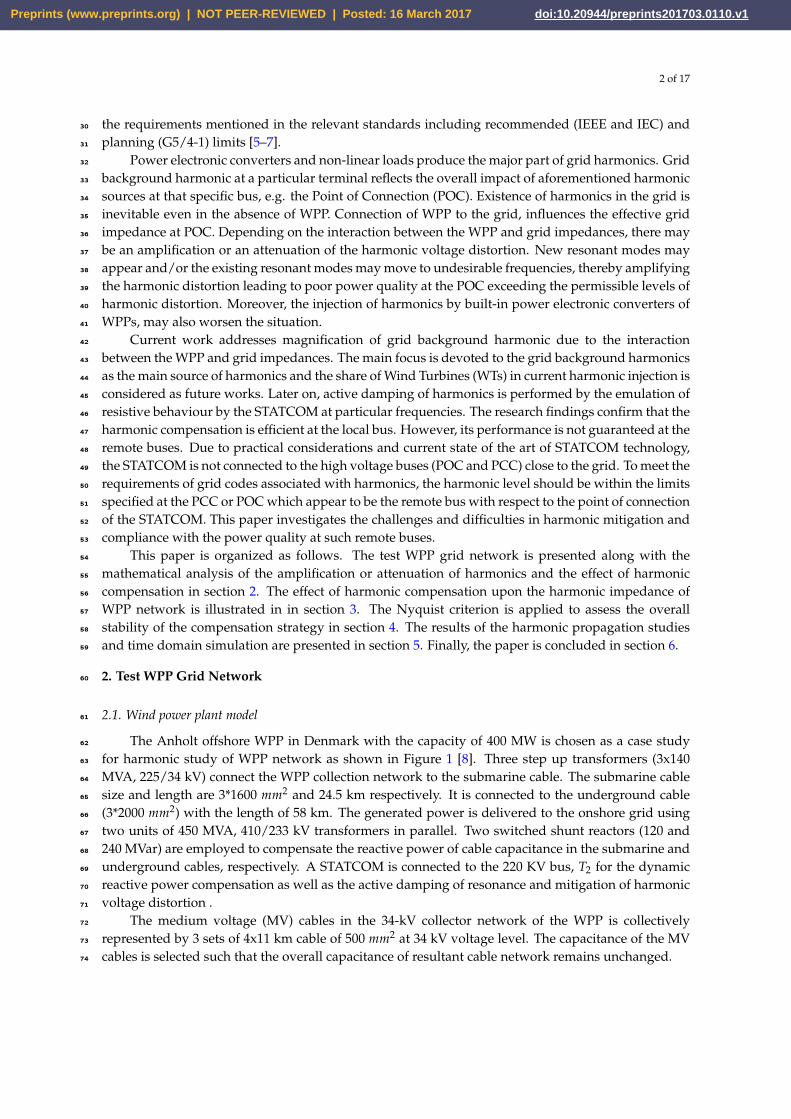
The Anholt offshore WPP in Denmark with the capacity of 400 MW is chosen as a case study62
for harmonic study of WPP network as shown in Figure 1 [8]. Three step up transformers (3x14063
MVA, 225/34 kV) connect the WPP collection network to the submarine cable. The submarine cable64
size and length are 3*1600 mm2 and 24.5 km respectively. It is connected to the underground cable65
(3*2000 mm2) with the length of 58 km. The generated power is delivered to the onshore grid using66
two units of 450 MVA, 410/233 kV transformers in parallel. Two switched shunt reactors (120 and67
240 MVar) are employed to compensate the reactive power of cable capacitance in the submarine and68
underground cables, respectively. A STATCOM is connected to the 220 KV bus, T2 for the dynamic69
reactive power compensation as well as the active damping of resonance and mitigation of harmonic70
voltage distortion .71
The medium voltage (MV) cables in the 34-kV collector network of the WPP is collectively72
represented by 3 sets of 4x11 km cable of 500 mm2 at 34 kV voltage level. The capacitance of the MV73
cables is selected such that the overall capacitance of resultant cable network remains unchanged.74
Preprints (www.preprints.org) | NOT PEER-REVIEWED | Posted: 16 March 2017 doi:10.20944/preprints201703.0110.v1
3 of 17
Figure 1. WPP electrical network model.
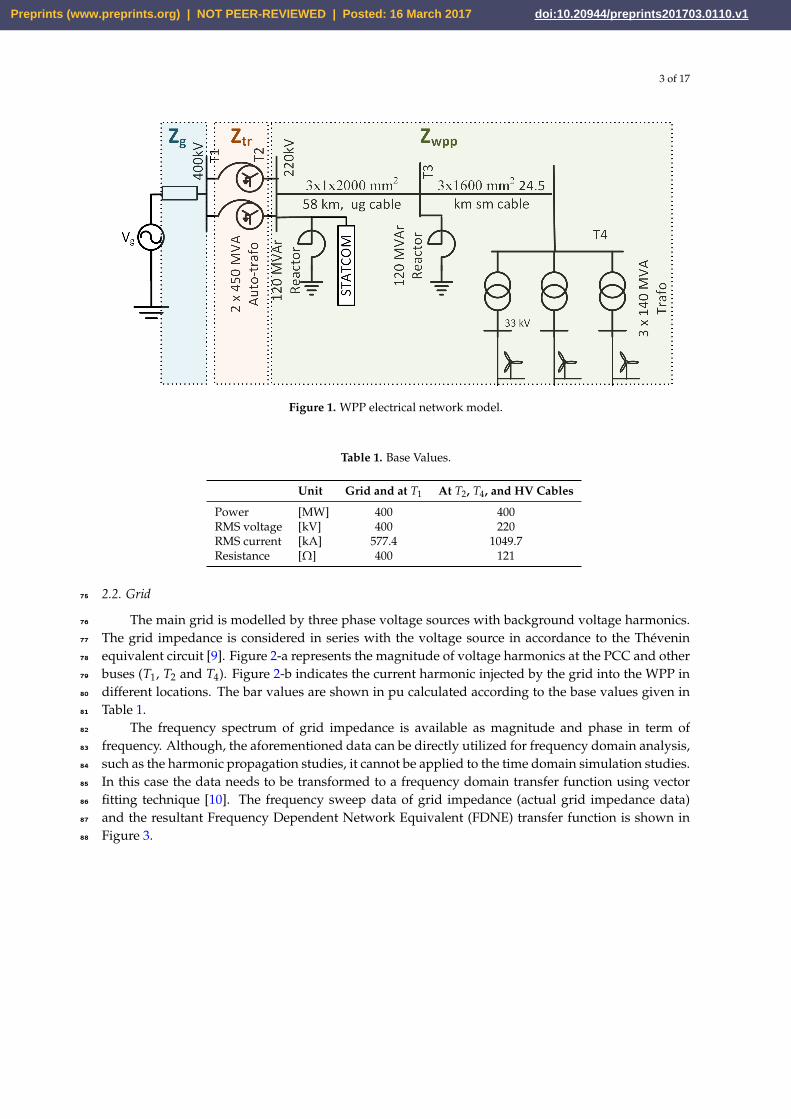
Table 1. Base Values.
Unit Grid and at T1 At T2, T4, and HV Cables
Power [MW] 400 400RMS voltage [kV] 400 220RMS current [kA] 577.4 1049.7Resistance [Ω] 400 121
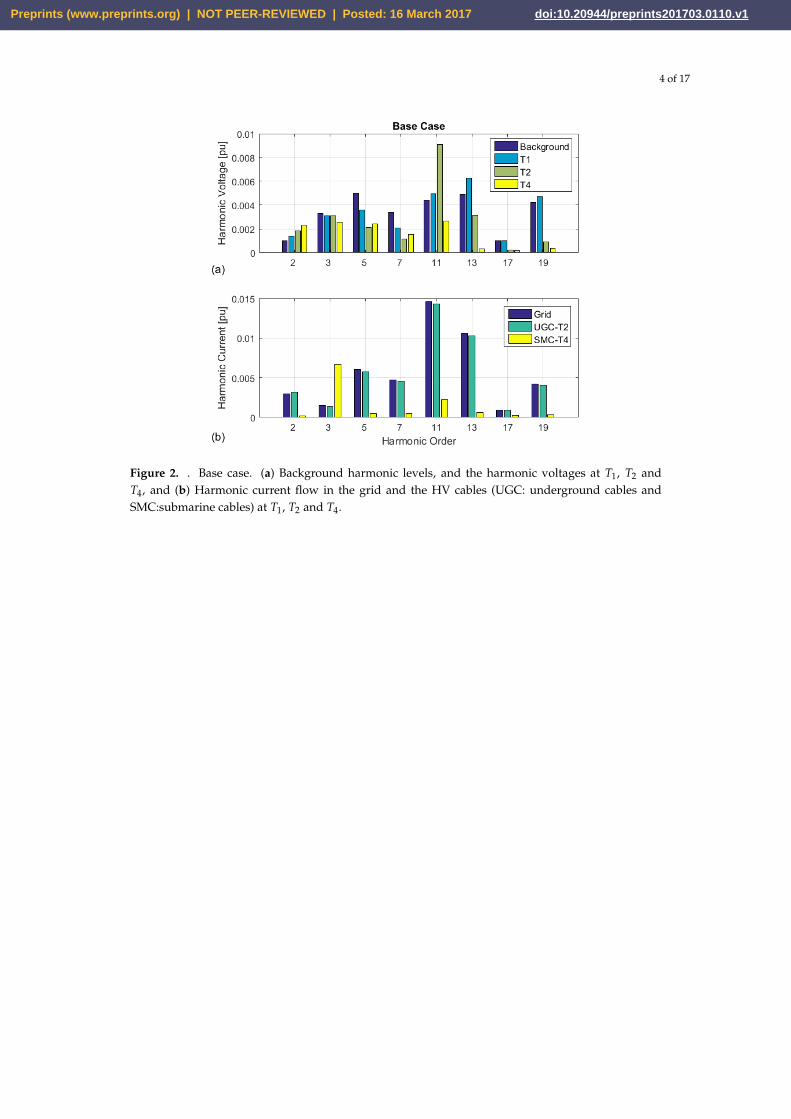
2.2. Grid75
The main grid is modelled by three phase voltage sources with background voltage harmonics.76
The grid impedance is considered in series with the voltage source in accordance to the Thévenin77
equivalent circuit [9]. Figure 2-a represents the magnitude of voltage harmonics at the PCC and other78
buses (T1, T2 and T4). Figure 2-b indicates the current harmonic injected by the grid into the WPP in79
different locations. The bar values are shown in pu calculated according to the base values given in80
Table 1.81
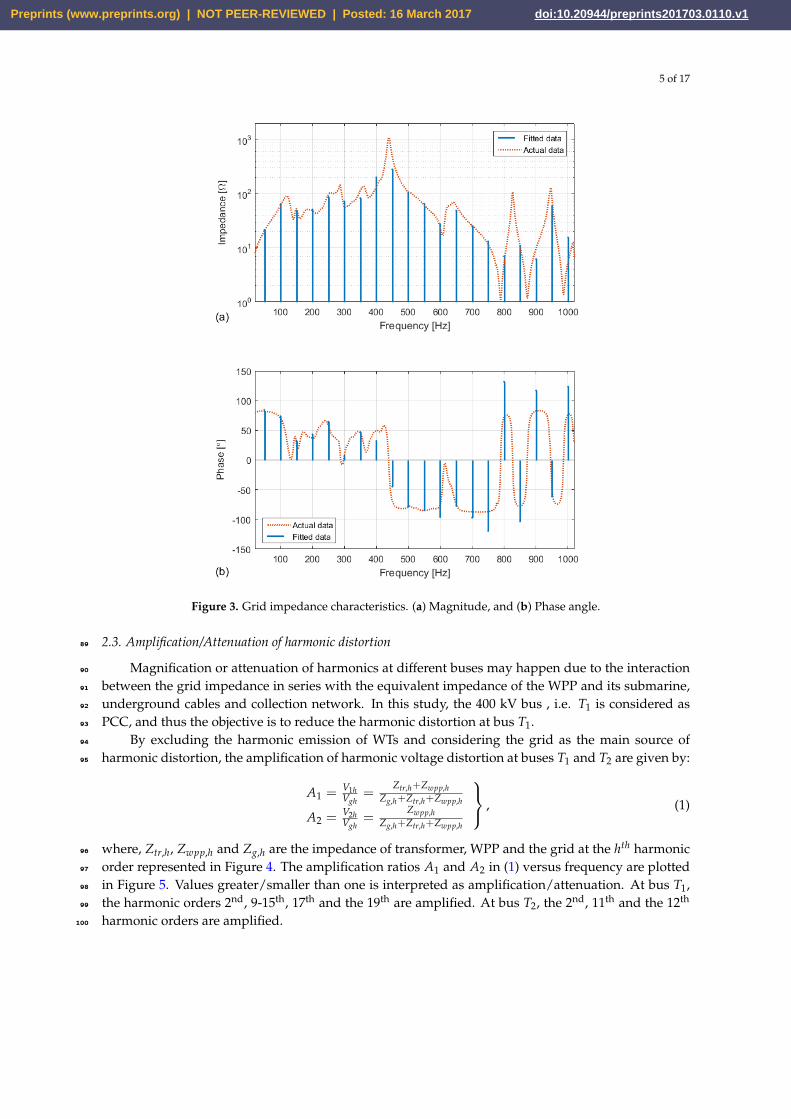
The frequency spectrum of grid impedance is available as magnitude and phase in term of82
frequency. Although, the aforementioned data can be directly utilized for frequency domain analysis,83
such as the harmonic propagation studies, it cannot be applied to the time domain simulation studies.84
In this case the data needs to be transformed to a frequency domain transfer function using vector85
fitting technique [10]. The frequency sweep data of grid impedance (actual grid impedance data)86
and the resultant Frequency Dependent Network Equivalent (FDNE) transfer function is shown in87
Figure 3.88
Preprints (www.preprints.org) | NOT PEER-REVIEWED | Posted: 16 March 2017 doi:10.20944/preprints201703.0110.v1
4 of 17
Figure 2. . Base case. (a) Background harmonic levels, and the harmonic voltages at T1, T2 andT4, and (b) Harmonic current flow in the grid and the HV cables (UGC: underground cables andSMC:submarine cables) at T1, T2 and T4.
Preprints (www.preprints.org) | NOT PEER-REVIEWED | Posted: 16 March 2017 doi:10.20944/preprints201703.0110.v1
5 of 17
Figure 3. Grid impedance characteristics. (a) Magnitude, and (b) Phase angle.
2.3. Amplification/Attenuation of harmonic distortion89
Magnification or attenuation of harmonics at different buses may happen due to the interaction90
between the grid impedance in series with the equivalent impedance of the WPP and its submarine,91
underground cables and collection network. In this study, the 400 kV bus , i.e. T1 is considered as92
PCC, and thus the objective is to reduce the harmonic distortion at bus T1.93
By excluding the harmonic emission of WTs and considering the grid as the main source of94
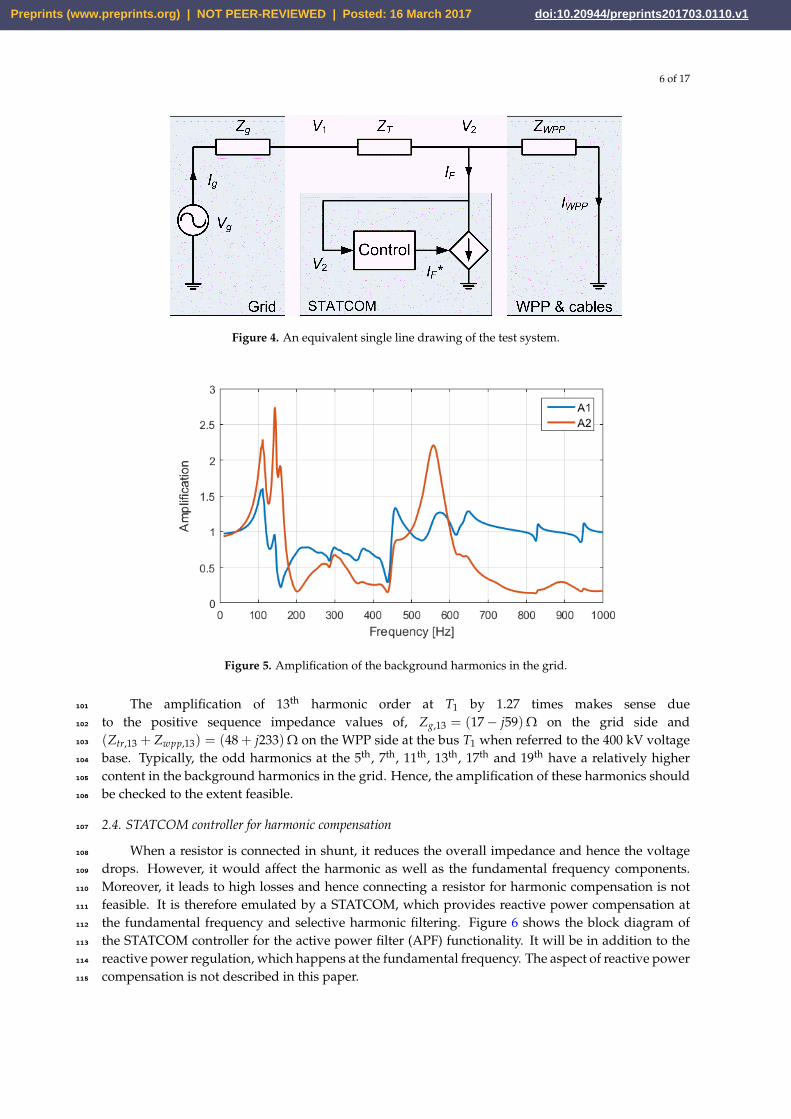
harmonic distortion, the amplification of harmonic voltage distortion at buses T1 and T2 are given by:95
A1 = V1hVgh
=Ztr,h+Zwpp,h
Zg,h+Ztr,h+Zwpp,h
A2 = V2hVgh
=Zwpp,h
Zg,h+Ztr,h+Zwpp,h
, (1)
where, Ztr,h, Zwpp,h and Zg,h are the impedance of transformer, WPP and the grid at the hth harmonic96
order represented in Figure 4. The amplification ratios A1 and A2 in (1) versus frequency are plotted97
in Figure 5. Values greater/smaller than one is interpreted as amplification/attenuation. At bus T1,98
the harmonic orders 2nd, 9-15th, 17th and the 19th are amplified. At bus T2, the 2nd, 11th and the 12th99
harmonic orders are amplified.100
Preprints (www.preprints.org) | NOT PEER-REVIEWED | Posted: 16 March 2017 doi:10.20944/preprints201703.0110.v1
6 of 17
Figure 4. An equivalent single line drawing of the test system.
Figure 5. Amplification of the background harmonics in the grid.
The amplification of 13th harmonic order at T1 by 1.27 times makes sense due101
to the positive sequence impedance values of, Zg,13 = (17 − j59)Ω on the grid side and102
(Ztr,13 + Zwpp,13) = (48 + j233)Ω on the WPP side at the bus T1 when referred to the 400 kV voltage103
base. Typically, the odd harmonics at the 5th, 7th, 11th, 13th, 17th and 19th have a relatively higher104
content in the background harmonics in the grid. Hence, the amplification of these harmonics should105
be checked to the extent feasible.106
2.4. STATCOM controller for harmonic compensation107
When a resistor is connected in shunt, it reduces the overall impedance and hence the voltage108
drops. However, it would affect the harmonic as well as the fundamental frequency components.109
Moreover, it leads to high losses and hence connecting a resistor for harmonic compensation is not110
feasible. It is therefore emulated by a STATCOM, which provides reactive power compensation at111
the fundamental frequency and selective harmonic filtering. Figure 6 shows the block diagram of112
the STATCOM controller for the active power filter (APF) functionality. It will be in addition to the113
reactive power regulation, which happens at the fundamental frequency. The aspect of reactive power114
compensation is not described in this paper.115
Preprints (www.preprints.org) | NOT PEER-REVIEWED | Posted: 16 March 2017 doi:10.20944/preprints201703.0110.v1
7 of 17
Figure 6. STATCOM controller for harmonic compensation.
The terminal voltage v2 is measured at T2 and the harmonic components are extracted using116
band-pass filters tuned around the desired harmonic frequency orders. Afterwards, the harmonic117
components are added together and multiplied by a constant admittance, k, to produce the harmonic118
current reference, i∗F to provide the harmonic compensation. The individual band pass filter around119
the harmonic frequency, ωn, has the transfer function,120
HFn(s) =G · ωn · s
s2 + 2 · ξ · ωn · s + ω2n
. (2)
Such a filter is required for each of the individual harmonic orders concerned. Therefore, the121
resultant filter transfer function is,122
HF(s) =N
∑n
2 · ξ · ωn · ss2 + 2 · ξ · ωn · s + ω2
n(3)
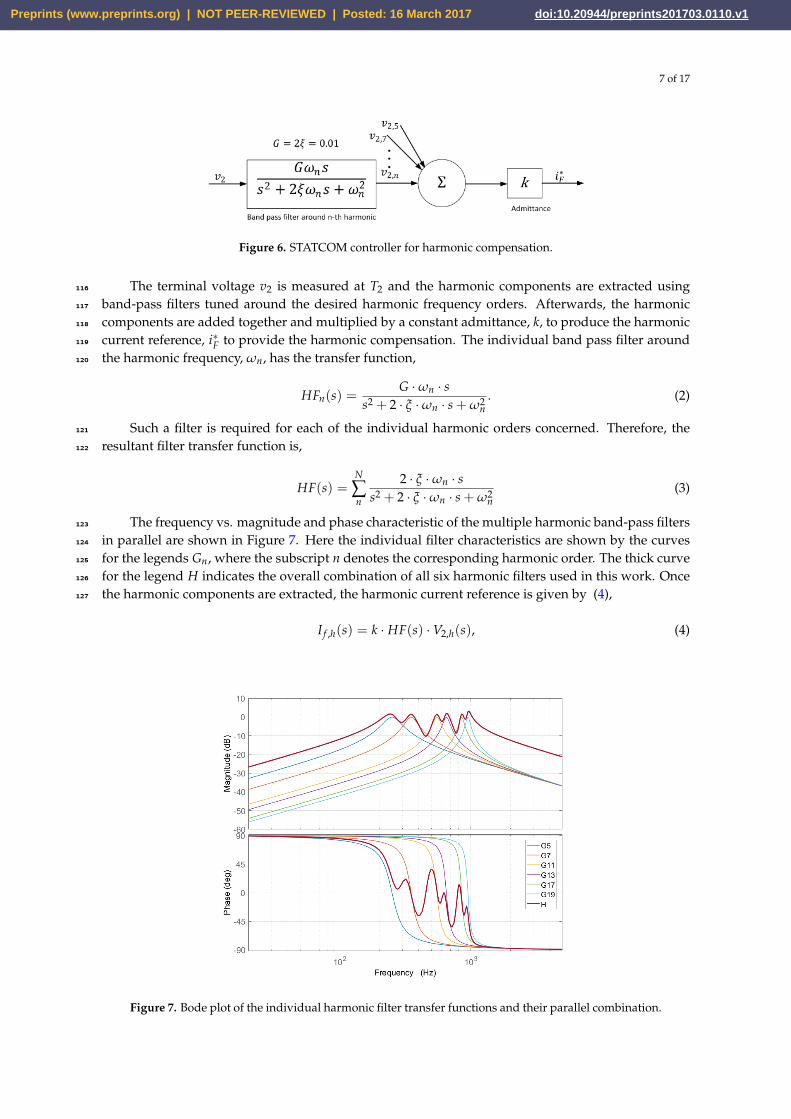
The frequency vs. magnitude and phase characteristic of the multiple harmonic band-pass filters123
in parallel are shown in Figure 7. Here the individual filter characteristics are shown by the curves124
for the legends Gn, where the subscript n denotes the corresponding harmonic order. The thick curve125
for the legend H indicates the overall combination of all six harmonic filters used in this work. Once126
the harmonic components are extracted, the harmonic current reference is given by (4),127
I f ,h(s) = k · HF(s) · V2,h(s), (4)
Figure 7. Bode plot of the individual harmonic filter transfer functions and their parallel combination.
Preprints (www.preprints.org) | NOT PEER-REVIEWED | Posted: 16 March 2017 doi:10.20944/preprints201703.0110.v1
8 of 17
where, k has the unit of admittance. It may be the same for all the desired harmonic orders, or different128
for each of the different harmonic components. Thus, the current references are proportional to the129
corresponding harmonic voltages. Since k is a real constant number, the emulated impedance is130
resistive.131
Applying the superposition theorem, the resultant harmonic voltage at the terminal T2 due to132
the background harmonic voltage in the grid, Vg,h(s), and the harmonic current, Ig,h(s), drawn by the133
STATCOM as shown in Figure 4, is given by,134
V2,h(s) =Zwpp,h(s) · Vg,h(s)− Zwpp,h(s) ·
(Zg,h + Ztr,h(s)
)· I f ,h(s)
ZΣ(s), (5)
where, ZΣ(s) = Zg,h(s) + Ztr,h(s) + Zwpp,h(s). Substituting the harmonic current reference from (4),135
V2,h(s) =Zwpp,h(s) · Vg,h(s)
ZΣ(s) ·(
1 +k·HF(s)·Zwpp,h(s)·(Zg,h(s)+Ztr,h(s))
ZΣ(s)
) . (6)
Thus, in comparison to the base case (i.e. without any compensation) the harmonic voltage is136
changed by a factor of,137
F2,h(s) =
1 +k · HF(s) · Zwpp,h ·
(Zg,h + Ztr,h
)ZΣ
(7)
Since, the harmonic voltage at T1 is given by,138
V1,h(s) =Ztr,h(s) · Vg,h(s)− Zg,h(s) · V2,h(s)
Zg,h(s) + Ztr,h(s)(8)
Using (6), (7) and (8), we get,139
V1,h(s) =
Ztr,h(s)−Zg,h(s)·Zwpp,h(s)
ZΣ(s)·F2,h(s)
Zg,h(s) + Ztr,h(s)
· Vg,h(s) (9)
3. Harmonic compensation analysis140
The WPP network is largely a radial network. When a compensating resistor is connected at a141
bus, the equivalent impedance of the network, downstream from that bus, decreases. Thus the system142
impedance characteristic gets changed. Consequently, the harmonic voltages at different buses in the143
system would change. The resultant amplification ratios for different cases with two different values144
of the harmonic filtering resistance connected at two different buses are numerically analyzed using145
(1).146
3.1. Active damping using harmonic resistance at bus T2147
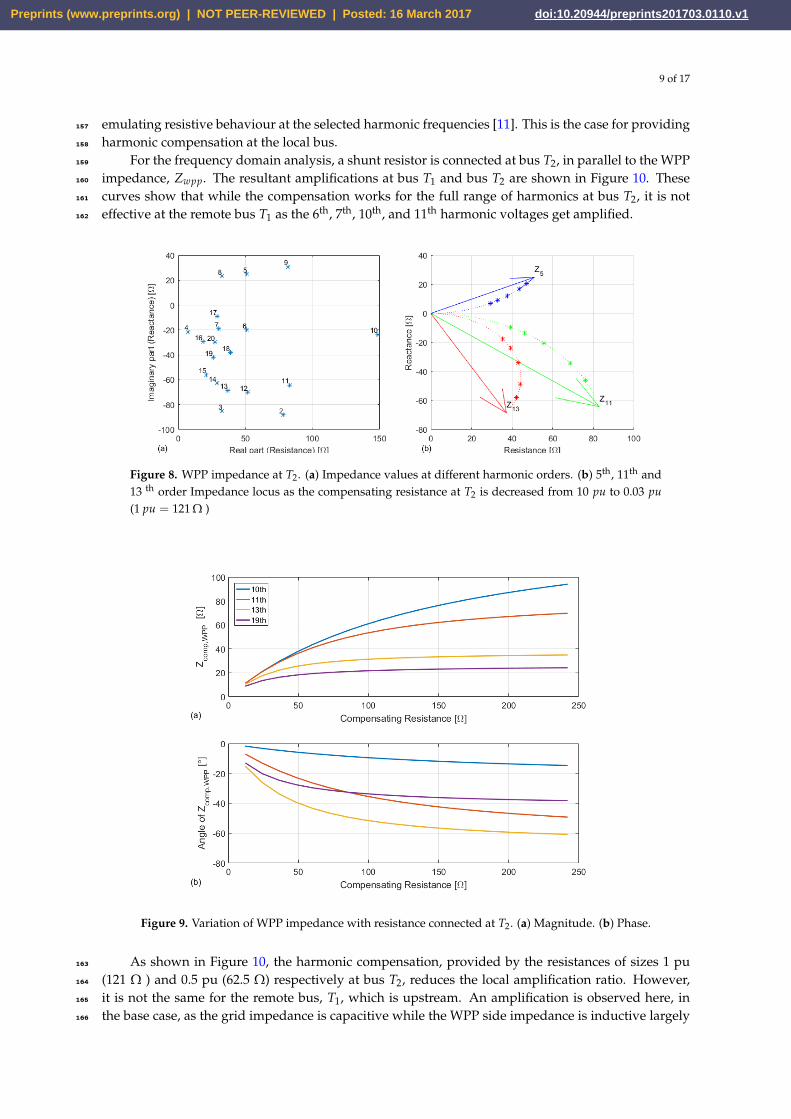
When a resistance is connected at T2, it is in parallel to the WPP impedance. Hence, the effective148
WPP impedance is lower in magnitude and its phase angle moves closer to 0, implying that it is more149
resistive as shown in Figure 8. The solid arrows indicate the 5th, 11th and the 13th harmonic impedance150
when there is no compensation. The dotted lines indicate the locus of the tip of the impedance move151
from the initial uncompensated values towards the origin, as the emulated resistance is decreased152
from 10 pu to 0.03 pu. The asterisk marks indicate the points for 2, 1.5, 1, 0.5, 0.25 pu resistive153
compensation.154
Physically, the resistors in harmonic power filters dissipate energy, and thus provide damping155
to harmonic amplifications. Likewise, the APF can provide damping to harmonic amplifications by156
Preprints (www.preprints.org) | NOT PEER-REVIEWED | Posted: 16 March 2017 doi:10.20944/preprints201703.0110.v1
9 of 17
emulating resistive behaviour at the selected harmonic frequencies [11]. This is the case for providing157
harmonic compensation at the local bus.158
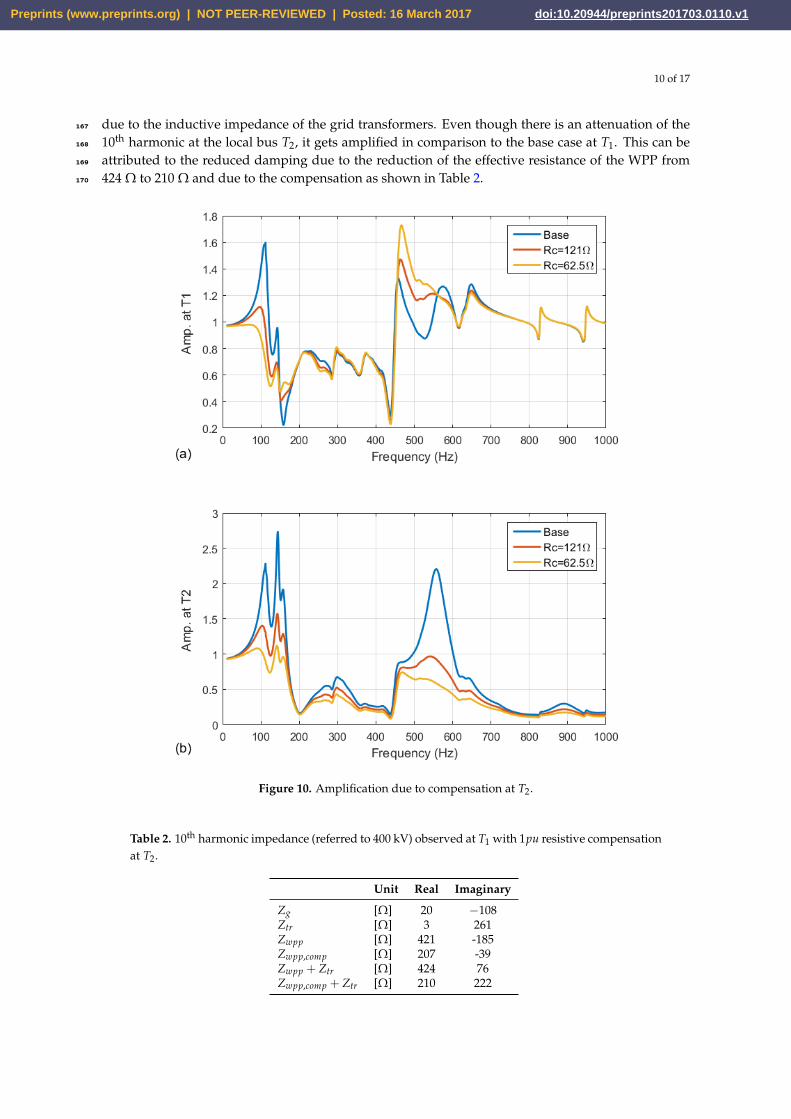
For the frequency domain analysis, a shunt resistor is connected at bus T2, in parallel to the WPP159
impedance, Zwpp. The resultant amplifications at bus T1 and bus T2 are shown in Figure 10. These160
curves show that while the compensation works for the full range of harmonics at bus T2, it is not161
effective at the remote bus T1 as the 6th, 7th, 10th, and 11th harmonic voltages get amplified.162
Figure 8. WPP impedance at T2. (a) Impedance values at different harmonic orders. (b) 5th, 11th and13 th order Impedance locus as the compensating resistance at T2 is decreased from 10 pu to 0.03 pu(1 pu = 121 Ω )
Figure 9. Variation of WPP impedance with resistance connected at T2. (a) Magnitude. (b) Phase.
As shown in Figure 10, the harmonic compensation, provided by the resistances of sizes 1 pu163
(121 Ω ) and 0.5 pu (62.5 Ω) respectively at bus T2, reduces the local amplification ratio. However,164
it is not the same for the remote bus, T1, which is upstream. An amplification is observed here, in165
the base case, as the grid impedance is capacitive while the WPP side impedance is inductive largely166
Preprints (www.preprints.org) | NOT PEER-REVIEWED | Posted: 16 March 2017 doi:10.20944/preprints201703.0110.v1
10 of 17
due to the inductive impedance of the grid transformers. Even though there is an attenuation of the167
10th harmonic at the local bus T2, it gets amplified in comparison to the base case at T1. This can be168
attributed to the reduced damping due to the reduction of the effective resistance of the WPP from169
424 Ω to 210 Ω and due to the compensation as shown in Table 2.170
Figure 10. Amplification due to compensation at T2.
Table 2. 10th harmonic impedance (referred to 400 kV) observed at T1 with 1pu resistive compensationat T2.
Unit Real Imaginary
Zg [Ω] 20 −108Ztr [Ω] 3 261Zwpp [Ω] 421 -185Zwpp,comp [Ω] 207 -39Zwpp + Ztr [Ω] 424 76Zwpp,comp + Ztr [Ω] 210 222
Preprints (www.preprints.org) | NOT PEER-REVIEWED | Posted: 16 March 2017 doi:10.20944/preprints201703.0110.v1
11 of 17
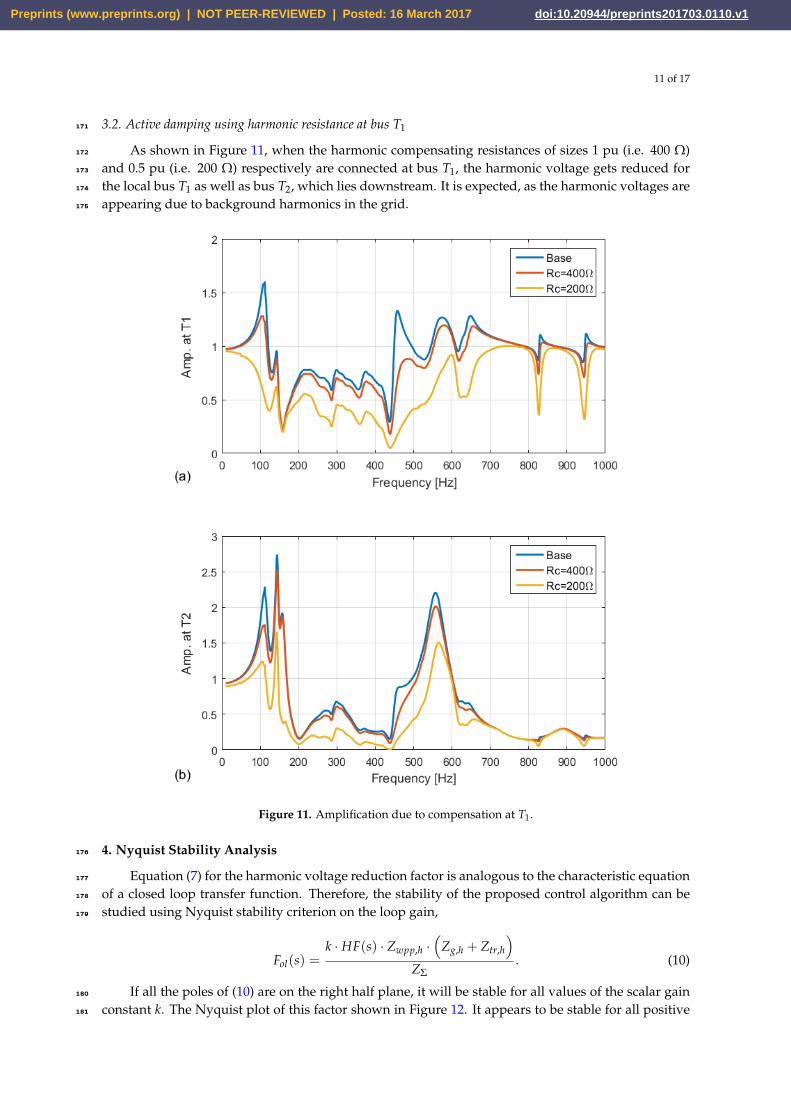
3.2. Active damping using harmonic resistance at bus T1171
As shown in Figure 11, when the harmonic compensating resistances of sizes 1 pu (i.e. 400 Ω)172
and 0.5 pu (i.e. 200 Ω) respectively are connected at bus T1, the harmonic voltage gets reduced for173
the local bus T1 as well as bus T2, which lies downstream. It is expected, as the harmonic voltages are174
appearing due to background harmonics in the grid.175
Figure 11. Amplification due to compensation at T1.
4. Nyquist Stability Analysis176
Equation (7) for the harmonic voltage reduction factor is analogous to the characteristic equation177
of a closed loop transfer function. Therefore, the stability of the proposed control algorithm can be178
studied using Nyquist stability criterion on the loop gain,179
Fol(s) =k · HF(s) · Zwpp,h ·
(Zg,h + Ztr,h
)ZΣ
. (10)
If all the poles of (10) are on the right half plane, it will be stable for all values of the scalar gain180
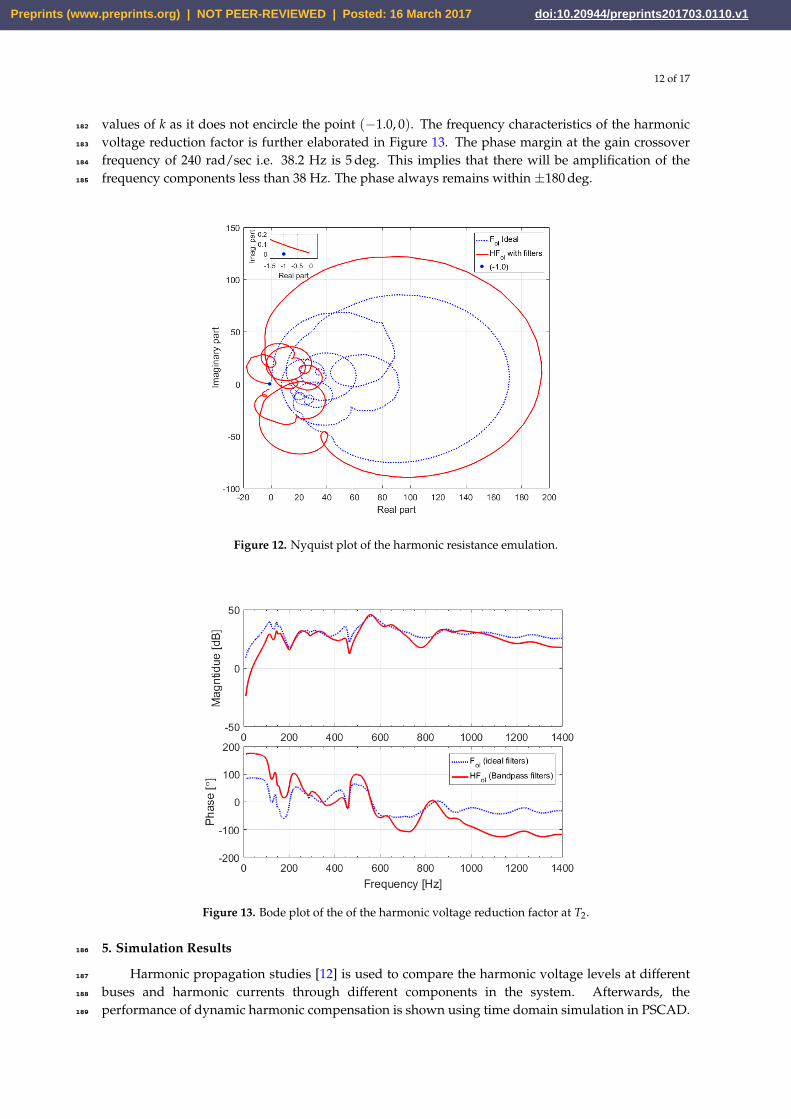
constant k. The Nyquist plot of this factor shown in Figure 12. It appears to be stable for all positive181
Preprints (www.preprints.org) | NOT PEER-REVIEWED | Posted: 16 March 2017 doi:10.20944/preprints201703.0110.v1
12 of 17
values of k as it does not encircle the point (−1.0, 0). The frequency characteristics of the harmonic182
voltage reduction factor is further elaborated in Figure 13. The phase margin at the gain crossover183
frequency of 240 rad/sec i.e. 38.2 Hz is 5 deg. This implies that there will be amplification of the184
frequency components less than 38 Hz. The phase always remains within ±180 deg.185
Figure 12. Nyquist plot of the harmonic resistance emulation.
Figure 13. Bode plot of the of the harmonic voltage reduction factor at T2.
5. Simulation Results186
Harmonic propagation studies [12] is used to compare the harmonic voltage levels at different187
buses and harmonic currents through different components in the system. Afterwards, the188
performance of dynamic harmonic compensation is shown using time domain simulation in PSCAD.189
Preprints (www.preprints.org) | NOT PEER-REVIEWED | Posted: 16 March 2017 doi:10.20944/preprints201703.0110.v1

13 of 17
5.1. Harmonic propagation studies190
In harmonic propagation studies, the network model is created for a specific harmonic frequency191
and the network equations are solved for that particular frequency. Since the power frequency is not192
considered and only one frequency is considered at a time, the emulation of resistance at the specific193
harmonic frequency by the STATCOM is simulated by a connecting a resistance in the network at194
the concerned bus. In this work, a 1-pu resistance is separately connected to bus T1 and T2. The195
resultant harmonic voltages at buses T1, T2 and T4 are observed in the test system. The results are196
then compared in Figure 14. In line with the amplification ratios described in the previous section, the197
compensation at bus T1 leads to a reduction of voltage harmonics at all the aforementioned buses. The198
compensation at bus T2 leads to the reduction of harmonics at bus T2 and T4, which are downstream,199
while there is an amplification of the 7th and the 11th harmonic at bus T1. The results corroborate200
the prediction made in the previous section as the distortion levels at bus T2 is decreased for all the201
harmonic orders, whereas, for bus T1, it gets decreased only for the 5th and the 13th harmonic orders.202
Figure 14. Harmonic voltages in pu at (a) T1, (b) T2, and (c) T4.
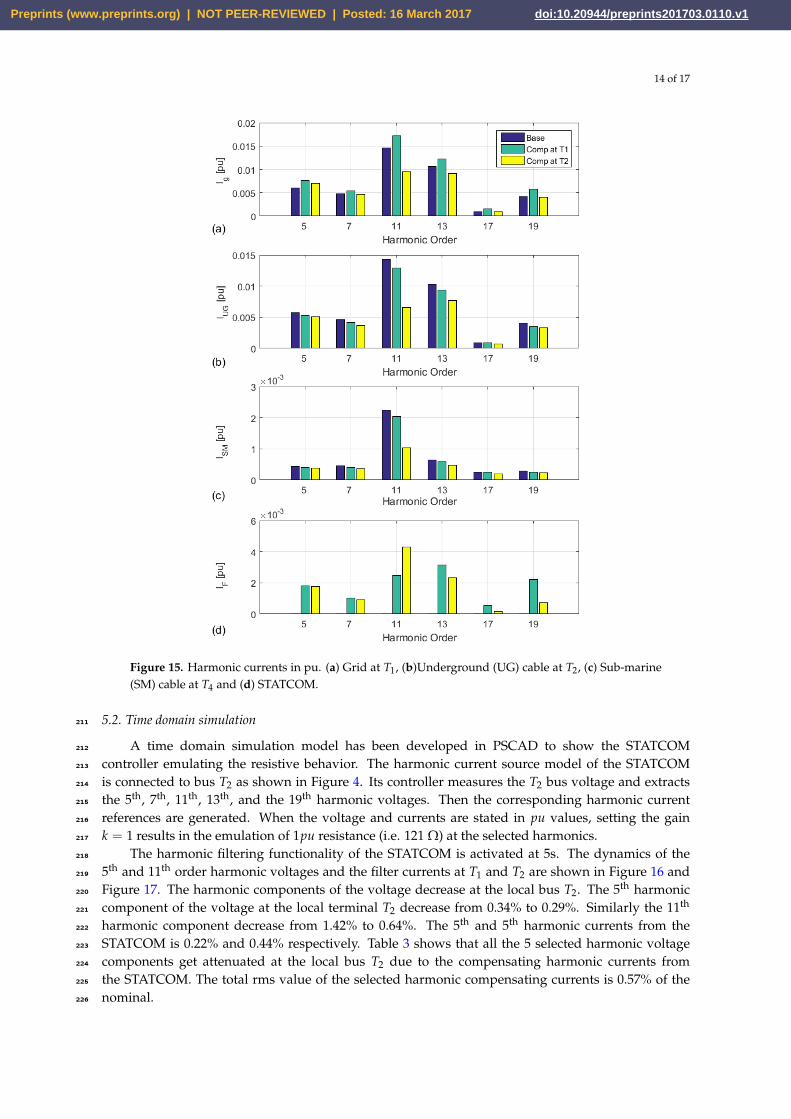
The harmonic current flow in the different components as well as in the STATCOM is shown203
in Figure 15. The harmonic current drawn from the grid is higher than that in the base case, when204
the compensation is provided at bus T1. By Kirchhoff’s law, it is obvious that the grid has to supply205
the current drawn by the WPP as well as the compensating resistance. Thus, the resultant harmonic206
current in the grid will be the phasor sum of the WPP current and the STATCOM current. When the207
compensation is provided at bus T2, the grid currents are reduced by over 50% for the 11th harmonic,208
while there is a smaller reduction for other harmonics, except the 5th harmonic, for which there is an209
amplification. This amplification is due to the reduction of the total impedance for the 5th harmonic.210
Preprints (www.preprints.org) | NOT PEER-REVIEWED | Posted: 16 March 2017 doi:10.20944/preprints201703.0110.v1
14 of 17
Figure 15. Harmonic currents in pu. (a) Grid at T1, (b)Underground (UG) cable at T2, (c) Sub-marine(SM) cable at T4 and (d) STATCOM.
5.2. Time domain simulation211
A time domain simulation model has been developed in PSCAD to show the STATCOM212
controller emulating the resistive behavior. The harmonic current source model of the STATCOM213
is connected to bus T2 as shown in Figure 4. Its controller measures the T2 bus voltage and extracts214
the 5th, 7th, 11th, 13th, and the 19th harmonic voltages. Then the corresponding harmonic current215
references are generated. When the voltage and currents are stated in pu values, setting the gain216
k = 1 results in the emulation of 1pu resistance (i.e. 121 Ω) at the selected harmonics.217
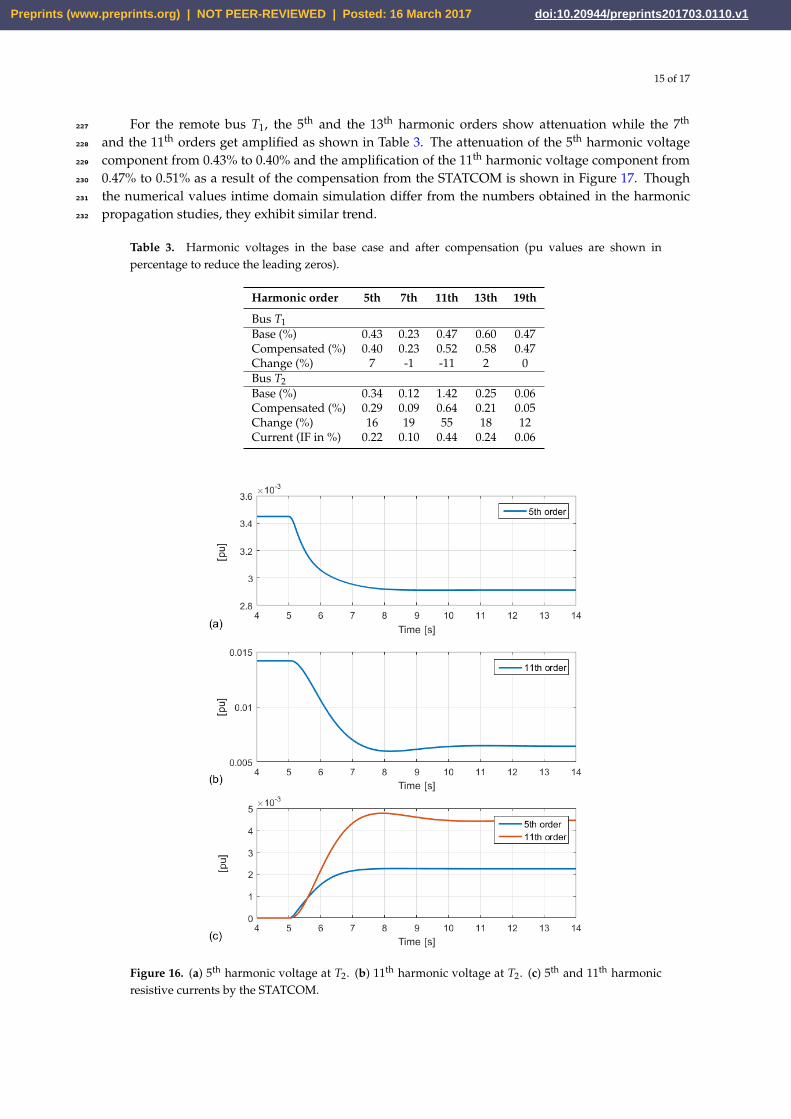
The harmonic filtering functionality of the STATCOM is activated at 5s. The dynamics of the218
5th and 11th order harmonic voltages and the filter currents at T1 and T2 are shown in Figure 16 and219
Figure 17. The harmonic components of the voltage decrease at the local bus T2. The 5th harmonic220
component of the voltage at the local terminal T2 decrease from 0.34% to 0.29%. Similarly the 11th221
harmonic component decrease from 1.42% to 0.64%. The 5th and 5th harmonic currents from the222
STATCOM is 0.22% and 0.44% respectively. Table 3 shows that all the 5 selected harmonic voltage223
components get attenuated at the local bus T2 due to the compensating harmonic currents from224
the STATCOM. The total rms value of the selected harmonic compensating currents is 0.57% of the225
nominal.226
Preprints (www.preprints.org) | NOT PEER-REVIEWED | Posted: 16 March 2017 doi:10.20944/preprints201703.0110.v1
15 of 17
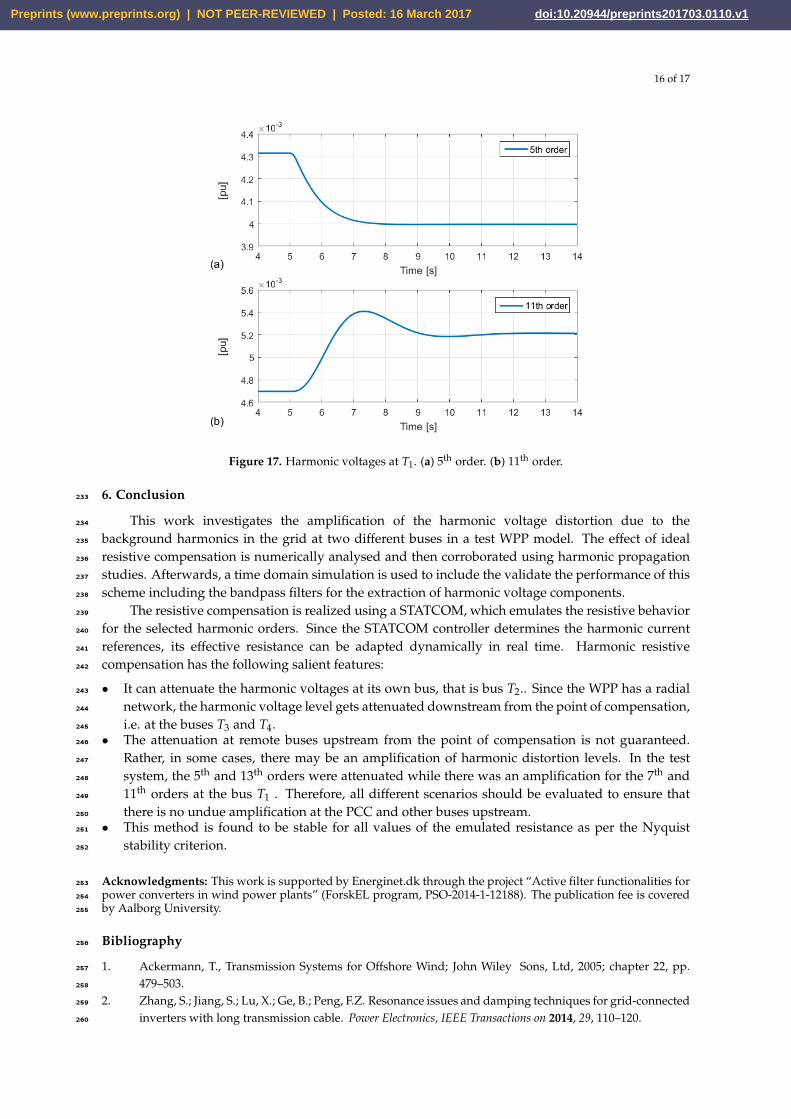
For the remote bus T1, the 5th and the 13th harmonic orders show attenuation while the 7th227
and the 11th orders get amplified as shown in Table 3. The attenuation of the 5th harmonic voltage228
component from 0.43% to 0.40% and the amplification of the 11th harmonic voltage component from229
0.47% to 0.51% as a result of the compensation from the STATCOM is shown in Figure 17. Though230
the numerical values intime domain simulation differ from the numbers obtained in the harmonic231
propagation studies, they exhibit similar trend.232
Table 3. Harmonic voltages in the base case and after compensation (pu values are shown inpercentage to reduce the leading zeros).
Harmonic order 5th 7th 11th 13th 19th
Bus T1Base (%) 0.43 0.23 0.47 0.60 0.47Compensated (%) 0.40 0.23 0.52 0.58 0.47Change (%) 7 -1 -11 2 0Bus T2Base (%) 0.34 0.12 1.42 0.25 0.06Compensated (%) 0.29 0.09 0.64 0.21 0.05Change (%) 16 19 55 18 12Current (IF in %) 0.22 0.10 0.44 0.24 0.06
Figure 16. (a) 5th harmonic voltage at T2. (b) 11th harmonic voltage at T2. (c) 5th and 11th harmonicresistive currents by the STATCOM.
Preprints (www.preprints.org) | NOT PEER-REVIEWED | Posted: 16 March 2017 doi:10.20944/preprints201703.0110.v1
16 of 17
Figure 17. Harmonic voltages at T1. (a) 5th order. (b) 11th order.
6. Conclusion233
This work investigates the amplification of the harmonic voltage distortion due to the234
background harmonics in the grid at two different buses in a test WPP model. The effect of ideal235
resistive compensation is numerically analysed and then corroborated using harmonic propagation236
studies. Afterwards, a time domain simulation is used to include the validate the performance of this237
scheme including the bandpass filters for the extraction of harmonic voltage components.238
The resistive compensation is realized using a STATCOM, which emulates the resistive behavior239
for the selected harmonic orders. Since the STATCOM controller determines the harmonic current240
references, its effective resistance can be adapted dynamically in real time. Harmonic resistive241
compensation has the following salient features:242
• It can attenuate the harmonic voltages at its own bus, that is bus T2.. Since the WPP has a radial243
network, the harmonic voltage level gets attenuated downstream from the point of compensation,244
i.e. at the buses T3 and T4.245
• The attenuation at remote buses upstream from the point of compensation is not guaranteed.246
Rather, in some cases, there may be an amplification of harmonic distortion levels. In the test247
system, the 5th and 13th orders were attenuated while there was an amplification for the 7th and248
11th orders at the bus T1 . Therefore, all different scenarios should be evaluated to ensure that249
there is no undue amplification at the PCC and other buses upstream.250
• This method is found to be stable for all values of the emulated resistance as per the Nyquist251
stability criterion.252
Acknowledgments: This work is supported by Energinet.dk through the project “Active filter functionalities for253
power converters in wind power plants” (ForskEL program, PSO-2014-1-12188). The publication fee is covered254
by Aalborg University.255
Bibliography256
1. Ackermann, T., Transmission Systems for Offshore Wind; John Wiley Sons, Ltd, 2005; chapter 22, pp.257
479–503.258
2. Zhang, S.; Jiang, S.; Lu, X.; Ge, B.; Peng, F.Z. Resonance issues and damping techniques for grid-connected259
inverters with long transmission cable. Power Electronics, IEEE Transactions on 2014, 29, 110–120.260
Preprints (www.preprints.org) | NOT PEER-REVIEWED | Posted: 16 March 2017 doi:10.20944/preprints201703.0110.v1
17 of 17
3. Chaudhary, S.K.; Lascu, C.V.; Hoseinzadeh, B.; Teodorescu, R.; Kocewiak, L.; Sørensen, T.; Jensen,261
C.F. Challenges with Harmonic Compensation at a Remote Bus in Offshore Wind Power Plant. IEEE262
International Conference on Environment and Electrical Engineering (EEEIC 2016) 2016, pp. 1–5.263
4. Bradt, M.; Badrzadeh, B.; Camm, E.; Mueller, D.; Schoene, J.; Siebert, T.; Smith, T.; Starke, M.; Walling, R.264
Harmonics and resonance issues in wind power plants. Transmission and Distribution Conference and265
Exposition (T&D), 2012 IEEE PES. IEEE, 2012, pp. 1–8.266
5. IEEE Recommended Practices and Requirements for Harmonic Control in Electrical Power Systems. IEEE267
Std 519-1992 1993.268
6. Electromagnetic Compatibility (EMC) - Part 3-6: Limits - Assessment of emission limits for the connection269
of distorting installations to MV, HV and EHV power systems. IEC Standard 61000-3-6 2008.270
7. Electricity Association. Planning Levels for Harmonic Voltage Distortion and the Connection of Non-linear271
Equipment to Transmission Systems and Distribution Networks in the United Kingdom, 2001.272
8. Kocewiak, Ł.; Øhlenschlæger Kramer, B.; Holmstrøm, O.; Jensen, K.; Shuai, L. Active filtering application273
in large offshore wind farms. in Proc. of The 13th International Workshop on Large-Scale Integration274
of Wind Power into Power Systems as well as Transmission Networks for Offshore Wind Farms,275
Energynautics GmbH, 11-13 November 2014, Berlin, Germany., 2014, pp. 11–13.276
9. Hoseinzadeh, B.; Bak, C.L. Admittance Modeling of Voltage and Current Controlled Inverter for277
Harmonic Instability Studies. PES General Meeting Conference Exposition, 2016 IEEE 2016, pp. 1–5.278
10. Gustavsen, B.; De Silva, H.J. Inclusion of rational models in an electromagnetic transients program:279
Y-Parameters, Z-Parameters, S-Parameters, transfer functions. IEEE Transactions on Power Delivery 2013,280
28, 1164–1174.281
11. Akagi, H.; Fujita, H.; Wada, K. A shunt active filter based on voltage detection for harmonic termination282
of a radial power distribution line. IEEE Transactions on Industry Applications 1999, 35, 638–645.283
12. Badrzadeh, B.; Gupta, M.; Singh, N.; Petersson, A.; Max, L.; others. Power system harmonic analysis284
in wind power plantsPart I: Study methodology and techniques. Industry Applications Society Annual285
Meeting (IAS), 2012 IEEE. IEEE, 2012, pp. 1–11.286
© 2017 by the authors. Licensee Preprints, Basel, Switzerland. This article is an open access article distributed under the terms and conditions of the Creative Commons by Attribution (CC-BY) license (http://creativecommons.org/licenses/by/4.0/).
Preprints (www.preprints.org) | NOT PEER-REVIEWED | Posted: 16 March 2017 doi:10.20944/preprints201703.0110.v1