Embed Size (px)
Citation preview
ScienceDirect
Available online at www.sciencedirect.com
Procedia Structural Integrity 28 (2020) 1601–1620
2452-3216 © 2020 The Authors. Published by Elsevier B.V.This is an open access article under the CC BY-NC-ND license (https://creativecommons.org/licenses/by-nc-nd/4.0)Peer-review under responsibility of the European Structural Integrity Society (ESIS) ExCo10.1016/j.prostr.2020.10.132
10.1016/j.prostr.2020.10.132 2452-3216
© 2020 The Authors. Published by Elsevier B.V.This is an open access article under the CC BY-NC-ND license (https://creativecommons.org/licenses/by-nc-nd/4.0)Peer-review under responsibility of the European Structural Integrity Society (ESIS) ExCo
Available online at www.sciencedirect.com
ScienceDirect
Structural Integrity Procedia 00 (2019) 000–000 www.elsevier.com/locate/procedia
2452-3216 © 2020 The Authors. Published by ELSEVIER B.V. This is an open access article under the CC BY-NC-ND license (https://creativecommons.org/licenses/by-nc-nd/4.0) Peer-review under responsibility of the European Structural Integrity Society (ESIS) ExCo
1st Virtual European Conference on Fracture
Influence of fracture envelope on FE failure load prediction of adhesively bonded joints by using mixed mode bending tests
M.Z. Sadeghia*, J. Zimmermanna, K. Saravanaa, A. Gabenerb
A. Dafnisa, K. U. Schrödera aInstitute of Structural Mechanics and Lightweight Design, RWTH Aachen University, Wuellnerstrasse 7, 52062 Aachen, Germany
bSaint-Gobain Performance Plastics Pampus GmbH, Am Nordkanal 37, D-47877, Willich, Germany
Abstract
Critical strain energy release rate (Gc) is considered as an important fracture characteristic parameter by which the state of integrity of the bonded structures can be assessed. Although the majority of bonded components in industrial applications are under mixed-mode loading, fracture characterization of adhesives in mixed-mode loadings has received much less attention in the literature compared with pure mode I and II. Besides, there are still open questions regarding influential parameters on fracture characterization of adhesives (such as adhesive layer thickness), especially when in some cases the numerical results are not in agreement with the experimental results. In this work, the values of fracture toughness of a ductile adhesive are determined by mixed-mode bending (MMB) tests with different thickness. Based on the determined values for fracture toughness, the fracture envelopes of the adhesive for different thickness were developed. The developed fracture envelopes were used as input for FE modelling of single lap joints (SLJ) with different adhesive thicknesses to investigate the applicability of each of the developed fracture envelopes in FE failure load prediction of experimentally tested SLJs. © 2020 The Authors. Published by ELSEVIER B.V. This is an open access article under the CC BY-NC-ND license (https://creativecommons.org/licenses/by-nc-nd/4.0) Peer-review under responsibility of the European Structural Integrity Society (ESIS) ExCo Keywords: Mixed-mode failure; Strain energy release rate; J-integral; Adhesive thickness; Fracture envelope
* Corresponding author. Tel.: +49-241-80 96837. E-mail address: [email protected]
1602 M.Z. Sadeghi et al. / Procedia Structural Integrity 28 (2020) 1601–1620 M.Z. Sadeghi et al./ Structural Integrity Procedia 00 (2019) 000–000
1. Introduction
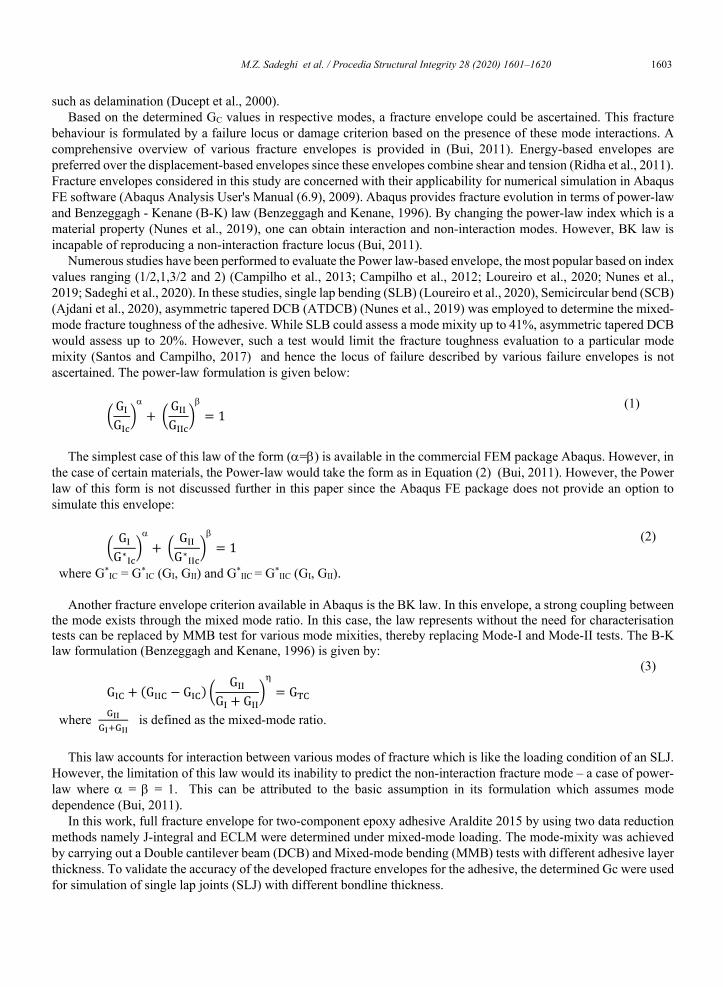
The application of adhesively bonded joints is gaining importance in lightweight over the traditional joints over the past 70 years design due to its advantages of weight reduction, ease of assembly, and mitigate the drawbacks of fastened joints such as – stress concentrations, reduction in joint strength and ease of assembly (He, 2011). Hence, it is important to determine the failure strength of such bonded joints. In the design of such joints, adhesive selection has a crucial role in the mitigation of the peel stress concentration by load distribution, that arises due to a complex state of loading (Campilho et al., 2011a; Silva et al., 2011). In the case of a ductile adhesive, such as, Araldite 2015, there exists the presence of fracture process zone (FPZ) which experiences significant yielding and thereby higher fracture toughness (Gc) in contrast to brittle adhesives. In the case of brittle adhesives, GC is independent of adhesive thickness (da Silva et al., 2010; Loureiro et al., 2020). In the case of single lap joint (SLJ), numerous studies exist to describe the influence of joint parameters, ranging from bond line thickness (ta) to overlap length (Lo) (Campilho et al., 2012; Campilho et al., 2011a; da Silva et al., 2009). From these studies, it is evident that joint strength is primarily influenced by its Lo. However, in reality, the improvement of SLJ design based on the dependence on Lo alone leads to slender joints, which is unsuitable for geometrically constrained joints. Meanwhile adhesive bondline thickness (ta) and its corresponding Gc account for 25% improvement in SLJ joint strength (da Silva et al., 2009). For aeronautical industries, (ta) is between 0.05 -0.20 mm and other civil industries up to 1.0 mm. In the case of SLJ, it has been emphasized that an increase of ta leads to a decrease in Pm which has been attributed to cracks introduced due to more microvoids and the eccentric bending moment (Adams and Peppiatt, 1974; da Silva et al., 2009; Fernandes et al., 2015). In the case of ductile epoxy adhesives, it is elucidated that Gc is maximum when plastic zone size is nearly equal to the bond-line thickness (Bascom et al., 1975).
In the current study, Gc is determined using mixed-mode bending (MMB) tests. Gc along with other cohesive traction parameters influence the fracture load (Pm). The influence of Gc on the traction separation law (TSL) is foreseen in the stiffness degradation during the damage propagation phase (Abaqus Analysis User's Manual (6.9), 2009; Balzani et al., 2011). While over prediction of Gc does not influence the Pm values, an under prediction of Gc (by 80%) is detrimental to the accuracy, for Lo greater than 80 mm in contrast to Lo equal to 20 mm in our SLJ model (Campilho et al., 2012). Currently, numerous methods and data reduction methods exist to determine the cohesive parameters (tn
0, ts0, Gn, Gs). However, every technique has its limitation. In the case of the direct method, precise
cohesive law shape is determined which is too complex for numerical simulation. On the other hand, property identification and inverse method involve the assumption of a simplified TSL (Campilho et al., 2012). Based on a study on epoxy adhesive, these CZM shapes and their parameters vary with the bondline thickness ta from a triangular shape for smaller ta to a trapezoidal for thicker ta due to the presence of a plastic zone. Furthermore, with an increase of ta, parameters tn
0, ts0 reduced while Gn and Gs increased (Carlberger and Stigh, 2010). Another study indicates that
traction parameters (tn and ts) are thickness independent, however, they are influenced by the loading rate. And their thickness independent hypothesis holds good as long the mode of failure remains the same – that is a cohesive failure in this case (Desai et al., 2016).
SLJs are subjected to a combination of tensile and shear loads and hence the study of fracture under a mixed-mode loading is necessary for determining the Pm and develop a fracture envelope. In case of such a loading scenario, adhesive behaviour (fracture toughness Gc) in-situ tests such as mixed-mode test are different from those of bulk tests. In case of bulk tests, crack propagation is perpendicular to the direction of maximum principal stress, however in a joint such as SLJ, the crack tends grow along the bondline leading to a cohesive failure in both cases but with different fracture toughness. Such a difference in behaviour could be attributed to the constraining effect of substrates induced on the adhesive bondline (Campilho et al., 2012; Zou et al., 2004). In these in-situ tests, Pm increased in with an increase in MMR (mixed mode ratio) due to the presence of a Mode-II component. However, as a function of ta, the value of Pm remained moreover constant (Sadeghi et al., 2019). Assessment of fracture surfaces for an epoxy adhesive revealed a smoother fracture indicating that the Mode-I component dominates fracture until 75% MMR. An introduction of the Mode-II component leads to more energy dissipation by shear deformation leading to a rougher surface and a higher Gc. In this study, MMB 75% is independent of bond-line thickness (Khoo and Kim, 2011). In comparison to pure modes testing, the determination of fracture energy for mixed modes is challenging to predict owing to the path-dependent feature. The crack path has to be contained within the adhesives to depict a cohesive failure. It must be noted that fracture energies of adhesive joints cohesive failure are higher than interfacial failure
M.Z. Sadeghi et al./ Structural Integrity Procedia 00 (2019) 000–000
such as delamination (Ducept et al., 2000). Based on the determined GC values in respective modes, a fracture envelope could be ascertained. This fracture
behaviour is formulated by a failure locus or damage criterion based on the presence of these mode interactions. A comprehensive overview of various fracture envelopes is provided in (Bui, 2011). Energy-based envelopes are preferred over the displacement-based envelopes since these envelopes combine shear and tension (Ridha et al., 2011). Fracture envelopes considered in this study are concerned with their applicability for numerical simulation in Abaqus FE software (Abaqus Analysis User's Manual (6.9), 2009). Abaqus provides fracture evolution in terms of power-law and Benzeggagh - Kenane (B-K) law (Benzeggagh and Kenane, 1996). By changing the power-law index which is a material property (Nunes et al., 2019), one can obtain interaction and non-interaction modes. However, BK law is incapable of reproducing a non-interaction fracture locus (Bui, 2011).
Numerous studies have been performed to evaluate the Power law-based envelope, the most popular based on index values ranging (1/2,1,3/2 and 2) (Campilho et al., 2013; Campilho et al., 2012; Loureiro et al., 2020; Nunes et al., 2019; Sadeghi et al., 2020). In these studies, single lap bending (SLB) (Loureiro et al., 2020), Semicircular bend (SCB) (Ajdani et al., 2020), asymmetric tapered DCB (ATDCB) (Nunes et al., 2019) was employed to determine the mixed-mode fracture toughness of the adhesive. While SLB could assess a mode mixity up to 41%, asymmetric tapered DCB would assess up to 20%. However, such a test would limit the fracture toughness evaluation to a particular mode mixity (Santos and Campilho, 2017) and hence the locus of failure described by various failure envelopes is not ascertained. The power-law formulation is given below:
� G�G���
� �� G��G����
� �
(1)
The simplest case of this law of the form (=) is available in the commercial FEM package Abaqus. However, in the case of certain materials, the Power-law would take the form as in Equation (2) (Bui, 2011). However, the Power law of this form is not discussed further in this paper since the Abaqus FE package does not provide an option to simulate this envelope:
� G�G∗���
� �� G��G∗����
� � (2)
where G*IC = G*
IC (GI, GII) and G*IIC = G*
IIC (GI, GII).
Another fracture envelope criterion available in Abaqus is the BK law. In this envelope, a strong coupling between the mode exists through the mixed mode ratio. In this case, the law represents without the need for characterisation tests can be replaced by MMB test for various mode mixities, thereby replacing Mode-I and Mode-II tests. The B-K law formulation (Benzeggagh and Kenane, 1996) is given by:
G�� � �G��� � G��� � G��G� � G���
�� G��
(3)
where ��������� is defined as the mixed-mode ratio.
This law accounts for interaction between various modes of fracture which is like the loading condition of an SLJ. However, the limitation of this law would its inability to predict the non-interaction fracture mode – a case of power-law where = = 1. This can be attributed to the basic assumption in its formulation which assumes mode dependence (Bui, 2011).
In this work, full fracture envelope for two-component epoxy adhesive Araldite 2015 by using two data reduction methods namely J-integral and ECLM were determined under mixed-mode loading. The mode-mixity was achieved by carrying out a Double cantilever beam (DCB) and Mixed-mode bending (MMB) tests with different adhesive layer thickness. To validate the accuracy of the developed fracture envelopes for the adhesive, the determined Gc were used for simulation of single lap joints (SLJ) with different bondline thickness.
M.Z. Sadeghi et al. / Procedia Structural Integrity 28 (2020) 1601–1620 1603 M.Z. Sadeghi et al./ Structural Integrity Procedia 00 (2019) 000–000
1. Introduction
The application of adhesively bonded joints is gaining importance in lightweight over the traditional joints over the past 70 years design due to its advantages of weight reduction, ease of assembly, and mitigate the drawbacks of fastened joints such as – stress concentrations, reduction in joint strength and ease of assembly (He, 2011). Hence, it is important to determine the failure strength of such bonded joints. In the design of such joints, adhesive selection has a crucial role in the mitigation of the peel stress concentration by load distribution, that arises due to a complex state of loading (Campilho et al., 2011a; Silva et al., 2011). In the case of a ductile adhesive, such as, Araldite 2015, there exists the presence of fracture process zone (FPZ) which experiences significant yielding and thereby higher fracture toughness (Gc) in contrast to brittle adhesives. In the case of brittle adhesives, GC is independent of adhesive thickness (da Silva et al., 2010; Loureiro et al., 2020). In the case of single lap joint (SLJ), numerous studies exist to describe the influence of joint parameters, ranging from bond line thickness (ta) to overlap length (Lo) (Campilho et al., 2012; Campilho et al., 2011a; da Silva et al., 2009). From these studies, it is evident that joint strength is primarily influenced by its Lo. However, in reality, the improvement of SLJ design based on the dependence on Lo alone leads to slender joints, which is unsuitable for geometrically constrained joints. Meanwhile adhesive bondline thickness (ta) and its corresponding Gc account for 25% improvement in SLJ joint strength (da Silva et al., 2009). For aeronautical industries, (ta) is between 0.05 -0.20 mm and other civil industries up to 1.0 mm. In the case of SLJ, it has been emphasized that an increase of ta leads to a decrease in Pm which has been attributed to cracks introduced due to more microvoids and the eccentric bending moment (Adams and Peppiatt, 1974; da Silva et al., 2009; Fernandes et al., 2015). In the case of ductile epoxy adhesives, it is elucidated that Gc is maximum when plastic zone size is nearly equal to the bond-line thickness (Bascom et al., 1975).
In the current study, Gc is determined using mixed-mode bending (MMB) tests. Gc along with other cohesive traction parameters influence the fracture load (Pm). The influence of Gc on the traction separation law (TSL) is foreseen in the stiffness degradation during the damage propagation phase (Abaqus Analysis User's Manual (6.9), 2009; Balzani et al., 2011). While over prediction of Gc does not influence the Pm values, an under prediction of Gc (by 80%) is detrimental to the accuracy, for Lo greater than 80 mm in contrast to Lo equal to 20 mm in our SLJ model (Campilho et al., 2012). Currently, numerous methods and data reduction methods exist to determine the cohesive parameters (tn
0, ts0, Gn, Gs). However, every technique has its limitation. In the case of the direct method, precise
cohesive law shape is determined which is too complex for numerical simulation. On the other hand, property identification and inverse method involve the assumption of a simplified TSL (Campilho et al., 2012). Based on a study on epoxy adhesive, these CZM shapes and their parameters vary with the bondline thickness ta from a triangular shape for smaller ta to a trapezoidal for thicker ta due to the presence of a plastic zone. Furthermore, with an increase of ta, parameters tn
0, ts0 reduced while Gn and Gs increased (Carlberger and Stigh, 2010). Another study indicates that
traction parameters (tn and ts) are thickness independent, however, they are influenced by the loading rate. And their thickness independent hypothesis holds good as long the mode of failure remains the same – that is a cohesive failure in this case (Desai et al., 2016).
SLJs are subjected to a combination of tensile and shear loads and hence the study of fracture under a mixed-mode loading is necessary for determining the Pm and develop a fracture envelope. In case of such a loading scenario, adhesive behaviour (fracture toughness Gc) in-situ tests such as mixed-mode test are different from those of bulk tests. In case of bulk tests, crack propagation is perpendicular to the direction of maximum principal stress, however in a joint such as SLJ, the crack tends grow along the bondline leading to a cohesive failure in both cases but with different fracture toughness. Such a difference in behaviour could be attributed to the constraining effect of substrates induced on the adhesive bondline (Campilho et al., 2012; Zou et al., 2004). In these in-situ tests, Pm increased in with an increase in MMR (mixed mode ratio) due to the presence of a Mode-II component. However, as a function of ta, the value of Pm remained moreover constant (Sadeghi et al., 2019). Assessment of fracture surfaces for an epoxy adhesive revealed a smoother fracture indicating that the Mode-I component dominates fracture until 75% MMR. An introduction of the Mode-II component leads to more energy dissipation by shear deformation leading to a rougher surface and a higher Gc. In this study, MMB 75% is independent of bond-line thickness (Khoo and Kim, 2011). In comparison to pure modes testing, the determination of fracture energy for mixed modes is challenging to predict owing to the path-dependent feature. The crack path has to be contained within the adhesives to depict a cohesive failure. It must be noted that fracture energies of adhesive joints cohesive failure are higher than interfacial failure
M.Z. Sadeghi et al./ Structural Integrity Procedia 00 (2019) 000–000
such as delamination (Ducept et al., 2000). Based on the determined GC values in respective modes, a fracture envelope could be ascertained. This fracture
behaviour is formulated by a failure locus or damage criterion based on the presence of these mode interactions. A comprehensive overview of various fracture envelopes is provided in (Bui, 2011). Energy-based envelopes are preferred over the displacement-based envelopes since these envelopes combine shear and tension (Ridha et al., 2011). Fracture envelopes considered in this study are concerned with their applicability for numerical simulation in Abaqus FE software (Abaqus Analysis User's Manual (6.9), 2009). Abaqus provides fracture evolution in terms of power-law and Benzeggagh - Kenane (B-K) law (Benzeggagh and Kenane, 1996). By changing the power-law index which is a material property (Nunes et al., 2019), one can obtain interaction and non-interaction modes. However, BK law is incapable of reproducing a non-interaction fracture locus (Bui, 2011).
Numerous studies have been performed to evaluate the Power law-based envelope, the most popular based on index values ranging (1/2,1,3/2 and 2) (Campilho et al., 2013; Campilho et al., 2012; Loureiro et al., 2020; Nunes et al., 2019; Sadeghi et al., 2020). In these studies, single lap bending (SLB) (Loureiro et al., 2020), Semicircular bend (SCB) (Ajdani et al., 2020), asymmetric tapered DCB (ATDCB) (Nunes et al., 2019) was employed to determine the mixed-mode fracture toughness of the adhesive. While SLB could assess a mode mixity up to 41%, asymmetric tapered DCB would assess up to 20%. However, such a test would limit the fracture toughness evaluation to a particular mode mixity (Santos and Campilho, 2017) and hence the locus of failure described by various failure envelopes is not ascertained. The power-law formulation is given below:
� G�G���
� �� G��G����
� �
(1)
The simplest case of this law of the form (=) is available in the commercial FEM package Abaqus. However, in the case of certain materials, the Power-law would take the form as in Equation (2) (Bui, 2011). However, the Power law of this form is not discussed further in this paper since the Abaqus FE package does not provide an option to simulate this envelope:
� G�G∗���
� �� G��G∗����
� � (2)
where G*IC = G*
IC (GI, GII) and G*IIC = G*
IIC (GI, GII).
Another fracture envelope criterion available in Abaqus is the BK law. In this envelope, a strong coupling between the mode exists through the mixed mode ratio. In this case, the law represents without the need for characterisation tests can be replaced by MMB test for various mode mixities, thereby replacing Mode-I and Mode-II tests. The B-K law formulation (Benzeggagh and Kenane, 1996) is given by:
G�� � �G��� � G��� � G��G� � G���
�� G��
(3)
where ��������� is defined as the mixed-mode ratio.
This law accounts for interaction between various modes of fracture which is like the loading condition of an SLJ. However, the limitation of this law would its inability to predict the non-interaction fracture mode – a case of power-law where = = 1. This can be attributed to the basic assumption in its formulation which assumes mode dependence (Bui, 2011).
In this work, full fracture envelope for two-component epoxy adhesive Araldite 2015 by using two data reduction methods namely J-integral and ECLM were determined under mixed-mode loading. The mode-mixity was achieved by carrying out a Double cantilever beam (DCB) and Mixed-mode bending (MMB) tests with different adhesive layer thickness. To validate the accuracy of the developed fracture envelopes for the adhesive, the determined Gc were used for simulation of single lap joints (SLJ) with different bondline thickness.
1604 M.Z. Sadeghi et al. / Procedia Structural Integrity 28 (2020) 1601–1620 M.Z. Sadeghi et al./ Structural Integrity Procedia 00 (2019) 000–000
2. Experimental
In this work, DCB and MMB tests (with three different mixed-mode ratios) were carried out to achieve the fracture energy envelope. DCB and MMB tests (including manufacturing the tests setup) were based on ASTMD5528 and ASTMD6671.
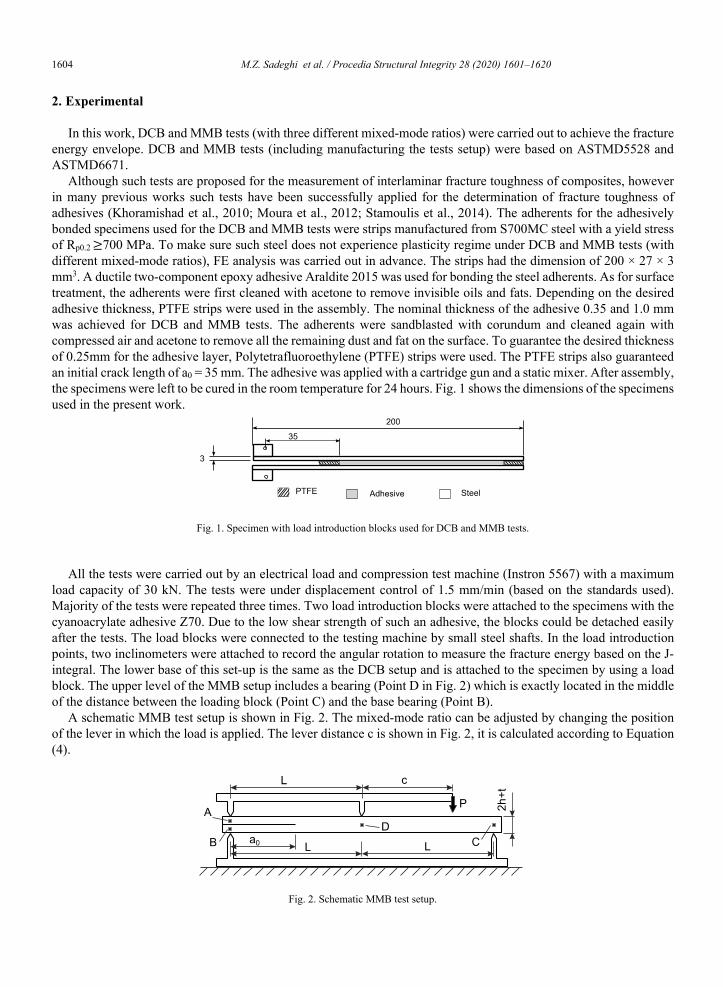
Although such tests are proposed for the measurement of interlaminar fracture toughness of composites, however in many previous works such tests have been successfully applied for the determination of fracture toughness of adhesives (Khoramishad et al., 2010; Moura et al., 2012; Stamoulis et al., 2014). The adherents for the adhesively bonded specimens used for the DCB and MMB tests were strips manufactured from S700MC steel with a yield stress of Rp0.2 700 MPa. To make sure such steel does not experience plasticity regime under DCB and MMB tests (with different mixed-mode ratios), FE analysis was carried out in advance. The strips had the dimension of 200 × 27 × 3 mm3. A ductile two-component epoxy adhesive Araldite 2015 was used for bonding the steel adherents. As for surface treatment, the adherents were first cleaned with acetone to remove invisible oils and fats. Depending on the desired adhesive thickness, PTFE strips were used in the assembly. The nominal thickness of the adhesive 0.35 and 1.0 mm was achieved for DCB and MMB tests. The adherents were sandblasted with corundum and cleaned again with compressed air and acetone to remove all the remaining dust and fat on the surface. To guarantee the desired thickness of 0.25mm for the adhesive layer, Polytetrafluoroethylene (PTFE) strips were used. The PTFE strips also guaranteed an initial crack length of a0 = 35 mm. The adhesive was applied with a cartridge gun and a static mixer. After assembly, the specimens were left to be cured in the room temperature for 24 hours. Fig. 1 shows the dimensions of the specimens used in the present work.
Fig. 1. Specimen with load introduction blocks used for DCB and MMB tests.
All the tests were carried out by an electrical load and compression test machine (Instron 5567) with a maximum
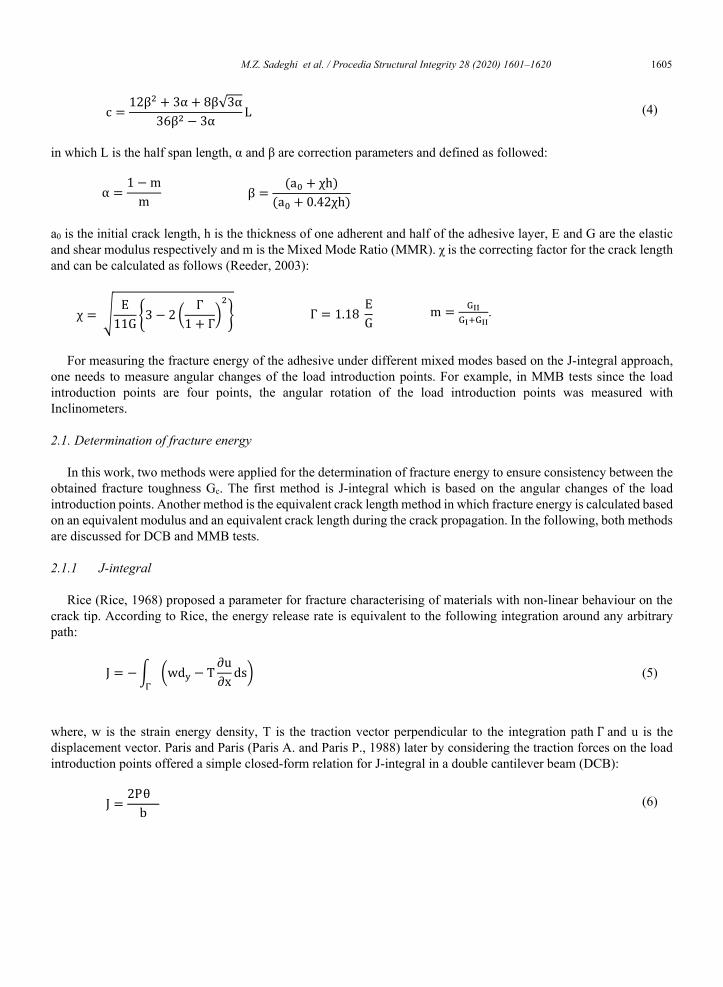
load capacity of 30 kN. The tests were under displacement control of 1.5 mm/min (based on the standards used). Majority of the tests were repeated three times. Two load introduction blocks were attached to the specimens with the cyanoacrylate adhesive Z70. Due to the low shear strength of such an adhesive, the blocks could be detached easily after the tests. The load blocks were connected to the testing machine by small steel shafts. In the load introduction points, two inclinometers were attached to record the angular rotation to measure the fracture energy based on the J-integral. The lower base of this set-up is the same as the DCB setup and is attached to the specimen by using a load block. The upper level of the MMB setup includes a bearing (Point D in Fig. 2) which is exactly located in the middle of the distance between the loading block (Point C) and the base bearing (Point B).
A schematic MMB test setup is shown in Fig. 2. The mixed-mode ratio can be adjusted by changing the position of the lever in which the load is applied. The lever distance c is shown in Fig. 2, it is calculated according to Equation (4).
Fig. 2. Schematic MMB test setup.
M.Z. Sadeghi et al./ Structural Integrity Procedia 00 (2019) 000–000
� � 12β� � 3α � �β√3α36β� � 3α L (4)
in which L is the half span length, α and β are correction parameters and defined as followed:
α � 1 � mm β � ��� � ���
��� � ���2���
a0 is the initial crack length, h is the thickness of one adherent and half of the adhesive layer, E and G are the elastic and shear modulus respectively and m is the Mixed Mode Ratio (MMR). χ is the correcting factor for the crack length and can be calculated as follows (Reeder, 2003):
� � � E11G �3 � 2 � Γ
1 � ��
� à � 1�1� EG m � ���
������.
For measuring the fracture energy of the adhesive under different mixed modes based on the J-integral approach, one needs to measure angular changes of the load introduction points. For example, in MMB tests since the load introduction points are four points, the angular rotation of the load introduction points was measured with Inclinometers.
2.1. Determination of fracture energy
In this work, two methods were applied for the determination of fracture energy to ensure consistency between the obtained fracture toughness Gc. The first method is J-integral which is based on the angular changes of the load introduction points. Another method is the equivalent crack length method in which fracture energy is calculated based on an equivalent modulus and an equivalent crack length during the crack propagation. In the following, both methods are discussed for DCB and MMB tests.
2.1.1 J-integral
Rice (Rice, 1968) proposed a parameter for fracture characterising of materials with non-linear behaviour on the crack tip. According to Rice, the energy release rate is equivalent to the following integration around any arbitrary path:
� � � � ���� � � ∂u∂x ���
� (5)
where, w is the strain energy density, T is the traction vector perpendicular to the integration path Γ and u is the displacement vector. Paris and Paris (Paris A. and Paris P., 1988) later by considering the traction forces on the load introduction points offered a simple closed-form relation for J-integral in a double cantilever beam (DCB):
� � 2P θb (6)
M.Z. Sadeghi et al. / Procedia Structural Integrity 28 (2020) 1601–1620 1605 M.Z. Sadeghi et al./ Structural Integrity Procedia 00 (2019) 000–000
2. Experimental
In this work, DCB and MMB tests (with three different mixed-mode ratios) were carried out to achieve the fracture energy envelope. DCB and MMB tests (including manufacturing the tests setup) were based on ASTMD5528 and ASTMD6671.
Although such tests are proposed for the measurement of interlaminar fracture toughness of composites, however in many previous works such tests have been successfully applied for the determination of fracture toughness of adhesives (Khoramishad et al., 2010; Moura et al., 2012; Stamoulis et al., 2014). The adherents for the adhesively bonded specimens used for the DCB and MMB tests were strips manufactured from S700MC steel with a yield stress of Rp0.2 700 MPa. To make sure such steel does not experience plasticity regime under DCB and MMB tests (with different mixed-mode ratios), FE analysis was carried out in advance. The strips had the dimension of 200 × 27 × 3 mm3. A ductile two-component epoxy adhesive Araldite 2015 was used for bonding the steel adherents. As for surface treatment, the adherents were first cleaned with acetone to remove invisible oils and fats. Depending on the desired adhesive thickness, PTFE strips were used in the assembly. The nominal thickness of the adhesive 0.35 and 1.0 mm was achieved for DCB and MMB tests. The adherents were sandblasted with corundum and cleaned again with compressed air and acetone to remove all the remaining dust and fat on the surface. To guarantee the desired thickness of 0.25mm for the adhesive layer, Polytetrafluoroethylene (PTFE) strips were used. The PTFE strips also guaranteed an initial crack length of a0 = 35 mm. The adhesive was applied with a cartridge gun and a static mixer. After assembly, the specimens were left to be cured in the room temperature for 24 hours. Fig. 1 shows the dimensions of the specimens used in the present work.
Fig. 1. Specimen with load introduction blocks used for DCB and MMB tests.
All the tests were carried out by an electrical load and compression test machine (Instron 5567) with a maximum
load capacity of 30 kN. The tests were under displacement control of 1.5 mm/min (based on the standards used). Majority of the tests were repeated three times. Two load introduction blocks were attached to the specimens with the cyanoacrylate adhesive Z70. Due to the low shear strength of such an adhesive, the blocks could be detached easily after the tests. The load blocks were connected to the testing machine by small steel shafts. In the load introduction points, two inclinometers were attached to record the angular rotation to measure the fracture energy based on the J-integral. The lower base of this set-up is the same as the DCB setup and is attached to the specimen by using a load block. The upper level of the MMB setup includes a bearing (Point D in Fig. 2) which is exactly located in the middle of the distance between the loading block (Point C) and the base bearing (Point B).
A schematic MMB test setup is shown in Fig. 2. The mixed-mode ratio can be adjusted by changing the position of the lever in which the load is applied. The lever distance c is shown in Fig. 2, it is calculated according to Equation (4).
Fig. 2. Schematic MMB test setup.
M.Z. Sadeghi et al./ Structural Integrity Procedia 00 (2019) 000–000
� � 12β� � 3α � �β√3α36β� � 3α L (4)
in which L is the half span length, α and β are correction parameters and defined as followed:
α � 1 � mm β � ��� � ���
��� � ���2���
a0 is the initial crack length, h is the thickness of one adherent and half of the adhesive layer, E and G are the elastic and shear modulus respectively and m is the Mixed Mode Ratio (MMR). χ is the correcting factor for the crack length and can be calculated as follows (Reeder, 2003):
� � � E11G �3 � 2 � Γ
1 � ��
� à � 1�1� EG m � ���
������.
For measuring the fracture energy of the adhesive under different mixed modes based on the J-integral approach, one needs to measure angular changes of the load introduction points. For example, in MMB tests since the load introduction points are four points, the angular rotation of the load introduction points was measured with Inclinometers.
2.1. Determination of fracture energy
In this work, two methods were applied for the determination of fracture energy to ensure consistency between the obtained fracture toughness Gc. The first method is J-integral which is based on the angular changes of the load introduction points. Another method is the equivalent crack length method in which fracture energy is calculated based on an equivalent modulus and an equivalent crack length during the crack propagation. In the following, both methods are discussed for DCB and MMB tests.
2.1.1 J-integral
Rice (Rice, 1968) proposed a parameter for fracture characterising of materials with non-linear behaviour on the crack tip. According to Rice, the energy release rate is equivalent to the following integration around any arbitrary path:
� � � � ���� � � ∂u∂x ���
� (5)
where, w is the strain energy density, T is the traction vector perpendicular to the integration path Γ and u is the displacement vector. Paris and Paris (Paris A. and Paris P., 1988) later by considering the traction forces on the load introduction points offered a simple closed-form relation for J-integral in a double cantilever beam (DCB):
� � 2P θb (6)
1606 M.Z. Sadeghi et al. / Procedia Structural Integrity 28 (2020) 1601–1620 M.Z. Sadeghi et al./ Structural Integrity Procedia 00 (2019) 000–000
Fig. 3. Load distribution and rotation angle in DCB setup.
Here, P is the concentrated load applied in the system, θ is the rotation of the point in which load is applied (Fig. 3) and b is the width of the specimen. Later, Sarrado et al. (Sarrado et al., 2015) based on the same procedure, developed a closed-form formula for the determination of J-integral in the MMB tests They implemented their approach in the determination of fracture energy of the delamination process which showed a good agreement with the methods based on LEFM provided by . This model was later implemented successfully for measurement of interlaminar fracture toughness (Zhao et al., 2016). The J-integral formulae for the MMB test offered by Sarrado et al (Sarrado et al., 2015) is as follows:
� � Pb �c
L θ� � �12 � c
2L� θ� � � c2L � 1
2� θ� � �cL � 1� θ�� (7)
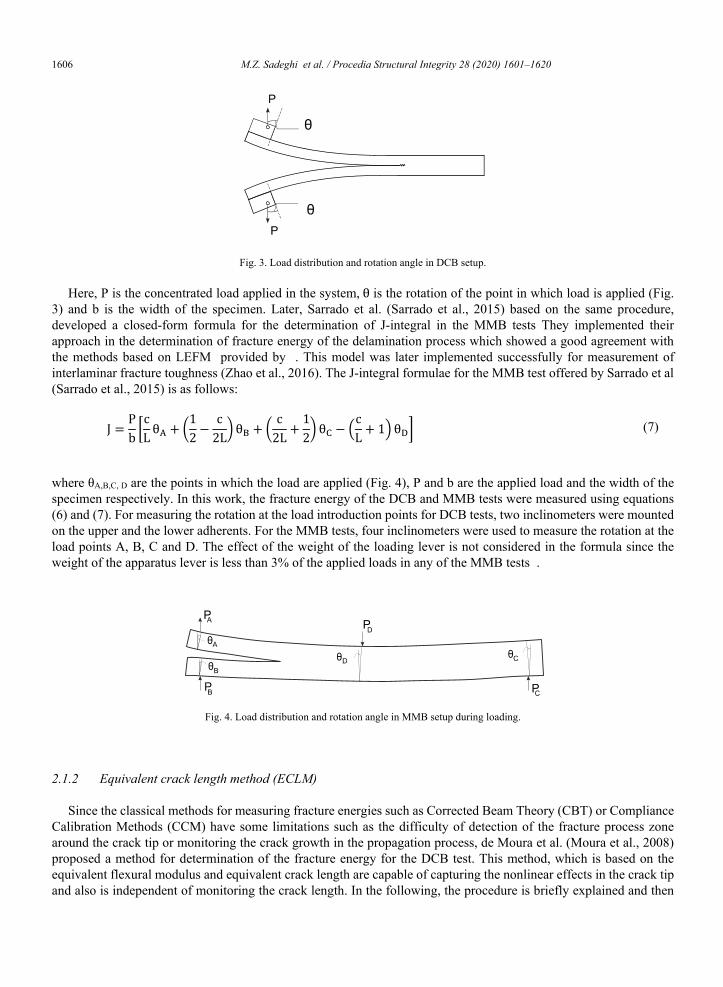
where θA,B,C, D are the points in which the load are applied (Fig. 4), P and b are the applied load and the width of the specimen respectively. In this work, the fracture energy of the DCB and MMB tests were measured using equations (6) and (7). For measuring the rotation at the load introduction points for DCB tests, two inclinometers were mounted on the upper and the lower adherents. For the MMB tests, four inclinometers were used to measure the rotation at the load points A, B, C and D. The effect of the weight of the loading lever is not considered in the formula since the weight of the apparatus lever is less than 3% of the applied loads in any of the MMB tests .
Fig. 4. Load distribution and rotation angle in MMB setup during loading.
2.1.2 Equivalent crack length method (ECLM)
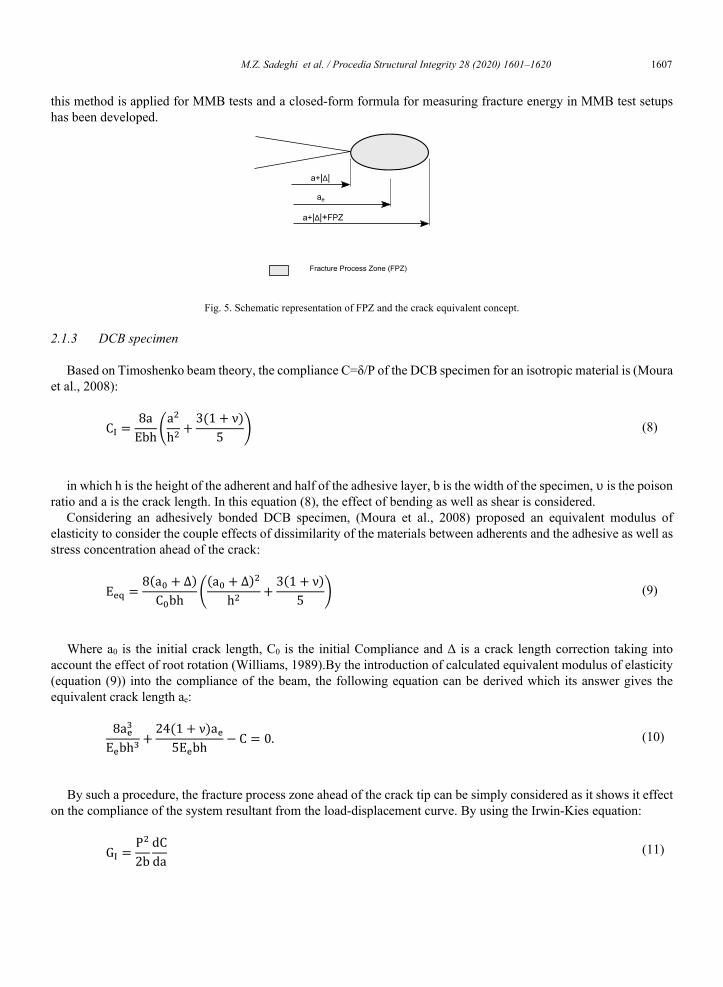
Since the classical methods for measuring fracture energies such as Corrected Beam Theory (CBT) or Compliance Calibration Methods (CCM) have some limitations such as the difficulty of detection of the fracture process zone around the crack tip or monitoring the crack growth in the propagation process, de Moura et al. (Moura et al., 2008) proposed a method for determination of the fracture energy for the DCB test. This method, which is based on the equivalent flexural modulus and equivalent crack length are capable of capturing the nonlinear effects in the crack tip and also is independent of monitoring the crack length. In the following, the procedure is briefly explained and then
M.Z. Sadeghi et al./ Structural Integrity Procedia 00 (2019) 000–000
this method is applied for MMB tests and a closed-form formula for measuring fracture energy in MMB test setups has been developed.
Fig. 5. Schematic representation of FPZ and the crack equivalent concept.
2.1.3 DCB specimen
Based on Timoshenko beam theory, the compliance C=δ/P of the DCB specimen for an isotropic material is (Moura et al., 2008):
C� � 8aEbh�
a�h� �
3�� � ��5 � (8)
in which h is the height of the adherent and half of the adhesive layer, b is the width of the specimen, υ is the poison ratio and a is the crack length. In this equation (8), the effect of bending as well as shear is considered.
Considering an adhesively bonded DCB specimen, (Moura et al., 2008) proposed an equivalent modulus of elasticity to consider the couple effects of dissimilarity of the materials between adherents and the adhesive as well as stress concentration ahead of the crack:
E�� � 8�a� � ��C�bh ��a� � ���
h� � 3�� � ��5 � (9)
Where a0 is the initial crack length, C0 is the initial Compliance and Δ is a crack length correction taking into account the effect of root rotation (Williams, 1989).By the introduction of calculated equivalent modulus of elasticity (equation (9)) into the compliance of the beam, the following equation can be derived which its answer gives the equivalent crack length ae:
8a��E�bh� �
2��� � ��a�5E�bh � C � �� (10)
By such a procedure, the fracture process zone ahead of the crack tip can be simply considered as it shows it effect on the compliance of the system resultant from the load-displacement curve. By using the Irwin-Kies equation:
G� � P�2b
dCda (11)
M.Z. Sadeghi et al. / Procedia Structural Integrity 28 (2020) 1601–1620 1607 M.Z. Sadeghi et al./ Structural Integrity Procedia 00 (2019) 000–000
Fig. 3. Load distribution and rotation angle in DCB setup.
Here, P is the concentrated load applied in the system, θ is the rotation of the point in which load is applied (Fig. 3) and b is the width of the specimen. Later, Sarrado et al. (Sarrado et al., 2015) based on the same procedure, developed a closed-form formula for the determination of J-integral in the MMB tests They implemented their approach in the determination of fracture energy of the delamination process which showed a good agreement with the methods based on LEFM provided by . This model was later implemented successfully for measurement of interlaminar fracture toughness (Zhao et al., 2016). The J-integral formulae for the MMB test offered by Sarrado et al (Sarrado et al., 2015) is as follows:
� � Pb �c
L θ� � �12 � c
2L� θ� � � c2L � 1
2� θ� � �cL � 1� θ�� (7)
where θA,B,C, D are the points in which the load are applied (Fig. 4), P and b are the applied load and the width of the specimen respectively. In this work, the fracture energy of the DCB and MMB tests were measured using equations (6) and (7). For measuring the rotation at the load introduction points for DCB tests, two inclinometers were mounted on the upper and the lower adherents. For the MMB tests, four inclinometers were used to measure the rotation at the load points A, B, C and D. The effect of the weight of the loading lever is not considered in the formula since the weight of the apparatus lever is less than 3% of the applied loads in any of the MMB tests .
Fig. 4. Load distribution and rotation angle in MMB setup during loading.
2.1.2 Equivalent crack length method (ECLM)
Since the classical methods for measuring fracture energies such as Corrected Beam Theory (CBT) or Compliance Calibration Methods (CCM) have some limitations such as the difficulty of detection of the fracture process zone around the crack tip or monitoring the crack growth in the propagation process, de Moura et al. (Moura et al., 2008) proposed a method for determination of the fracture energy for the DCB test. This method, which is based on the equivalent flexural modulus and equivalent crack length are capable of capturing the nonlinear effects in the crack tip and also is independent of monitoring the crack length. In the following, the procedure is briefly explained and then
M.Z. Sadeghi et al./ Structural Integrity Procedia 00 (2019) 000–000
this method is applied for MMB tests and a closed-form formula for measuring fracture energy in MMB test setups has been developed.
Fig. 5. Schematic representation of FPZ and the crack equivalent concept.
2.1.3 DCB specimen
Based on Timoshenko beam theory, the compliance C=δ/P of the DCB specimen for an isotropic material is (Moura et al., 2008):
C� � 8aEbh�
a�h� �
3�� � ��5 � (8)
in which h is the height of the adherent and half of the adhesive layer, b is the width of the specimen, υ is the poison ratio and a is the crack length. In this equation (8), the effect of bending as well as shear is considered.
Considering an adhesively bonded DCB specimen, (Moura et al., 2008) proposed an equivalent modulus of elasticity to consider the couple effects of dissimilarity of the materials between adherents and the adhesive as well as stress concentration ahead of the crack:
E�� � 8�a� � ��C�bh ��a� � ���
h� � 3�� � ��5 � (9)
Where a0 is the initial crack length, C0 is the initial Compliance and Δ is a crack length correction taking into account the effect of root rotation (Williams, 1989).By the introduction of calculated equivalent modulus of elasticity (equation (9)) into the compliance of the beam, the following equation can be derived which its answer gives the equivalent crack length ae:
8a��E�bh� �
2��� � ��a�5E�bh � C � �� (10)
By such a procedure, the fracture process zone ahead of the crack tip can be simply considered as it shows it effect on the compliance of the system resultant from the load-displacement curve. By using the Irwin-Kies equation:
G� � P�2b
dCda (11)
1608 M.Z. Sadeghi et al. / Procedia Structural Integrity 28 (2020) 1601–1620 M.Z. Sadeghi et al./ Structural Integrity Procedia 00 (2019) 000–000
The following equation for fracture energy of the DCB tests was proposed which is based on the equivalent crack length (Moura et al., 2008):
G� � 12P�E��b�h�
a��a� �
1 � �5 � (12)
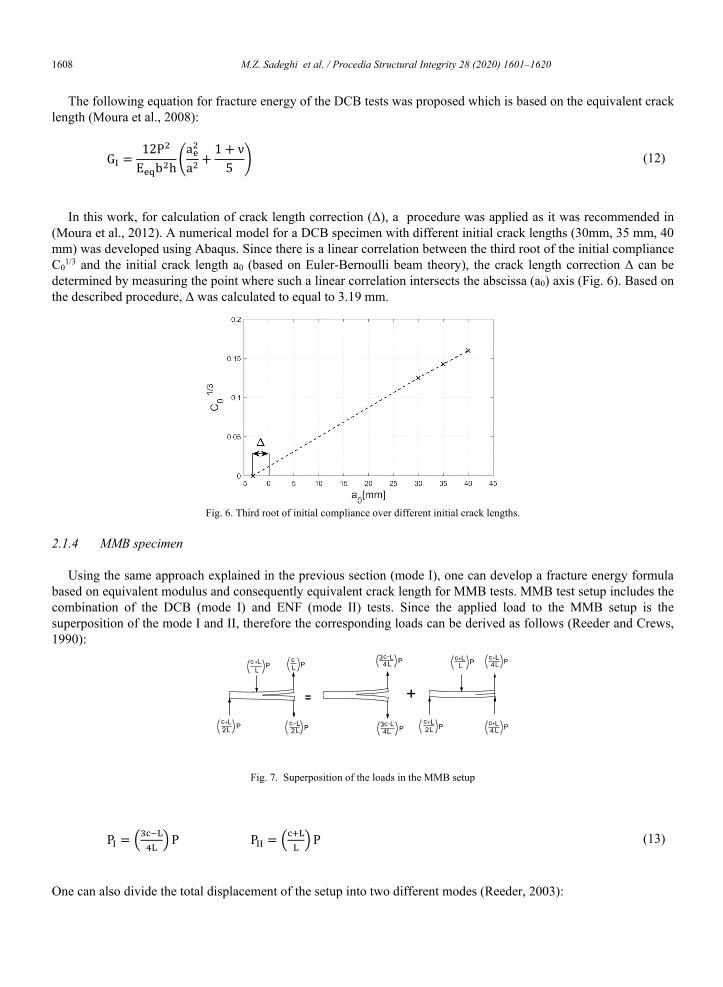
In this work, for calculation of crack length correction (Δ), a procedure was applied as it was recommended in (Moura et al., 2012). A numerical model for a DCB specimen with different initial crack lengths (30mm, 35 mm, 40 mm) was developed using Abaqus. Since there is a linear correlation between the third root of the initial compliance C0
1/3 and the initial crack length a0 (based on Euler-Bernoulli beam theory), the crack length correction Δ can be determined by measuring the point where such a linear correlation intersects the abscissa (a0) axis (Fig. 6). Based on the described procedure, Δ was calculated to equal to 3.19 mm.
Fig. 6. Third root of initial compliance over different initial crack lengths.
2.1.4 MMB specimen
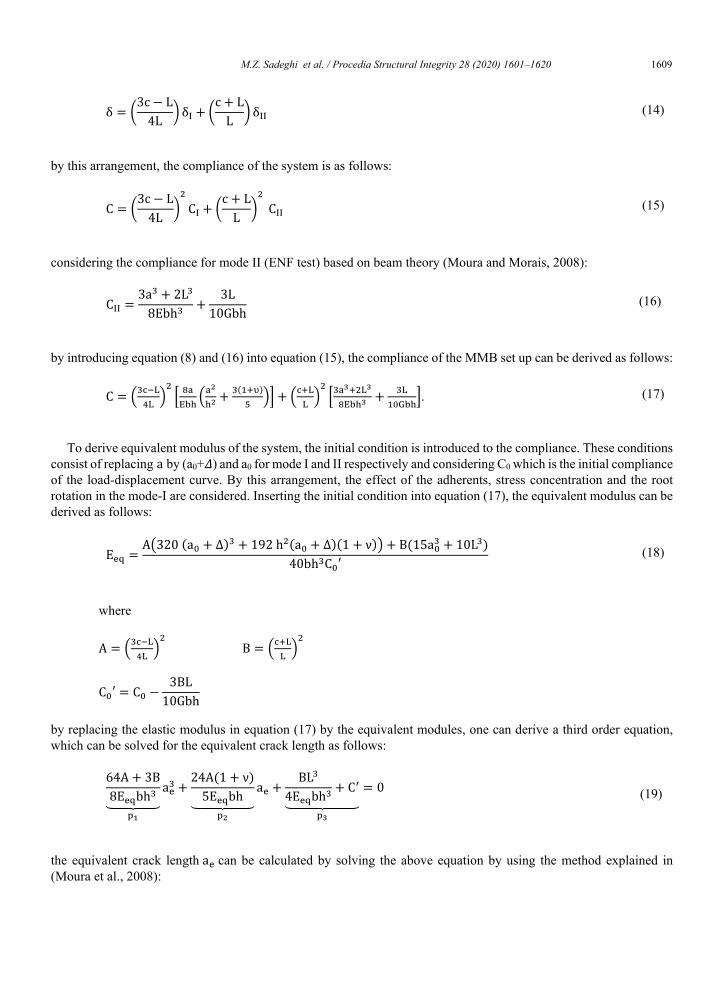
Using the same approach explained in the previous section (mode I), one can develop a fracture energy formula based on equivalent modulus and consequently equivalent crack length for MMB tests. MMB test setup includes the combination of the DCB (mode I) and ENF (mode II) tests. Since the applied load to the MMB setup is the superposition of the mode I and II, therefore the corresponding loads can be derived as follows (Reeder and Crews, 1990):
Fig. 7. Superposition of the loads in the MMB setup
P� � ������� � P P�� � ����� � P (13)
One can also divide the total displacement of the setup into two different modes (Reeder, 2003):
M.Z. Sadeghi et al./ Structural Integrity Procedia 00 (2019) 000–000
� � �3� � L4L � �� � �� � L
L � ��� (14)
by this arrangement, the compliance of the system is as follows:
C � �3� � L4L �
�C� � �� � L
L ��
C�� (15)
considering the compliance for mode II (ENF test) based on beam theory (Moura and Morais, 2008):
C�� � 3a� � �L�
8Ebh� � 3L10Gbh (16)
by introducing equation (8) and (16) into equation (15), the compliance of the MMB set up can be derived as follows:
C � ������� �� � ��
��� ����� � ������
� �� � ����� �� ��������
����� � ��������. (17)
To derive equivalent modulus of the system, the initial condition is introduced to the compliance. These conditions consist of replacing a by (a0+𝛥𝛥) and a0 for mode I and II respectively and considering C0 which is the initial compliance of the load-displacement curve. By this arrangement, the effect of the adherents, stress concentration and the root rotation in the mode-I are considered. Inserting the initial condition into equation (17), the equivalent modulus can be derived as follows:
E�� � ��3�0 �a� � ��� � 1�� h��a� � ���1 � ��� � B�15a�� � 10L��40bh�C�′ (18)
where
� � ������� ��
B � ����� ��
C�′ � C� � 3BL10Gbh
by replacing the elastic modulus in equation (17) by the equivalent modules, one can derive a third order equation, which can be solved for the equivalent crack length as follows:
�4� � 3B8E��bh��������
��
a�� � �4��1 � ��5E��bh�������
��
a� � BL�
4E��bh� � C����������
��
� 0 (19)
the equivalent crack length a� can be calculated by solving the above equation by using the method explained in (Moura et al., 2008):
M.Z. Sadeghi et al. / Procedia Structural Integrity 28 (2020) 1601–1620 1609 M.Z. Sadeghi et al./ Structural Integrity Procedia 00 (2019) 000–000
The following equation for fracture energy of the DCB tests was proposed which is based on the equivalent crack length (Moura et al., 2008):
G� � 12P�E��b�h�
a��a� �
1 � �5 � (12)
In this work, for calculation of crack length correction (Δ), a procedure was applied as it was recommended in (Moura et al., 2012). A numerical model for a DCB specimen with different initial crack lengths (30mm, 35 mm, 40 mm) was developed using Abaqus. Since there is a linear correlation between the third root of the initial compliance C0
1/3 and the initial crack length a0 (based on Euler-Bernoulli beam theory), the crack length correction Δ can be determined by measuring the point where such a linear correlation intersects the abscissa (a0) axis (Fig. 6). Based on the described procedure, Δ was calculated to equal to 3.19 mm.
Fig. 6. Third root of initial compliance over different initial crack lengths.
2.1.4 MMB specimen
Using the same approach explained in the previous section (mode I), one can develop a fracture energy formula based on equivalent modulus and consequently equivalent crack length for MMB tests. MMB test setup includes the combination of the DCB (mode I) and ENF (mode II) tests. Since the applied load to the MMB setup is the superposition of the mode I and II, therefore the corresponding loads can be derived as follows (Reeder and Crews, 1990):
Fig. 7. Superposition of the loads in the MMB setup
P� � ������� � P P�� � ����� � P (13)
One can also divide the total displacement of the setup into two different modes (Reeder, 2003):
M.Z. Sadeghi et al./ Structural Integrity Procedia 00 (2019) 000–000
� � �3� � L4L � �� � �� � L
L � ��� (14)
by this arrangement, the compliance of the system is as follows:
C � �3� � L4L �
�C� � �� � L
L ��
C�� (15)
considering the compliance for mode II (ENF test) based on beam theory (Moura and Morais, 2008):
C�� � 3a� � �L�
8Ebh� � 3L10Gbh (16)
by introducing equation (8) and (16) into equation (15), the compliance of the MMB set up can be derived as follows:
C � ������� �� � ��
��� ����� � ������
� �� � ����� �� ��������
����� � ��������. (17)
To derive equivalent modulus of the system, the initial condition is introduced to the compliance. These conditions consist of replacing a by (a0+𝛥𝛥) and a0 for mode I and II respectively and considering C0 which is the initial compliance of the load-displacement curve. By this arrangement, the effect of the adherents, stress concentration and the root rotation in the mode-I are considered. Inserting the initial condition into equation (17), the equivalent modulus can be derived as follows:
E�� � ��3�0 �a� � ��� � 1�� h��a� � ���1 � ��� � B�15a�� � 10L��40bh�C�′ (18)
where
� � ������� ��
B � ����� ��
C�′ � C� � 3BL10Gbh
by replacing the elastic modulus in equation (17) by the equivalent modules, one can derive a third order equation, which can be solved for the equivalent crack length as follows:
�4� � 3B8E��bh��������
��
a�� � �4��1 � ��5E��bh�������
��
a� � BL�
4E��bh� � C����������
��
� 0 (19)
the equivalent crack length a� can be calculated by solving the above equation by using the method explained in (Moura et al., 2008):
1610 M.Z. Sadeghi et al. / Procedia Structural Integrity 28 (2020) 1601–1620 M.Z. Sadeghi et al./ Structural Integrity Procedia 00 (2019) 000–000
a� � 16p�
q � 2p�q
where,
q � ���10�p� � 12�3 �4p�� � 2�p��p�p�
�� p�����
�� � � � 3BL10Gbh
(20)
then by implementing Eeq and ae in the following equations, total fracture energy for mixed-mode loading can be calculated.
G � G� � G�� (21)
G � 12P�
E��b�h �a��
h� � 1 � �5 � � ��a� � 0�42���P�
16b�h�E�� (22)
3. Finite element analysis
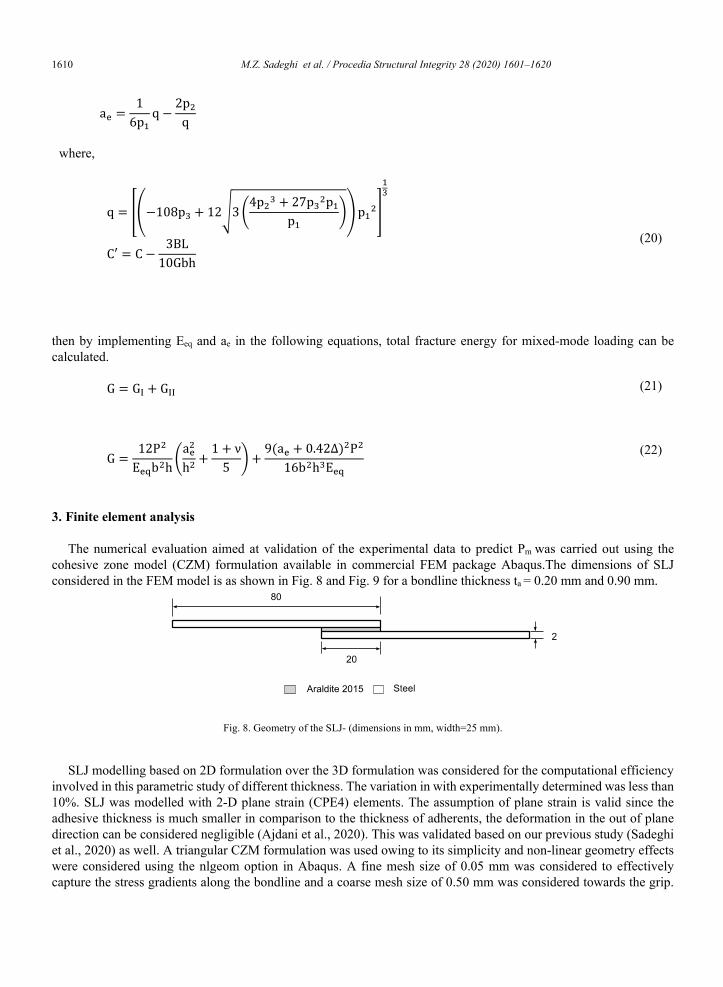
The numerical evaluation aimed at validation of the experimental data to predict Pm was carried out using the cohesive zone model (CZM) formulation available in commercial FEM package Abaqus.The dimensions of SLJ considered in the FEM model is as shown in Fig. 8 and Fig. 9 for a bondline thickness ta = 0.20 mm and 0.90 mm.
Fig. 8. Geometry of the SLJ- (dimensions in mm, width=25 mm).
SLJ modelling based on 2D formulation over the 3D formulation was considered for the computational efficiency involved in this parametric study of different thickness. The variation in with experimentally determined was less than 10%. SLJ was modelled with 2-D plane strain (CPE4) elements. The assumption of plane strain is valid since the adhesive thickness is much smaller in comparison to the thickness of adherents, the deformation in the out of plane direction can be considered negligible (Ajdani et al., 2020). This was validated based on our previous study (Sadeghi et al., 2020) as well. A triangular CZM formulation was used owing to its simplicity and non-linear geometry effects were considered using the nlgeom option in Abaqus. A fine mesh size of 0.05 mm was considered to effectively capture the stress gradients along the bondline and a coarse mesh size of 0.50 mm was considered towards the grip.
M.Z. Sadeghi et al./ Structural Integrity Procedia 00 (2019) 000–000
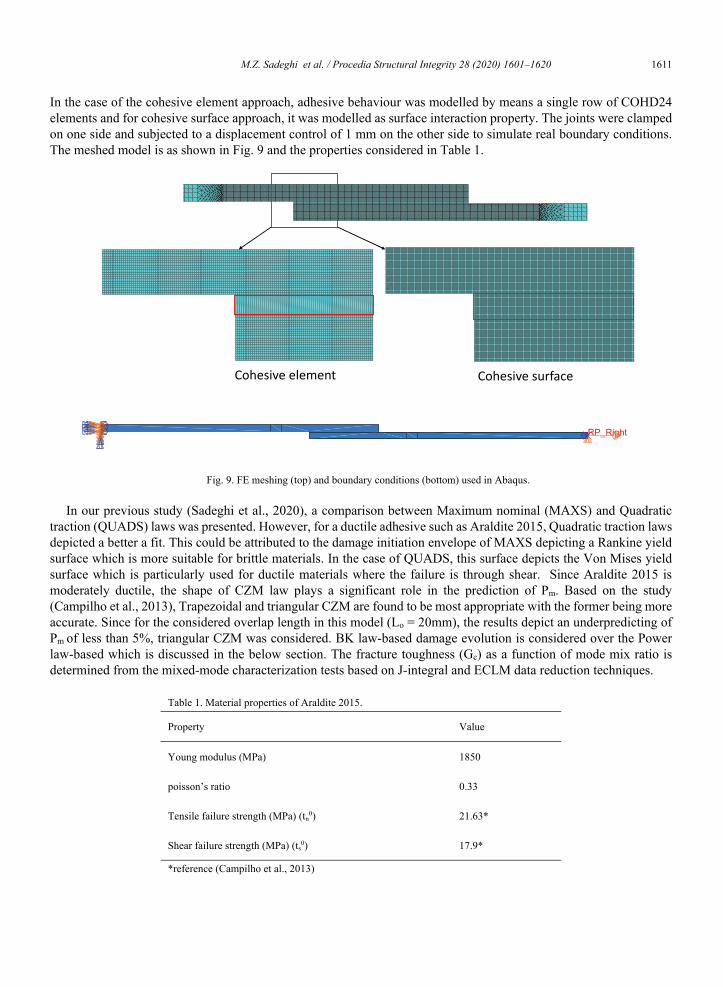
In the case of the cohesive element approach, adhesive behaviour was modelled by means a single row of COHD24 elements and for cohesive surface approach, it was modelled as surface interaction property. The joints were clamped on one side and subjected to a displacement control of 1 mm on the other side to simulate real boundary conditions. The meshed model is as shown in Fig. 9 and the properties considered in Table 1.
Fig. 9. FE meshing (top) and boundary conditions (bottom) used in Abaqus.
In our previous study (Sadeghi et al., 2020), a comparison between Maximum nominal (MAXS) and Quadratic traction (QUADS) laws was presented. However, for a ductile adhesive such as Araldite 2015, Quadratic traction laws depicted a better a fit. This could be attributed to the damage initiation envelope of MAXS depicting a Rankine yield surface which is more suitable for brittle materials. In the case of QUADS, this surface depicts the Von Mises yield surface which is particularly used for ductile materials where the failure is through shear. Since Araldite 2015 is moderately ductile, the shape of CZM law plays a significant role in the prediction of Pm. Based on the study (Campilho et al., 2013), Trapezoidal and triangular CZM are found to be most appropriate with the former being more accurate. Since for the considered overlap length in this model (Lo = 20mm), the results depict an underpredicting of Pm of less than 5%, triangular CZM was considered. BK law-based damage evolution is considered over the Power law-based which is discussed in the below section. The fracture toughness (Gc) as a function of mode mix ratio is determined from the mixed-mode characterization tests based on J-integral and ECLM data reduction techniques.
Table 1. Material properties of Araldite 2015.
Property Value
Young modulus (MPa) 1850
poisson’s ratio 0.33
Tensile failure strength (MPa) (tn0) 21.63*
Shear failure strength (MPa) (ts0) 17.9*
*reference (Campilho et al., 2013)
Cohesive element Cohesive surface
M.Z. Sadeghi et al. / Procedia Structural Integrity 28 (2020) 1601–1620 1611 M.Z. Sadeghi et al./ Structural Integrity Procedia 00 (2019) 000–000
a� � 16p�
q � 2p�q
where,
q � ���10�p� � 12�3 �4p�� � 2�p��p�p�
�� p�����
�� � � � 3BL10Gbh
(20)
then by implementing Eeq and ae in the following equations, total fracture energy for mixed-mode loading can be calculated.
G � G� � G�� (21)
G � 12P�
E��b�h �a��
h� � 1 � �5 � � ��a� � 0�42���P�
16b�h�E�� (22)
3. Finite element analysis
The numerical evaluation aimed at validation of the experimental data to predict Pm was carried out using the cohesive zone model (CZM) formulation available in commercial FEM package Abaqus.The dimensions of SLJ considered in the FEM model is as shown in Fig. 8 and Fig. 9 for a bondline thickness ta = 0.20 mm and 0.90 mm.
Fig. 8. Geometry of the SLJ- (dimensions in mm, width=25 mm).
SLJ modelling based on 2D formulation over the 3D formulation was considered for the computational efficiency involved in this parametric study of different thickness. The variation in with experimentally determined was less than 10%. SLJ was modelled with 2-D plane strain (CPE4) elements. The assumption of plane strain is valid since the adhesive thickness is much smaller in comparison to the thickness of adherents, the deformation in the out of plane direction can be considered negligible (Ajdani et al., 2020). This was validated based on our previous study (Sadeghi et al., 2020) as well. A triangular CZM formulation was used owing to its simplicity and non-linear geometry effects were considered using the nlgeom option in Abaqus. A fine mesh size of 0.05 mm was considered to effectively capture the stress gradients along the bondline and a coarse mesh size of 0.50 mm was considered towards the grip.
M.Z. Sadeghi et al./ Structural Integrity Procedia 00 (2019) 000–000
In the case of the cohesive element approach, adhesive behaviour was modelled by means a single row of COHD24 elements and for cohesive surface approach, it was modelled as surface interaction property. The joints were clamped on one side and subjected to a displacement control of 1 mm on the other side to simulate real boundary conditions. The meshed model is as shown in Fig. 9 and the properties considered in Table 1.
Fig. 9. FE meshing (top) and boundary conditions (bottom) used in Abaqus.
In our previous study (Sadeghi et al., 2020), a comparison between Maximum nominal (MAXS) and Quadratic traction (QUADS) laws was presented. However, for a ductile adhesive such as Araldite 2015, Quadratic traction laws depicted a better a fit. This could be attributed to the damage initiation envelope of MAXS depicting a Rankine yield surface which is more suitable for brittle materials. In the case of QUADS, this surface depicts the Von Mises yield surface which is particularly used for ductile materials where the failure is through shear. Since Araldite 2015 is moderately ductile, the shape of CZM law plays a significant role in the prediction of Pm. Based on the study (Campilho et al., 2013), Trapezoidal and triangular CZM are found to be most appropriate with the former being more accurate. Since for the considered overlap length in this model (Lo = 20mm), the results depict an underpredicting of Pm of less than 5%, triangular CZM was considered. BK law-based damage evolution is considered over the Power law-based which is discussed in the below section. The fracture toughness (Gc) as a function of mode mix ratio is determined from the mixed-mode characterization tests based on J-integral and ECLM data reduction techniques.
Table 1. Material properties of Araldite 2015.
Property Value
Young modulus (MPa) 1850
poisson’s ratio 0.33
Tensile failure strength (MPa) (tn0) 21.63*
Shear failure strength (MPa) (ts0) 17.9*
*reference (Campilho et al., 2013)
Cohesive element Cohesive surface
1612 M.Z. Sadeghi et al. / Procedia Structural Integrity 28 (2020) 1601–1620 M.Z. Sadeghi et al./ Structural Integrity Procedia 00 (2019) 000–000
4. Results and Discussion
4.1. Determination of strain energy release rate (SERR)
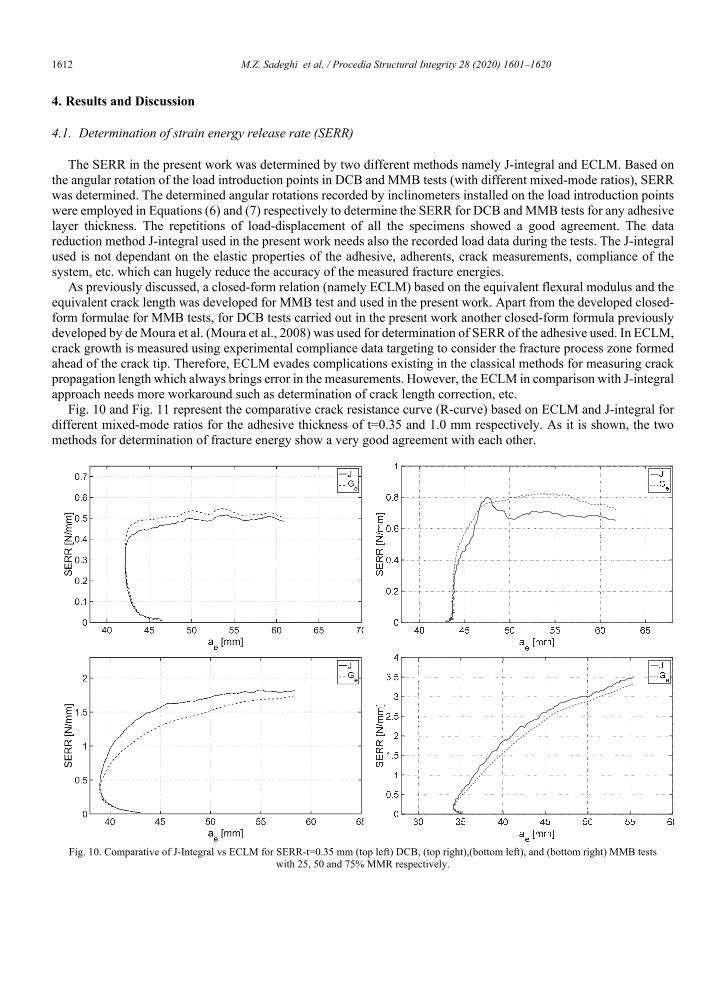
The SERR in the present work was determined by two different methods namely J-integral and ECLM. Based on the angular rotation of the load introduction points in DCB and MMB tests (with different mixed-mode ratios), SERR was determined. The determined angular rotations recorded by inclinometers installed on the load introduction points were employed in Equations (6) and (7) respectively to determine the SERR for DCB and MMB tests for any adhesive layer thickness. The repetitions of load-displacement of all the specimens showed a good agreement. The data reduction method J-integral used in the present work needs also the recorded load data during the tests. The J-integral used is not dependant on the elastic properties of the adhesive, adherents, crack measurements, compliance of the system, etc. which can hugely reduce the accuracy of the measured fracture energies.
As previously discussed, a closed-form relation (namely ECLM) based on the equivalent flexural modulus and the equivalent crack length was developed for MMB test and used in the present work. Apart from the developed closed-form formulae for MMB tests, for DCB tests carried out in the present work another closed-form formula previously developed by de Moura et al. (Moura et al., 2008) was used for determination of SERR of the adhesive used. In ECLM, crack growth is measured using experimental compliance data targeting to consider the fracture process zone formed ahead of the crack tip. Therefore, ECLM evades complications existing in the classical methods for measuring crack propagation length which always brings error in the measurements. However, the ECLM in comparison with J-integral approach needs more workaround such as determination of crack length correction, etc.
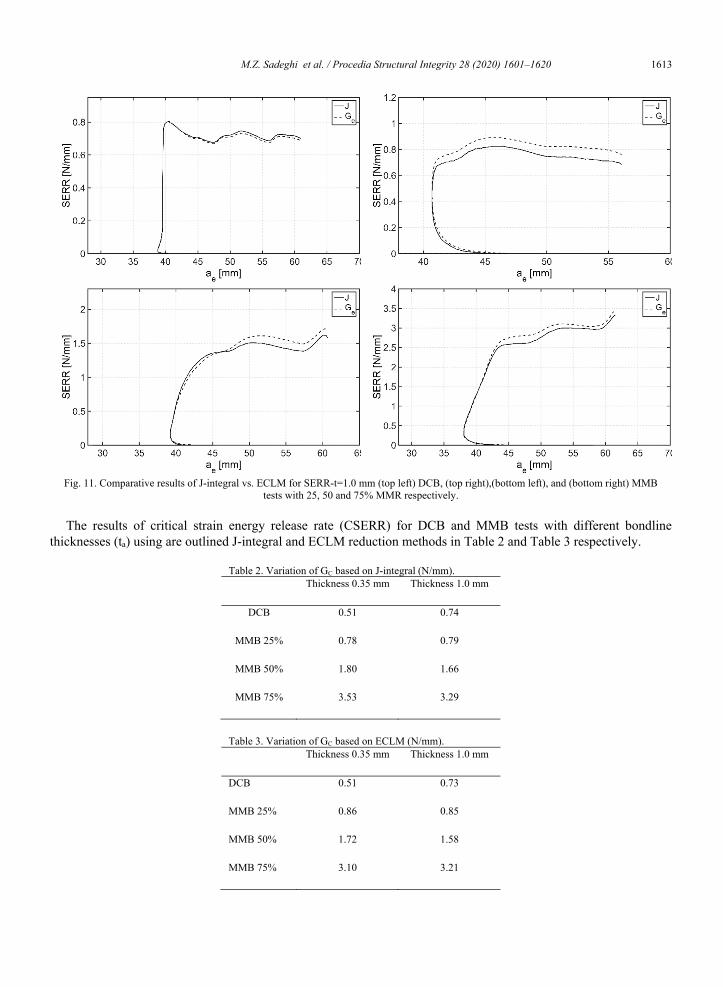
Fig. 10 and Fig. 11 represent the comparative crack resistance curve (R-curve) based on ECLM and J-integral for different mixed-mode ratios for the adhesive thickness of t=0.35 and 1.0 mm respectively. As it is shown, the two methods for determination of fracture energy show a very good agreement with each other.
Fig. 10. Comparative of J-Integral vs ECLM for SERR-t=0.35 mm (top left) DCB, (top right),(bottom left), and (bottom right) MMB tests with 25, 50 and 75% MMR respectively.
M.Z. Sadeghi et al./ Structural Integrity Procedia 00 (2019) 000–000
Fig. 11. Comparative results of J-integral vs. ECLM for SERR-t=1.0 mm (top left) DCB, (top right),(bottom left), and (bottom right) MMB tests with 25, 50 and 75% MMR respectively.
The results of critical strain energy release rate (CSERR) for DCB and MMB tests with different bondline
thicknesses (ta) using are outlined J-integral and ECLM reduction methods in Table 2 and Table 3 respectively.
Table 2. Variation of GC based on J-integral (N/mm). Thickness 0.35 mm Thickness 1.0 mm
DCB 0.51 0.74
MMB 25% 0.78 0.79
MMB 50% 1.80 1.66
MMB 75% 3.53 3.29
Table 3. Variation of GC based on ECLM (N/mm). Thickness 0.35 mm Thickness 1.0 mm
DCB 0.51 0.73
MMB 25% 0.86 0.85
MMB 50% 1.72 1.58
MMB 75% 3.10 3.21
M.Z. Sadeghi et al. / Procedia Structural Integrity 28 (2020) 1601–1620 1613 M.Z. Sadeghi et al./ Structural Integrity Procedia 00 (2019) 000–000
4. Results and Discussion
4.1. Determination of strain energy release rate (SERR)
The SERR in the present work was determined by two different methods namely J-integral and ECLM. Based on the angular rotation of the load introduction points in DCB and MMB tests (with different mixed-mode ratios), SERR was determined. The determined angular rotations recorded by inclinometers installed on the load introduction points were employed in Equations (6) and (7) respectively to determine the SERR for DCB and MMB tests for any adhesive layer thickness. The repetitions of load-displacement of all the specimens showed a good agreement. The data reduction method J-integral used in the present work needs also the recorded load data during the tests. The J-integral used is not dependant on the elastic properties of the adhesive, adherents, crack measurements, compliance of the system, etc. which can hugely reduce the accuracy of the measured fracture energies.
As previously discussed, a closed-form relation (namely ECLM) based on the equivalent flexural modulus and the equivalent crack length was developed for MMB test and used in the present work. Apart from the developed closed-form formulae for MMB tests, for DCB tests carried out in the present work another closed-form formula previously developed by de Moura et al. (Moura et al., 2008) was used for determination of SERR of the adhesive used. In ECLM, crack growth is measured using experimental compliance data targeting to consider the fracture process zone formed ahead of the crack tip. Therefore, ECLM evades complications existing in the classical methods for measuring crack propagation length which always brings error in the measurements. However, the ECLM in comparison with J-integral approach needs more workaround such as determination of crack length correction, etc.
Fig. 10 and Fig. 11 represent the comparative crack resistance curve (R-curve) based on ECLM and J-integral for different mixed-mode ratios for the adhesive thickness of t=0.35 and 1.0 mm respectively. As it is shown, the two methods for determination of fracture energy show a very good agreement with each other.
Fig. 10. Comparative of J-Integral vs ECLM for SERR-t=0.35 mm (top left) DCB, (top right),(bottom left), and (bottom right) MMB tests with 25, 50 and 75% MMR respectively.
M.Z. Sadeghi et al./ Structural Integrity Procedia 00 (2019) 000–000
Fig. 11. Comparative results of J-integral vs. ECLM for SERR-t=1.0 mm (top left) DCB, (top right),(bottom left), and (bottom right) MMB tests with 25, 50 and 75% MMR respectively.
The results of critical strain energy release rate (CSERR) for DCB and MMB tests with different bondline
thicknesses (ta) using are outlined J-integral and ECLM reduction methods in Table 2 and Table 3 respectively.
Table 2. Variation of GC based on J-integral (N/mm). Thickness 0.35 mm Thickness 1.0 mm
DCB 0.51 0.74
MMB 25% 0.78 0.79
MMB 50% 1.80 1.66
MMB 75% 3.53 3.29
Table 3. Variation of GC based on ECLM (N/mm). Thickness 0.35 mm Thickness 1.0 mm
DCB 0.51 0.73
MMB 25% 0.86 0.85
MMB 50% 1.72 1.58
MMB 75% 3.10 3.21
1614 M.Z. Sadeghi et al. / Procedia Structural Integrity 28 (2020) 1601–1620 M.Z. Sadeghi et al./ Structural Integrity Procedia 00 (2019) 000–000
4.2. Fracture envelope:
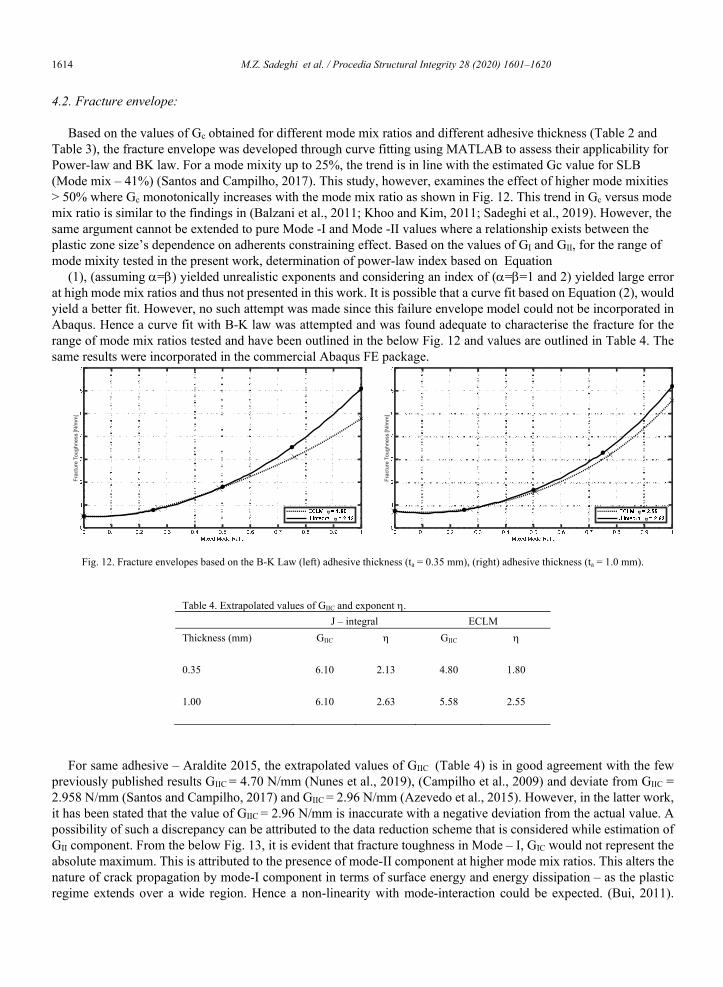
Based on the values of Gc obtained for different mode mix ratios and different adhesive thickness (Table 2 and Table 3), the fracture envelope was developed through curve fitting using MATLAB to assess their applicability for Power-law and BK law. For a mode mixity up to 25%, the trend is in line with the estimated Gc value for SLB (Mode mix – 41%) (Santos and Campilho, 2017). This study, however, examines the effect of higher mode mixities > 50% where Gc monotonically increases with the mode mix ratio as shown in Fig. 12. This trend in Gc versus mode mix ratio is similar to the findings in (Balzani et al., 2011; Khoo and Kim, 2011; Sadeghi et al., 2019). However, the same argument cannot be extended to pure Mode -I and Mode -II values where a relationship exists between the plastic zone size’s dependence on adherents constraining effect. Based on the values of GI and GII, for the range of mode mixity tested in the present work, determination of power-law index based on Equation
(1), (assuming =) yielded unrealistic exponents and considering an index of (==1 and 2) yielded large error at high mode mix ratios and thus not presented in this work. It is possible that a curve fit based on Equation (2), would yield a better fit. However, no such attempt was made since this failure envelope model could not be incorporated in Abaqus. Hence a curve fit with B-K law was attempted and was found adequate to characterise the fracture for the range of mode mix ratios tested and have been outlined in the below Fig. 12 and values are outlined in Table 4. The same results were incorporated in the commercial Abaqus FE package.
Fig. 12. Fracture envelopes based on the B-K Law (left) adhesive thickness (ta = 0.35 mm), (right) adhesive thickness (ta = 1.0 mm).
Table 4. Extrapolated values of GIIC and exponent . J – integral ECLM Thickness (mm) GIIC GIIC
0.35 6.10 2.13 4.80 1.80
1.00 6.10 2.63 5.58 2.55
For same adhesive – Araldite 2015, the extrapolated values of GIIC (Table 4) is in good agreement with the few previously published results GIIC = 4.70 N/mm (Nunes et al., 2019), (Campilho et al., 2009) and deviate from GIIC = 2.958 N/mm (Santos and Campilho, 2017) and GIIC = 2.96 N/mm (Azevedo et al., 2015). However, in the latter work, it has been stated that the value of GIIC = 2.96 N/mm is inaccurate with a negative deviation from the actual value. A possibility of such a discrepancy can be attributed to the data reduction scheme that is considered while estimation of GII component. From the below Fig. 13, it is evident that fracture toughness in Mode – I, GIC would not represent the absolute maximum. This is attributed to the presence of mode-II component at higher mode mix ratios. This alters the nature of crack propagation by mode-I component in terms of surface energy and energy dissipation – as the plastic regime extends over a wide region. Hence a non-linearity with mode-interaction could be expected. (Bui, 2011).
Frac
ture
Tou
ghne
ss [N
/mm
]
Frac
ture
Tou
ghne
ss [N
/mm
]
M.Z. Sadeghi et al./ Structural Integrity Procedia 00 (2019) 000–000
However, Mode-I dominates the fracture up to MMB ratio of 50% which is in line with the finding of an epoxy adhesive where the Mode-I ratio dominates up to 75% mode mix ratio. This was based on the assessment of fracture surfaces of the specimen (Khoo and Kim, 2011).
Fig. 13. Fracture envelopes based on the B-K Law for adhesive thickness ta = 0.35 mm and 1.0 mm.
Apart from Power law and B-K law, Abaqus provides another option – Tabular data to enter the values for Gc vs MMB ratio in a tabular. This avoids the need for curve fitting to determine the exponents. However, the working of the algorithm behind this is unclear, hence no attempt was made to validate the damage envelope sing tabular option.
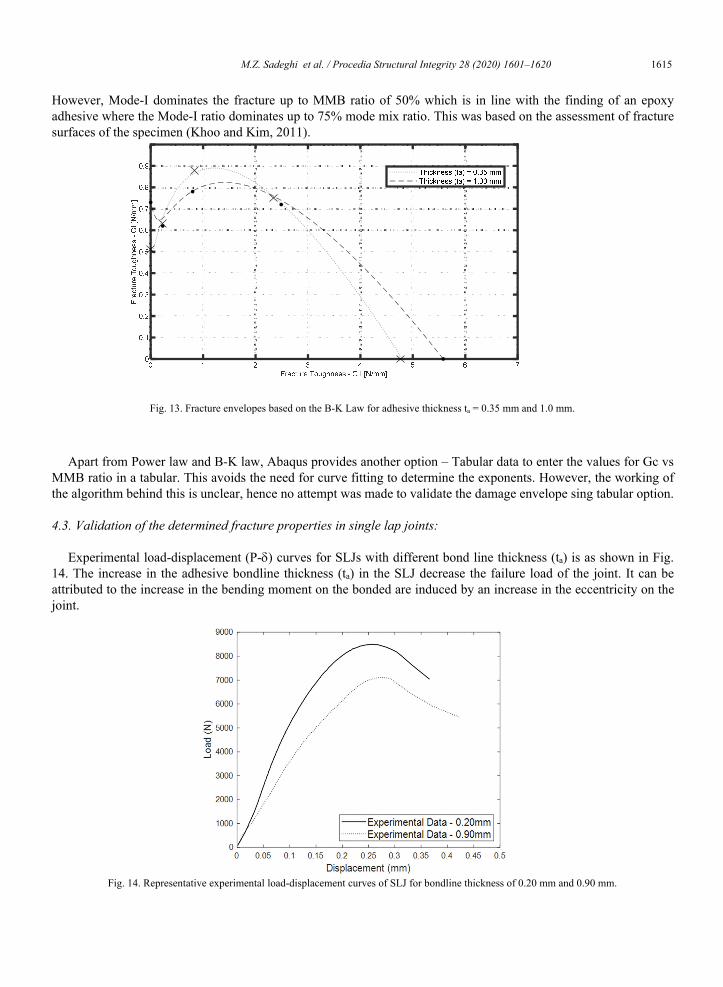
4.3. Validation of the determined fracture properties in single lap joints:
Experimental load-displacement (P-) curves for SLJs with different bond line thickness (ta) is as shown in Fig. 14. The increase in the adhesive bondline thickness (ta) in the SLJ decrease the failure load of the joint. It can be attributed to the increase in the bending moment on the bonded are induced by an increase in the eccentricity on the joint.
Fig. 14. Representative experimental load-displacement curves of SLJ for bondline thickness of 0.20 mm and 0.90 mm.
M.Z. Sadeghi et al. / Procedia Structural Integrity 28 (2020) 1601–1620 1615 M.Z. Sadeghi et al./ Structural Integrity Procedia 00 (2019) 000–000
4.2. Fracture envelope:
Based on the values of Gc obtained for different mode mix ratios and different adhesive thickness (Table 2 and Table 3), the fracture envelope was developed through curve fitting using MATLAB to assess their applicability for Power-law and BK law. For a mode mixity up to 25%, the trend is in line with the estimated Gc value for SLB (Mode mix – 41%) (Santos and Campilho, 2017). This study, however, examines the effect of higher mode mixities > 50% where Gc monotonically increases with the mode mix ratio as shown in Fig. 12. This trend in Gc versus mode mix ratio is similar to the findings in (Balzani et al., 2011; Khoo and Kim, 2011; Sadeghi et al., 2019). However, the same argument cannot be extended to pure Mode -I and Mode -II values where a relationship exists between the plastic zone size’s dependence on adherents constraining effect. Based on the values of GI and GII, for the range of mode mixity tested in the present work, determination of power-law index based on Equation
(1), (assuming =) yielded unrealistic exponents and considering an index of (==1 and 2) yielded large error at high mode mix ratios and thus not presented in this work. It is possible that a curve fit based on Equation (2), would yield a better fit. However, no such attempt was made since this failure envelope model could not be incorporated in Abaqus. Hence a curve fit with B-K law was attempted and was found adequate to characterise the fracture for the range of mode mix ratios tested and have been outlined in the below Fig. 12 and values are outlined in Table 4. The same results were incorporated in the commercial Abaqus FE package.
Fig. 12. Fracture envelopes based on the B-K Law (left) adhesive thickness (ta = 0.35 mm), (right) adhesive thickness (ta = 1.0 mm).
Table 4. Extrapolated values of GIIC and exponent . J – integral ECLM Thickness (mm) GIIC GIIC
0.35 6.10 2.13 4.80 1.80
1.00 6.10 2.63 5.58 2.55
For same adhesive – Araldite 2015, the extrapolated values of GIIC (Table 4) is in good agreement with the few previously published results GIIC = 4.70 N/mm (Nunes et al., 2019), (Campilho et al., 2009) and deviate from GIIC = 2.958 N/mm (Santos and Campilho, 2017) and GIIC = 2.96 N/mm (Azevedo et al., 2015). However, in the latter work, it has been stated that the value of GIIC = 2.96 N/mm is inaccurate with a negative deviation from the actual value. A possibility of such a discrepancy can be attributed to the data reduction scheme that is considered while estimation of GII component. From the below Fig. 13, it is evident that fracture toughness in Mode – I, GIC would not represent the absolute maximum. This is attributed to the presence of mode-II component at higher mode mix ratios. This alters the nature of crack propagation by mode-I component in terms of surface energy and energy dissipation – as the plastic regime extends over a wide region. Hence a non-linearity with mode-interaction could be expected. (Bui, 2011).
Frac
ture
Tou
ghne
ss [N
/mm
]
Frac
ture
Tou
ghne
ss [N
/mm
]
M.Z. Sadeghi et al./ Structural Integrity Procedia 00 (2019) 000–000
However, Mode-I dominates the fracture up to MMB ratio of 50% which is in line with the finding of an epoxy adhesive where the Mode-I ratio dominates up to 75% mode mix ratio. This was based on the assessment of fracture surfaces of the specimen (Khoo and Kim, 2011).
Fig. 13. Fracture envelopes based on the B-K Law for adhesive thickness ta = 0.35 mm and 1.0 mm.
Apart from Power law and B-K law, Abaqus provides another option – Tabular data to enter the values for Gc vs MMB ratio in a tabular. This avoids the need for curve fitting to determine the exponents. However, the working of the algorithm behind this is unclear, hence no attempt was made to validate the damage envelope sing tabular option.
4.3. Validation of the determined fracture properties in single lap joints:
Experimental load-displacement (P-) curves for SLJs with different bond line thickness (ta) is as shown in Fig. 14. The increase in the adhesive bondline thickness (ta) in the SLJ decrease the failure load of the joint. It can be attributed to the increase in the bending moment on the bonded are induced by an increase in the eccentricity on the joint.
Fig. 14. Representative experimental load-displacement curves of SLJ for bondline thickness of 0.20 mm and 0.90 mm.
1616 M.Z. Sadeghi et al. / Procedia Structural Integrity 28 (2020) 1601–1620 M.Z. Sadeghi et al./ Structural Integrity Procedia 00 (2019) 000–000
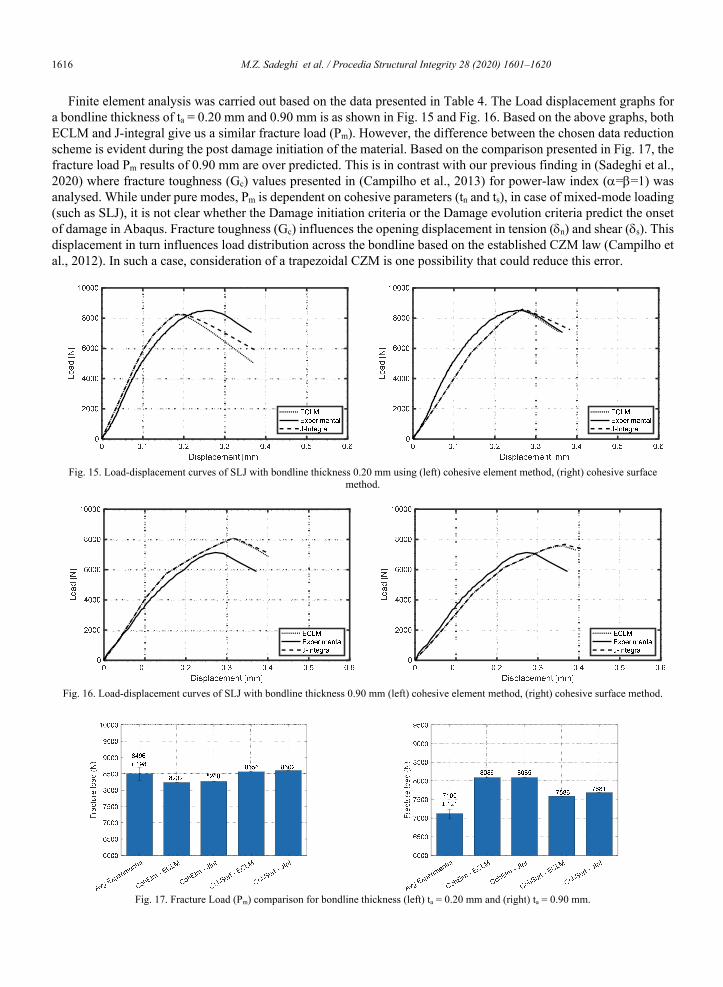
Finite element analysis was carried out based on the data presented in Table 4. The Load displacement graphs for a bondline thickness of ta = 0.20 mm and 0.90 mm is as shown in Fig. 15 and Fig. 16. Based on the above graphs, both ECLM and J-integral give us a similar fracture load (Pm). However, the difference between the chosen data reduction scheme is evident during the post damage initiation of the material. Based on the comparison presented in Fig. 17, the fracture load Pm results of 0.90 mm are over predicted. This is in contrast with our previous finding in (Sadeghi et al., 2020) where fracture toughness (Gc) values presented in (Campilho et al., 2013) for power-law index (==1) was analysed. While under pure modes, Pm is dependent on cohesive parameters (tn and ts), in case of mixed-mode loading (such as SLJ), it is not clear whether the Damage initiation criteria or the Damage evolution criteria predict the onset of damage in Abaqus. Fracture toughness (Gc) influences the opening displacement in tension (n) and shear (s). This displacement in turn influences load distribution across the bondline based on the established CZM law (Campilho et al., 2012). In such a case, consideration of a trapezoidal CZM is one possibility that could reduce this error.
Fig. 15. Load-displacement curves of SLJ with bondline thickness 0.20 mm using (left) cohesive element method, (right) cohesive surface method.
Fig. 16. Load-displacement curves of SLJ with bondline thickness 0.90 mm (left) cohesive element method, (right) cohesive surface method.
Fig. 17. Fracture Load (Pm) comparison for bondline thickness (left) ta = 0.20 mm and (right) ta = 0.90 mm.
M.Z. Sadeghi et al./ Structural Integrity Procedia 00 (2019) 000–000
Fig. 18. SDEG variable in cohesive elements with a bondline thickness (left) ta = 0.20 mm and (right) ta = 0.90 mm at onset of damage.
In the case presented above, over prediction of GC leads to over prediction of Pm as a function of bondline thickness ta. This is evident from Fig. 18, the distribution of SDEG (Scalar stiffness deformation variable) is more uniform in case of bondline thickness ta equal 0.20 mm. The difference between the experimental and the predicted FE results can be attributed to different reasons which are discussed below:
One possibility this divergence could be attributed to the effect of viscoelastic dissipation present in the adhesive involved in the estimation of J-integral, especially with the increase of mode-II component. Also, the effect of loading rate between the traction values considered in (Campilho et al., 2011b) and the current experiments has to be considered to obtain an accurate depiction of fracture load (Pm) since as the loading rate increases, the value of fracture toughness Gc decreases (Blackman et al., 2009; Cho et al., 2010).
In the current study, GIIC was obtained through extrapolation of mixed-mode data based on B.K law. Direct determination of GIIC using ENF or any other pure mode II tests could result in lower values and combination with other mixed-mode ratios could produce a lower value of B-K law index. Such considerations might influence the FE prediction of fracture load (Pm).
Another reason could be attributed to applicability the B-K law, describing the interaction between the determined GC for different mixed-mode ratios over predicts the failure load. Other parameters (such as tn and ts) also should be investigated for the adhesive to get a better understanding about the corresponding traction values for different mixed-mode ratios and the shape of the CZM model (as in the current model bi-linear CZM was used).
In terms of the accuracy of the results, the selection of the data reduction method would not impact fracture toughness - GIC. Estimation of GIIC is impacted by the data reduction methods. This is further substantiated from a study where six different data reduction methods were used and a good degree of accuracy was obtained (Santos and Campilho, 2017).
To investigate the applicability of determined GIC and GIIC for particular adhesive thickness, in a SLJ with different adhesive layer thickness, two different models namely Model I (ta = 0.35 mm) and Modell II (ta=1.0mm) were considered. In other words, the determined values of GIC and GIIC for ta of 0.35 mm and 1.0 mm were considered for SLJ based on ta of 0.2 and 0.9 mm respectively.
FE load-displacement (P-) curves for the SLJs with adhesive thickness of 0.2 and 0.9 mm thickness are shown in Fig. 19. For the SLJ with ta of 0.2 mm, the implementation of determined fracture properties of Model I and Model II in both cohesive element and surface-based cohesive approaches gave similar results in comparison to that of representative experimental result.
For the SLJ with an adhesive thickness of 0.9 mm, the results are a bit different. Both model I and II resulted in the same predicted fracture load for the joint in the surface-based cohesive approach (nearly 7400 N). The predicted load-displacement curve shows smaller stiffness with respect to the experimental curve. For the cohesive elements, Model I and II predicted the failure load about 7965 N and 7600 N respectively (i.e. 12 and 7% increase in comparison to the experimental result).
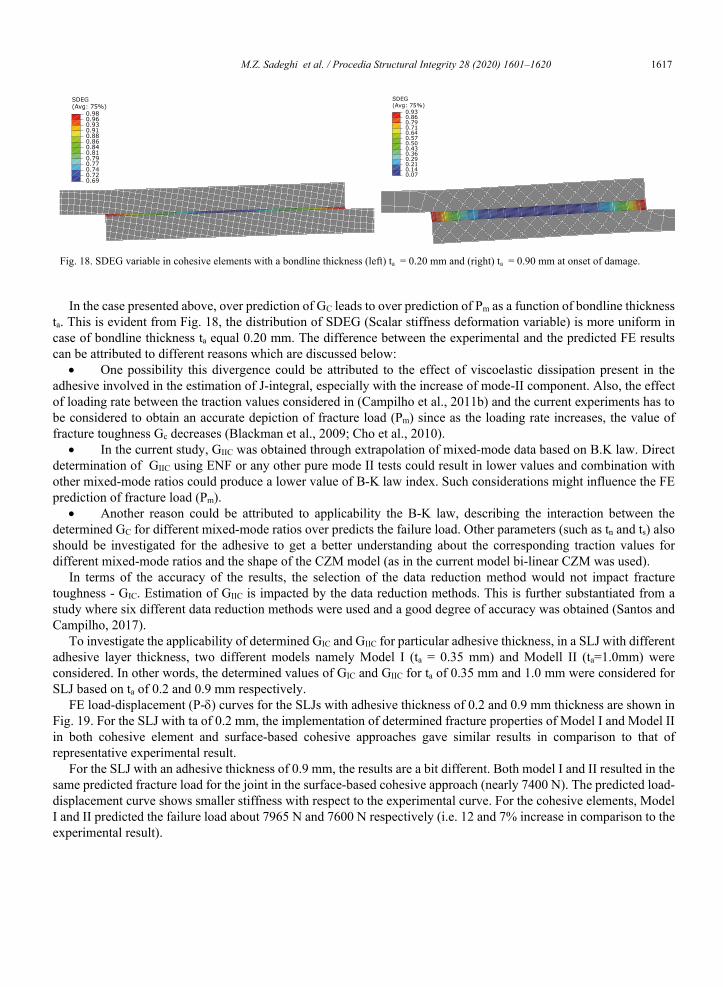
M.Z. Sadeghi et al. / Procedia Structural Integrity 28 (2020) 1601–1620 1617 M.Z. Sadeghi et al./ Structural Integrity Procedia 00 (2019) 000–000
Finite element analysis was carried out based on the data presented in Table 4. The Load displacement graphs for a bondline thickness of ta = 0.20 mm and 0.90 mm is as shown in Fig. 15 and Fig. 16. Based on the above graphs, both ECLM and J-integral give us a similar fracture load (Pm). However, the difference between the chosen data reduction scheme is evident during the post damage initiation of the material. Based on the comparison presented in Fig. 17, the fracture load Pm results of 0.90 mm are over predicted. This is in contrast with our previous finding in (Sadeghi et al., 2020) where fracture toughness (Gc) values presented in (Campilho et al., 2013) for power-law index (==1) was analysed. While under pure modes, Pm is dependent on cohesive parameters (tn and ts), in case of mixed-mode loading (such as SLJ), it is not clear whether the Damage initiation criteria or the Damage evolution criteria predict the onset of damage in Abaqus. Fracture toughness (Gc) influences the opening displacement in tension (n) and shear (s). This displacement in turn influences load distribution across the bondline based on the established CZM law (Campilho et al., 2012). In such a case, consideration of a trapezoidal CZM is one possibility that could reduce this error.
Fig. 15. Load-displacement curves of SLJ with bondline thickness 0.20 mm using (left) cohesive element method, (right) cohesive surface method.
Fig. 16. Load-displacement curves of SLJ with bondline thickness 0.90 mm (left) cohesive element method, (right) cohesive surface method.
Fig. 17. Fracture Load (Pm) comparison for bondline thickness (left) ta = 0.20 mm and (right) ta = 0.90 mm.
M.Z. Sadeghi et al./ Structural Integrity Procedia 00 (2019) 000–000
Fig. 18. SDEG variable in cohesive elements with a bondline thickness (left) ta = 0.20 mm and (right) ta = 0.90 mm at onset of damage.
In the case presented above, over prediction of GC leads to over prediction of Pm as a function of bondline thickness ta. This is evident from Fig. 18, the distribution of SDEG (Scalar stiffness deformation variable) is more uniform in case of bondline thickness ta equal 0.20 mm. The difference between the experimental and the predicted FE results can be attributed to different reasons which are discussed below:
One possibility this divergence could be attributed to the effect of viscoelastic dissipation present in the adhesive involved in the estimation of J-integral, especially with the increase of mode-II component. Also, the effect of loading rate between the traction values considered in (Campilho et al., 2011b) and the current experiments has to be considered to obtain an accurate depiction of fracture load (Pm) since as the loading rate increases, the value of fracture toughness Gc decreases (Blackman et al., 2009; Cho et al., 2010).
In the current study, GIIC was obtained through extrapolation of mixed-mode data based on B.K law. Direct determination of GIIC using ENF or any other pure mode II tests could result in lower values and combination with other mixed-mode ratios could produce a lower value of B-K law index. Such considerations might influence the FE prediction of fracture load (Pm).
Another reason could be attributed to applicability the B-K law, describing the interaction between the determined GC for different mixed-mode ratios over predicts the failure load. Other parameters (such as tn and ts) also should be investigated for the adhesive to get a better understanding about the corresponding traction values for different mixed-mode ratios and the shape of the CZM model (as in the current model bi-linear CZM was used).
In terms of the accuracy of the results, the selection of the data reduction method would not impact fracture toughness - GIC. Estimation of GIIC is impacted by the data reduction methods. This is further substantiated from a study where six different data reduction methods were used and a good degree of accuracy was obtained (Santos and Campilho, 2017).
To investigate the applicability of determined GIC and GIIC for particular adhesive thickness, in a SLJ with different adhesive layer thickness, two different models namely Model I (ta = 0.35 mm) and Modell II (ta=1.0mm) were considered. In other words, the determined values of GIC and GIIC for ta of 0.35 mm and 1.0 mm were considered for SLJ based on ta of 0.2 and 0.9 mm respectively.
FE load-displacement (P-) curves for the SLJs with adhesive thickness of 0.2 and 0.9 mm thickness are shown in Fig. 19. For the SLJ with ta of 0.2 mm, the implementation of determined fracture properties of Model I and Model II in both cohesive element and surface-based cohesive approaches gave similar results in comparison to that of representative experimental result.
For the SLJ with an adhesive thickness of 0.9 mm, the results are a bit different. Both model I and II resulted in the same predicted fracture load for the joint in the surface-based cohesive approach (nearly 7400 N). The predicted load-displacement curve shows smaller stiffness with respect to the experimental curve. For the cohesive elements, Model I and II predicted the failure load about 7965 N and 7600 N respectively (i.e. 12 and 7% increase in comparison to the experimental result).
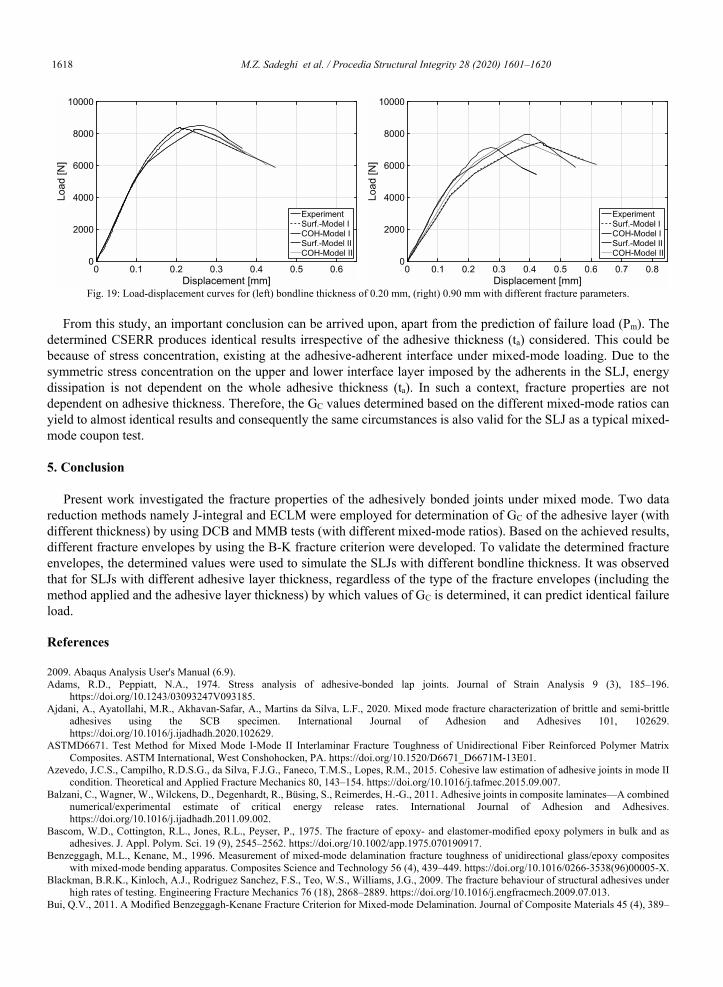
1618 M.Z. Sadeghi et al. / Procedia Structural Integrity 28 (2020) 1601–1620 M.Z. Sadeghi et al./ Structural Integrity Procedia 00 (2019) 000–000
Fig. 19: Load-displacement curves for (left) bondline thickness of 0.20 mm, (right) 0.90 mm with different fracture parameters. From this study, an important conclusion can be arrived upon, apart from the prediction of failure load (Pm). The
determined CSERR produces identical results irrespective of the adhesive thickness (ta) considered. This could be because of stress concentration, existing at the adhesive-adherent interface under mixed-mode loading. Due to the symmetric stress concentration on the upper and lower interface layer imposed by the adherents in the SLJ, energy dissipation is not dependent on the whole adhesive thickness (ta). In such a context, fracture properties are not dependent on adhesive thickness. Therefore, the GC values determined based on the different mixed-mode ratios can yield to almost identical results and consequently the same circumstances is also valid for the SLJ as a typical mixed-mode coupon test.
5. Conclusion
Present work investigated the fracture properties of the adhesively bonded joints under mixed mode. Two data reduction methods namely J-integral and ECLM were employed for determination of GC of the adhesive layer (with different thickness) by using DCB and MMB tests (with different mixed-mode ratios). Based on the achieved results, different fracture envelopes by using the B-K fracture criterion were developed. To validate the determined fracture envelopes, the determined values were used to simulate the SLJs with different bondline thickness. It was observed that for SLJs with different adhesive layer thickness, regardless of the type of the fracture envelopes (including the method applied and the adhesive layer thickness) by which values of GC is determined, it can predict identical failure load. References 2009. Abaqus Analysis User's Manual (6.9). Adams, R.D., Peppiatt, N.A., 1974. Stress analysis of adhesive-bonded lap joints. Journal of Strain Analysis 9 (3), 185–196.
https://doi.org/10.1243/03093247V093185. Ajdani, A., Ayatollahi, M.R., Akhavan-Safar, A., Martins da Silva, L.F., 2020. Mixed mode fracture characterization of brittle and semi-brittle
adhesives using the SCB specimen. International Journal of Adhesion and Adhesives 101, 102629. https://doi.org/10.1016/j.ijadhadh.2020.102629.
ASTMD6671. Test Method for Mixed Mode I-Mode II Interlaminar Fracture Toughness of Unidirectional Fiber Reinforced Polymer Matrix Composites. ASTM International, West Conshohocken, PA. https://doi.org/10.1520/D6671_D6671M-13E01.
Azevedo, J.C.S., Campilho, R.D.S.G., da Silva, F.J.G., Faneco, T.M.S., Lopes, R.M., 2015. Cohesive law estimation of adhesive joints in mode II condition. Theoretical and Applied Fracture Mechanics 80, 143–154. https://doi.org/10.1016/j.tafmec.2015.09.007.
Balzani, C., Wagner, W., Wilckens, D., Degenhardt, R., Büsing, S., Reimerdes, H.-G., 2011. Adhesive joints in composite laminates—A combined numerical/experimental estimate of critical energy release rates. International Journal of Adhesion and Adhesives. https://doi.org/10.1016/j.ijadhadh.2011.09.002.
Bascom, W.D., Cottington, R.L., Jones, R.L., Peyser, P., 1975. The fracture of epoxy- and elastomer-modified epoxy polymers in bulk and as adhesives. J. Appl. Polym. Sci. 19 (9), 2545–2562. https://doi.org/10.1002/app.1975.070190917.
Benzeggagh, M.L., Kenane, M., 1996. Measurement of mixed-mode delamination fracture toughness of unidirectional glass/epoxy composites with mixed-mode bending apparatus. Composites Science and Technology 56 (4), 439–449. https://doi.org/10.1016/0266-3538(96)00005-X.
Blackman, B.R.K., Kinloch, A.J., Rodriguez Sanchez, F.S., Teo, W.S., Williams, J.G., 2009. The fracture behaviour of structural adhesives under high rates of testing. Engineering Fracture Mechanics 76 (18), 2868–2889. https://doi.org/10.1016/j.engfracmech.2009.07.013.
Bui, Q.V., 2011. A Modified Benzeggagh-Kenane Fracture Criterion for Mixed-mode Delamination. Journal of Composite Materials 45 (4), 389–
M.Z. Sadeghi et al./ Structural Integrity Procedia 00 (2019) 000–000
413. https://doi.org/10.1177/0021998310376105. Campilho, R.D.S.G., Banea, M.D., Neto, J.A.B.P., da Silva, L.F.M., 2012. Modelling of Single-Lap Joints Using Cohesive Zone Models: Effect of
the Cohesive Parameters on the Output of the Simulations. The Journal of Adhesion 88 (4-6), 513–533. https://doi.org/10.1080/00218464.2012.660834.
Campilho, R.D.S.G., Banea, M.D., Neto, J.A.B.P., da Silva, L.F.M., 2013. Modelling adhesive joints with cohesive zone models: effect of the cohesive law shape of the adhesive layer. International Journal of Adhesion and Adhesives 44, 48–56. https://doi.org/10.1016/j.ijadhadh.2013.02.006.
Campilho, R.D.S.G., Banea, M.D., Pinto, A.M.G., da Silva, L.F.M., Jesus, A.M.P. de, 2011a. Strength prediction of single- and double-lap joints by standard and extended finite element modelling. International Journal of Adhesion and Adhesives 31 (5), 363–372. https://doi.org/10.1016/j.ijadhadh.2010.09.008.
Campilho, R.D.S.G., Moura, M.F.S.F. de, Ramantani, D.A., Morais, J.J.L., Domingues, J.J.M.S., 2009. Buckling Behaviour of Carbon–Epoxy Adhesively-Bonded Scarf Repairs. Journal of Adhesion Science and Technology 23 (10-11), 1493–1513. https://doi.org/10.1163/156856109X433045.
Campilho, R.D.S.G., Pinto, A.M.G., Banea, M.D., Silva, R.F., da Silva, L.F.M., 2011b. Strength Improvement of Adhesively-Bonded Joints Using a Reverse-Bent Geometry. Journal of Adhesion Science and Technology 25 (18), 2351–2368. https://doi.org/10.1163/016942411X580081.
Carlberger, T., Stigh, U., 2010. Influence of Layer Thickness on Cohesive Properties of an Epoxy-Based Adhesive—An Experimental Study. The Journal of Adhesion 86 (8), 816–835. https://doi.org/10.1080/00218464.2010.498718.
Cho, J.-U., Kinloch, A., Blackman, B., Rodriguez, S., Cho, C.-D., Lee, S.-K., 2010. Fracture behaviour of adhesively-bonded composite materials under impact loading. Int. J. Precis. Eng. Manuf. 11 (1), 89–95. https://doi.org/10.1007/s12541-010-0011-6.
da Silva, L.F.M., Carbas, R.J.C., Critchlow, G.W., Figueiredo, M.A.V., Brown, K., 2009. Effect of material, geometry, surface treatment and environment on the shear strength of single lap joints. International Journal of Adhesion and Adhesives 29 (6), 621–632. https://doi.org/10.1016/j.ijadhadh.2009.02.012.
da Silva, L.F.M., Magalhães, F.A.C.R.G. de, Chaves, F.J.P., Moura, M.F.S.F. de, 2010. Mode II Fracture Toughness of a Brittle and a Ductile Adhesive as a Function of the Adhesive Thickness. The Journal of Adhesion 86 (9), 891–905. https://doi.org/10.1080/00218464.2010.506155.
Desai, C.K., Basu, S., Parameswaran, V., 2016. Determination of Traction Separation Law for Interfacial Failure in Adhesive Joints at Different Loading Rates. The Journal of Adhesion 92 (10), 819–839. https://doi.org/10.1080/00218464.2015.1046986.
Ducept, F., Davies, P., Gamby, D., 2000. Mixed mode failure criteria for a glass/epoxy composite and an adhesively bonded composite/composite joint. International Journal of Adhesion and Adhesives 20 (3), 233–244. https://doi.org/10.1016/S0143-7496(99)00048-2.
Fernandes, T.A.B., Campilho, R.D.S.G., Banea, M.D., da Silva, L.F.M., 2015. Adhesive Selection for Single Lap Bonded Joints: Experimentation and Advanced Techniques for Strength Prediction. The Journal of Adhesion 91 (10-11), 841–862. https://doi.org/10.1080/00218464.2014.994703.
He, X., 2011. A review of finite element analysis of adhesively bonded joints. International Journal of Adhesion and Adhesives 31 (4), 248–264. https://doi.org/10.1016/j.ijadhadh.2011.01.006.
Khoo, T.T., Kim, H., 2011. Effect of Bondline Thickness on Mixed-Mode Fracture of Adhesively Bonded Joints. The Journal of Adhesion 87 (10), 989–1019. https://doi.org/10.1080/00218464.2011.600668.
Khoramishad, H., Crocombe, A.D., Katnam, K.B., Ashcroft, I.A., 2010. Predicting fatigue damage in adhesively bonded joints using a cohesive zone model. International Journal of Fatigue 32 (7), 1146–1158. https://doi.org/10.1016/j.ijfatigue.2009.12.013.
Loureiro, F.J.C.F.B., Campilho, R.D.S.G., Rocha, R.J.B., 2020. J-integral analysis of the mixed-mode fracture behaviour of composite bonded joints. The Journal of Adhesion 96 (1-4), 321–344. https://doi.org/10.1080/00218464.2019.1667776.
Moura, M.F.S.F. de, Gonçalves, J.P.M., Magalhães, A.G., 2012. A straightforward method to obtain the cohesive laws of bonded joints under mode I loading. International Journal of Adhesion and Adhesives 39, 54–59. https://doi.org/10.1016/j.ijadhadh.2012.07.008.
Moura, M.F.S.F. de, Morais, A.B. de, 2008. Equivalent crack based analyses of ENF and ELS tests. Engineering Fracture Mechanics 75 (9), 2584–2596. https://doi.org/10.1016/j.engfracmech.2007.03.005.
Moura, M.F.S.F. de, Morais, J.J.L., Dourado, N., 2008. A new data reduction scheme for mode I wood fracture characterization using the double cantilever beam test. Engineering Fracture Mechanics 75 (13), 3852–3865. https://doi.org/10.1016/j.engfracmech.2008.02.006.
Nunes, F.A.A., Campilho, R.D.S.G., Cardoso, M.G., Silva, F.J.G., 2019. Fracture envelope estimation of a structural adhesive by dedicated fracture tests. Procedia Manufacturing 38, 1252–1259. https://doi.org/10.1016/j.promfg.2020.01.217.
Paris A., Paris P., 1988. Instantaneous evaluation of J and C. Int J Fract 38 (1), 19-21. Reeder, J.R., 2003. Refinements to the Mixed-Mode Bending Test for Delamination Toughness. J. Compos. Technol. Res. 25 (4), 11949.
https://doi.org/10.1520/CTR10961J. Reeder, J.R., Crews, J.H., 1990. Mixed-mode bending method for delamination testing. AIAA Journal 28 (7), 1270–1276.
https://doi.org/10.2514/3.25204. Rice, J.R., 1968. A Path Independent Integral and the Approximate Analysis of Strain Concentration by Notches and Cracks. Journal of Applied
Mechanics 35 (2), 379–386. https://doi.org/10.1115/1.3601206. Ridha, M., Tan, V.B.C., Tay, T.E., 2011. Traction–separation laws for progressive failure of bonded scarf repair of composite panel. Composite
Structures 93 (4), 1239–1245. https://doi.org/10.1016/j.compstruct.2010.10.015. Sadeghi, M.Z., Gabener, A., Zimmermann, J., Saravana, K., Weiland, J., Reisgen, U., Schroeder, K.U., 2020. Failure load prediction of adhesively
bonded single lap joints by using various FEM techniques. International Journal of Adhesion and Adhesives 97, 102493. https://doi.org/10.1016/j.ijadhadh.2019.102493.
Sadeghi, M.Z., Zimmermann, J., Gabener, A., Schröder, K.U., 2019. On the bondline thickness effect in mixed-mode fracture characterisation of an epoxy adhesive. The Journal of Adhesion, 1–23. https://doi.org/10.1080/00218464.2019.1656614.
Santos, M.A.S., Campilho, R.D.S.G., 2017. Mixed-mode fracture analysis of composite bonded joints considering adhesives of different ductility. Int J Fract 207 (1), 55–71. https://doi.org/10.1007/s10704-017-0219-x.
Sarrado, C., Turon, A., Renart, J., Costa, J., 2015. An experimental data reduction method for the Mixed Mode Bending test based on the J-integral approach. Composites Science and Technology 117, 85–91. https://doi.org/10.1016/j.compscitech.2015.05.021.
Silva, L.F.M.d., Öchsner, A., Adams, R.D., 2011. Handbook of adhesion technology. Springer, Berlin.
M.Z. Sadeghi et al. / Procedia Structural Integrity 28 (2020) 1601–1620 1619 M.Z. Sadeghi et al./ Structural Integrity Procedia 00 (2019) 000–000
Fig. 19: Load-displacement curves for (left) bondline thickness of 0.20 mm, (right) 0.90 mm with different fracture parameters. From this study, an important conclusion can be arrived upon, apart from the prediction of failure load (Pm). The
determined CSERR produces identical results irrespective of the adhesive thickness (ta) considered. This could be because of stress concentration, existing at the adhesive-adherent interface under mixed-mode loading. Due to the symmetric stress concentration on the upper and lower interface layer imposed by the adherents in the SLJ, energy dissipation is not dependent on the whole adhesive thickness (ta). In such a context, fracture properties are not dependent on adhesive thickness. Therefore, the GC values determined based on the different mixed-mode ratios can yield to almost identical results and consequently the same circumstances is also valid for the SLJ as a typical mixed-mode coupon test.
5. Conclusion
Present work investigated the fracture properties of the adhesively bonded joints under mixed mode. Two data reduction methods namely J-integral and ECLM were employed for determination of GC of the adhesive layer (with different thickness) by using DCB and MMB tests (with different mixed-mode ratios). Based on the achieved results, different fracture envelopes by using the B-K fracture criterion were developed. To validate the determined fracture envelopes, the determined values were used to simulate the SLJs with different bondline thickness. It was observed that for SLJs with different adhesive layer thickness, regardless of the type of the fracture envelopes (including the method applied and the adhesive layer thickness) by which values of GC is determined, it can predict identical failure load. References 2009. Abaqus Analysis User's Manual (6.9). Adams, R.D., Peppiatt, N.A., 1974. Stress analysis of adhesive-bonded lap joints. Journal of Strain Analysis 9 (3), 185–196.
https://doi.org/10.1243/03093247V093185. Ajdani, A., Ayatollahi, M.R., Akhavan-Safar, A., Martins da Silva, L.F., 2020. Mixed mode fracture characterization of brittle and semi-brittle
adhesives using the SCB specimen. International Journal of Adhesion and Adhesives 101, 102629. https://doi.org/10.1016/j.ijadhadh.2020.102629.
ASTMD6671. Test Method for Mixed Mode I-Mode II Interlaminar Fracture Toughness of Unidirectional Fiber Reinforced Polymer Matrix Composites. ASTM International, West Conshohocken, PA. https://doi.org/10.1520/D6671_D6671M-13E01.
Azevedo, J.C.S., Campilho, R.D.S.G., da Silva, F.J.G., Faneco, T.M.S., Lopes, R.M., 2015. Cohesive law estimation of adhesive joints in mode II condition. Theoretical and Applied Fracture Mechanics 80, 143–154. https://doi.org/10.1016/j.tafmec.2015.09.007.
Balzani, C., Wagner, W., Wilckens, D., Degenhardt, R., Büsing, S., Reimerdes, H.-G., 2011. Adhesive joints in composite laminates—A combined numerical/experimental estimate of critical energy release rates. International Journal of Adhesion and Adhesives. https://doi.org/10.1016/j.ijadhadh.2011.09.002.
Bascom, W.D., Cottington, R.L., Jones, R.L., Peyser, P., 1975. The fracture of epoxy- and elastomer-modified epoxy polymers in bulk and as adhesives. J. Appl. Polym. Sci. 19 (9), 2545–2562. https://doi.org/10.1002/app.1975.070190917.
Benzeggagh, M.L., Kenane, M., 1996. Measurement of mixed-mode delamination fracture toughness of unidirectional glass/epoxy composites with mixed-mode bending apparatus. Composites Science and Technology 56 (4), 439–449. https://doi.org/10.1016/0266-3538(96)00005-X.
Blackman, B.R.K., Kinloch, A.J., Rodriguez Sanchez, F.S., Teo, W.S., Williams, J.G., 2009. The fracture behaviour of structural adhesives under high rates of testing. Engineering Fracture Mechanics 76 (18), 2868–2889. https://doi.org/10.1016/j.engfracmech.2009.07.013.
Bui, Q.V., 2011. A Modified Benzeggagh-Kenane Fracture Criterion for Mixed-mode Delamination. Journal of Composite Materials 45 (4), 389–
M.Z. Sadeghi et al./ Structural Integrity Procedia 00 (2019) 000–000
413. https://doi.org/10.1177/0021998310376105. Campilho, R.D.S.G., Banea, M.D., Neto, J.A.B.P., da Silva, L.F.M., 2012. Modelling of Single-Lap Joints Using Cohesive Zone Models: Effect of
the Cohesive Parameters on the Output of the Simulations. The Journal of Adhesion 88 (4-6), 513–533. https://doi.org/10.1080/00218464.2012.660834.
Campilho, R.D.S.G., Banea, M.D., Neto, J.A.B.P., da Silva, L.F.M., 2013. Modelling adhesive joints with cohesive zone models: effect of the cohesive law shape of the adhesive layer. International Journal of Adhesion and Adhesives 44, 48–56. https://doi.org/10.1016/j.ijadhadh.2013.02.006.
Campilho, R.D.S.G., Banea, M.D., Pinto, A.M.G., da Silva, L.F.M., Jesus, A.M.P. de, 2011a. Strength prediction of single- and double-lap joints by standard and extended finite element modelling. International Journal of Adhesion and Adhesives 31 (5), 363–372. https://doi.org/10.1016/j.ijadhadh.2010.09.008.
Campilho, R.D.S.G., Moura, M.F.S.F. de, Ramantani, D.A., Morais, J.J.L., Domingues, J.J.M.S., 2009. Buckling Behaviour of Carbon–Epoxy Adhesively-Bonded Scarf Repairs. Journal of Adhesion Science and Technology 23 (10-11), 1493–1513. https://doi.org/10.1163/156856109X433045.
Campilho, R.D.S.G., Pinto, A.M.G., Banea, M.D., Silva, R.F., da Silva, L.F.M., 2011b. Strength Improvement of Adhesively-Bonded Joints Using a Reverse-Bent Geometry. Journal of Adhesion Science and Technology 25 (18), 2351–2368. https://doi.org/10.1163/016942411X580081.
Carlberger, T., Stigh, U., 2010. Influence of Layer Thickness on Cohesive Properties of an Epoxy-Based Adhesive—An Experimental Study. The Journal of Adhesion 86 (8), 816–835. https://doi.org/10.1080/00218464.2010.498718.
Cho, J.-U., Kinloch, A., Blackman, B., Rodriguez, S., Cho, C.-D., Lee, S.-K., 2010. Fracture behaviour of adhesively-bonded composite materials under impact loading. Int. J. Precis. Eng. Manuf. 11 (1), 89–95. https://doi.org/10.1007/s12541-010-0011-6.
da Silva, L.F.M., Carbas, R.J.C., Critchlow, G.W., Figueiredo, M.A.V., Brown, K., 2009. Effect of material, geometry, surface treatment and environment on the shear strength of single lap joints. International Journal of Adhesion and Adhesives 29 (6), 621–632. https://doi.org/10.1016/j.ijadhadh.2009.02.012.
da Silva, L.F.M., Magalhães, F.A.C.R.G. de, Chaves, F.J.P., Moura, M.F.S.F. de, 2010. Mode II Fracture Toughness of a Brittle and a Ductile Adhesive as a Function of the Adhesive Thickness. The Journal of Adhesion 86 (9), 891–905. https://doi.org/10.1080/00218464.2010.506155.
Desai, C.K., Basu, S., Parameswaran, V., 2016. Determination of Traction Separation Law for Interfacial Failure in Adhesive Joints at Different Loading Rates. The Journal of Adhesion 92 (10), 819–839. https://doi.org/10.1080/00218464.2015.1046986.
Ducept, F., Davies, P., Gamby, D., 2000. Mixed mode failure criteria for a glass/epoxy composite and an adhesively bonded composite/composite joint. International Journal of Adhesion and Adhesives 20 (3), 233–244. https://doi.org/10.1016/S0143-7496(99)00048-2.
Fernandes, T.A.B., Campilho, R.D.S.G., Banea, M.D., da Silva, L.F.M., 2015. Adhesive Selection for Single Lap Bonded Joints: Experimentation and Advanced Techniques for Strength Prediction. The Journal of Adhesion 91 (10-11), 841–862. https://doi.org/10.1080/00218464.2014.994703.
He, X., 2011. A review of finite element analysis of adhesively bonded joints. International Journal of Adhesion and Adhesives 31 (4), 248–264. https://doi.org/10.1016/j.ijadhadh.2011.01.006.
Khoo, T.T., Kim, H., 2011. Effect of Bondline Thickness on Mixed-Mode Fracture of Adhesively Bonded Joints. The Journal of Adhesion 87 (10), 989–1019. https://doi.org/10.1080/00218464.2011.600668.
Khoramishad, H., Crocombe, A.D., Katnam, K.B., Ashcroft, I.A., 2010. Predicting fatigue damage in adhesively bonded joints using a cohesive zone model. International Journal of Fatigue 32 (7), 1146–1158. https://doi.org/10.1016/j.ijfatigue.2009.12.013.
Loureiro, F.J.C.F.B., Campilho, R.D.S.G., Rocha, R.J.B., 2020. J-integral analysis of the mixed-mode fracture behaviour of composite bonded joints. The Journal of Adhesion 96 (1-4), 321–344. https://doi.org/10.1080/00218464.2019.1667776.
Moura, M.F.S.F. de, Gonçalves, J.P.M., Magalhães, A.G., 2012. A straightforward method to obtain the cohesive laws of bonded joints under mode I loading. International Journal of Adhesion and Adhesives 39, 54–59. https://doi.org/10.1016/j.ijadhadh.2012.07.008.
Moura, M.F.S.F. de, Morais, A.B. de, 2008. Equivalent crack based analyses of ENF and ELS tests. Engineering Fracture Mechanics 75 (9), 2584–2596. https://doi.org/10.1016/j.engfracmech.2007.03.005.
Moura, M.F.S.F. de, Morais, J.J.L., Dourado, N., 2008. A new data reduction scheme for mode I wood fracture characterization using the double cantilever beam test. Engineering Fracture Mechanics 75 (13), 3852–3865. https://doi.org/10.1016/j.engfracmech.2008.02.006.
Nunes, F.A.A., Campilho, R.D.S.G., Cardoso, M.G., Silva, F.J.G., 2019. Fracture envelope estimation of a structural adhesive by dedicated fracture tests. Procedia Manufacturing 38, 1252–1259. https://doi.org/10.1016/j.promfg.2020.01.217.
Paris A., Paris P., 1988. Instantaneous evaluation of J and C. Int J Fract 38 (1), 19-21. Reeder, J.R., 2003. Refinements to the Mixed-Mode Bending Test for Delamination Toughness. J. Compos. Technol. Res. 25 (4), 11949.
https://doi.org/10.1520/CTR10961J. Reeder, J.R., Crews, J.H., 1990. Mixed-mode bending method for delamination testing. AIAA Journal 28 (7), 1270–1276.
https://doi.org/10.2514/3.25204. Rice, J.R., 1968. A Path Independent Integral and the Approximate Analysis of Strain Concentration by Notches and Cracks. Journal of Applied
Mechanics 35 (2), 379–386. https://doi.org/10.1115/1.3601206. Ridha, M., Tan, V.B.C., Tay, T.E., 2011. Traction–separation laws for progressive failure of bonded scarf repair of composite panel. Composite
Structures 93 (4), 1239–1245. https://doi.org/10.1016/j.compstruct.2010.10.015. Sadeghi, M.Z., Gabener, A., Zimmermann, J., Saravana, K., Weiland, J., Reisgen, U., Schroeder, K.U., 2020. Failure load prediction of adhesively
bonded single lap joints by using various FEM techniques. International Journal of Adhesion and Adhesives 97, 102493. https://doi.org/10.1016/j.ijadhadh.2019.102493.
Sadeghi, M.Z., Zimmermann, J., Gabener, A., Schröder, K.U., 2019. On the bondline thickness effect in mixed-mode fracture characterisation of an epoxy adhesive. The Journal of Adhesion, 1–23. https://doi.org/10.1080/00218464.2019.1656614.
Santos, M.A.S., Campilho, R.D.S.G., 2017. Mixed-mode fracture analysis of composite bonded joints considering adhesives of different ductility. Int J Fract 207 (1), 55–71. https://doi.org/10.1007/s10704-017-0219-x.
Sarrado, C., Turon, A., Renart, J., Costa, J., 2015. An experimental data reduction method for the Mixed Mode Bending test based on the J-integral approach. Composites Science and Technology 117, 85–91. https://doi.org/10.1016/j.compscitech.2015.05.021.
Silva, L.F.M.d., Öchsner, A., Adams, R.D., 2011. Handbook of adhesion technology. Springer, Berlin.

1620 M.Z. Sadeghi et al. / Procedia Structural Integrity 28 (2020) 1601–1620 M.Z. Sadeghi et al./ Structural Integrity Procedia 00 (2019) 000–000
Stamoulis, G., Carrere, N., Cognard, J.Y., Davies, P., Badulescu, C., 2014. On the experimental mixed-mode failure of adhesively bonded metallic joints. International Journal of Adhesion and Adhesives 51, 148–158. https://doi.org/10.1016/j.ijadhadh.2014.03.002.
Williams, J.G., 1989. End corrections for orthotropic DCB specimens. Composites Science and Technology 35 (4), 367–376. https://doi.org/10.1016/0266-3538(89)90058-4.
Zhao, Y., Seah, L.K., Chai, G.B., 2016. Measurement of interlaminar fracture properties of composites using the J-integral method. Journal of Reinforced Plastics and Composites 35 (14), 1143–1154. https://doi.org/10.1177/0731684416642031.
Zou, G.P., Shahin, K., Taheri, F., 2004. An analytical solution for the analysis of symmetric composite adhesively bonded joints. Composite Structures 65 (3-4), 499–510. https://doi.org/10.1016/j.compstruct.2004.01.007.


![Ultrafast Investigations of Transition Metal-Based … · Ultrafast Investigations of Transition Metal-Based Complexes ... 2 (SCN) 2 Fe(II) complexes ... [Fe(bpy)3] 2+ in Acetonitrile](https://img.pdfslide.us/doc/110x75/5b1d6e897f8b9a64508b6e57/ultrafast-investigations-of-transition-metal-based-ultrafast-investigations.jpg)