Embed Size (px)
Citation preview
1
Experiences of Internet Traffic Monitoring
with TstatA. Finamore M. Mellia M. Meo M. M. Munafo D. Rossi
1Politecnico di Torino 2TELECOM ParisTech
email: {[email protected]} email: [email protected]
Abstract—Since the early days of the Internet, network trafficmonitoring has always played a strategic role in understandingand characterize users’ activities. In this paper, we present ourexperience in engineering and deploying Tstat, an open sourcepassive monitoring tool that has been developed in the past tenyears. Started as a scalable tool to continuously monitor packetsthat flow on a link, Tstat has evolved into a complex applicationthat gives to network researchers and operators the possibility toderive extended and complex measurements thanks to advancedtraffic classifiers.
After discussing Tstat capabilities and internal design, wepresent some examples of measurements collected deployingTstat at the edge of several ISP networks in the past years.While other works report a continuous decline of P2P trafficwith Streaming and File Hosting services rapidly increasing inpopularity, the results presented in this paper picture a differentscenario. First, P2P decline has stopped and in the last monthsof 2010 there is a counter tendency to increase P2P traffic overUDP, so that the common belief that UDP traffic is negligibleis not true anymore. Furthermore, Streaming and File Hostingapplications have either stabilized or are decreasing their trafficshare. We then discuss the scalability issues that software basedtools have to cope with when deployed in real networks, showingthe importance of properly identifying bottlenecks.
I. INTRODUCTION
Since the early days of the Internet, network traffic moni-
toring has always played a strategic role in understanding and
characterize users’ activities. Nowadays, with the increased
complexity of the Internet infrastructure, the applications and
the services, this role has become more crucial than ever. Over
the years, a number of methodologies and tools have been
engineered to assist the daily routines of traffic monitoring
and diagnosis and to understand the network performance and
users’ behavior [1].
To analyze a system, researchers can follow experimental
science principles and devise controlled experiments to induce
and measure cause-effect relationships, or, observational sci-
ence principles and to study the unperturbed system. In the
specific field of network traffic measurement, the above two
disciplines are referred to as active and passive measurements,
respectively. The active approach aims at interfering with the
network to induce a measurable effect, which is the goal of the
measurement itself. Active approaches generate traffic, e.g, by
injecting specifically crafted probe packets or alter the network
state, e.g., by enforcing artificial packet loss. A number of
This work has been supported by the European Commission through NAPA-WINE Project (Network-Aware P2P-TV Application over Wise Network), ICTCall 1 FP7-ICT-2007-1.
Internet monitoring tools are based on active probing, ranging
from simple operation management or network tomography
via ping or traceroute, to more complex delay and capac-
ity estimation via capprobe or pathchar. Finally, large and
controlled testbeds can be easily setup using tools like netem
or dummynet. For the passive approach pure observations are
performed by means of dedicated tools, named sniffers by
the Internet metrology community, that simply observe and
analyze the traffic that flows on links. Several passive mea-
surement tools are available. Some tools, such as tcpdump or
Wireshark, are designed to let researchers interactively analyze
the captured packets. Other tools are instead automated, so that
the human interaction is minimized; examples are the flow-
level monitoring tool NetFlow, intrusion detection system like
Snort or Bro, and the traffic classification tool CoralReef. A
comprehensive list of both active and passive tools can be
found in [1].
Tstat is an example of automated tool for passive mon-
itoring. It has been developed by the networking research
group at Politecnico di Torino since 2000 [2]. Tstat offers
live and scalable traffic monitoring up to Gb/s using off-the-
shelf hardware. It implements traffic classification capabilities,
including advanced behavioral classifiers [3], while offering
at the same time performance characterization capabilities of
both network usage and users’ activities [4]. After more than
ten years of development, Tstat has become a versatile and
scalable application, used by several researchers and network
operators worldwide. In this paper, we report our experience
with Tstat development and use. We illustrate as a case study
the traffic evolution as observed during the last year at different
vantage points in Europe, and discuss some issues about the
feasibility of Internet traffic monitoring with common PCs that
can help researchers to avoid common pitfalls that we have
faced in the past.
II. TSTAT OVERVIEW
Tstat started as evolution of tcptrace[5], which was devel-
oped to track and analyze individual TCP flows, offering de-
tailed statistics. Tstat initial design objective was to automate
the collection of TCP statistics of traffic aggregate, adding
real time traffic monitoring features. Over the years, Tstat
evolved into a more complex tool offering rich statistics and
functionalities. Developed in ANSI C for efficiency purposes,
Tstat is today an Open Source tool that allows sophisticated
multi-Gigabit per second traffic analysis to be run live us-
ing common hardware. Tstat design is highly flexible, with
2
Network tomonitor
(a)
TCP/UDP
Behavioural
FSM DPI
Pure DPI
L7
L4
IPL3
(b)
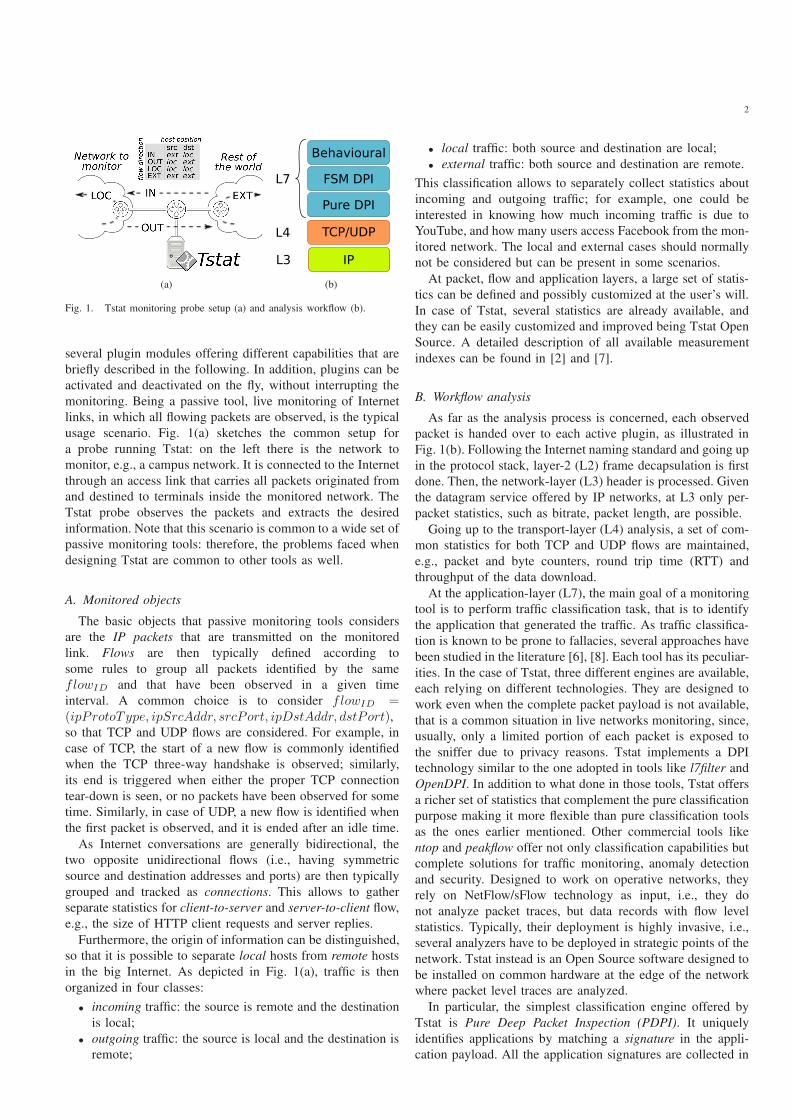
Fig. 1. Tstat monitoring probe setup (a) and analysis workflow (b).
several plugin modules offering different capabilities that are
briefly described in the following. In addition, plugins can be
activated and deactivated on the fly, without interrupting the
monitoring. Being a passive tool, live monitoring of Internet
links, in which all flowing packets are observed, is the typical
usage scenario. Fig. 1(a) sketches the common setup for
a probe running Tstat: on the left there is the network to
monitor, e.g., a campus network. It is connected to the Internet
through an access link that carries all packets originated from
and destined to terminals inside the monitored network. The
Tstat probe observes the packets and extracts the desired
information. Note that this scenario is common to a wide set of
passive monitoring tools: therefore, the problems faced when
designing Tstat are common to other tools as well.
A. Monitored objects
The basic objects that passive monitoring tools considers
are the IP packets that are transmitted on the monitored
link. Flows are then typically defined according to
some rules to group all packets identified by the same
flowID and that have been observed in a given time
interval. A common choice is to consider flowID =(ipProtoType, ipSrcAddr, srcPort, ipDstAddr, dstPort),so that TCP and UDP flows are considered. For example, in
case of TCP, the start of a new flow is commonly identified
when the TCP three-way handshake is observed; similarly,
its end is triggered when either the proper TCP connection
tear-down is seen, or no packets have been observed for some
time. Similarly, in case of UDP, a new flow is identified when
the first packet is observed, and it is ended after an idle time.
As Internet conversations are generally bidirectional, the
two opposite unidirectional flows (i.e., having symmetric
source and destination addresses and ports) are then typically
grouped and tracked as connections. This allows to gather
separate statistics for client-to-server and server-to-client flow,
e.g., the size of HTTP client requests and server replies.
Furthermore, the origin of information can be distinguished,
so that it is possible to separate local hosts from remote hosts
in the big Internet. As depicted in Fig. 1(a), traffic is then
organized in four classes:
• incoming traffic: the source is remote and the destination
is local;
• outgoing traffic: the source is local and the destination is
remote;
• local traffic: both source and destination are local;
• external traffic: both source and destination are remote.
This classification allows to separately collect statistics about
incoming and outgoing traffic; for example, one could be
interested in knowing how much incoming traffic is due to
YouTube, and how many users access Facebook from the mon-
itored network. The local and external cases should normally
not be considered but can be present in some scenarios.
At packet, flow and application layers, a large set of statis-
tics can be defined and possibly customized at the user’s will.
In case of Tstat, several statistics are already available, and
they can be easily customized and improved being Tstat Open
Source. A detailed description of all available measurement
indexes can be found in [2] and [7].
B. Workflow analysis
As far as the analysis process is concerned, each observed
packet is handed over to each active plugin, as illustrated in
Fig. 1(b). Following the Internet naming standard and going up
in the protocol stack, layer-2 (L2) frame decapsulation is first
done. Then, the network-layer (L3) header is processed. Given
the datagram service offered by IP networks, at L3 only per-
packet statistics, such as bitrate, packet length, are possible.
Going up to the transport-layer (L4) analysis, a set of com-
mon statistics for both TCP and UDP flows are maintained,
e.g., packet and byte counters, round trip time (RTT) and
throughput of the data download.
At the application-layer (L7), the main goal of a monitoring
tool is to perform traffic classification task, that is to identify
the application that generated the traffic. As traffic classifica-
tion is known to be prone to fallacies, several approaches have
been studied in the literature [6], [8]. Each tool has its peculiar-
ities. In the case of Tstat, three different engines are available,
each relying on different technologies. They are designed to
work even when the complete packet payload is not available,
that is a common situation in live networks monitoring, since,
usually, only a limited portion of each packet is exposed to
the sniffer due to privacy reasons. Tstat implements a DPI
technology similar to the one adopted in tools like l7filter and
OpenDPI. In addition to what done in those tools, Tstat offers
a richer set of statistics that complement the pure classification
purpose making it more flexible than pure classification tools
as the ones earlier mentioned. Other commercial tools like
ntop and peakflow offer not only classification capabilities but
complete solutions for traffic monitoring, anomaly detection
and security. Designed to work on operative networks, they
rely on NetFlow/sFlow technology as input, i.e., they do
not analyze packet traces, but data records with flow level
statistics. Typically, their deployment is highly invasive, i.e.,
several analyzers have to be deployed in strategic points of the
network. Tstat instead is an Open Source software designed to
be installed on common hardware at the edge of the network
where packet level traces are analyzed.
In particular, the simplest classification engine offered by
Tstat is Pure Deep Packet Inspection (PDPI). It uniquely
identifies applications by matching a signature in the appli-
cation payload. All the application signatures are collected in
3
a dictionary, defining a set of classification rules, and are then
checked against the current packet payload until either a match
is found, or all the signatures have been tested. In the first
case, the packet/flow is associated to the matching application,
while in the second case it is labeled as “unknown”. Signatures
cover a large set of applications, ranging from standard email
protocols to Peer-to-Peer applications, like BitTorrent, eMule,
Gnutella, PPLive, and Sopcast. Extending and updating the
signatures is a key issue with PDPI, as we will discuss later.
The second engine, named Finite State Machine Deep
Packet Inspection (FSMDPI), inspects more than one packet
of a flow. Finite State Machines (FSM) are used to verify
that message exchanges are conform to the protocol standard;
a specific sequence of matching rules have to be triggered to
have a positive match. For example, if the first packet contains
GET http:// and the response carries HTTP/1.0 OK, the
flow can be considered as HTTP. Using this approach, more
complex signatures can be defined, allowing to identify web
based applications like YouTube, Vimeo, Facebook, Flickr, or
chat services like MSN, XMPP/Jabber, Yahoo. Finally, Voice
over IP phone (VoIP) calls based on RTP/RTCP are identified
using FSMDPI as well.
To cope with applications that leverage on encryption
mechanisms which make any DPI classifier useless, Tstat
implements a Behavioral classifier (BC) engine that exploits
statistical properties of traffic to distinguish among appli-
cations. For example, packet size or inter arrival time in
flows carry information about the application generating the
content, so that VoIP flows exhibits different characteristics
with respect to data download flows. Using this approach, Tstat
identifies encrypted traffic like the one generated by Skype and
Obfuscated P2P-file-sharing of BitTorrent and eMule [3].
In Section III we present some results that exploit the traffic
classification capabilities of Tstat. While the performance
and accuracy of the classifier are out of the scope of this
paper, overall, they have been found to “outperform [other]
signature based tools used in the literature” when compared
by independent researchers [9].
C. Input data
Software-based monitoring tools like Tstat are designed
to work in real-time when installed in operational networks.
The software tool runs on a “probe”, i.e., a dedicated PC
that “sniffs” traffic flowing on an operative link, as shown in
Fig. 1(a). The libpcap library is the de-facto standard Appli-
cation Programming Interface (API) to capture packets from
standard Ethernet linecards under several Operating Systems.
Dedicated hi-end capture devices such as Endace DAG or
AITIA S1GED cards are also available on the market1. They
offer hardware packet monitoring solutions that offload the
CPU guaranteeing higher performance than software based
solutions. Tstat supports both standard sniffing based on
libpcap, and hardware solutions as the ones mentioned earlier.
Furthermore, Tstat can be also compiled as a “library” to
allow an easy integration with already existing tools such
as those typically deployed by an ISP which already has a
1http://www.endace.com, http://www.aitia.ai
monitoring solution. In the latter case, the ISP is free to decide
what packets should be processed by Tstatto cope with privacy
and anonymization issues. In our experience, this approach
has been very successful to facilitate the integration of Tstat
with the monitoring tools of several ISPs around Europe and
with other traffic analysis tools developed by the research
community.
Besides live traffic analysis, monitoring tools are also com-
monly adopted to process packet-level traces that have been
previously collected. In this case, the tool can be used to
inspect specific traffic for post-mortem analysis, or to develop
more complex statistical analysis for advanced performance
evaluation, or to double check the accuracy of any new index
that is being developed. Since several trace file formats are
available on the market, a variety of file formats should be
supported, such as pcap, erf, etherpeek, snoop to name a few.
Besides supporting already a large set of trace input file format,
Tstat allows to easy integrate new formats thanks to its open
and flexible design.
D. Output statistics
Each monitoring tool offers a set of output statistics that
are strictly bound to the goal of the tool itself. For example,
intrusion detection systems like Snort or Bro output the list
of triggered alarms and violations, while traffic classification
tools like Tie or CoralReef report statistics about application
traffic shares. Considering Tstat, statistics are available with
different granularities: per-packet, per-flow, and aggregated. At
the finest level of granularity, packet traces can be dumped into
trace files for further offline processing. This output format is
extremely valuable when coupled with Tstat classification ca-
pabilities: indeed, packets generated by different applications
can be dumped to different files. For example, it is possible to
instruct Tstat to only dump packets generated by Skype and
BitTorrent applications.
At an intermediate level of granularity, Flow-level logs are
text files providing detailed information for each monitored
flow. A log file is arranged as a simple table where each
column is associated to a specific information and each line
reports the two unidirectional flows of a connection. Several
flow-level logs are available, e.g., the log of all UDP flows, or
the log of all VoIP calls. The log information is a summary of
the connection properties. For example, the starting time of the
VoIP call, its duration, the number of suffered packet losses,
the jitter are all valuable metrics that allow to monitor the
VoIP quality of service. Flow-level logs use much less space
than the original packet-level traces, and can be collected for
much longer periods of time.
At an even higher level of granularity, Tstat gathers statistics
about flows aggregates. Two formats are available in this case.
Histograms are empirical frequency distributions of collected
statistics over a set of flows. For example, the distribution of
the VoIP call duration is automatically computed by consid-
ering all VoIP flows that were observed during each 5 minute
time interval. To overcome the problem of storage space
explosion of packet-traces, flow-level logs and histograms over
time, the second available format is represented by Round

4
TABLE IPROBES CHARACTERISTICS
Location Users Technology Type
Polish ISP 10k ADSL HomeHungarian ISP 4k ADSL Home
Italian ISP 5k ADSL HomeItalian ISP 15k FTTH Home
Italian Campus 10k LAN and WLAN Campus
Robin Database (RRD) [10] It allows to build a database that
spans over several years by limiting the amount of disk space.
RRD handles historical data with different granularities: newer
samples are stored with higher frequencies, while older data
are averaged in coarser time scales. This dramatically reduces
the requirements in terms of disk space (a priori configurable)
and, thanks to the tools provided by the RRD technology, it
is possible to visually inspect the results. For example, RRD
data collected by a Tstat probe can be queried in real time
using a simple web interface [2]. Results presented in Sec.III
are obtained from the corresponding RRD data.
III. TRAFFIC TRENDS FROM DIFFERENT VANTAGE POINTS
After having presented the main Tstat features and char-
acteristics, we now show Tstat capabilities through a few
results and discuss some conclusions we drawn from our long
experience in using it.
We have been collecting measurement data since 2005 in
collaboration with several ISPs. A Linux-based Tstat probe
has been installed and properly configured in different Points-
of-Presence (PoPs). The results presented in this work refer
to five European PoPs and characterize 20 months of traffic
collected from May 2009 to Dec 2010.
A. Probe description
The main characteristics of the 5 probes are summarized in
Tab. I, which reports the PoP location, the approximate number
of aggregated users, the access technology and the type of
customers distinguishing between Home or Campus users. As
it can be observed, the set of probes is very heterogeneous: it
includes Home users in three different countries, with ADSL
or LAN and WLAN access technologies. Depending on the
type of contract with the ISP and on the quality of the physical
medium, ADSL technology offers users different bitrates,
ranging from 2 to 20 Mb/s downstream and up to 1024 kb/s
upstream. Fiber to the Home (FTTH) customers are offered
10Mb/s full duplex Ethernet connectivity, while Campus users
are connected to a 10Gb/s based Campus network using either
100 Mb/s Ethernet, or IEEE 802.11a/b/g WiFi access points.
The Campus network is connected to the Internet via a single
1 Gb/s link and a firewall is present to enforce strict policies,
to block P2P traffic (unless obfuscated), and to grant access
to only official servers inside the campus.
Probes were upgraded several times to update the Tstat
version and to include advanced features, so as to enhance
traffic classification accuracy and augment the number of
protocol signatures. All probes are configured to continuously
collect RRD information.
TABLE IIAVERAGE TRENDS OF THE TWO SEMESTER IN 2010.
P2P HTTP Stream. File Hosting
Localtion Jan/Jun Jul/Dec Jan/Jun Jul/Dec Jan/Jun Jul/Dec
Pol. ISP -0.81 0.78 0.47 0.57 0.73 -1.06Hun. ISP -0.62 1.98 0.72 0.04 0.45 -0.53Ita. ISP ADSL -1.1 0.28 0.78 0.06 0.4 0.01Ita. ISP FTTP -1.3 0.59 0.67 0.03 0.08 0.01
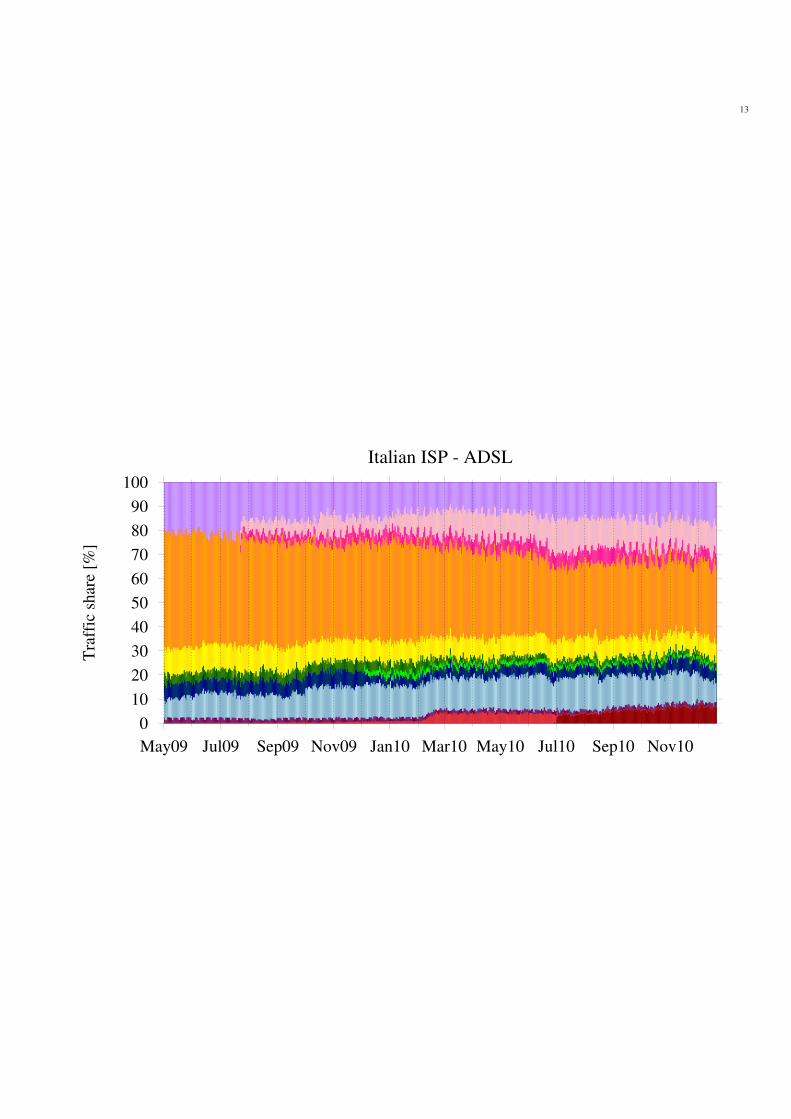
B. Traffic share and trends
We first present results covering from May 1st, 2009 to
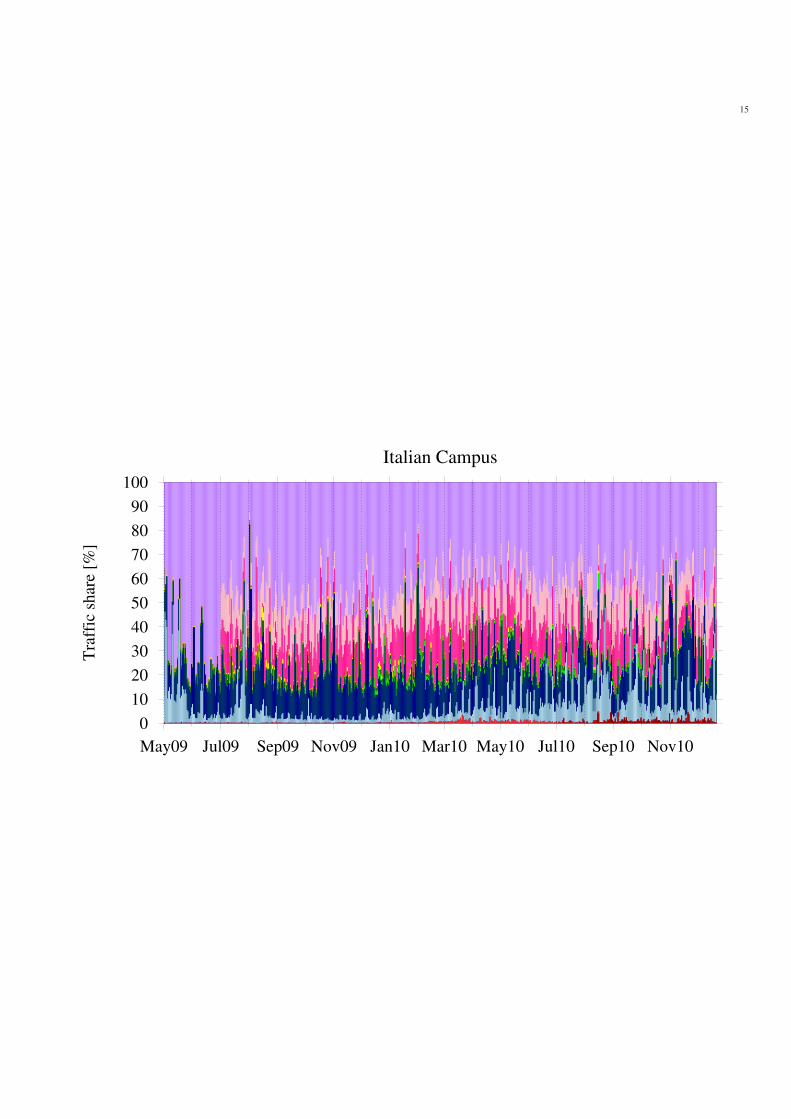
Dec 22nd, 2010 period. Figure 2 shows the traffic breakdown
for incoming traffic, i.e., traffic received by customers. The
applications generating the largest amount of traffic are high-
lighted using different colors. Gaps in the figures correspond
to outage periods of the probes. Over time, we enhanced the
classification portfolio of Tstat by adding both PDPI/FSMDPI
and Behavioural rules. For example, since June 2009 we have
been collecting statistics about both Streaming Applications,
such as YouTube, Vimeo, Google video and other flash-based
streaming services, and File Hosting Web based services like
RapidShare or MegaUpload that allow users to share large
files. Light and dark pink colors highlight them in the plots.
Double checked in the Campus network first, we then deployed
these capabilities into other probes. Similarly, since December
2009 the BitTorrent obfuscated traffic (plotted in light green)
is correctly identified by Tstat, and the more recent BitTorrent
UDP based data transport protocol named uTP [11] is correctly
classified since July 2010 (dark red). This latter classifier was
developed while investigating the cause of the sudden increase
of UDP traffic share that is clearly visible in the Hungarian
vantage points during February 2010. This is an example of
the usage of Tstat to effectively support traffic monitoring.
Several considerations can be derived from the presented
results.
• Before the uTP protocol was adopted by BitTorrent, the
volume of UDP traffic was marginal in all vantage points
but in the Italian ISP. This is due to this ISP offering
Video on Demand (VoD) services over UDP that makes the
volume of VoD UDP traffic in this network about 10% of
the total. Customers of the same operator are offered native
VoIP service using standard RTP/RTCP protocols over UDP.
Still, the volume of traffic due to VoIP is almost negligible,
accounting for less than 2% of total traffic (in dark purple
color in the figure). Nowadays, UDP traffic can top 30% of
total volume, depending on the popularity of BitTorrent-uTP
or VoD applications. Therefore, the widely popular statement
that UDP traffic is negligible does not hold anymore.
• Applications’ usage is very different at different places.
For example, in Poland the fraction of HTTP traffic is predom-
inant, with more than 60% of traffic due to several applications
adopting HTTP protocol. In both the Italian ISP PoPs, instead,
Peer-to-Peer (P2P) applications amount to more than 50% of
traffic, with eMule clearly being preferred over BitTorrent. In
Hungary, on the contrary, BitTorrent is more popular (with a
traffic share above 20%), while an almost negligible amount
of traffic that is due to eMule. Finally, note that in the Italian
Campus network the fraction of P2P traffic is marginal being

5
Tra
ffic
shar
e [%
]
Polish ISP
0
10
20
30
40
50
60
70
80
90
100
May09 Jul09 Sep09 Nov09 Jan10 Mar10 May10 Jul10 Sep10 Nov10
Tra
ffic
shar
e [%
]
Hungarian ISP
0
10
20
30
40
50
60
70
80
90
100
May09 Jul09 Sep09 Nov09 Jan10 Mar10 May10 Jul10 Sep10 Nov10
Tra
ffic
shar
e [%
]
Italian ISP - ADSL
0
10
20
30
40
50
60
70
80
90
100
May09 Jul09 Sep09 Nov09 Jan10 Mar10 May10 Jul10 Sep10 Nov10
Tra
ffic
shar
e [%
]
Italian ISP - FTTH
0
10
20
30
40
50
60
70
80
90
100
May09 Jul09 Sep09 Nov09 Jan10 Mar10 May10 Jul10 Sep10 Nov10
Tra
ffic
shar
e [%
]
Italian Campus
0
10
20
30
40
50
60
70
80
90
100
May09 Jul09 Sep09 Nov09 Jan10 Mar10 May10 Jul10 Sep10 Nov10
TCP
Emule
Emule Obfuscated
BitTorrent
BitTorrent Obfuscated
P2P
Streaming (YouTube, Vimeo, ...)
FileHosting (RapidShare, ...)
Others HTTP (SSL/TLS, Chat, ...)
HTTP
FTP, email, Unknown
Other
UDP
BitTorrent
BitTorrent uTP
P2P
DNS, VoD, Unknown
RTP/RTCP
Other
Fig. 2. Comparison of traffic as observed on 5 different traffic probes. Gaps in the data were due to temporary outages of the probes.
the firewall very effective in blocking such traffic.
• Some long-term trends are clearly visible. For example,
until July 2010, P2P traffic share is generally decreasing,
while Streaming and File Hosting applications are gaining
popularity. More precisely, Tab. II reports the average per
month variation of the traffic share. Specifically, we compute
the linear increase/decrease of traffic during each month, and
then we average the results over the first and second six
months of 2010 separately. We do not report results for the
Campus network since P2P traffic is blocked, and this biases
results. Interestingly, in the first semester data confirm the
trends reported in [12] where a decrease of P2P traffic was
noticed, while both File Hosting and Video Streaming usage
were increasing. During the second semester, we observe an
unexpected change in this trend: from June 2010, P2P traffic
starts increasing while File Hosting traffic is either stable or
decreasing. Further investigations revealed that this might be
related to changes in the policies of RapidShare [14], the most
popular File Hosting service in these countries. In particular,
RapidShare started enforcing more limitation to not-paying
customer to incentive them to subscribe to their service. This
caused users to switch back to P2P content download. The
Italian probes instead are not affected by this change since
RapidShare is not popular in Italy. Overall, these indexes
are a clear indication of very fertile and dynamic scenarios
that call for continuous and persistent traffic monitoring and
classification.
• While the above mentioned changes in traffic shares are
typically slow, sudden changes are possible due to changes
in the application. For example, as already mentioned, the
popular µtorrent, the official BitTorrent client application, was
updated during February 2010 to use by default the uTP
transport protocol instead of TCP. Correspondingly, there is
an increase of UDP traffic clearly visible in some probes.
• Residential probes have stable shares over time, even if
trends are present. Instead, in the Campus network the traffic
share changes over time, so that a weekly pattern is clearly
visible (see also the figure and related comments in the next
section). Indeed, during the weekend, few users are present in
the campus and little traffic flows on the link.
• Obfuscated traffic for P2P applications is not very
common in the monitored probes. We double checked that this

6
Tra
ffic
lo
ad
CP
U l
oad
[%
]
Max CPU load Tot. bitrate [Mb/s] Flows tracked [kflows/s]
0
50
100
150
200
250
300
350
400
450
500
Mon Tue Wed Thu Fri Sat Sun Mon
0
20
40
60
80
100
(a) Italian ISP FTTH probe.
Tra
ffic
lo
ad
CP
U l
oad
[%
]
Max CPU load Tot. bitrate [Mb/s] Flows tracked [kflows/s]
0
50
100
150
200
250
300
350
400
450
Mon Tue Wed Thu Fri Sat Sun Mon
0
20
40
60
80
100
(b) Italian Campus probe.
Fig. 3. Total link bitrate, number of flows and maximum CPU utilizationduring a typical week.
is not a Tstat classification problem (i.e., Tstat not correctly
identifying obfuscated P2P traffic). Consider a host a with IP
address IPa running BitTorrent on Porta. Since the applica-
tion uses the same Porta to receive both plain and obfuscated
connections, we count the number of connections going to
(IPa, Porta) and see how many of those are not labeled
as BitTorrent, i.e., neither plain BitTorrent, nor obfuscated
BitTorrent. Those are possibly BitTorrent connections not
correctly classified by Tstat. We consider all hosts that are
running BitTorrent in a 2 hour long trace on January 21st
of 2010 in Poland. Results show that less than 0.5% of
flows/bytes are not classified as BitTorrent (those are called
“false negatives” using classification terminology). Similarly,
we computed the percentage of flows that are classified as
BitTorrent obfuscated, but going to some host which is not
likely to run BitTorrent on that port. They account for less
than 0.01% of flows/bytes (those are called “false positives”
using classification terminology). Similar results are obtained
considering eMule. This shows that Tstat obfuscated classifi-
cation engine is very reliable.
In conclusion, the presented results highlight the importance
of constantly monitoring the network with a flexible tool that
has to be constantly upgraded and enhanced to follow its
changes.
IV. SCALABILITY ISSUE OF SOFTWARE BASED
MONITORING TOOLS
When implementing a live monitoring tool, the knowledge
of the maximum sustainable load that the probe can handle
is one the most critical issues that must be faced. Indeed, as
seen in the previous section, Internet traffic changes widely
over both time and space. In a finer timescale, traffic is known
to exhibit even larger variability considering both the packet
and flow levels. For example, packet-level burstiness can stress
the sniffing hardware so that packet bursts can arrive at very
high speed. Packet capturing, filtering and timestamping are
then critical, especially if implemented in software. Similarly,
bursts of new flows can stress the per-flow operations, so that
memory management becomes typically a bottleneck.
While Tstat is as an example of advanced traffic monitoring
tool, most of the operations it handles are common to any
flow-level sniffer and monitoring tool. Indeed, similar data
structures must be used to store basic per-flow information
such as flow identifier, packets and bytes counters, timestamp
and the classification status. Notice that flow structures must
be accessed and updated for each packet: hence, efficient
data structures like hash-tables must be considered, where
collisions are minimized and eventually handled using chain-
ing. Further optimizations of memory management are also
needed; freed structures should be manually handled as reuse
lists by a garbage collector, so as to avoid generic and
expensive garbage collection routines to kick-in and slow
down the main analysis operations.
In [13] we extensively analyzed the computational com-
plexity of the Tstat analysis workflow, showing that even with
off-the-shelf hardware it is possible to run advanced analysis
techniques on several Gb/s worth of traffic in real-time.
To provide some examples of the typical workload that
Tstat has to support, and to highlight some critical points
in the design of a flow-sniffer, Fig.3 shows the evolution a
one week long period of time of the total link bitrate (gray
line), number of tracked flows (black line) and maximum CPU
utilization (dotted line), i.e., the total time spent by the CPU in
running Tstat, including both kernel and user space CPU time.
Measurements refer to a time window of 5 minutes. Results for
the Italian ISP FTTH and Italian Campus probes are reported
on the top and bottom plots, respectively; results from other
probes are not reported for the sake of brevity.
Considering the total link bitrate, the two probes handle
approximately the same amount of traffic, which tops to nearly
500Mb/s at the peaks. Notice that the peak-hour occurs at
different times, reflecting the different user habits of Home
and Campus users. The number of active flows is also very
different, with the Campus probe having to handle a per-flow
load which is about two times higher. This is due to the
different traffic mix generated by Campus users, as previously
shown in Fig. 2. Therefore, hash table sizes must be correctly
tuned to support the various values of the load.
Consider now CPU load curves. We observe a very dif-
ferent behavior: the Italian ISP probe shows a very low CPU
utilization, which is not correlated with the traffic load pattern.
On the contrary, the Campus maximum CPU utilization is
always above 30%, and it tops 100% during sustained traffic
load. Investigating further, we pinpointed this to be due to the
packet capturing input module, which is based on a common
Gigabit Ethernet linecard in the Campus probe, while the
Italian ISP probe relies on a dedicated Endace linecard. Based

7
on our experience indeed, the major bottleneck is due to
the linecard-to-memory communications, which can overload
CPU by generating a large number of Interrupt Requests (IRQ)
per second, i.e., one for each received packet. Dedicated traffic
capturing devices solve this problem by implementing times-
tamping functionalities and Direct Memory Access (DMA)
based transfers of packet batches. The CPU utilization figures
of the other probes, not shown in the paper due to lack of
space, confirm this. All ISP probes are indeed equipped by
dedicated hardware capturing linecards so that the maximum
CPU utilization remains very limited even if they have to
handle a large volume of traffic, topping to about 1.5Gb/s.
To sum up, with common hardware it is possible to monitor
several Gb/s volumes of traffic in real time, provided the
packet capturing is performed with efficient hardware that
offload the CPU from the per-packet memory copy and times-
tamping operations. Similarly, efficient memory management
algorithms must be adopted to perform per flow operations,
which optimize both the flow lookup performed for every
packet, and the garbage collection mechanisms required to
avoid memory starvation.
V. CONCLUSIONS
In this paper, we described our experience in engineering
and using Tstat, a software based Internet traffic monitoring
tool that we have being developing for the past 10 years.
Presenting measurements collected from several ISP networks,
we have shown that Internet traffic widely changes over both
time and space: application shares are different at different
networks even if common trends are visible due to slow
changes in applications popularity; however, sudden changes
are observed after the deployment of disruptive technologies
made by applications themselves. This call for the develop-
ment of automatic mechanisms that continuously update the
classification capabilities of a tool, a challenging goal that the
research community is currently facing.
REFERENCES
[1] L. Cottrell, “Network Monitoring Tools Collection,” http://www.slac.stanford.edu/xorg/nmtf/nmtf-tools.html.
[2] Tstat Homepage, http://tstat.tlc.polito.it[3] A. Finamore, M. Mellia, M. Meo, D. Rossi, “KISS: Stochastic Packet
Inspection Classifier for UDP Traffic” IEEE/ACM Transactions on
Networking, , Vol.18, No.5, pp.1505-1515, Oct. 2010.[4] M. Mellia, R. Lo Cigno, F. Neri, “Measuring IP and TCP behavior on
edge nodes with Tstat”, Computer Networks, Vol.47, No.1, pp.1-21, Jan.2005.
[5] TCPTrace Homepage, http://www.tcptrace.org[6] T. Nguyen, G. Armitage, “A survey of techniques for internet traffic
classification using machine learning,” Communications Surveys & Tu-
torials, IEEE, vol.10, no.4, pp.56-76, 2008.[7] A. Finamore, M. Mellia, M. Meo, M. Munafo, D. Rossi, “Live Traffic
Monitoring with Tstat: Capabilities and Experiences”, 8th International
Conference on Wired/Wireless Internet Communication, WWIC 2010,Lulea, Sweden, ISBN: 978-3-642-13314-5, 1-3 June, 2010 (ISSN 0302-9743, LNCS 6074).
[8] H. Kim, K. Claffy, M. Fomenkov, D. Barman, M. Faloutsos, and K.Lee, “Internet Traffic Classification Demystied: Myths, Caveats, and theBest Practices”, ACM CoNEXT 2008, p.12, Madrid, Spain, Dec. 2008.
[9] M. Pietrzyk, J. Costeux, G. Urvoy-Keller, and T. En-Najjary, “Challeng-ing Statistical Classification for Operational Usage : the ADSL Case”,ACM Internet Measurement Conference, Chicago, IL, Nov. 2009.
[10] RRDtool Homepage http://oss.oetiker.ch/rrdtool/
[11] S. Shalunov, G. Hazel, J. Iyengar, “Low extra delay background transport(LEDBAT)”, IETF Draft, October 2010.
[12] C. Labovitz, S. Iekel-Johnson, D. McPherson, J. Oberheide, and F.Jahanian, “Internet inter-domain traffic”, ACM SIGCOMM, New Delhi,India, August 2010.
[13] D. Rossi and M. Mellia, “Real-Time TCP/IP Analysis with CommonHardware,” IEEE International Conference of Communication (ICC’06),Istanbul, Turkey, June 2006.
[14] “Reward programme: RapidPoints and RapidDonations to be dis-continued”, http://www.rapidshare.com/#!rapidshare-ag/rapidshare-agnews, June 2010.
PLACEPHOTOHERE
Alessandro Finamore (S’09) received the M.Sc.in computer engineering in 2008 at Politecnico diTorino. Between 2008-2009 he has been researchassistant at Politecnico di Torino, while from 2009he joint the Telecommunication Network Group atPolitecnico di Torino as Ph.D. student.
His research interests are traffic classification andcomputer programming.
PLACEPHOTOHERE
Marco Mellia (SM’08) received his Ph.D. degreein Telecommunications Engineering in 2001 fromPolitecnico di Torino. In 1999, he was with the CSDepartment at Carnegie Mellon University, Pitts-burgh (PA) and since April 2001 he is with EEDepartment of Politecnico di Torino. He has co-authored over 140 papers published in internationaljournals and conferences, and he participated in theprogram committees of several conferences includ-ing IEEE Infocom and ACM Sigcomm. His researchinterests are in the fields of traffic measurement, P2P
applications and energy aware network design.
PLACEPHOTOHERE
Michela Meo (M’02) received the Laurea degree inelectronic engineering in 1993 and the Ph.D. degreein electronic and telecommunication engineering in1997, both from Politecnico di Torino, Italy. SinceNovember 1999, she is an Assistant Professor atPolitecnico di Torino. She co-authored more than100 papers, about 40 of which are in internationaljournals. She edited six special issues of interna-tional journals, including ACM Monet, PerformanceEvaluation Journal and Computer Networks. Herresearch interests are in the field of performance
evaluation and modeling, traffic classification and characterization, peer-to-peer, green networking. Dr. Meo was program co-chair of two editions ofACM MSWiM, general chair of another edition of ACM MSWiM, programco-chair of IEEE QoS-IP, IEEE MoVeNet 2007, IEEE ISCC 2009 and shewas in the program committee of about 50 international conferences, includingSigmetrics, Infocom, ICC, and Globecom.

8
PLACEPHOTOHERE
Maurizio M. Munafo (M’98) received the Dr.Ing. degree in electronic engineering and the Ph.D.degree in telecommunications engineering from Po-litecnico di Torino, Italy, in 1991 and 1994, respec-tively. He is an Assistant Professor in the ElectronicsDepartment of Politecnico di Torino. He has coau-thored about 60 journal and conference papers inthe area of communication networks and systems.His current research interests are in simulation andperformance analysis of communication systems,and in traffic modeling, measurement and and clas-
sification.
PLACEPHOTOHERE
Dario Rossi Dario Rossi (S’02) is an AssociateProfessor at the Computer Science and Networkingdepartment of Telecom ParisTech, in Paris, France.He received his MSc and PhD degrees from Politec-nico di Torino in 2001 and 2005 respectively, andheld during 2003-2004 a visiting researcher positionin the Computer Science division at University ofCalifornia, Berkeley. At Telecom ParisTech, he isresponsible for several European research projects,such as FP7 NAPA-WINE, Celtic TIGER, TIGER2and TRANS, ANR Connect. He has coauthored
over 70 papers in leading conferences and journals, holds 4 patents and heparticipated in the program committees of several conferences including IEEEINFOCOM, ICC, IPCCC and GLOBECOM. His research interests includegreen networking, peer-2-peer networks, Internet traffic measurement andtraffic engineering.

9
Network tomonitor

10
TCP/UDP
Behavioural
FSM DPI
Pure DPI
L7
L4
IPL3

11
Tra
ffic
sh
are
[%]
Polish ISP
0
10
20
30
40
50
60
70
80
90
100
May09 Jul09 Sep09 Nov09 Jan10 Mar10 May10 Jul10 Sep10 Nov10

12
Tra
ffic
sh
are
[%]
Hungarian ISP
0
10
20
30
40
50
60
70
80
90
100
May09 Jul09 Sep09 Nov09 Jan10 Mar10 May10 Jul10 Sep10 Nov10
13
Tra
ffic
sh
are
[%]
Italian ISP - ADSL
0
10
20
30
40
50
60
70
80
90
100
May09 Jul09 Sep09 Nov09 Jan10 Mar10 May10 Jul10 Sep10 Nov10

14
Tra
ffic
sh
are
[%]
Italian ISP - FTTH
0
10
20
30
40
50
60
70
80
90
100
May09 Jul09 Sep09 Nov09 Jan10 Mar10 May10 Jul10 Sep10 Nov10
15
Tra
ffic
sh
are
[%]
Italian Campus
0
10
20
30
40
50
60
70
80
90
100
May09 Jul09 Sep09 Nov09 Jan10 Mar10 May10 Jul10 Sep10 Nov10

16
TCP
Emule
Emule Obfuscated
BitTorrent
BitTorrent Obfuscated
P2P
Streaming (YouTube, Vimeo, ...)
FileHosting (RapidShare, ...)
Others HTTP (SSL/TLS, Chat, ...)
HTTP
FTP, email, Unknown
Other
UDP
BitTorrent
BitTorrent uTP
P2P
DNS, VoD, Unknown
RTP/RTCP
Other

17
Tra
ffic
lo
ad
CP
U l
oad
[%
]
Max CPU load Tot. bitrate [Mb/s] Flows tracked [kflows/s]
0
50
100
150
200
250
300
350
400
450
500
Mon Tue Wed Thu Fri Sat Sun Mon
0
20
40
60
80
100

18
Tra
ffic
lo
ad
CP
U l
oad
[%
]
Max CPU load Tot. bitrate [Mb/s] Flows tracked [kflows/s]
0
50
100
150
200
250
300
350
400
450
Mon Tue Wed Thu Fri Sat Sun Mon
0
20
40
60
80
100