Embed Size (px)
Citation preview
Origin-Destination Matrix Estimation ofTraffic Flow on Highway Network
Sergio Varela Ramirez Kristian Kovacic
Supervisor: Asst. Prof. Edouard Ivanjko
Technical report: UNIZG-FTTS-ZITS-01-13
July 2013
Department of Intelligent Transportation SystemsFaculty of Transport and Traffic Sciences
University of ZagrebZagreb, Croatia
c© Faculty of Transport and Traffic Sciences
AbstractToday’s road traffic control problems include solving a traffic situation with many
congestions, increased traffic demand in peak hours, need for high mobility and fastresponse in case of an incident. Video sensor or camera combined with state of the artimage processing algorithm is more and more becoming the approach to road trafficmonitor. Advantage of obtained traffic video footage is that many high level trafficinformation can be extracted. High level traffic information includes incident detection,vehicle classification, origin-destination matrix estimation, etc. This reports deals withthe possibility to track vehicles in a traffic network using license plate recognition. Thefinal results include developed image processing system, vehicle detection and licenseplate recognition to create an application that fulfills all mentioned requirements.
Extraction of traffic data using computer vision technology is nowadays related tocreation of traffic statistics and to improvement of the traffic conditions for drivers.The first development direction has been carried out on two different videos and thedata extracted were used to compile traffic statistics on a real world traffic highway andestablish the principles of the automatic highway network origin destination estimationthat will be developed in the future.
This reports includes presentation of experimental results obtained from real worldhighway traffic video footage and conclude with a summary of the tasks done andfuture work proposals.
II
Contents1 Introduction 2
2 Problem description 3
3 State of the art approaches 5
4 Vehicle detection 6
5 Application architecture 7
6 Experimental results 96.1 Highway network . . . . . . . . . . . . . . . . . . . . . . . . . . . . 96.2 Video footage processing . . . . . . . . . . . . . . . . . . . . . . . . 106.3 Estimated traffic data . . . . . . . . . . . . . . . . . . . . . . . . . . 12
7 Conclusion and Future work 17
8 Acknowledgment 17
1
1 IntroductionThis report is written in the scope of the first authors IAESTE internship at the De-partment of Intelligent Transportation Systems of the Faculty of Traffic and TransportSciences University of Zagreb and its volunteer work on the project Computer VisionInnovations for Safe Traffic (VISTA). Project VISTA has been carried out since March2013 with a planned duration of 24 months. It aims to improve traffic surround viewparking assistance, automatic headlight detection, traffic sign detection and recogni-tion, among others with computer technology.
Project participants are the Faculty of Electrical Engineering and Computing (UNI-ZG-FER) as leading institution and Faculty of Transport and Traffic Sciences (UNIZG-FTTS) as partner institution, both from University in Zagreb.
Most of the research and development work described in this report has been car-ried out during the internship of the first author of this technical report. Internshipwas sponsored from the student organization IAESTE and from UNIZG-FTTS. Workequipment was provided from the Department of Intelligent Transportation Systemsfrom UNIZG-FTTS.
The area of research which is investigated is origin-destination (OD) matrix estima-tion of traffic flow in a highway traffic network, vehicle detection in a highway trafficvideo footage, license plate recognition and database for manipulation of extractedvehicle data. In order to make the described research, Microsoft Visual Studio 2012(programming of the needed application in C++), openCV library for image processingand CARMEN R© ANPR Engine for plate recognition will be used.
Aim of this research and development is to advance in the project VISTA, investi-gate procedures of optimal moving vehicle recognition, test accuracy of CARMEN R©
ANPR Engine in plate recognition process, analyze execution time and finally evaluateimplemented application using a real world road traffic video example.
This report is organized as follows. Section 2 describes the problem that has tobe solved, and following section 3 describes state of the art approaches used for ODmatrix estimation. Section 4 describes applied approach for vehicle detection from roadtraffic video footage. Section 5 describes the architecture of the developed application.Section 6 shows the obtained experimental results of several test videos and finallysection 7 ends this report with conclusion and future work proposals.
2
2 Problem descriptionFor an effective traffic situation monitoring, first step is to get traffic network a fewbasic parameters that are needed: (i) distance between vehicles; (ii) length of vehi-cles; (iii) velocity of vehicles; and (iv) vehicle trajectories. These parameters need tobe measured and calculated with great accuracy in order to get useful statistical data.From this basic parameters, more complex parameters like traffic flow, traffic structureregarding vehicle types and road link load can be obtained. In order to estimate thisdata the developed system needs to use computed features like average speed of eachvehicle that has been detected in its travel through the traffic network. Nodes of themonitored traffic where a vehicle has been detected need to be logged. In this casenodes denotes points in the road network where the traffic is being monitored usinga video camera. Mostly such points are entry or exit points of a highway network,crossroads or toll plazas.
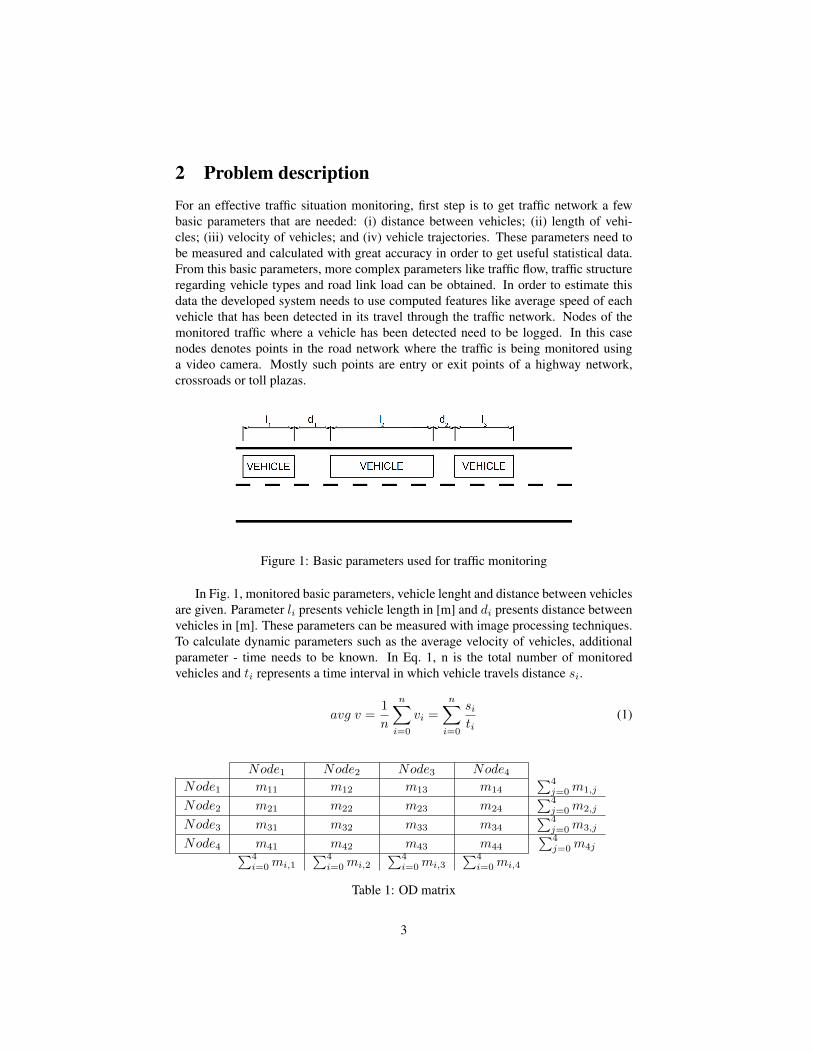
Figure 1: Basic parameters used for traffic monitoring
In Fig. 1, monitored basic parameters, vehicle lenght and distance between vehiclesare given. Parameter li presents vehicle length in [m] and di presents distance betweenvehicles in [m]. These parameters can be measured with image processing techniques.To calculate dynamic parameters such as the average velocity of vehicles, additionalparameter - time needs to be known. In Eq. 1, n is the total number of monitoredvehicles and ti represents a time interval in which vehicle travels distance si.
avg v =1
n
n∑i=0
vi =
n∑i=0
siti
(1)
Node1 Node2 Node3 Node4Node1 m11 m12 m13 m14
∑4j=0 m1,j
Node2 m21 m22 m23 m24
∑4j=0 m2,j
Node3 m31 m32 m33 m34
∑4j=0 m3,j
Node4 m41 m42 m43 m44
∑4j=0 m4j∑4
i=0 mi,1
∑4i=0 mi,2
∑4i=0 mi,3
∑4i=0 mi,4
Table 1: OD matrix
3
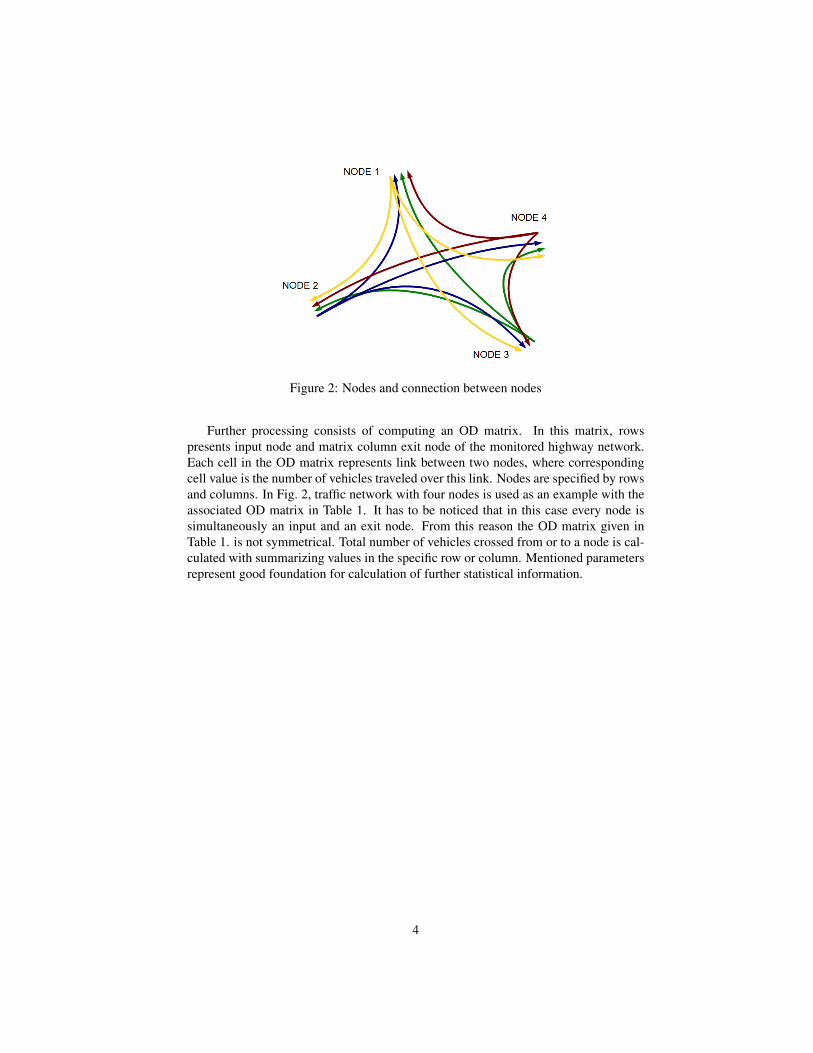
Figure 2: Nodes and connection between nodes
Further processing consists of computing an OD matrix. In this matrix, rowspresents input node and matrix column exit node of the monitored highway network.Each cell in the OD matrix represents link between two nodes, where correspondingcell value is the number of vehicles traveled over this link. Nodes are specified by rowsand columns. In Fig. 2, traffic network with four nodes is used as an example with theassociated OD matrix in Table 1. It has to be noticed that in this case every node issimultaneously an input and an exit node. From this reason the OD matrix given inTable 1. is not symmetrical. Total number of vehicles crossed from or to a node is cal-culated with summarizing values in the specific row or column. Mentioned parametersrepresent good foundation for calculation of further statistical information.
4

3 State of the art approachesComputer vision gives many approaches in solving of the above mentioned problems.Modern computer’s architecture allows fast computation using multi-core CPUs or fastparallel graphical processing units (GPUs). Main classification between today’s algo-rithms used in computer vision can be made based on the platform that they are madefor. For image processing, algorithms are executed in most cases on the GPU, as GPUis considered to have a good architecture for sequential processing large amounts ofdata. In cases where image processing algorithms consists of many branching mech-anisms, CPU architecture should be considered for executing algorithms rather thenGPU architecture. GPU architecture gives much lower performance when it is execut-ing an algorithm with many branching mechanisms.
On aspect of traffic network monitoring, one of the main processes in computervision software is object detection and recognition. It can be done by various methodssuch as foreground/background (FG/BG) image segmentation, edge detection, highlevel object recognition, etc. Using these methods, more complex parameters can becomputed. Extraction of different information from an image (average velocity of avehicle, distance between vehicles, etc.) can be achieved with algorithms that processand ”understand” vehicle physics model.
In Fig. 3, basic principle of FG/BG image segmentation is shown. It is based onseparating a foreground image (moving objects) from a background image (static ob-jects). Background image is created by combining a collection of consecutive images.After the background image is created, foreground image is calculated by subtract-ing the latest image from a collection of previously images stored and the backgroundimage [1].
Figure 3: Work principle of an FG/BG image segmentation method.
Unlike FG/BG image segmentation, edge detection methods are based on process-ing a single image. From an image, edges are extracted based on an algorithm thatcompares differences in pixel features. Segment of the image where a difference inpixel features is high can be defined as edge of an object [2]. Object recognition meth-ods are useful in cases where a specific object needs to be recognized and separatedfrom other objects (e.g. to separate a specific vehicle type) [3].
5
4 Vehicle detectionFirst requirement to detect a vehicle from an image is to separate the vehicle from therest of the image. After the vehicle is separated, it is possible to extract its additionalhigh level parameters such as position and velocity. In the field of computer visionthere are a few basic principles on which algorithms for object detection are based:
1. Separation of dynamic (foreground objects - vehicles and pedestrians) and static(background) segment of an image [1];
2. Calculating optical flow of a specific segments of an image (detection of movingobjects) [4];
3. Object detection with algorithms based on Hough method [5];
4. Detection of a vehicle based on algorithms that use modified Haar methods.
From mentioned methods, first and second require to perform calculations on amultiple consecutive images simultaneously. Contrary to this, third and fourth need toperform calculations only on one image. In scope of this work the first method is usedi.e. foreground/background image segmentation method.
After foreground/background segmentation is performed, contours on foregroundimage with moving objects have to be found. Area of contours for each object is cal-culated. If area is larger than specific threshold value, then it is considered that movingobject is a vehicle and further processing is done to extract additional information suchas the license plate registration number.
6
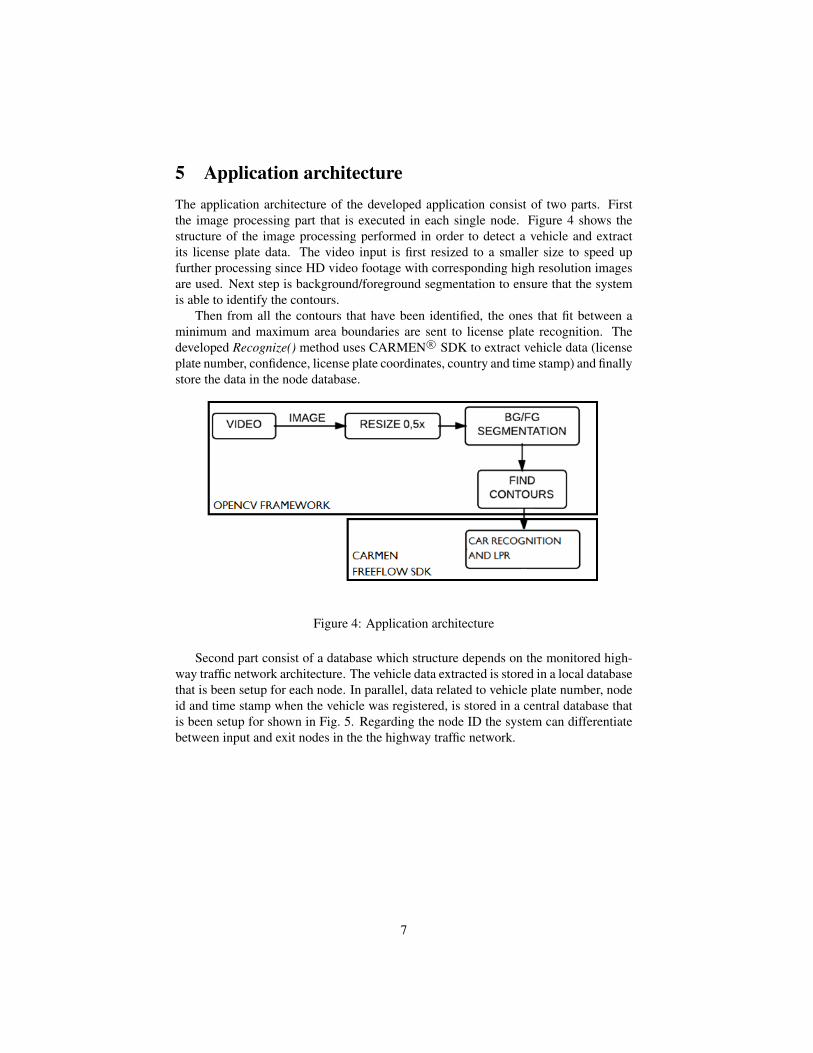
5 Application architectureThe application architecture of the developed application consist of two parts. Firstthe image processing part that is executed in each single node. Figure 4 shows thestructure of the image processing performed in order to detect a vehicle and extractits license plate data. The video input is first resized to a smaller size to speed upfurther processing since HD video footage with corresponding high resolution imagesare used. Next step is background/foreground segmentation to ensure that the systemis able to identify the contours.
Then from all the contours that have been identified, the ones that fit between aminimum and maximum area boundaries are sent to license plate recognition. Thedeveloped Recognize() method uses CARMEN R© SDK to extract vehicle data (licenseplate number, confidence, license plate coordinates, country and time stamp) and finallystore the data in the node database.
Figure 4: Application architecture
Second part consist of a database which structure depends on the monitored high-way traffic network architecture. The vehicle data extracted is stored in a local databasethat is been setup for each node. In parallel, data related to vehicle plate number, nodeid and time stamp when the vehicle was registered, is stored in a central database thatis been setup for shown in Fig. 5. Regarding the node ID the system can differentiatebetween input and exit nodes in the the highway traffic network.
7
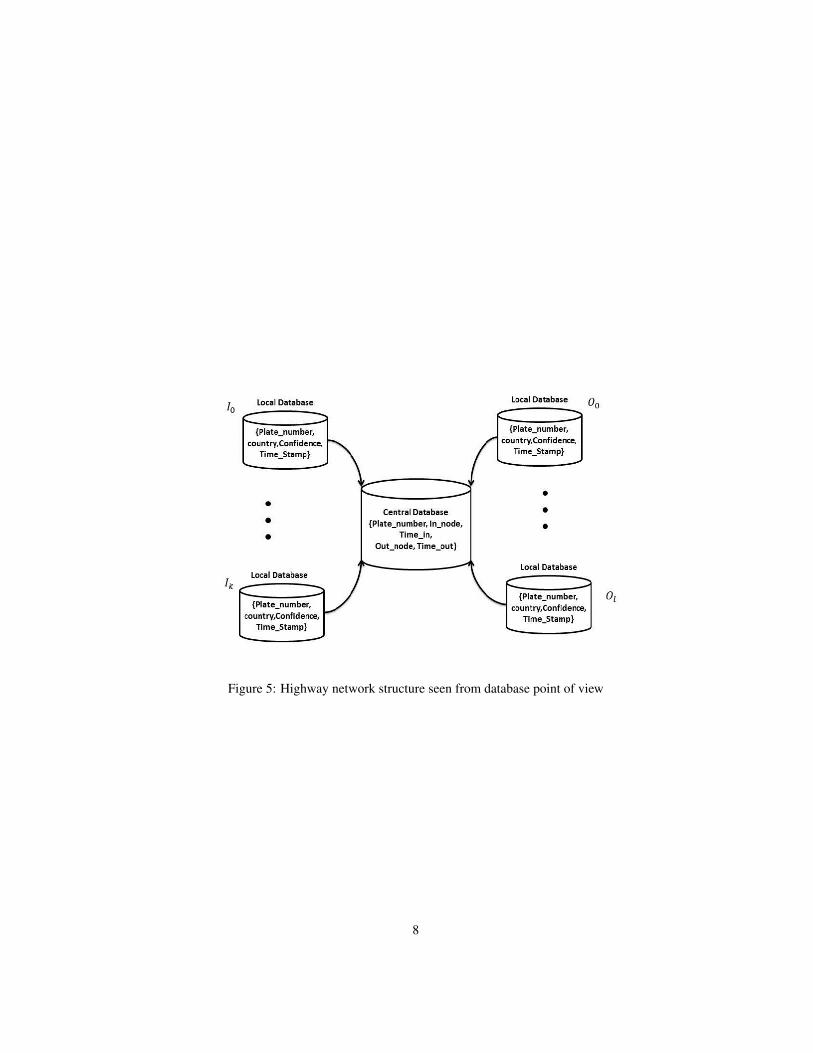
Figure 5: Highway network structure seen from database point of view
8
6 Experimental resultsFor the experimental test, two different real world highway traffic videos are used.First video is a traffic node with low traffic flow, used to make a first estimation of howthe program should work in a controlled environment. Second video is a node withhigh and variable traffic flow. With the first estimation set, the second video is used toincrease the accuracy in detection and recognition using a real world example highwaytraffic video footage.
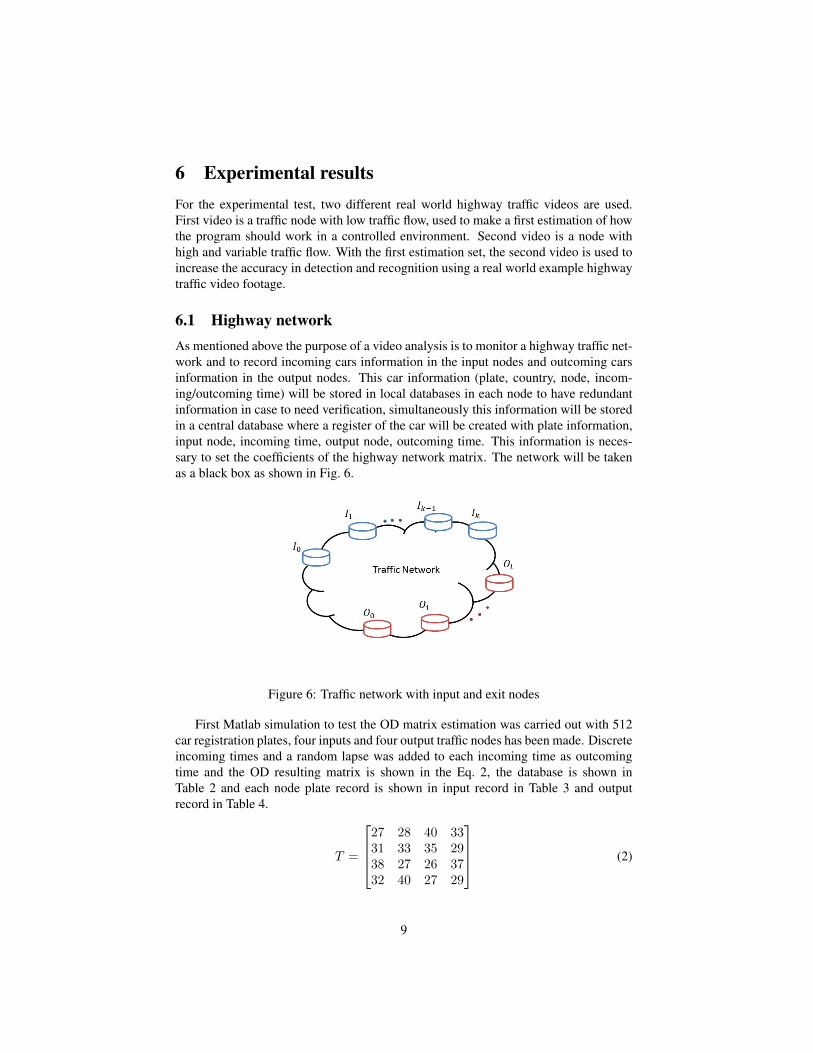
6.1 Highway networkAs mentioned above the purpose of a video analysis is to monitor a highway traffic net-work and to record incoming cars information in the input nodes and outcoming carsinformation in the output nodes. This car information (plate, country, node, incom-ing/outcoming time) will be stored in local databases in each node to have redundantinformation in case to need verification, simultaneously this information will be storedin a central database where a register of the car will be created with plate information,input node, incoming time, output node, outcoming time. This information is neces-sary to set the coefficients of the highway network matrix. The network will be takenas a black box as shown in Fig. 6.
Figure 6: Traffic network with input and exit nodes
First Matlab simulation to test the OD matrix estimation was carried out with 512car registration plates, four inputs and four output traffic nodes has been made. Discreteincoming times and a random lapse was added to each incoming time as outcomingtime and the OD resulting matrix is shown in the Eq. 2, the database is shown inTable 2 and each node plate record is shown in input record in Table 3 and outputrecord in Table 4.
T =
27 28 40 3331 33 35 2938 27 26 3732 40 27 29
(2)
9
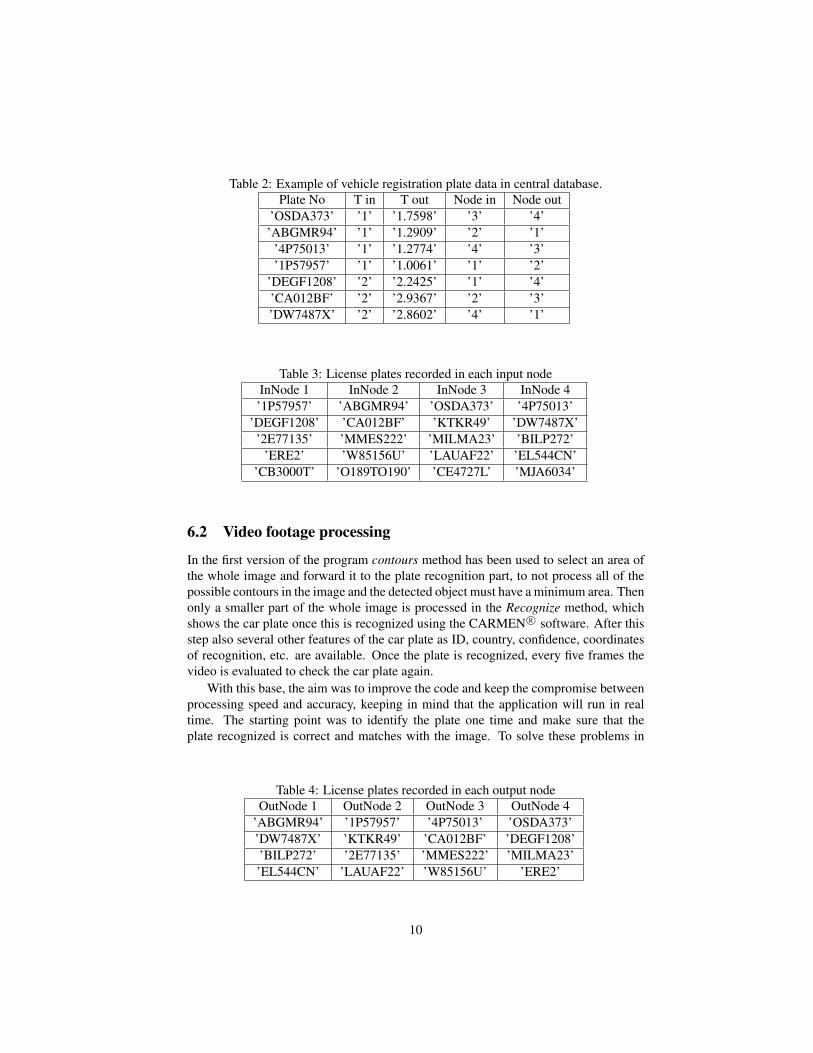
Table 2: Example of vehicle registration plate data in central database.Plate No T in T out Node in Node out
’OSDA373’ ’1’ ’1.7598’ ’3’ ’4’’ABGMR94’ ’1’ ’1.2909’ ’2’ ’1’
’4P75013’ ’1’ ’1.2774’ ’4’ ’3’’1P57957’ ’1’ ’1.0061’ ’1’ ’2’
’DEGF1208’ ’2’ ’2.2425’ ’1’ ’4’’CA012BF’ ’2’ ’2.9367’ ’2’ ’3’’DW7487X’ ’2’ ’2.8602’ ’4’ ’1’
Table 3: License plates recorded in each input nodeInNode 1 InNode 2 InNode 3 InNode 4’1P57957’ ’ABGMR94’ ’OSDA373’ ’4P75013’
’DEGF1208’ ’CA012BF’ ’KTKR49’ ’DW7487X’’2E77135’ ’MMES222’ ’MILMA23’ ’BILP272’
’ERE2’ ’W85156U’ ’LAUAF22’ ’EL544CN’’CB3000T’ ’O189TO190’ ’CE4727L’ ’MJA6034’
6.2 Video footage processing
In the first version of the program contours method has been used to select an area ofthe whole image and forward it to the plate recognition part, to not process all of thepossible contours in the image and the detected object must have a minimum area. Thenonly a smaller part of the whole image is processed in the Recognize method, whichshows the car plate once this is recognized using the CARMEN R© software. After thisstep also several other features of the car plate as ID, country, confidence, coordinatesof recognition, etc. are available. Once the plate is recognized, every five frames thevideo is evaluated to check the car plate again.
With this base, the aim was to improve the code and keep the compromise betweenprocessing speed and accuracy, keeping in mind that the application will run in realtime. The starting point was to identify the plate one time and make sure that theplate recognized is correct and matches with the image. To solve these problems in
Table 4: License plates recorded in each output nodeOutNode 1 OutNode 2 OutNode 3 OutNode 4
’ABGMR94’ ’1P57957’ ’4P75013’ ’OSDA373’’DW7487X’ ’KTKR49’ ’CA012BF’ ’DEGF1208’’BILP272’ ’2E77135’ ’MMES222’ ’MILMA23’’EL544CN’ ’LAUAF22’ ’W85156U’ ’ERE2’
10
a first approximation, the plates between two different frames are compared, if thereis difference a new car is registered, with the order of entrance, time stamp, plate andcountry. For the second part CARMEN R© software feature confidence is used. It givesan extracted license plate accuracy value in a range between 0-100 denoting how muchthe program is sure that the plate is correct. Taking advantage of this feature a triggerof 40[%] was set as threshold to accept a plate as a correct. Lower confidence valuesdenote an error in the LPR process. For further analysis the confidence value is alsoregistered with car data.
The first approximation explained above worked in the first video example with lowtraffic flow. In the second example with variable traffic flow, this methodology was notefficient. Due to real world aspects like speed, environmental effect, special cases ascar proximity, etc. that intervene in the plate detection and recognition. These aspectshave to be taken into account for the program improvement.
To reduce the recognition error due to the speed and car proximity used algorithmhas been optimized with the most probable cases obtained during a video analysis.The resulting cases are, two different car plates in two consecutive frames (either cor-rect/correct, error/correct, correct/error) or an error found according to CARMEN R©
confidence and after a time lapse the same plate is recognized as a correct one which isshown in the Fig. 8.
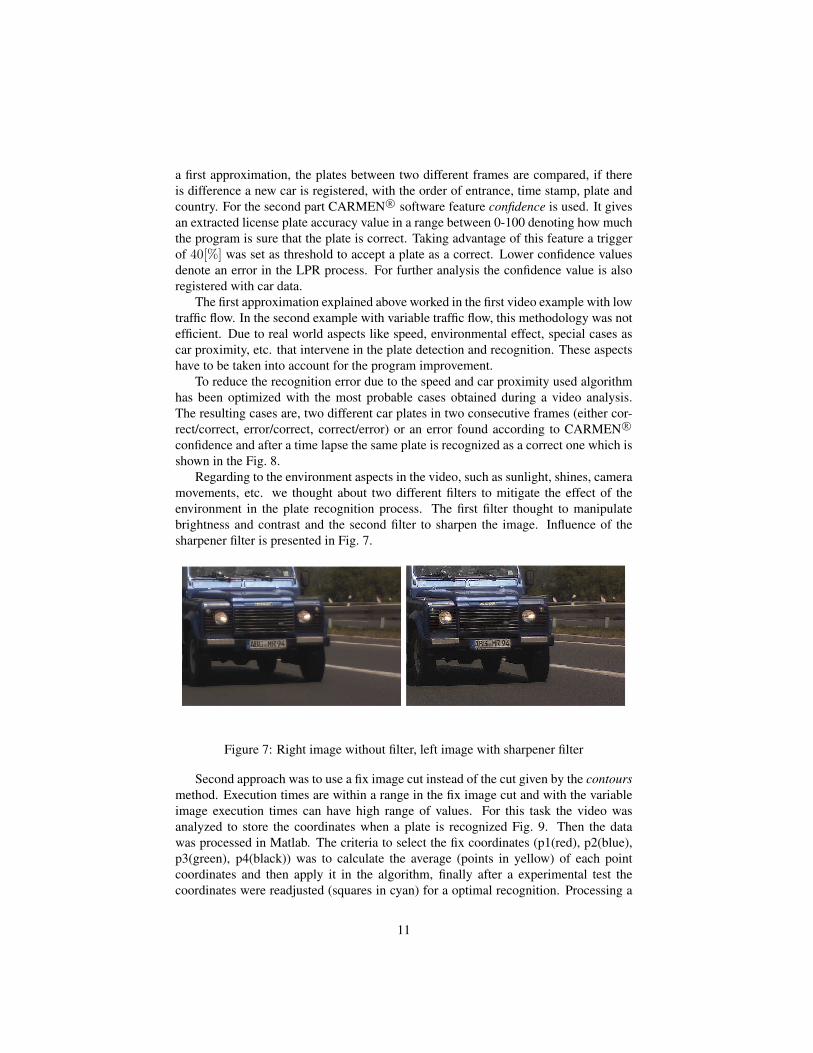
Regarding to the environment aspects in the video, such as sunlight, shines, cameramovements, etc. we thought about two different filters to mitigate the effect of theenvironment in the plate recognition process. The first filter thought to manipulatebrightness and contrast and the second filter to sharpen the image. Influence of thesharpener filter is presented in Fig. 7.
Figure 7: Right image without filter, left image with sharpener filter
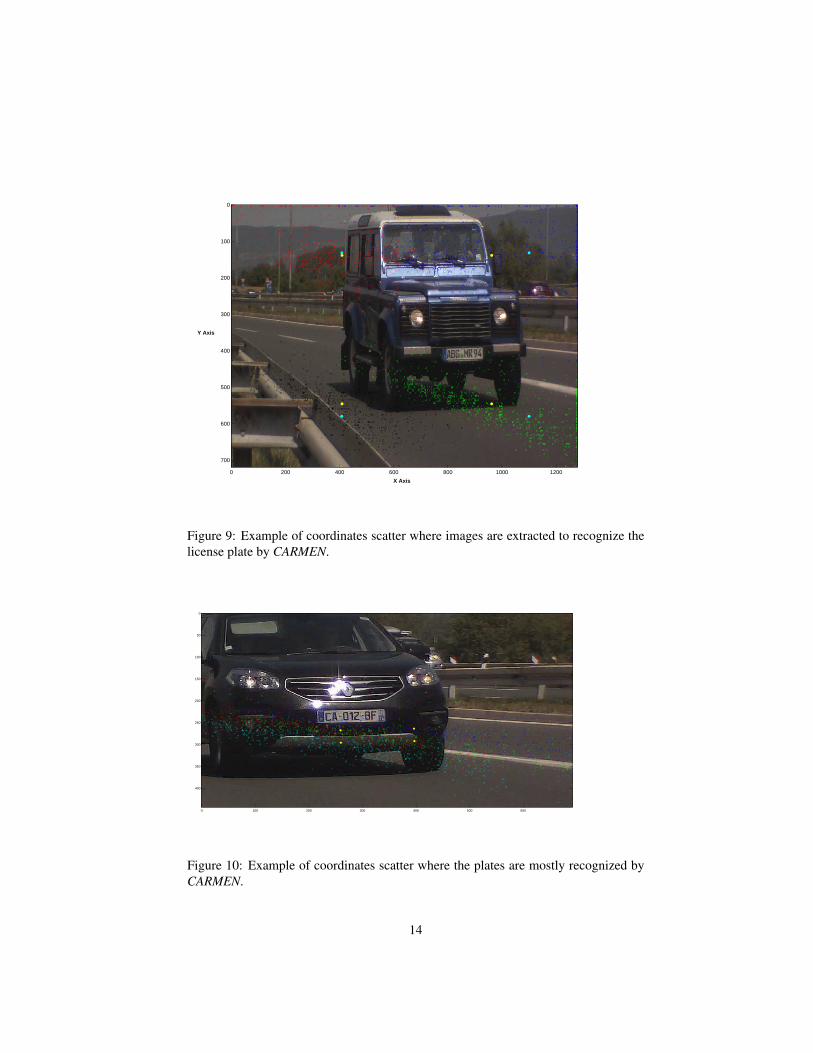
Second approach was to use a fix image cut instead of the cut given by the contoursmethod. Execution times are within a range in the fix image cut and with the variableimage execution times can have high range of values. For this task the video wasanalyzed to store the coordinates when a plate is recognized Fig. 9. Then the datawas processed in Matlab. The criteria to select the fix coordinates (p1(red), p2(blue),p3(green), p4(black)) was to calculate the average (points in yellow) of each pointcoordinates and then apply it in the algorithm, finally after a experimental test thecoordinates were readjusted (squares in cyan) for a optimal recognition. Processing a
11
fix image also means that absolute coordinates(p1(red), p2(blue), p3(green), p4(black))where the plate was recognized in the Fig. 10 with the average points in yellow. Thisfeature can be exploited to further improvement of the analysis.
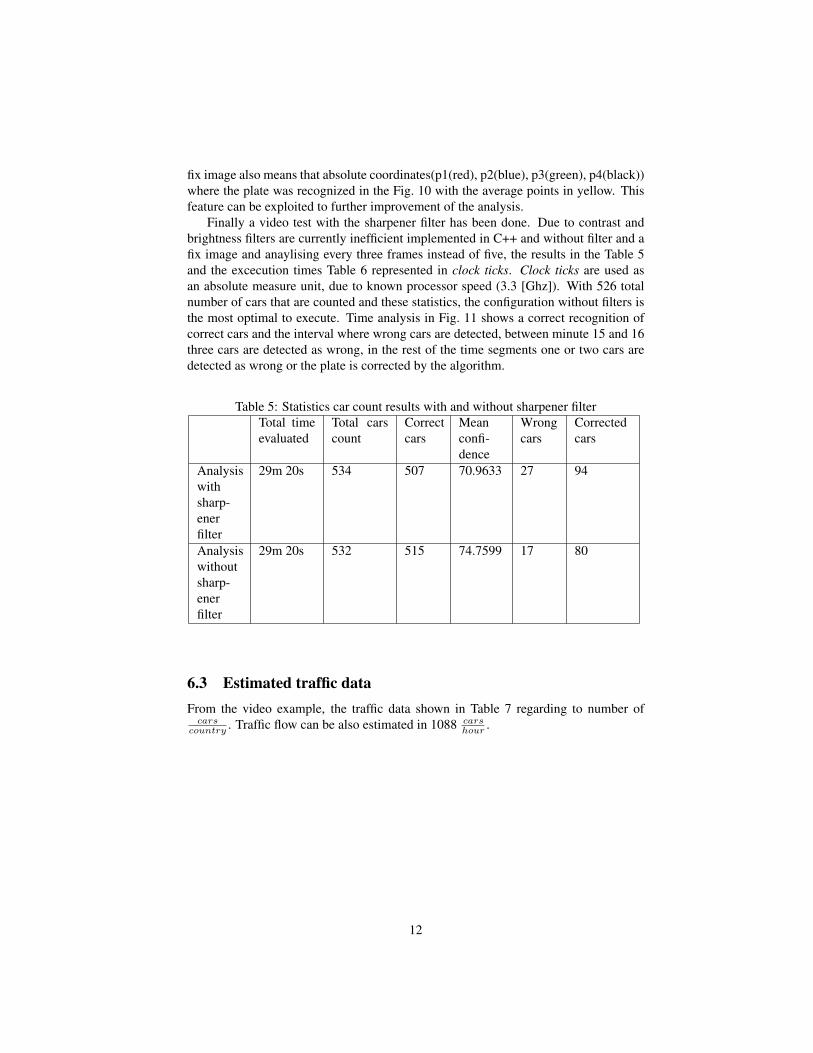
Finally a video test with the sharpener filter has been done. Due to contrast andbrightness filters are currently inefficient implemented in C++ and without filter and afix image and anaylising every three frames instead of five, the results in the Table 5and the excecution times Table 6 represented in clock ticks. Clock ticks are used asan absolute measure unit, due to known processor speed (3.3 [Ghz]). With 526 totalnumber of cars that are counted and these statistics, the configuration without filters isthe most optimal to execute. Time analysis in Fig. 11 shows a correct recognition ofcorrect cars and the interval where wrong cars are detected, between minute 15 and 16three cars are detected as wrong, in the rest of the time segments one or two cars aredetected as wrong or the plate is corrected by the algorithm.
Table 5: Statistics car count results with and without sharpener filterTotal timeevaluated
Total carscount
Correctcars
Meanconfi-dence
Wrongcars
Correctedcars
Analysiswithsharp-enerfilter
29m 20s 534 507 70.9633 27 94
Analysiswithoutsharp-enerfilter
29m 20s 532 515 74.7599 17 80
6.3 Estimated traffic dataFrom the video example, the traffic data shown in Table 7 regarding to number of
carscountry . Traffic flow can be also estimated in 1088 cars
hour .
12

Figure 8: Flow chart of the recognize method
13
0 200 400 600 800 1000 1200
0
100
200
300
400
500
600
700
X Axis
Y Axis
Figure 9: Example of coordinates scatter where images are extracted to recognize thelicense plate by CARMEN.
0 100 200 300 400 500 600
0
50
100
150
200
250
300
350
400
Figure 10: Example of coordinates scatter where the plates are mostly recognized byCARMEN.
14
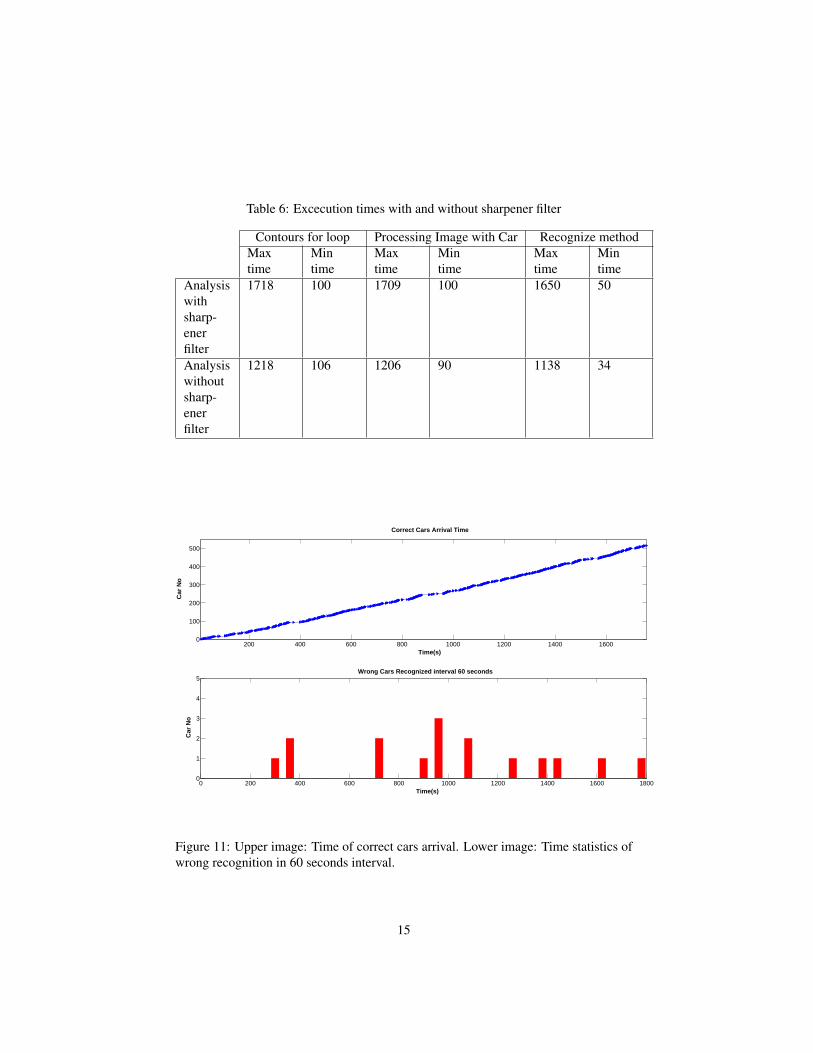
Table 6: Excecution times with and without sharpener filter
Contours for loop Processing Image with Car Recognize methodMaxtime
Mintime
Maxtime
Mintime
Maxtime
Mintime
Analysiswithsharp-enerfilter
1718 100 1709 100 1650 50
Analysiswithoutsharp-enerfilter
1218 106 1206 90 1138 34
200 400 600 800 1000 1200 1400 16000
100
200
300
400
500
Correct Cars Arrival Time
Time(s)
Car
No
0 200 400 600 800 1000 1200 1400 1600 18000
1
2
3
4
5Wrong Cars Recognized interval 60 seconds
Time(s)
Car
No
Figure 11: Upper image: Time of correct cars arrival. Lower image: Time statistics ofwrong recognition in 60 seconds interval.
15
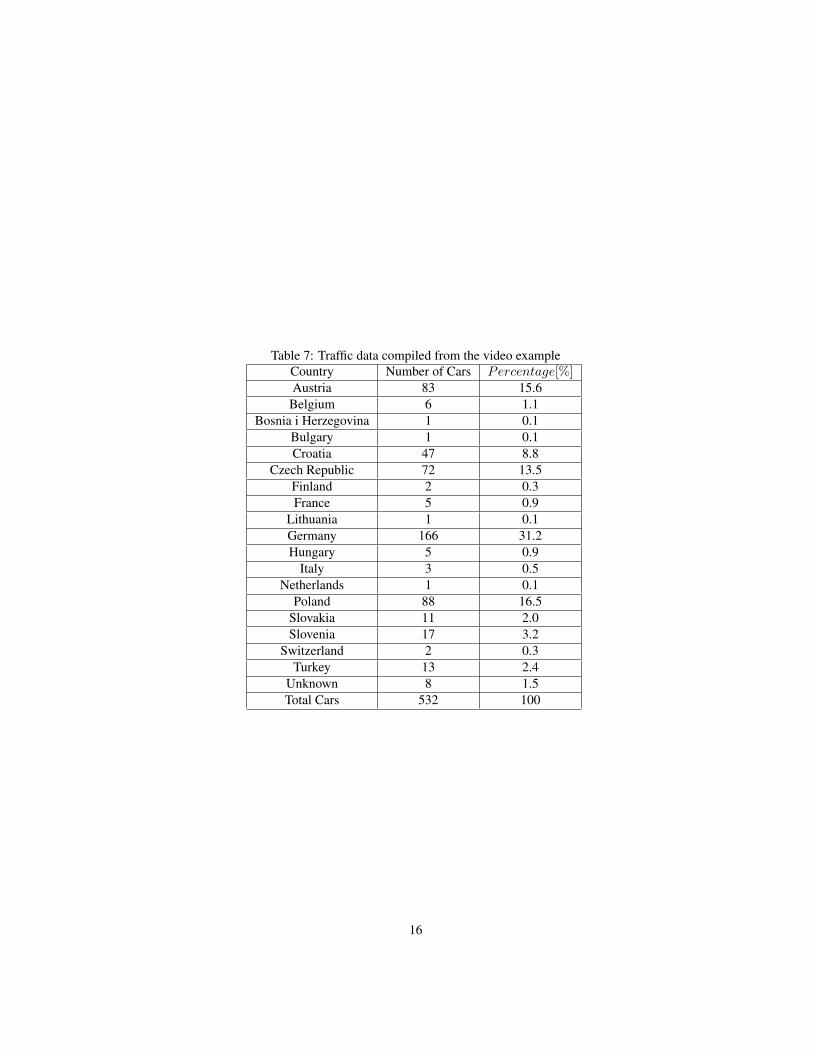
Table 7: Traffic data compiled from the video exampleCountry Number of Cars Percentage[%]Austria 83 15.6
Belgium 6 1.1Bosnia i Herzegovina 1 0.1
Bulgary 1 0.1Croatia 47 8.8
Czech Republic 72 13.5Finland 2 0.3France 5 0.9
Lithuania 1 0.1Germany 166 31.2Hungary 5 0.9
Italy 3 0.5Netherlands 1 0.1
Poland 88 16.5Slovakia 11 2.0Slovenia 17 3.2
Switzerland 2 0.3Turkey 13 2.4
Unknown 8 1.5Total Cars 532 100
16
7 Conclusion and Future workFirst to sum up the work done. The traffic network bases and architecture were set. Forthis purpose a video example of a highway with real world traffic flow was analyzed.From the investigation the data necessary to improve execution times, algorithms and toset constrains to perform the program efficiently were extracted, analyzed and appliedin the program.
Execution time was improved, with the hypothesis that the vehicle plates can berecognized in a specific area of the image. Video example was analyzed and the in-formation necessary was extracted to implement the fix image extraction, this reducedthe execution time compared with the dynamic image extraction. Second the imagesthat are sent to recognize method at first were saved on a hard disk with jpeg formatand then loaded, then they were saved in cache. Performance efficiency was improvedfrom the development of the algorithm, the goal is to register the most correct vehi-cle plates without repeating or correcting supposed wrong plates. With this objectivea traffic plates filter was implemented with the most frequent cases on the real worldtraffic node. As a result after the internship of the first author, the execution time andthe code were optimized with the resources available for the investigation.
For further work various new technologies should be examined. Such technologiesinclude SIMD capability like ones on GPU (CUDA, vertex and pixel shaders, etc.) andCPU (instruction sets of SSE type). Algorithms should support a multicore CPU wherethey need to work on multiple threads simulatenously to achieve a higher performance.
However the research was done over few samples and it’s matter of further investi-gation to cover more cases, generalize the method to make the fix image size adaptationautomatic to all kind of video footages that can be processed. So these cases should beinvestigated in depth in the future. On the other hand, the line of investigation shouldgo in the direction to create the network with several input and output nodes, manageadditional vehicle data (time, positions, distances) to enable computation of additionalstatistics for the OD estimation and finally perform the described OD estimation pro-cedure in a real time system.
8 AcknowledgmentThis project is co-financed by the European Union from the European Regional Devel-opment Fund.
The contents of this report is the sole responsibility of the University of Zagreb, Facultyof Electrical Engineering and Computing, Faculty of Transport and Traffic Sciencesand do not necessary reflect the views of the European Union.
17
References[1] P. KaewTraKulPong and R. Bowden. An improved adaptive background mixture
model for real-time tracking with shadow detection. In In Proc. 2nd EuropeanWorkshop on Advanced Video Based Surveillance Systems, 2001.
[2] John Canny. A computational approach to edge detection. Pattern Analysis andMachine Intelligence, IEEE Transactions on, PAMI-8(6):679–698, 1986.
[3] P. Viola and M. Jones. Rapid object detection using a boosted cascade of sim-ple features. In Computer Vision and Pattern Recognition, 2001. CVPR 2001.Proceedings of the 2001 IEEE Computer Society Conference on, volume 1, pagesI–511–I–518 vol.1, 2001.
[4] Pushmeet Kohli Michael W. Tao, Jiamin Bai and Sylvain Paris. Simpleflow: Anon-iterative, sublinear optical flow algorithm. In Computer Graphics Forum (Eu-rographics 2012), 200.
[5] J. Matas, C. Galambos, and J.V. Kittler. Robust detection of lines using the pro-gressive probabilistic hough transform. In CVIU 78 1, 200.
18