Embed Size (px)
Citation preview
Efficiency Differences Between Critical Access Efficiency Differences Between Critical Access Hospitals and Non-Converting Rural HospitalsHospitals and Non-Converting Rural Hospitals
Ryan Mutter, Ph.D.Ryan Mutter, Ph.D.Agency for Healthcare Research and QualityAgency for Healthcare Research and Quality
Rockville, MDRockville, MD
Michael Rosko, Ph.D.Michael Rosko, Ph.D.School of Business AdministrationSchool of Business Administration
Widener UniversityWidener UniversityChester, PAChester, PA
BackgroundBackground
Enactment of the Balanced Budget Act of Enactment of the Balanced Budget Act of 1997 (BBA) created the Critical Access 1997 (BBA) created the Critical Access Hospital (CAH) programHospital (CAH) program
Program subsequently modified by additional Program subsequently modified by additional legislation legislation
– Medicare, Prescription, Drug, Medicare, Prescription, Drug, Improvement, and Modernization Act of Improvement, and Modernization Act of 2003 (MMA)2003 (MMA)
Seeks to enhance financial viability of small, Seeks to enhance financial viability of small, isolated rural and “necessary provider isolated rural and “necessary provider hospitals”hospitals”
Background (continued)Background (continued)
Under the CAH program, hospitals accept a Under the CAH program, hospitals accept a number of restrictionsnumber of restrictions
– Limits on the number of acute care patients Limits on the number of acute care patients treated at one time (25)treated at one time (25)
– Limits on average patient LOS (4 days)Limits on average patient LOS (4 days) In exchange, they receive 101 percent of In exchange, they receive 101 percent of
costscosts
Background (continued)Background (continued)
Medicare payments to CAHs rose at an Medicare payments to CAHs rose at an annualized growth rate of 9.5 percent from annualized growth rate of 9.5 percent from 1998 to 2003.1998 to 2003.
The growth rate for similar non-converting The growth rate for similar non-converting hospitals was 3.3 percent.hospitals was 3.3 percent.
Medicare paid an estimated $1 million more per Medicare paid an estimated $1 million more per CAH in 2006 than they would have had CAH in 2006 than they would have had payment increased at the rate of non-payment increased at the rate of non-converting comparison hospitals.converting comparison hospitals.

Quality improvement was one of the main Quality improvement was one of the main goals of the CAH program.goals of the CAH program.
Many of these extra resources have gone into Many of these extra resources have gone into quality improvement and quality assurance quality improvement and quality assurance activities.activities.
See Li et al. (2007) for a review of the impact See Li et al. (2007) for a review of the impact of CAH status on quality.of CAH status on quality.
Background (continued)Background (continued)
MotivationMotivation
Program has succeeded in its aim of halting the Program has succeeded in its aim of halting the closure of hospitals providing care to under-closure of hospitals providing care to under-served populations, but there are concerns served populations, but there are concerns about the efficiency impact of the programabout the efficiency impact of the program
Motivation (continued)Motivation (continued)
““Although the CAH program has helped to Although the CAH program has helped to preserve access to emergency and inpatient preserve access to emergency and inpatient care in isolated areas, it may not have care in isolated areas, it may not have accomplished this goal in an efficient manner.”accomplished this goal in an efficient manner.”
- MedPAC (2005)- MedPAC (2005)
AimAim
Use stochastic frontier analysis (SFA) to Use stochastic frontier analysis (SFA) to estimate the efficiency impact of the CAH estimate the efficiency impact of the CAH program.program.
Econometric technique Econometric technique
– Generates provider-level (i.e., hospital-level) Generates provider-level (i.e., hospital-level) estimates of inefficiencyestimates of inefficiency
– Inefficiency estimates are measured as Inefficiency estimates are measured as departures from a statistically derived, departures from a statistically derived, theoretical best-practice frontier that takes theoretical best-practice frontier that takes input prices, outputs, product mix, quality, input prices, outputs, product mix, quality, case mix, and market forces into accountcase mix, and market forces into account
Stochastic Frontier Analysis (SFA)Stochastic Frontier Analysis (SFA)
SFA (continued)SFA (continued)
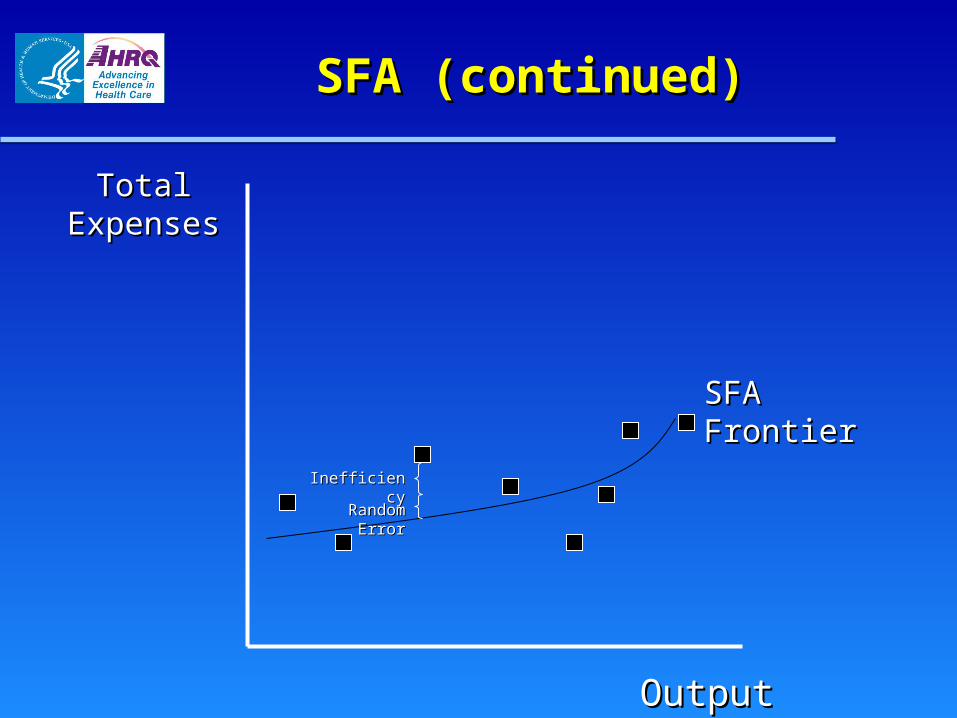
Total Total ExpensesExpenses
OutputOutput
SFA FrontierSFA Frontier
InefficiencyInefficiency
Random ErrorRandom Error
SFA (continued)SFA (continued)
Measures cost inefficiency (i.e., the percentage Measures cost inefficiency (i.e., the percentage by which observed costs exceed minimum costs by which observed costs exceed minimum costs predicted for a given level of outputs, input prices, predicted for a given level of outputs, input prices, etc.)etc.)
Particularly useful for determining the Particularly useful for determining the relative relative performanceperformance of hospitals of hospitals
– Hospital A is among the top 40 percent most Hospital A is among the top 40 percent most efficient hospitals in its efficient hospitals in its peer grouppeer group..
Folland and Hofler (2001) demonstrate its Folland and Hofler (2001) demonstrate its usefulness for usefulness for comparingcomparing the efficiency of the efficiency of groupsgroups of hospitals of hospitals
SFA (continued)SFA (continued)
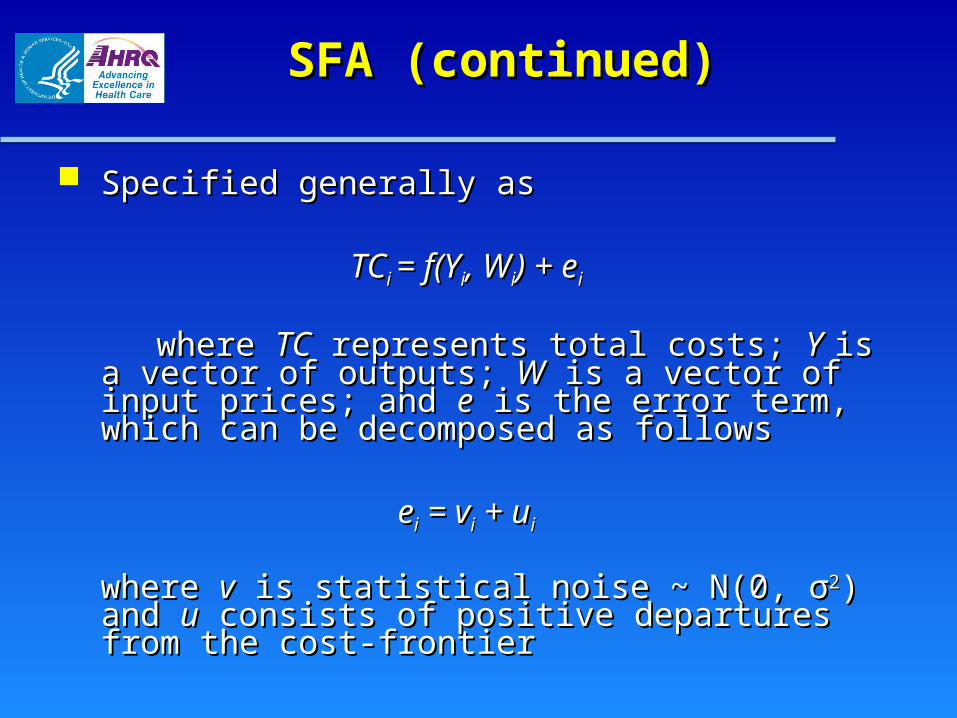
Specified generally as Specified generally as
TCTCi i = f(Y= f(Yii, W, Wii) + e) + eii
where where TCTC represents total costs; represents total costs; YY is a vector of is a vector of outputs; outputs; WW is a vector of input prices; and is a vector of input prices; and ee is is the error term, which can be decomposed as the error term, which can be decomposed as followsfollows
eeii = v = vii + u + uii
where where vv is statistical noise ~ N(0, is statistical noise ~ N(0, σσ22) and ) and uu consists of positive departures from the cost-consists of positive departures from the cost-frontierfrontier
Byproduct of the analysis is information about Byproduct of the analysis is information about hospital-level variables on cost and hospital-level variables on cost and environmental pressure variables on environmental pressure variables on inefficiencyinefficiency
SFA (continued)SFA (continued)
SFA (continued)SFA (continued)
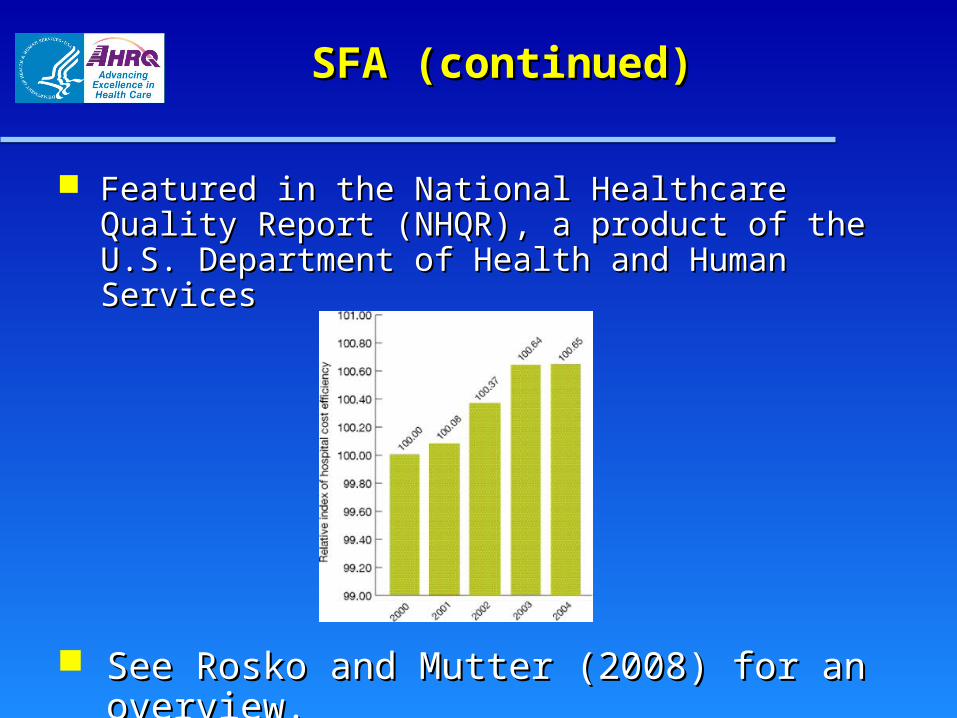
Featured in the National Healthcare Quality Featured in the National Healthcare Quality Report (NHQR), a product of the U.S. Report (NHQR), a product of the U.S. Department of Health and Human ServicesDepartment of Health and Human Services
See Rosko and Mutter (2008) for an overview.See Rosko and Mutter (2008) for an overview.
DataData
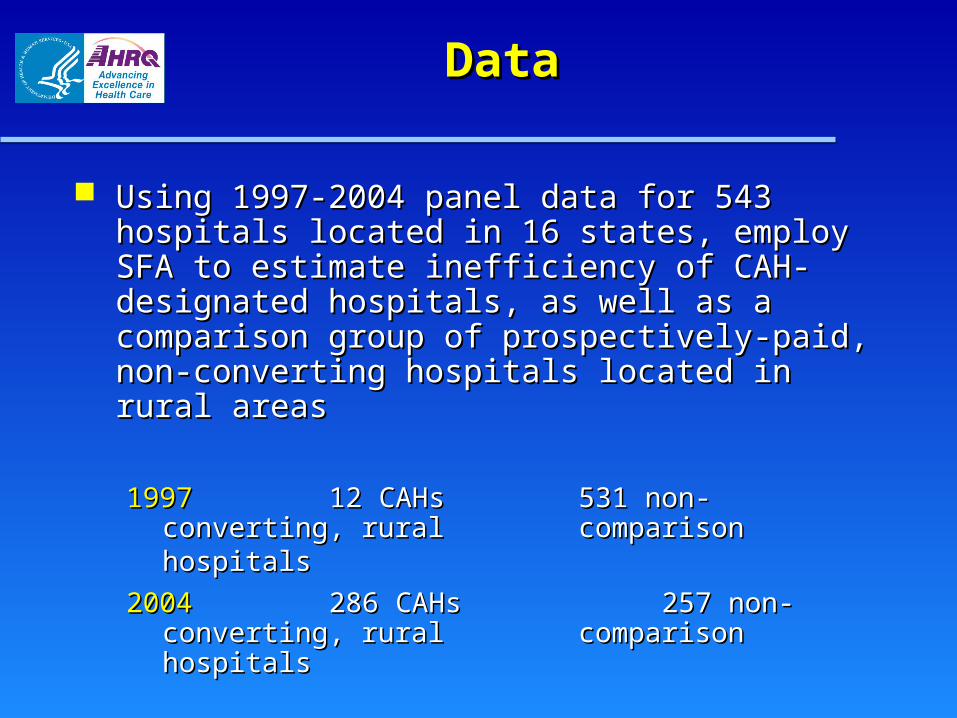
Using 1997-2004 panel data for 543 hospitals Using 1997-2004 panel data for 543 hospitals located in 16 states, employ SFA to estimate located in 16 states, employ SFA to estimate inefficiency of CAH-designated hospitals, as inefficiency of CAH-designated hospitals, as well as a comparison group of prospectively-well as a comparison group of prospectively-paid, non-converting hospitals located in rural paid, non-converting hospitals located in rural areasareas
19971997 12 CAHs12 CAHs 531 non-converting, 531 non-converting, rural rural comparison hospitals comparison hospitals
20042004 286 CAHs 286 CAHs 257 non-converting, 257 non-converting, rural rural comparison hospitals comparison hospitals
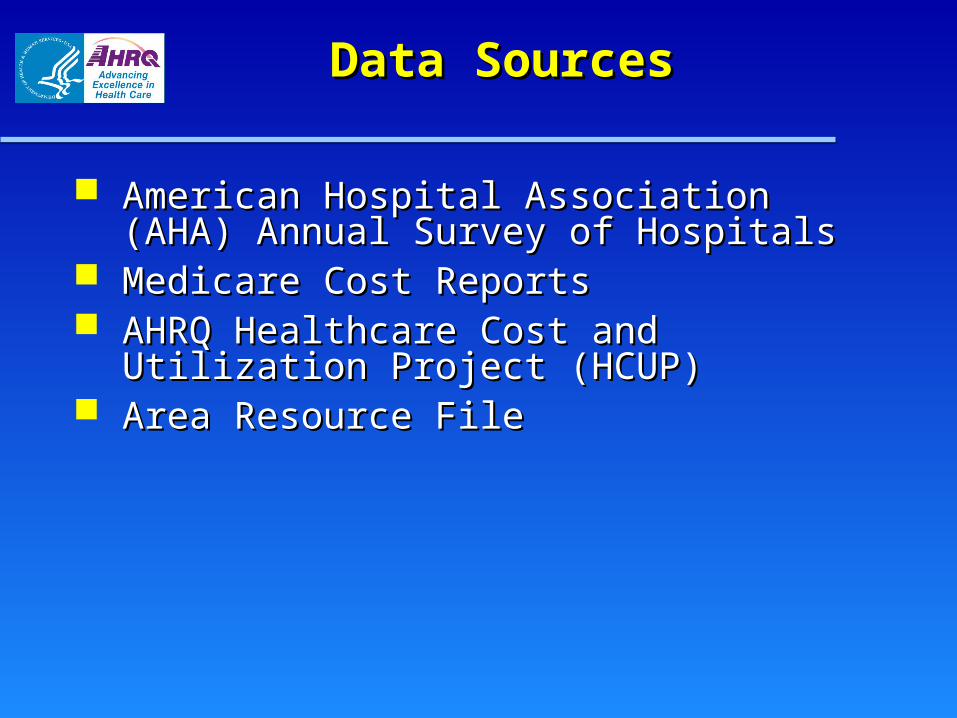
Data SourcesData Sources
American Hospital Association (AHA) Annual American Hospital Association (AHA) Annual Survey of HospitalsSurvey of Hospitals
Medicare Cost ReportsMedicare Cost Reports AHRQ Healthcare Cost and Utilization Project AHRQ Healthcare Cost and Utilization Project
(HCUP)(HCUP) Area Resource FileArea Resource File
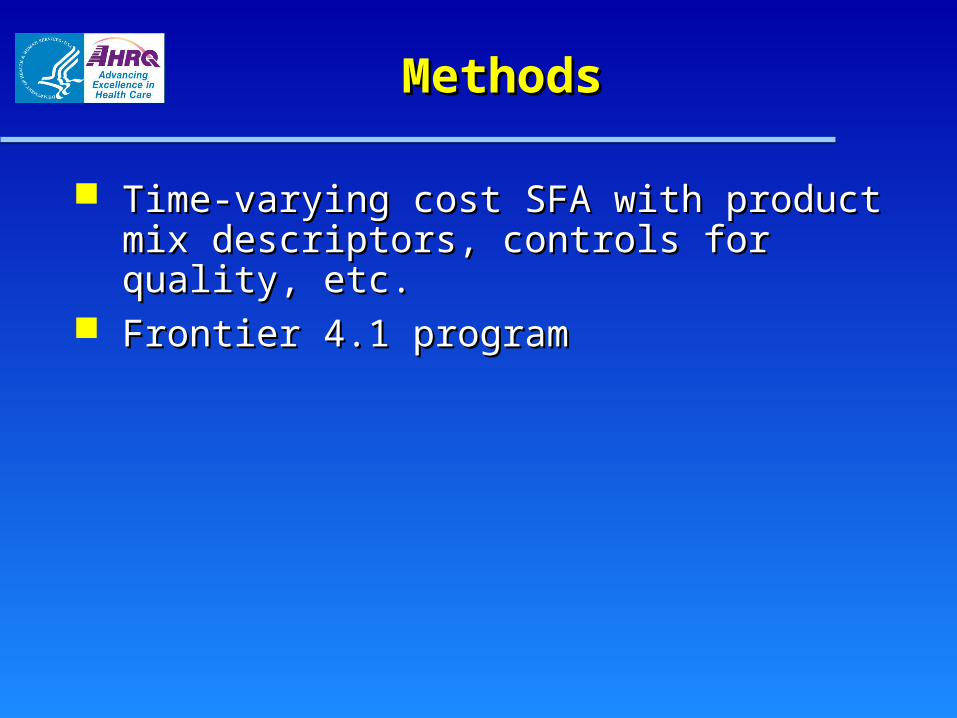
MethodsMethods
Time-varying cost SFA with product mix Time-varying cost SFA with product mix descriptors, controls for quality, etc.descriptors, controls for quality, etc.
Frontier 4.1 programFrontier 4.1 program
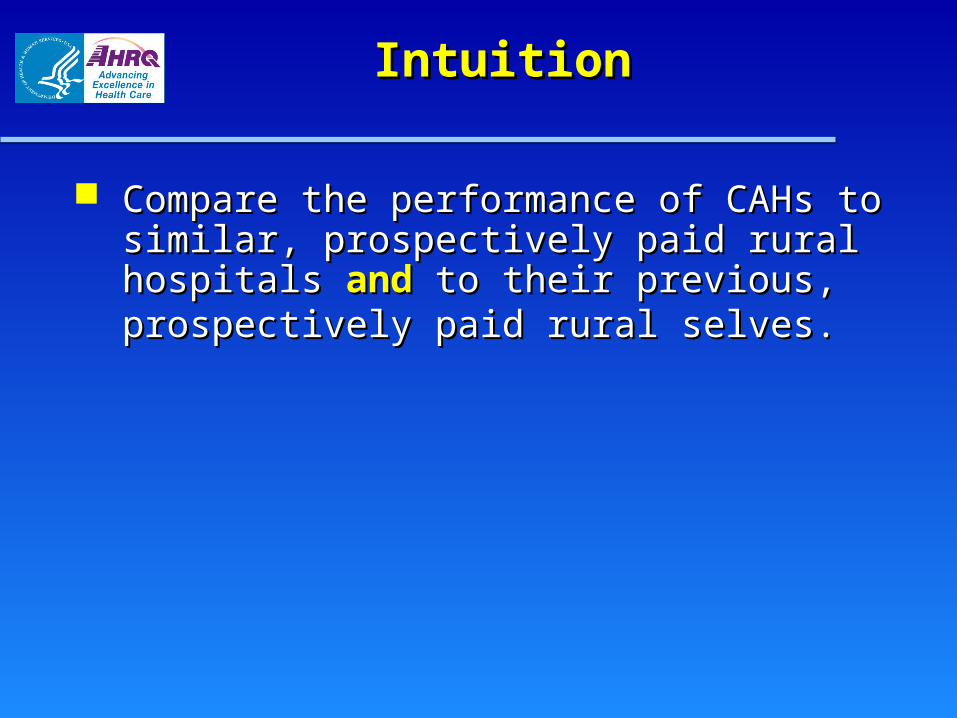
IntuitionIntuition
Compare the performance of CAHs to similar, Compare the performance of CAHs to similar, prospectively paid rural hospitals prospectively paid rural hospitals andand to their to their previous, prospectively paid rural selves.previous, prospectively paid rural selves.
VariablesVariables
Input pricesInput prices
– Price of laborPrice of labor
– Price of capitalPrice of capital OutputsOutputs
– AdmissionsAdmissions
– Outpatient visitsOutpatient visits
– Post-admission inpatient daysPost-admission inpatient days
Variables (continued)Variables (continued)
Product mixProduct mix– Acute care beds / total bedsAcute care beds / total beds– Births / total admissionsBirths / total admissions– ED visits / total outpatient visitsED visits / total outpatient visits– Outpatient surgical operations / total Outpatient surgical operations / total
outpatient visitsoutpatient visits
HCUPHCUP
– A family of health care databases and related A family of health care databases and related software tools and products developed through software tools and products developed through a Federal-State-Industry partnership and a Federal-State-Industry partnership and sponsored by AHRQ.sponsored by AHRQ.
– Includes Includes State Inpatient Databases (SID)State Inpatient Databases (SID), , which contain the universe of inpatient which contain the universe of inpatient discharge abstracts from participating states. discharge abstracts from participating states. Data from 24 states available to the public Data from 24 states available to the public
through the HCUP Central Distributorthrough the HCUP Central Distributor
Variables (continued)Variables (continued)
Variables (continued)Variables (continued)
The AHRQ Quality Indicators (QIs) are measures The AHRQ Quality Indicators (QIs) are measures of health care quality that make use of readily of health care quality that make use of readily available hospital inpatient administrative data, available hospital inpatient administrative data, such as HCUP.such as HCUP.
Free software tools available onlineFree software tools available online IncludesIncludes
– Inpatient Quality Indicators (IQIs)Inpatient Quality Indicators (IQIs), which, which reflect quality of care inside hospitals including reflect quality of care inside hospitals including inpatient mortalityinpatient mortality for medical conditions and for medical conditions and surgical procedures. surgical procedures.
– Patient Safety Indicators (PSIs)Patient Safety Indicators (PSIs), which reflect , which reflect quality of care inside hospitals, but focus on quality of care inside hospitals, but focus on potentially avoidable complicationspotentially avoidable complications and and iatrogenic eventsiatrogenic events. .
Variables (continued)Variables (continued)
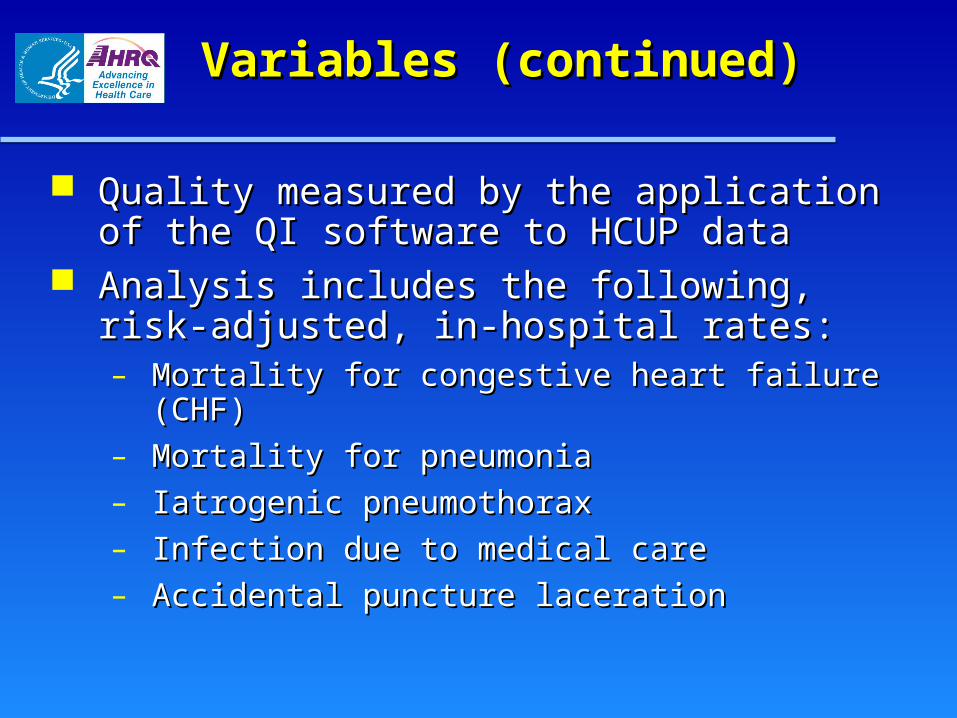
Quality measured by the application of the QI Quality measured by the application of the QI software to HCUP datasoftware to HCUP data
Analysis includes the following, risk-adjusted, in-Analysis includes the following, risk-adjusted, in-hospital rates:hospital rates:– Mortality for congestive heart failure (CHF)Mortality for congestive heart failure (CHF)
– Mortality for pneumoniaMortality for pneumonia
– Iatrogenic pneumothoraxIatrogenic pneumothorax
– Infection due to medical careInfection due to medical care
– Accidental puncture lacerationAccidental puncture laceration

Variables (continued)Variables (continued)
The Comorbidity Software assigns variables The Comorbidity Software assigns variables that identify comorbidities in hospital that identify comorbidities in hospital discharge records using the diagnosis coding discharge records using the diagnosis coding of ICD-9-CM.of ICD-9-CM.
Available for free onlineAvailable for free online
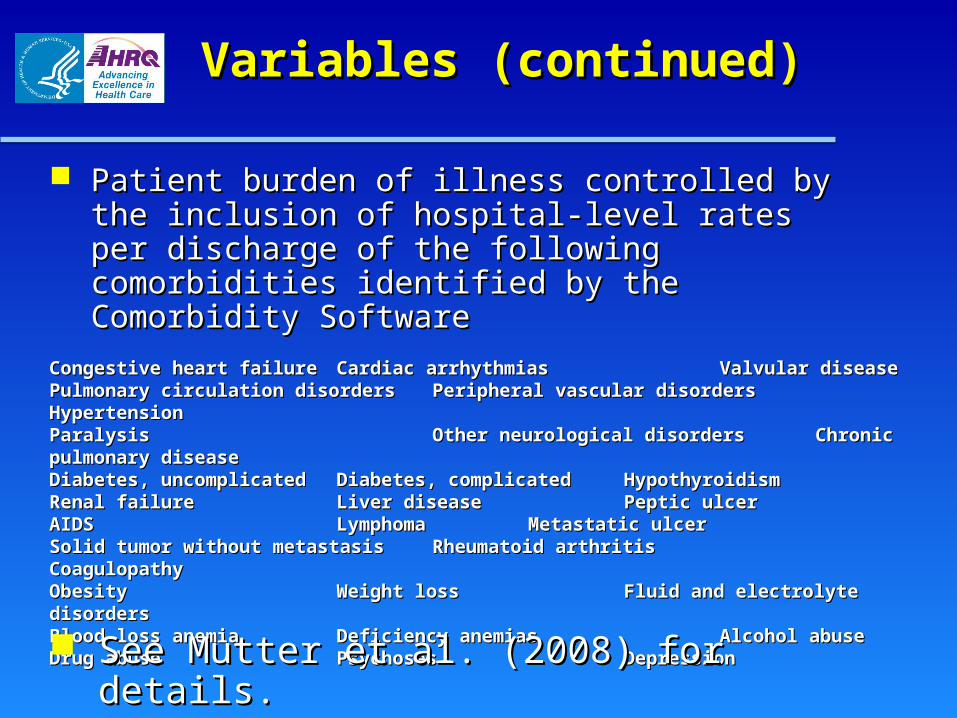
Patient burden of illness controlled by the Patient burden of illness controlled by the inclusion of hospital-level rates per discharge inclusion of hospital-level rates per discharge of the following comorbidities identified by the of the following comorbidities identified by the Comorbidity SoftwareComorbidity Software
Variables (continued)Variables (continued)
Congestive heart failureCongestive heart failure Cardiac arrhythmiasCardiac arrhythmias Valvular diseaseValvular diseasePulmonary circulation disordersPulmonary circulation disordersPeripheral vascular disordersPeripheral vascular disorders HypertensionHypertensionParalysisParalysis Other neurological disordersOther neurological disorders Chronic pulmonary diseaseChronic pulmonary diseaseDiabetes, uncomplicatedDiabetes, uncomplicated Diabetes, complicatedDiabetes, complicated HypothyroidismHypothyroidismRenal failureRenal failure Liver diseaseLiver disease Peptic ulcerPeptic ulcerAIDSAIDS LymphomaLymphoma Metastatic ulcerMetastatic ulcerSolid tumor without metastasisSolid tumor without metastasis Rheumatoid arthritisRheumatoid arthritis CoagulopathyCoagulopathyObesityObesity Weight lossWeight loss Fluid and electrolyte disordersFluid and electrolyte disordersBlood loss anemiaBlood loss anemia Deficiency anemiasDeficiency anemias Alcohol abuseAlcohol abuseDrug abuseDrug abuse PsychosesPsychoses Depression Depression
See Mutter et al. (2008) for details.See Mutter et al. (2008) for details.
Market ForcesMarket Forces
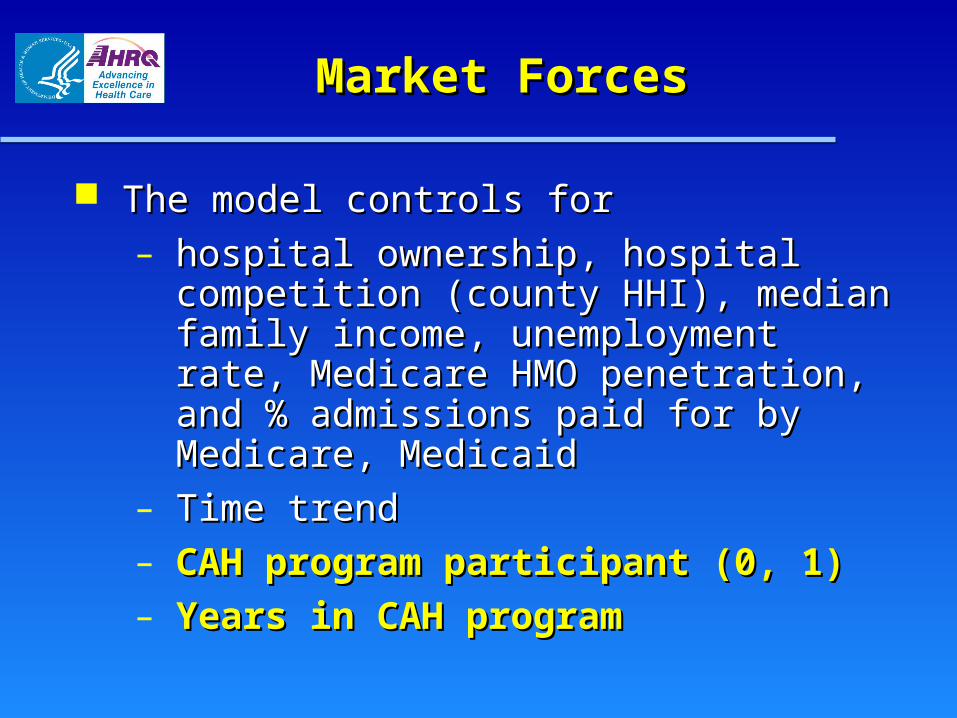
The model controls forThe model controls for
– hospital ownership, hospital competition hospital ownership, hospital competition (county HHI), median family income, (county HHI), median family income, unemployment rate, Medicare HMO unemployment rate, Medicare HMO penetration, and % admissions paid for by penetration, and % admissions paid for by Medicare, MedicaidMedicare, Medicaid
– Time trendTime trend
– CAH program participant (0, 1)CAH program participant (0, 1)
– Years in CAH programYears in CAH program
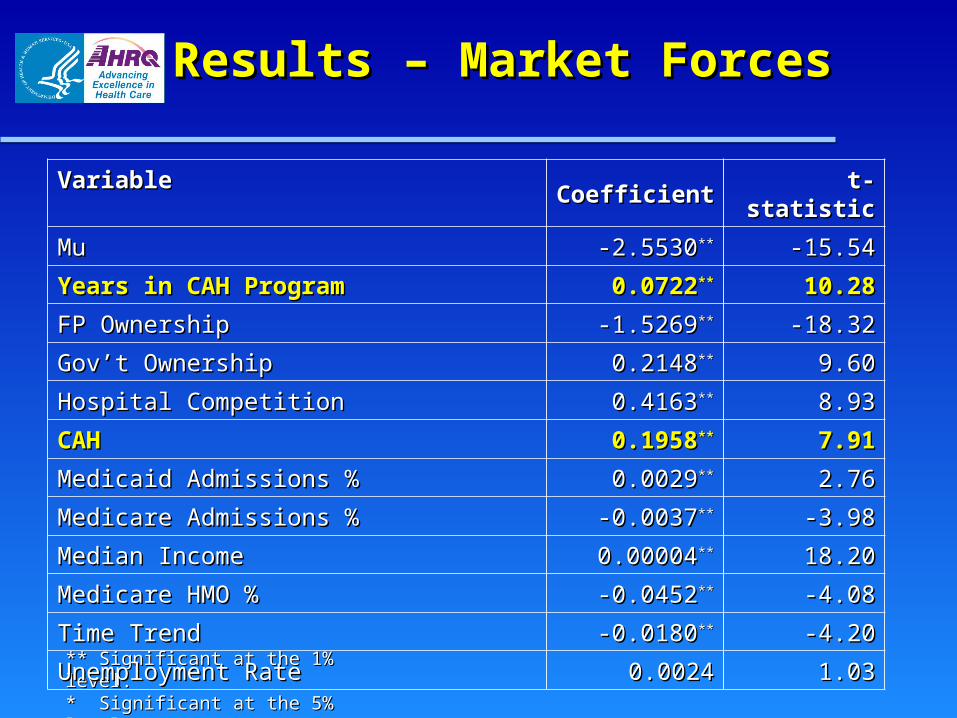
Results – Market ForcesResults – Market Forces
** Significant at the 1% level.** Significant at the 1% level.* Significant at the 5% level.* Significant at the 5% level.
Variable Variable CoefficientCoefficient t-statistict-statistic
MuMu -2.5530-2.5530**** -15.54-15.54
Years in CAH ProgramYears in CAH Program 0.07220.0722**** 10.2810.28
FP OwnershipFP Ownership -1.5269-1.5269**** -18.32-18.32
Gov’t OwnershipGov’t Ownership 0.21480.2148**** 9.609.60
Hospital CompetitionHospital Competition 0.41630.4163**** 8.938.93
CAHCAH 0.19580.1958**** 7.917.91
Medicaid Admissions %Medicaid Admissions % 0.00290.0029**** 2.762.76
Medicare Admissions %Medicare Admissions % -0.0037-0.0037**** -3.98-3.98
Median IncomeMedian Income 0.000040.00004**** 18.2018.20
Medicare HMO %Medicare HMO % -0.0452-0.0452**** -4.08-4.08
Time TrendTime Trend -0.0180-0.0180**** -4.20-4.20
Unemployment RateUnemployment Rate 0.00240.0024 1.031.03
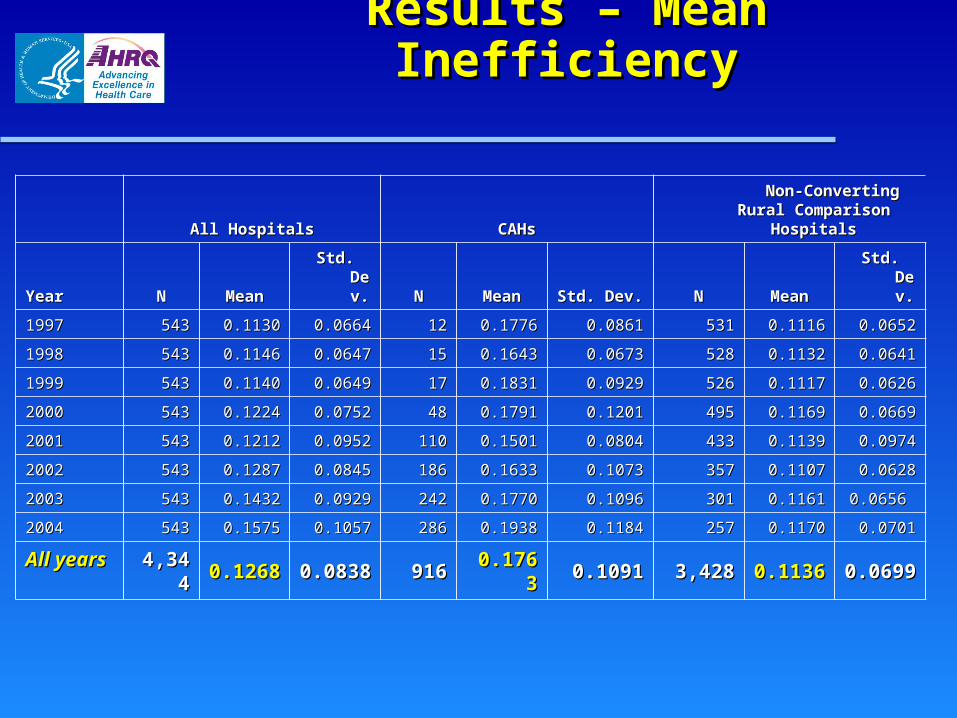
Results – Mean InefficiencyResults – Mean Inefficiency
All HospitalsAll Hospitals CAHsCAHs Non-Converting Rural Non-Converting Rural
Comparison HospitalsComparison Hospitals
YearYear NN MeanMean Std. Dev.Std. Dev. NN MeanMean Std. Dev.Std. Dev. NN MeanMean Std. Dev.Std. Dev.
19971997 543543 0.11300.1130 0.06640.0664 1212 0.17760.1776 0.08610.0861 531531 0.11160.1116 0.06520.0652
19981998 543543 0.11460.1146 0.06470.0647 1515 0.16430.1643 0.06730.0673 528528 0.11320.1132 0.06410.0641
19991999 543543 0.11400.1140 0.06490.0649 1717 0.18310.1831 0.09290.0929 526526 0.11170.1117 0.06260.0626
20002000 543543 0.12240.1224 0.07520.0752 4848 0.17910.1791 0.12010.1201 495495 0.11690.1169 0.06690.0669
20012001 543543 0.12120.1212 0.09520.0952 110110 0.15010.1501 0.08040.0804 433433 0.11390.1139 0.09740.0974
20022002 543543 0.12870.1287 0.08450.0845 186186 0.16330.1633 0.10730.1073 357357 0.11070.1107 0.06280.0628
20032003 543543 0.14320.1432 0.09290.0929 242242 0.17700.1770 0.10960.1096 301301 0.11610.1161 0.0656 0.0656
20042004 543543 0.15750.1575 0.10570.1057 286286 0.19380.1938 0.11840.1184 257257 0.11700.1170 0.07010.0701
All yearsAll years 4,3444,344 0.12680.1268 0.08380.0838 916916 0.17630.1763 0.10910.1091 3,4283,428 0.11360.1136 0.06990.0699
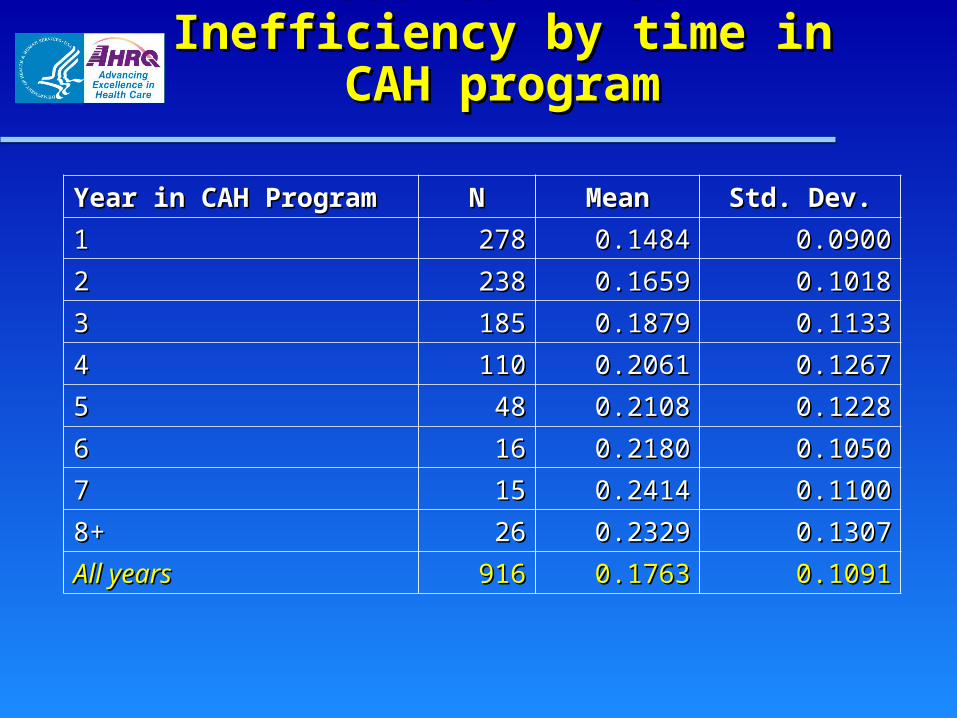
Results – Mean Inefficiency Results – Mean Inefficiency by time in CAH programby time in CAH program
Year in CAH ProgramYear in CAH Program NN MeanMean Std. Dev.Std. Dev.
11 278278 0.14840.1484 0.09000.0900
22 238238 0.16590.1659 0.10180.1018
33 185185 0.18790.1879 0.11330.1133
44 110110 0.20610.2061 0.12670.1267
55 4848 0.21080.2108 0.12280.1228
66 1616 0.21800.2180 0.10500.1050
77 1515 0.24140.2414 0.11000.1100
8+8+ 2626 0.23290.2329 0.13070.1307
All yearsAll years 916916 0.17630.1763 0.10910.1091
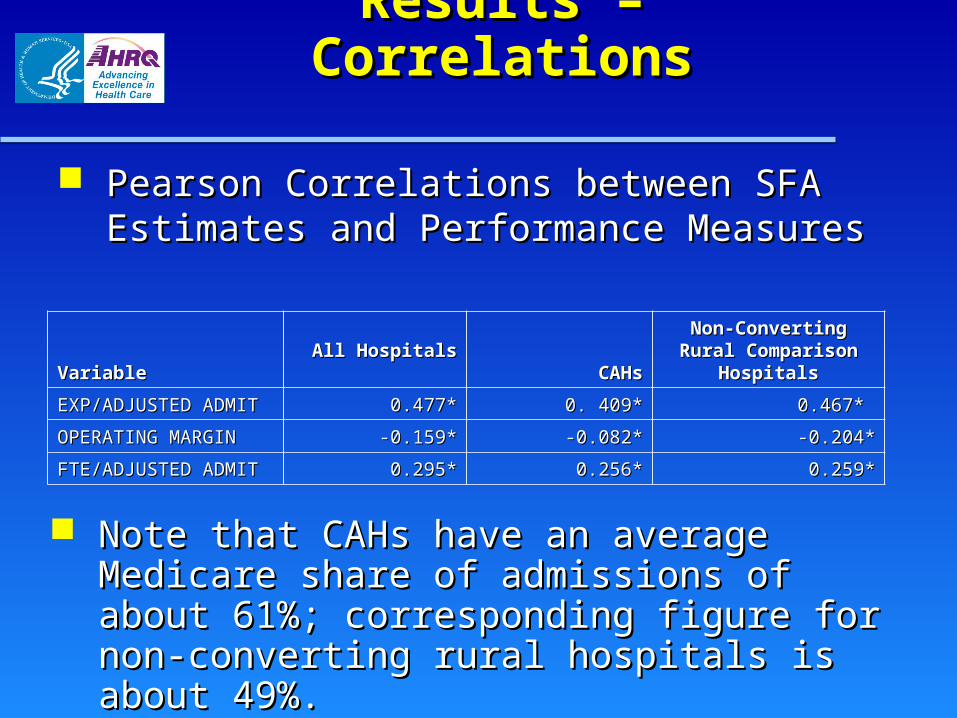
Results – CorrelationsResults – Correlations
Pearson Correlations between SFA Estimates Pearson Correlations between SFA Estimates and Performance Measuresand Performance Measures
VariableVariable All HospitalsAll Hospitals CAHsCAHsNon-Converting Rural Non-Converting Rural Comparison HospitalsComparison Hospitals
EXP/ADJUSTED ADMITEXP/ADJUSTED ADMIT 0.477*0.477* 0. 409*0. 409* 0.467* 0.467*
OPERATING MARGINOPERATING MARGIN -0.159*-0.159* -0.082*-0.082* -0.204*-0.204*
FTE/ADJUSTED ADMITFTE/ADJUSTED ADMIT 0.295*0.295* 0.256*0.256* 0.259*0.259*
Note that CAHs have an average Medicare share Note that CAHs have an average Medicare share of admissions of about 61%; corresponding figure of admissions of about 61%; corresponding figure for non-converting rural hospitals is about 49%.for non-converting rural hospitals is about 49%.
Results – Correlations Results – Correlations (continued) (continued)
Estimated Pearson correlation coefficients (in Estimated Pearson correlation coefficients (in 2004) between SFA-derived inefficiency 2004) between SFA-derived inefficiency measures and commonly used hospital measures and commonly used hospital performance measuresperformance measures– Positive and significant coefficients for Positive and significant coefficients for
expense per adjusted admission and FTE expense per adjusted admission and FTE personnel per adjusted admissionpersonnel per adjusted admission
– Negative and significant correlation between Negative and significant correlation between inefficiency and operating margininefficiency and operating margin Correlation twice as strong in comparison Correlation twice as strong in comparison
group sub-sample in 2004 than in CAH group sub-sample in 2004 than in CAH facilitiesfacilities
Results - QualityResults - Quality
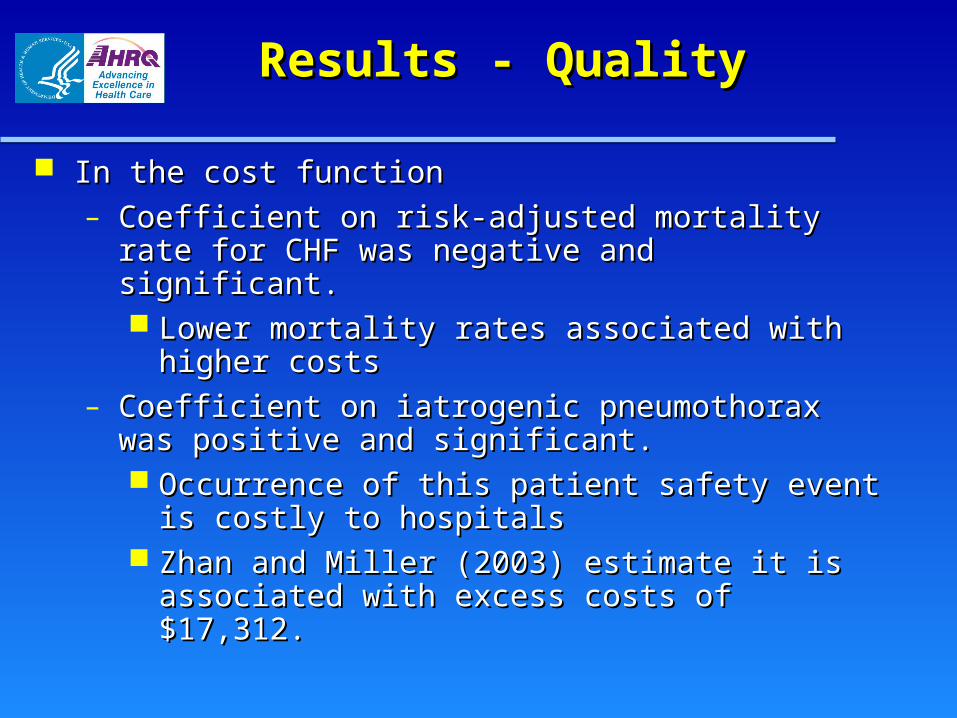
In the cost functionIn the cost function
– Coefficient on risk-adjusted mortality rate for Coefficient on risk-adjusted mortality rate for CHF was negative and significant.CHF was negative and significant. Lower mortality rates associated with Lower mortality rates associated with
higher costshigher costs
– Coefficient on iatrogenic pneumothorax was Coefficient on iatrogenic pneumothorax was positive and significant.positive and significant. Occurrence of this patient safety event is Occurrence of this patient safety event is
costly to hospitalscostly to hospitals Zhan and Miller (2003) estimate it is Zhan and Miller (2003) estimate it is
associated with excess costs of $17,312.associated with excess costs of $17,312.
DiscussionDiscussion
Findings suggest that CAH facilities tend to be Findings suggest that CAH facilities tend to be more cost-inefficient than non-CAH rural more cost-inefficient than non-CAH rural facilitiesfacilities
Discussion (continued)Discussion (continued)
Results could be a reflection of more cost-Results could be a reflection of more cost-inefficient hospitals choosing to convert to inefficient hospitals choosing to convert to CAH statusCAH status
However,However,
– Methodology not only compares CAHs to Methodology not only compares CAHs to similar, prospectively paid rural hospitals, it similar, prospectively paid rural hospitals, it also compares CAHs to their previous, also compares CAHs to their previous, prospectively paid selvesprospectively paid selves
– Findings suggest that CAHs tend to be Findings suggest that CAHs tend to be more cost-inefficient over timemore cost-inefficient over time
Discussion (continuedDiscussion (continued))
Among non-converting hospitals, stronger negative Among non-converting hospitals, stronger negative correlation coefficient between SFA-derived inefficiency correlation coefficient between SFA-derived inefficiency measure and operating margin is not surprisingmeasure and operating margin is not surprising– PPS is intended to reward hospitals financially for cost PPS is intended to reward hospitals financially for cost
containmentcontainment Although highly significant, coefficient was small (-0.204)Although highly significant, coefficient was small (-0.204)
– Variety of factors, among which is efficiency, determine Variety of factors, among which is efficiency, determine profitabilityprofitability
– Cost equation is an abstraction from reality, limiting Cost equation is an abstraction from reality, limiting accuracy of inefficiency estimatesaccuracy of inefficiency estimates
The CAH program has succeeded in its aimsThe CAH program has succeeded in its aims
– Has kept hospitals providing care to under-Has kept hospitals providing care to under-served populations openserved populations open Holmes et al. (2006) find that rural hospital Holmes et al. (2006) find that rural hospital
closure leads to non-trivial decline in per-closure leads to non-trivial decline in per-capita income and employmentcapita income and employment
– Conversion to CAH status is associated with the Conversion to CAH status is associated with the provision of higher quality careprovision of higher quality care
But possible result of cost-based payment solution is But possible result of cost-based payment solution is increased inefficiency, which can fuel already increased inefficiency, which can fuel already escalating expendituresescalating expenditures
Discussion (continued)Discussion (continued)
Discussion (continued)Discussion (continued)
The challenge is to find a payment mechanism that provides The challenge is to find a payment mechanism that provides incentives for efficiency yet allows providers to maintain fiscal incentives for efficiency yet allows providers to maintain fiscal viability.viability.– Why did small rural hospitals suffer so much under PPS?Why did small rural hospitals suffer so much under PPS?
Is PPS inherently ill-suited for these types of hospitals?Is PPS inherently ill-suited for these types of hospitals? Could PPS work for these hospitals if payment levels Could PPS work for these hospitals if payment levels
were higher?were higher?– Perhaps the solution is to retain cost-based payment but Perhaps the solution is to retain cost-based payment but
to pay on the basis of historical coststo pay on the basis of historical costs