Embed Size (px)
Citation preview
Research Journal of Applied Sciences, Engineering and Technology 3(5): 464-470, 2011ISSN: 2040-7467© Maxwell Scientific Organization, 2011Received: May 07, 2011 Accepted: May 09, 2011 Published: May 25, 2011
Corresponding Author: Majid Namdari, Department of Agricultural Machinery Engineering, Faculty of Agricultural Engineeringand Technology, University of Tehran, Karaj, Iran. Tel: (+98) 2612801011; Fax: (+98) 2612808138
464
Econometric Model Estimation and Sensitivity Analysis of Inputs for MandarinProduction in Mazandaran Province of Iran
1Majid Namdari, 2Ali Asadi Kangarshahi and 2Negin Akhlaghi Amiri1Department of Agricultural Machinery Engineering, Faculty of Agricultural Engineering and
Technology, University of Tehran, Karaj, Iran2Agricultural and Natural Resources Research Center of Mazandaran, Iran
Abstract: This study examines energy consumption of inputs and output used in mandarin production, and tofind relationship between energy inputs and yield in Mazandaran, Iran. Also the Marginal Physical Product(MPP) method was used to analyze the sensitivity of energy inputs on mandarin yield and returns to scale ofeconometric model was calculated. For this purpose, the data were collected from 110 mandarin orchards whichwere selected based on random sampling method. The results indicated that total energy inputs were 77501.17MJ/ha. The energy use efficiency, energy productivity and net energy of mandarin production were found as0.77, 0.41 kg/MJ and -17651.17 MJ/ha. About 41% of the total energy inputs used in mandarin production wasindirect while about 59% was direct. Econometric estimation results revealed that the impact of human laborenergy (0.37) was found the highest among the other inputs in mandarin production. The results also showedthat direct, indirect and renewable and non-renewable, energy forms had a positive and statistically significantimpact on output level. The results of sensitivity analysis of the energy inputs showed that with an additionaluse of 1 MJ of each of the human labor, farmyard manure and chemical fertilizers energy would lead to anincrease in yield by 2.05, 1.80 and 1.26 kg, respectively. The results also showed that the MPP value of directand renewable energy were higher.
Key words: Energy use efficiency, human labor, mandarin yield, sensitivity
INTRODUCTION
In recent years there has been increasing publicdebate on the effects of agricultural production on theenvironment. One major concern of the debate is the useof energy in agriculture. Owing to the high energyconsumption during the production of agricultural inputs,in particular non-renewable inputs, it is often questionedas to whether agricultural production is still energyefficient (Kuesters and Lammel, 1999). Therefore, It canbe expected that energy budget would be useful not onlyfor reducing negative effects to environment, humanhealth, maintaining sustainability and decreasingproduction costs, but also for providing higher energy useefficiency (Banaeian and Zangeneh, 2011). The energybudget provides sufficient data to establish functionalforms to investigate the relationship between energyinputs and outputs. Estimating these functional forms isvery useful in terms of determining elasticities of inputson yield and production (Hatirli et al., 2006).
Several studies have been conducted on the use ofenergy in agriculture with respect to efficient andeconomic uses of energy for sustainable production
(Ozkan et al., 2004a, b; Yilmaz et al., 2005;Erdal et al., 2007; Esengun et al., 2007;Mohammadi et al., 2008; Kizilaslan, 2009;Zangeneh et al., 2010; Namdari, 2011). But little attentionhas been given to the relationships between input energyand yield using functional forms in these research studieswhere energy use in agriculture was examined.Hatirli et al. (2006) for greenhouse tomato,Mohammadi et al. (2010) for kiwifruit, Rafieeet al. (2010) for apple, Mobtaker et al. (2010) for barley,Banaeian and Zangeneh (2011) for walnut production,investigated energy inputs and crop yield relationship todevelop and estimate an econometric model. Althoughmany studies are conducted on energy use in agriculturalcrops, there are not any studies on the energy analysis ofmandarin production in Iran.
The aims of this research were to develop andestimate an econometric model for mandarin productionin Mazandaran province of Iran. Once estimated, themodel is expected to show the relationship betweenenergy inputs and yield providing energy input elasticitieson yield. Furthermore, this study seeks to analyze theeffect of indirect and direct energy consumption on yield
Res. J. Appl. Sci. Eng. Technol., 3(5): 464-470, 2011
465
Table 1: Energy equivalent of inputs and outputs in agricultural productionParticulars Unit Energy equivalent (MJ/unit) ReferenceA. Inputs1. Human labor h 1.96 (Ozkan et al., 2004a)2. Machinery h 62.70 (Ozkan et al., 2004a)3. Diesel fuel l 56.31 (Mohammadi et al., 2010)4. Chemical fertilizers kg
Nitrogen (N) 66.14 (Mohammadi et al., 2010)Phosphate (P2O5) 12.44 (Mohammadi et al., 2010)Potassium (K2O) 11.15 (Mohammadi et al., 2010)
5. Farmyard manure kg 0.30 (Mohammadi et al., 2010)6. Chemicals kg 120 (Mohammadi et al., 2010)7. Electricity kWh 11.93 (Ozkan et al., 2004a)8. Water for irrigation m3 1.02 (Mohammadi et al., 2010)B. Outputs1. Mandarin kg 1.90 (Ozkan et al., 2004a)
using functional form. In addition to these, it was also anaim to calculate energy use efficiency, energyproductivity, and specific energy used in mandarinproduction.
MATERIALS AND METHODS
In this study, mandarin growers were surveyed in 110orchards from Mazandaran province, Iran. TheMazandaran province is located in the north of Iran,within 31º47! and 38º05! North latitude and 50º34! and56º14! East longitude. The size of sample of eachstratification was determined Neyman technique(Rafiee et al., 2010). Data were collected by using a face-to-face questionnaire performed. The inputs such as fuel,electricity, machinery, water for irrigation, chemicalfertilizer and chemicals take significant share of theenergy supplies in the production system of modernagriculture (Hatirli et al., 2006). The amounts of inputwere calculated per hectare and then, these input datawere multiplied with the coefficient of energy equivalent.Energy equivalents’ coefficients were calculated based onprevious studies (Table1). Table 1 showed energyequivalents were used for estimating inputs and outputenergies in mandarin production.
The energetic efficiency of the agricultural systemhas been evaluated by the energy ratio between the outputand the inputs (Zangeneh et al., 2010). Some energyparameters in mandarin production such as: the energyuse efficiency (energy ratio), the energy productivity, thespecific energy and net energy gain, were calculatedbased on the following functions (Ozkan et al., 2004a):
Energy use efficiency = Energy output (MJ/ha) / Energy input (MJ/ha) (1)
Energy productivity = Mandarin output (kg/ha) / Energy input (MJ/ha) (2)
Specific energy = Energy input (MJ/ha) / Mandarin output(kg/ha) (3)
Net energy = Energy output (MJ/ha) / Energy input(MJ/ha) (4)
In order to analyze the relationship between energyinputs and energy output, different functions wereinvestigated and with respect to the experiments related toselecting optimized functions (Mohammadi et al., 2010).Several authors used Cobb-Douglas function, because thisfunction produced better results among the others(Hatirli et al., 2006; Rafiee et al., 2010;Mohammadi et al., 2010; Mobtaker et al., 2010;Banaeian and Zangeneh, 2011). The Cobb-Douglasproduction function is expressed as follows(Gujarati, 1995):
(5)Y f x= ( )exp( )µ
In this study, it is assumed that if there is no inputenergy, the output energy is also zero. The sameassumption also was made by other authors(Hatirli et al., 2006; Rafiee et al., 2010; Mohammadiet al., 2010). Eq. (6) is expanded in accordance with theassumption that the yield is a function of energy inputs(Mohammadi and Omid, 2010):
ln Yi = a1 ln X1 + a2 ln X2 + a3 ln X3 + a4 ln X4 + a5 lnX5 + a6 ln X6 + a7 ln X7 + a8 ln X8 + ei (6)
where, Xi (i = 1, 2 ,…, 9) stand for input energies fromhuman labor (X1), machinery (X2), diesel fuel (X3),farmyard manure (X4), chemical fertilizer (X5), chemicals(X6), electricity (X7) and water for irrigation (X8). Withrespect to this pattern, by using (6), the impact of theenergy of each input on the output energy was studied. Inaddition the impacts of Direct Energy (DE) and IndirectEnergy (IDE) items and Renewable Energy (RE) andNon-renewable Energy (NRE) items on the yield wereinvestigated. Indirect energy included energy embodied infertilizers, farmyard manure, chemical and machinerywhile direct energy covered human labor, diesel fuel,electricity and water for irrigation used in the mandarinproduction process. Non-renewable energy consists ofdiesel, chemicals, fertilizers and machinery energies and
Res. J. Appl. Sci. Eng. Technol., 3(5): 464-470, 2011
466
Table 2: Amounts of inputs and output in mandarin productionInputs (unit) Quantity per unit area (ha) Total energy Equivalent (MJ/ha)A. Inputs1.Human labor (h) 1386.00 2716.562.Machinery (h) 72.00 4514.403.Diesel fuel (l) 330.00 18582.304.Chemical fertilizer (kg) 17474.85
Nitrogen 135.00 8928.90Phosphate 415.00 5992.60Potassium 229.00 2553.35
5.Farmyard manure (kg) 20500.00 6150.00Chemicals (kg) 3777.60Pesticides 5.00 995.00Fungicides 3.60 331.20Herbicides 10.30 2451.40
6.Electricity (kWh) 542.00 6466.067.Water for irrigation (m3) 17470.00 17819.40Total energy input (MJ) - 77501.17B. Output1.Mandarin (kg) 31500.00 59850.00
renewable energy includes human labor, farmyard manureand water for irrigation energies. For this purpose, Cobb-Douglas function was specified in the following form:
ln Yi = $0 + $1 ln DE + $2 ln IDE + ei (7)ln Yi = (0 + (1 ln RE + (2 ln NRE + ei (8)
Where; Yi is the ith farm’s yield, $i and (i are thecoefficients of exogenous variables. DE, IDE, RE andNRE are direct, indirect, renewable and non-renewableenergy forms respectively.
In the Cobb-Douglas production function, If the sumof the coefficients (returns to scale) is greater than unity,this means that the increasing returns to scale, andif the latter parameter is less than unity, this meansthat the decreasing returns to scale; and, if theresult is unity, it shows that the constant returns to scale(Singh et al., 2004).
In the last part of the research, the Marginal PhysicalProductivity (MPP) method, based on the responsecoefficients of the inputs was utilized to analyze thesensitivity of energy inputs on mandarin yield. Thesensitivity analysis of an input imposes the change in theoutput level with a unit change in the input in model,assuming that all other inputs are constant at theirgeometric mean level (Mobtaker et al., 2010). A positivevalue of MPP of any input variable indicates that the totaloutput is increasing with an increase in input; so, oneshould not stop increasing the use of variable inputs solong as the fixed resource is not fully utilized. A negativevalue of MPP of any variable input identifies thatadditional unit of input starts to diminish the total outputof previous units; therefore, it is better to keep thevariable resource in surplus rather than utilizing it as afixed resource (Banaeian and Zangeneh, 2011). The MPPof the various inputs was calculated using the "j of thevarious energy inputs as follow (Singh et al., 2004):
MPPxj = [GM (Y) / GM (Xj) ] × "j (9)
where; MPPxj is MPP of jth input; "j, regressioncoefficient of jth input; GM(Y), geometric mean of yield;and GM(Xj), geometric mean of jth input energy on perhectare basis.
RESULTS AND DISCUSSION
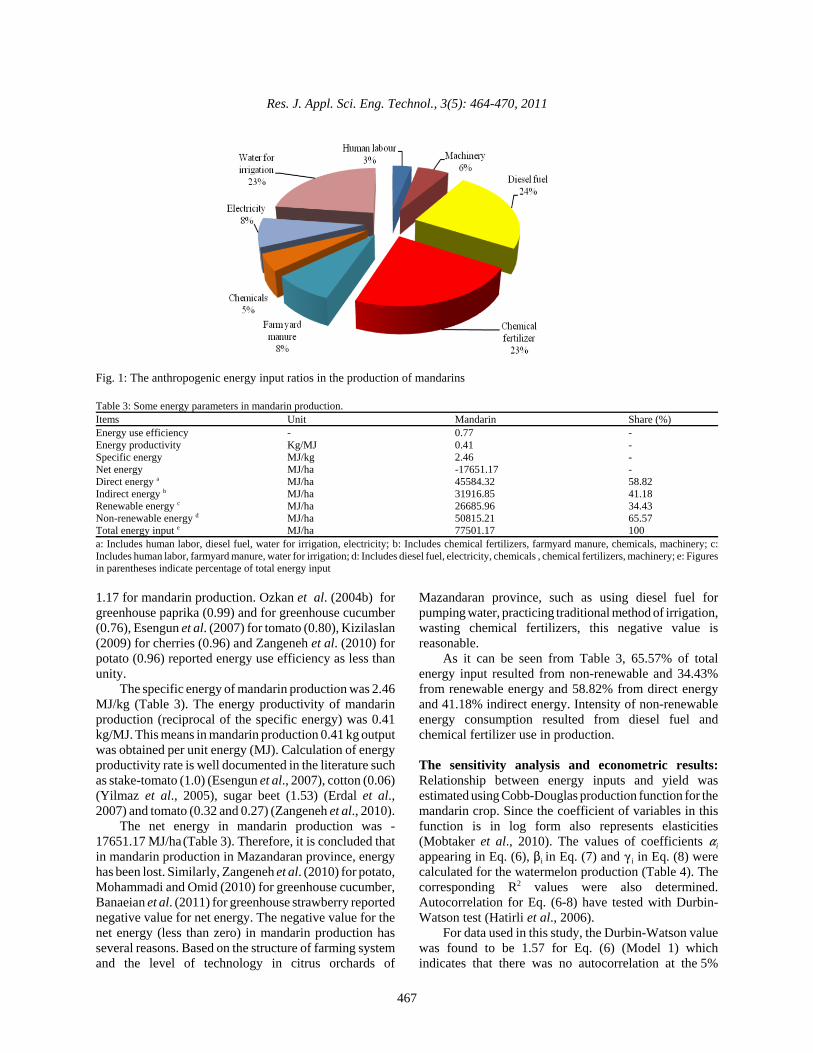
Analysis of input-output energy use in mandarinproduction: Table 2 shows the physical inputs used andoutput in mandarin orchards in the surveyed area, andtheir energy equivalents with output energy rates and theirequivalents. Also, in Fig. 1, distribution of theanthropogenic energy input ratios in the production ofmandarins are given.
As it can be seen in the Table 2, total energy used invarious farm operations during mandarin production was59850 MJ/ha. Diesel energy consumes about 24% of totalenergy followed by chemical fertilizer (about 23%) andwater for irrigation (about 23%) during production period(Fig. 1). In addition to these inputs energy consumptions,ratios of farmyard manure, electricity, machinery,chemicals and human labor, within total input energywere 8, 8, 6, 5 and 3%, respectively. The diesel energywas mainly utilized for pumping water and operatingtractors for performing the various farm operations suchas land preparation, cultural practices and transportation.Mohammadi et al. (2008) for potato production,Ozkan et al. (2004 a) for orange, mandarin and lemonproductions, Yilmaz et al. (2005) for cotton,Esengun et al. (2007) for stake-tomato andBanaeian et al. (2011) for greenhouse strawberry reportedthat the highest energy input is provided by diesel fuelfollowed by fertilizers.
Average annual yield of orchards investigated was31.50 tons/ha. The energy use efficiency, specific energy,energy productivity and net energy gain of mandarinproduction in the Mazandaran province are tabulatedin Table 3. Energy use efficiency (energy ratio)was calculated as 0.77. In previous investigations,Ozkan et al. (2004a) in Turkey calculated energy ratio as
Res. J. Appl. Sci. Eng. Technol., 3(5): 464-470, 2011
467
Fig. 1: The anthropogenic energy input ratios in the production of mandarins
Table 3: Some energy parameters in mandarin production.Items Unit Mandarin Share (%)Energy use efficiency - 0.77 -Energy productivity Kg/MJ 0.41 -Specific energy MJ/kg 2.46 -Net energy MJ/ha -17651.17 -Direct energy a MJ/ha 45584.32 58.82Indirect energy b MJ/ha 31916.85 41.18Renewable energy c MJ/ha 26685.96 34.43Non-renewable energy d MJ/ha 50815.21 65.57Total energy input e MJ/ha 77501.17 100a: Includes human labor, diesel fuel, water for irrigation, electricity; b: Includes chemical fertilizers, farmyard manure, chemicals, machinery; c:Includes human labor, farmyard manure, water for irrigation; d: Includes diesel fuel, electricity, chemicals , chemical fertilizers, machinery; e: Figuresin parentheses indicate percentage of total energy input
1.17 for mandarin production. Ozkan et al. (2004b) forgreenhouse paprika (0.99) and for greenhouse cucumber(0.76), Esengun et al. (2007) for tomato (0.80), Kizilaslan(2009) for cherries (0.96) and Zangeneh et al. (2010) forpotato (0.96) reported energy use efficiency as less thanunity.
The specific energy of mandarin production was 2.46MJ/kg (Table 3). The energy productivity of mandarinproduction (reciprocal of the specific energy) was 0.41kg/MJ. This means in mandarin production 0.41 kg outputwas obtained per unit energy (MJ). Calculation of energyproductivity rate is well documented in the literature suchas stake-tomato (1.0) (Esengun et al., 2007), cotton (0.06)(Yilmaz et al., 2005), sugar beet (1.53) (Erdal et al.,2007) and tomato (0.32 and 0.27) (Zangeneh et al., 2010).
The net energy in mandarin production was -17651.17 MJ/ha (Table 3). Therefore, it is concluded thatin mandarin production in Mazandaran province, energyhas been lost. Similarly, Zangeneh et al. (2010) for potato,Mohammadi and Omid (2010) for greenhouse cucumber,Banaeian et al. (2011) for greenhouse strawberry reportednegative value for net energy. The negative value for thenet energy (less than zero) in mandarin production hasseveral reasons. Based on the structure of farming systemand the level of technology in citrus orchards of
Mazandaran province, such as using diesel fuel forpumping water, practicing traditional method of irrigation,wasting chemical fertilizers, this negative value isreasonable.
As it can be seen from Table 3, 65.57% of totalenergy input resulted from non-renewable and 34.43%from renewable energy and 58.82% from direct energyand 41.18% indirect energy. Intensity of non-renewableenergy consumption resulted from diesel fuel andchemical fertilizer use in production.
The sensitivity analysis and econometric results:Relationship between energy inputs and yield wasestimated using Cobb-Douglas production function for themandarin crop. Since the coefficient of variables in thisfunction is in log form also represents elasticities(Mobtaker et al., 2010). The values of coefficients "iappearing in Eq. (6), $i in Eq. (7) and (i in Eq. (8) werecalculated for the watermelon production (Table 4). Thecorresponding R2 values were also determined.Autocorrelation for Eq. (6-8) have tested with Durbin-Watson test (Hatirli et al., 2006).
For data used in this study, the Durbin-Watson valuewas found to be 1.57 for Eq. (6) (Model 1) whichindicates that there was no autocorrelation at the 5%
Res. J. Appl. Sci. Eng. Technol., 3(5): 464-470, 2011
468
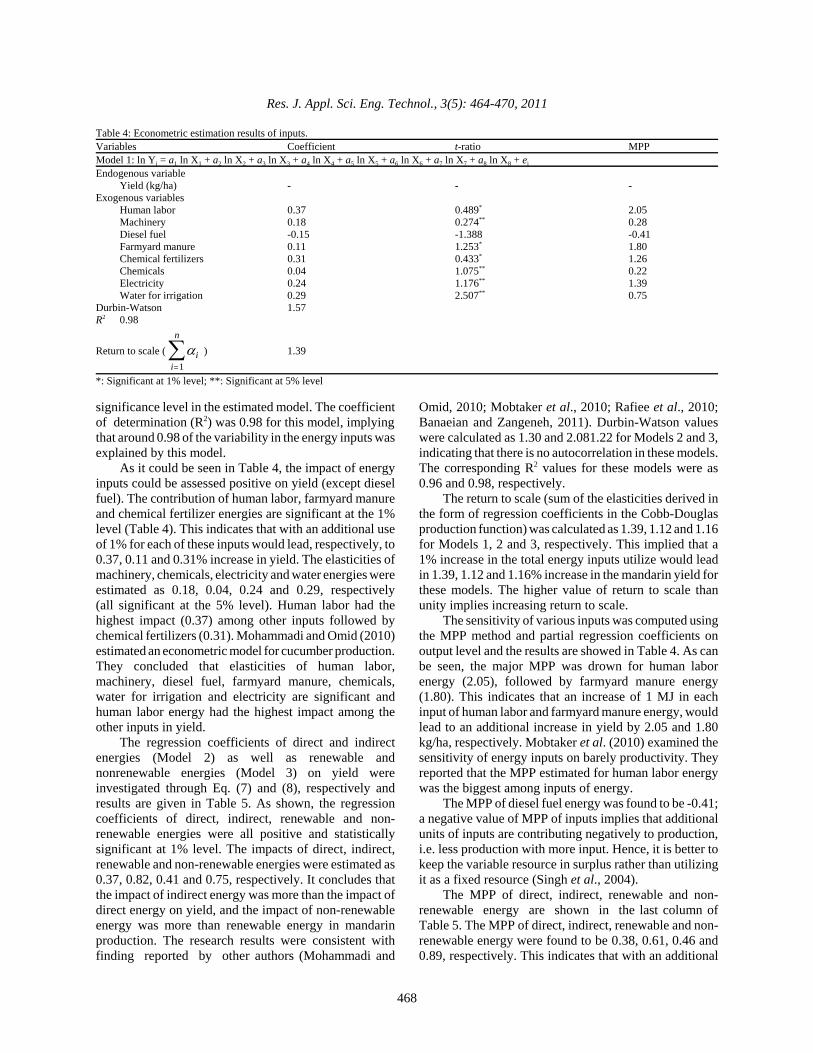
Table 4: Econometric estimation results of inputs.Variables Coefficient t-ratio MPPModel 1: ln Yi = a1 ln X1 + a2 ln X2 + a3 ln X3 + a4 ln X4 + a5 ln X5 + a6 ln X6 + a7 ln X7 + a8 ln X8 + ei
Endogenous variableYield (kg/ha) - - -
Exogenous variablesHuman labor 0.37 0.489* 2.05Machinery 0.18 0.274** 0.28Diesel fuel -0.15 -1.388 -0.41Farmyard manure 0.11 1.253* 1.80Chemical fertilizers 0.31 0.433* 1.26Chemicals 0.04 1.075** 0.22Electricity 0.24 1.176** 1.39Water for irrigation 0.29 2.507** 0.75
Durbin-Watson 1.57R2 0.98
Return to scale ( ) 1.39αii
n
=∑
1*: Significant at 1% level; **: Significant at 5% level
significance level in the estimated model. The coefficientof determination (R2) was 0.98 for this model, implyingthat around 0.98 of the variability in the energy inputs wasexplained by this model.
As it could be seen in Table 4, the impact of energyinputs could be assessed positive on yield (except dieselfuel). The contribution of human labor, farmyard manureand chemical fertilizer energies are significant at the 1%level (Table 4). This indicates that with an additional useof 1% for each of these inputs would lead, respectively, to0.37, 0.11 and 0.31% increase in yield. The elasticities ofmachinery, chemicals, electricity and water energies wereestimated as 0.18, 0.04, 0.24 and 0.29, respectively(all significant at the 5% level). Human labor had thehighest impact (0.37) among other inputs followed bychemical fertilizers (0.31). Mohammadi and Omid (2010)estimated an econometric model for cucumber production.They concluded that elasticities of human labor,machinery, diesel fuel, farmyard manure, chemicals,water for irrigation and electricity are significant andhuman labor energy had the highest impact among theother inputs in yield.
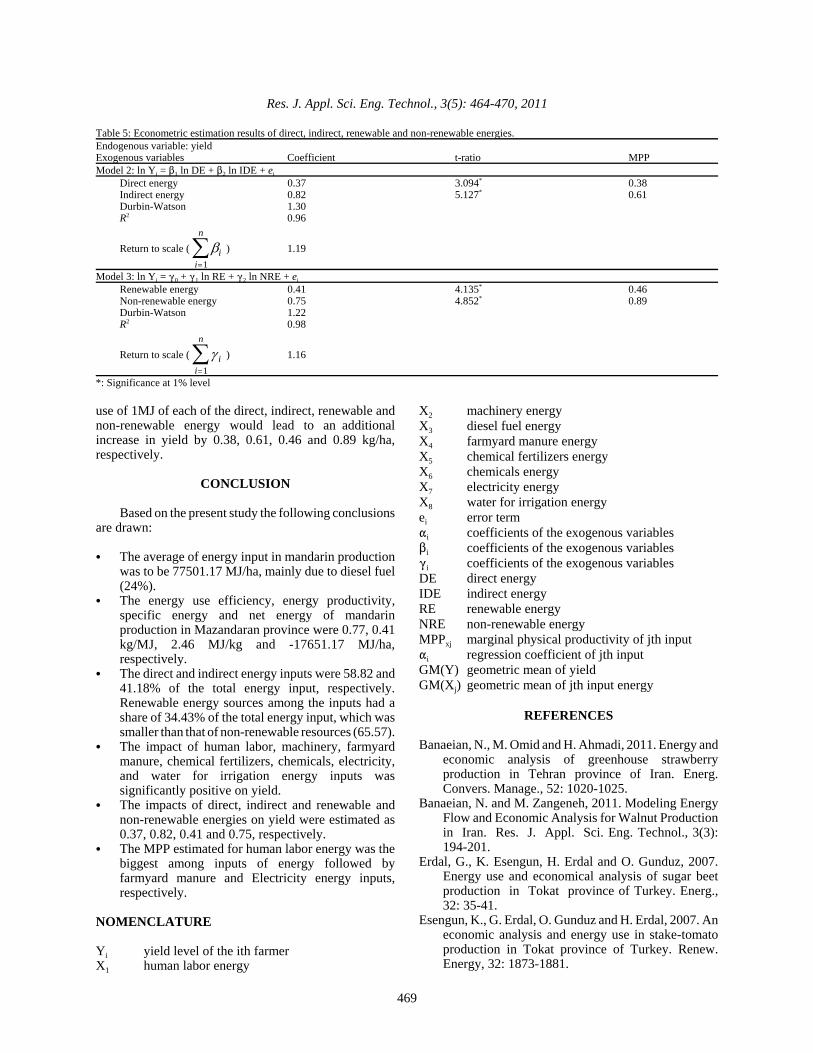
The regression coefficients of direct and indirectenergies (Model 2) as well as renewable andnonrenewable energies (Model 3) on yield wereinvestigated through Eq. (7) and (8), respectively andresults are given in Table 5. As shown, the regressioncoefficients of direct, indirect, renewable and non-renewable energies were all positive and statisticallysignificant at 1% level. The impacts of direct, indirect,renewable and non-renewable energies were estimated as0.37, 0.82, 0.41 and 0.75, respectively. It concludes thatthe impact of indirect energy was more than the impact ofdirect energy on yield, and the impact of non-renewableenergy was more than renewable energy in mandarinproduction. The research results were consistent withfinding reported by other authors (Mohammadi and
Omid, 2010; Mobtaker et al., 2010; Rafiee et al., 2010;Banaeian and Zangeneh, 2011). Durbin-Watson valueswere calculated as 1.30 and 2.081.22 for Models 2 and 3,indicating that there is no autocorrelation in these models.The corresponding R2 values for these models were as0.96 and 0.98, respectively.
The return to scale (sum of the elasticities derived inthe form of regression coefficients in the Cobb-Douglasproduction function) was calculated as 1.39, 1.12 and 1.16for Models 1, 2 and 3, respectively. This implied that a1% increase in the total energy inputs utilize would leadin 1.39, 1.12 and 1.16% increase in the mandarin yield forthese models. The higher value of return to scale thanunity implies increasing return to scale.
The sensitivity of various inputs was computed usingthe MPP method and partial regression coefficients onoutput level and the results are showed in Table 4. As canbe seen, the major MPP was drown for human laborenergy (2.05), followed by farmyard manure energy(1.80). This indicates that an increase of 1 MJ in eachinput of human labor and farmyard manure energy, wouldlead to an additional increase in yield by 2.05 and 1.80kg/ha, respectively. Mobtaker et al. (2010) examined thesensitivity of energy inputs on barely productivity. Theyreported that the MPP estimated for human labor energywas the biggest among inputs of energy.
The MPP of diesel fuel energy was found to be -0.41;a negative value of MPP of inputs implies that additionalunits of inputs are contributing negatively to production,i.e. less production with more input. Hence, it is better tokeep the variable resource in surplus rather than utilizingit as a fixed resource (Singh et al., 2004).
The MPP of direct, indirect, renewable and non-renewable energy are shown in the last column ofTable 5. The MPP of direct, indirect, renewable and non-renewable energy were found to be 0.38, 0.61, 0.46 and0.89, respectively. This indicates that with an additional
Res. J. Appl. Sci. Eng. Technol., 3(5): 464-470, 2011
469
Table 5: Econometric estimation results of direct, indirect, renewable and non-renewable energies.Endogenous variable: yieldExogenous variables Coefficient t-ratio MPPModel 2: ln Yi = $1 ln DE + $2 ln IDE + ei
Direct energy 0.37 3.094* 0.38Indirect energy 0.82 5.127* 0.61Durbin-Watson 1.30R2 0.96
Return to scale ( ) 1.19βii
n
=∑
1Model 3: ln Yi = (0 + (1 ln RE + (2 ln NRE + ei
Renewable energy 0.41 4.135* 0.46Non-renewable energy 0.75 4.852* 0.89Durbin-Watson 1.22R2 0.98
Return to scale ( ) 1.16γ ii
n
=∑
1*: Significance at 1% level
use of 1MJ of each of the direct, indirect, renewable andnon-renewable energy would lead to an additionalincrease in yield by 0.38, 0.61, 0.46 and 0.89 kg/ha,respectively.
CONCLUSION
Based on the present study the following conclusionsare drawn:
C The average of energy input in mandarin productionwas to be 77501.17 MJ/ha, mainly due to diesel fuel(24%).
C The energy use efficiency, energy productivity,specific energy and net energy of mandarinproduction in Mazandaran province were 0.77, 0.41kg/MJ, 2.46 MJ/kg and -17651.17 MJ/ha,respectively.
C The direct and indirect energy inputs were 58.82 and41.18% of the total energy input, respectively.Renewable energy sources among the inputs had ashare of 34.43% of the total energy input, which wassmaller than that of non-renewable resources (65.57).
C The impact of human labor, machinery, farmyardmanure, chemical fertilizers, chemicals, electricity,and water for irrigation energy inputs wassignificantly positive on yield.
C The impacts of direct, indirect and renewable andnon-renewable energies on yield were estimated as0.37, 0.82, 0.41 and 0.75, respectively.
C The MPP estimated for human labor energy was thebiggest among inputs of energy followed byfarmyard manure and Electricity energy inputs,respectively.
NOMENCLATURE
Yi yield level of the ith farmerX1 human labor energy
X2 machinery energyX3 diesel fuel energyX4 farmyard manure energy X5 chemical fertilizers energyX6 chemicals energyX7 electricity energyX8 water for irrigation energyei error term"i coefficients of the exogenous variables$i coefficients of the exogenous variables(i coefficients of the exogenous variablesDE direct energyIDE indirect energyRE renewable energyNRE non-renewable energyMPPxj marginal physical productivity of jth input"i regression coefficient of jth inputGM(Y) geometric mean of yield GM(Xj) geometric mean of jth input energy
REFERENCES
Banaeian, N., M. Omid and H. Ahmadi, 2011. Energy andeconomic analysis of greenhouse strawberryproduction in Tehran province of Iran. Energ.Convers. Manage., 52: 1020-1025.
Banaeian, N. and M. Zangeneh, 2011. Modeling EnergyFlow and Economic Analysis for Walnut Productionin Iran. Res. J. Appl. Sci. Eng. Technol., 3(3):194-201.
Erdal, G., K. Esengun, H. Erdal and O. Gunduz, 2007.Energy use and economical analysis of sugar beetproduction in Tokat province of Turkey. Energ.,32: 35-41.
Esengun, K., G. Erdal, O. Gunduz and H. Erdal, 2007. Aneconomic analysis and energy use in stake-tomatoproduction in Tokat province of Turkey. Renew.Energy, 32: 1873-1881.
Res. J. Appl. Sci. Eng. Technol., 3(5): 464-470, 2011
470
Gujarati, D.N., 1995. Basic Econometrics. McGraw-Hill,USA.
Hatirli, S.A., B. Ozkan and C. Fert, 2006. Energy inputsand crop yield relationship in greenhouse tomatoproduction. Renew. Energy, 31: 427-438.
Kizilaslan, H., 2009. Input-output energy analysis ofcherries production in Tokat Province of Turkey.Appl. Energy, 86: 1354-1358.
Kuesters, J. and J. Lammel, 1999. Investigations of theenergy efficiency of the production of winter wheatand sugar beet in Europe. Eur. J. Agron., 11: 35-43.
Mobtaker, H.G., A. Keyhani, A. Mohammadi, Sh. Rafieeand A. Akram, 2010. Sensitivity analysis of energyinputs for barley production in Hamedan Province ofIran. Agric. Ecosyst. Environ., 137: 367-372.
Mohammadi, A. and M. Omid, 2010. Economicalanalysis and relation between inputs and yield ofgreenhouse cucumber production in Iran. Appl.Energy, 87: 191-196.
Mohammadi, A., Sh. Rafiee, S.S. Mohtasebi andH. Rafiee, 2010. Energy inputs-yield relationship andcost analysis of kiwifruit production in Iran. Renew.Energy, 35: 1071-1075.
Mohammadi, A., A. Tabatabaeefar, Sh. Shahin,Sh. Rafiee and A. Keyhani, 2008. Energy use andeconomical analysis of potato production in Iran acase study: Ardabil province. Energy Convers.Manage., 49: 3566-3570.
Namdari, M., 2011. Energy use and cost analysis ofwatermelon production under different farmingtechnologies in Iran. Int. J. Environ. Sci., 1(6):1144-1153.
Ozkan, B., H. Akcaoz and F. Karadeniz, 2004a. Energyrequirement and economic analysis of citrusproduction in Turkey. Energy Convers. Manage.,45:1821-1830.
Ozkan, B., A. Kuklu and H. Akcaoz, 2004b. An input-output energy analysis in greenhouse vegetableproduction: A case study for Antalya region ofTurkey. Biomass Bioenergy, 26: 89-95.
Rafiee, Sh., S.H. Mousavi Aval and A. Mohammadi,2010. Modeling and sensitivity analysis of energyinputs for apple production in Iran. Energy, 35(8):3301-3306.
Singh, G., S. Singh and J. Singh, 2004. Optimization ofenergy inputs for wheat crop in Punjab. EnergyConvers. Manage., 45:453-465.
Yilmaz, I., H. Akcaoz and B. Ozkan, 2005. An analysis ofenergy use and input costs for cotton production inTurkey. Renew. Energy, 30: 145-155.
Zangeneh, M., M. Omid, and A. Akram, 2010. Acomparative study on energy use and cost analysis ofpotato production under different farmingtechnologies in Hamadan province of Iran. Energy,35: 2927-2933.