Embed Size (px)
Citation preview
N:\1944\Report\Ltr Rep.1944.doc
February 10, 2010 Mr. Homi Namdari Assistant City Engineer City of Escondido 201 N. Broadway Escondido, CA 92025
LLG Reference: 3-10-1944 Subject: Talk-of-The-Town
City of Escondido Dear Mr. Namdari: LLG Engineers prepared a traffic study for the Talk-of-The-Town project in January 2008. This project proposes to construct an automatic Car Wash facility, a two-stall oil change facility and a 4,156 square foot sit-down restaurant at the northwest corner of Centre City Parkway and Brotherton Road in the City of Escondido. This letter report addresses the following three issues:
• Potential conflict between project traffic and school vehicular traffic
• Potential conflict between project traffic and school pedestrian traffic
• Potential impact to nearby residential streets which the project traffic may utilize.
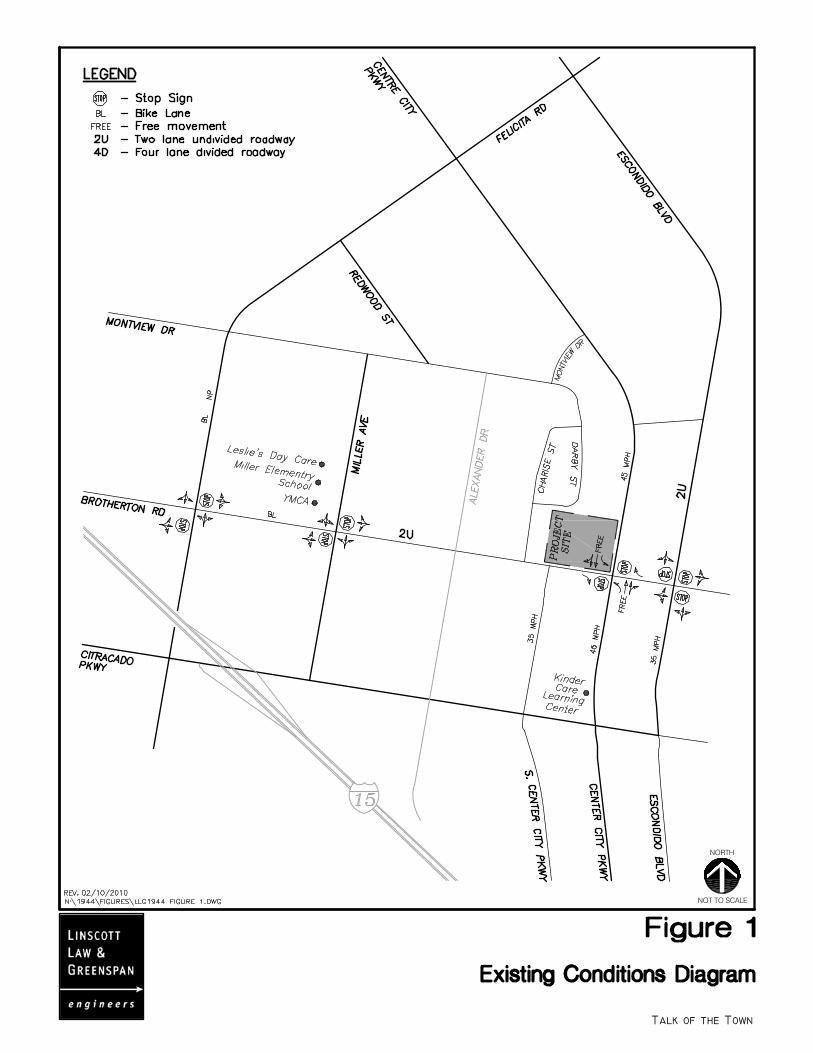
Figure 1 depicts the project location and study area.
1.0 TRAFFIC COUNTS A traffic study was completed in December 2008 for this project. The analysis contained in that study was based on counts conducted in June 2008, when schools were closed for the summer. New traffic counts were conducted in January 2010, with nearby schools and day-cares in session. These counts also account for the traffic related to the Miller Elementary School, the Kindercare Learning Center on South Center City Parkway, the YMCA daycare on Miller Avenue and Leslie’s daycare on Danica Place in the project vicinity.
Mr. Homi Namdari February 10, 2010 Page 2
N:\1944\Report\Ltr Rep.1944.doc
1.1 PEAK HOUR INTERSECTION TURNING MOVEMENT VOLUMES Intersection turning movement counts were conducted during the following three peak periods in order to capture the traffic activity during those peak hours in this residential neighborhood.
• AM peak hour - 7:00 AM and 9:00 AM
• School PM peak hour - 2:00 PM to 4:00 PM
• PM peak hour - 4:00 PM to 6:00 PM
Counts were conducted at the following intersections on Brotherton Road:
• Brotherton Road / Felicita Road
• Brotherton Road / Miller Avenue
• Brotherton Road / Centre City Parkway
• Brotherton Road / Escondido Boulevard
1.2 SEGMENT VOLUMES 72-hour machine traffic counts (ADT) were conducted at the following segments with schools in session.
• Brotherton Road from Felicita Road to Miller Avenue • Brotherton Road from Miller Avenue to Centre City Parkway
Figure 2 depicts the Year 2010 traffic counts. Table 1 depicts a comparison of the traffic volume counts conducted in June 2008 (summer) and the current year 2010 counts (with schools in session). As seen in Table 1, the segment volume on Brotherton Road west of Centre City Parkway has decreased since the summer of June 2008, even though the counts were currently conducted with area schools in session. The segment volumes were conducted for a period of three days and remain consistent over the three-day period. The total traffic volume entering the intersection during the AM and PM peak hours were also compared. At the Brotherton Road /Felicita Avenue intersection, there is 20% decrease in the AM peak hour and an increase of 10% during the PM peak hour over the June 2008 volumes. At the Brotherton Road / Centre City Parkway intersection, there is an increase of approximately 15% in the AM and PM peak hours over the June 2008 volumes. At the Brotherton Road / Escondido Boulevard intersection, there is practically no change in the volumes. It may be noted, that the traffic on Centre City Parkway and Felicita Avenue includes a large percentage of through traffic and is not indicative of the neighborhood traffic. It is therefore concluded that traffic on Brotherton Road (and the neighborhood) has not increased significantly since the June 2008 report was completed and the analysis remains valid, on the basis of traffic volume counts.

Mr. Homi Namdari February 10, 2010 Page 3
N:\1944\Report\Ltr Rep.1944.doc
TABLE 1
COMPARISON OF TRAFFIC VOLUMES
Facility Peak Hour Jun-08 Jan-10 Increase /
Decrease (xxx)
Daily Segment Volume
Brotherton Rd W/O Centre City Pkwy - 1,100 800 (300)
Total Volume Entering Intersection
Brotherton Rd / Felicita Ave AM 1,101 875 (226)
PM 996 1,087 91
Brotherton Rd / Centre City Pkwy AM 1,707 1,992 285
PM 2,104 2,420 316
Brotherton Rd / Escondido Blvd AM 403 394 (9)
PM 511 508 (3)
Attachment A contains the traffic and pedestrian count sheets.
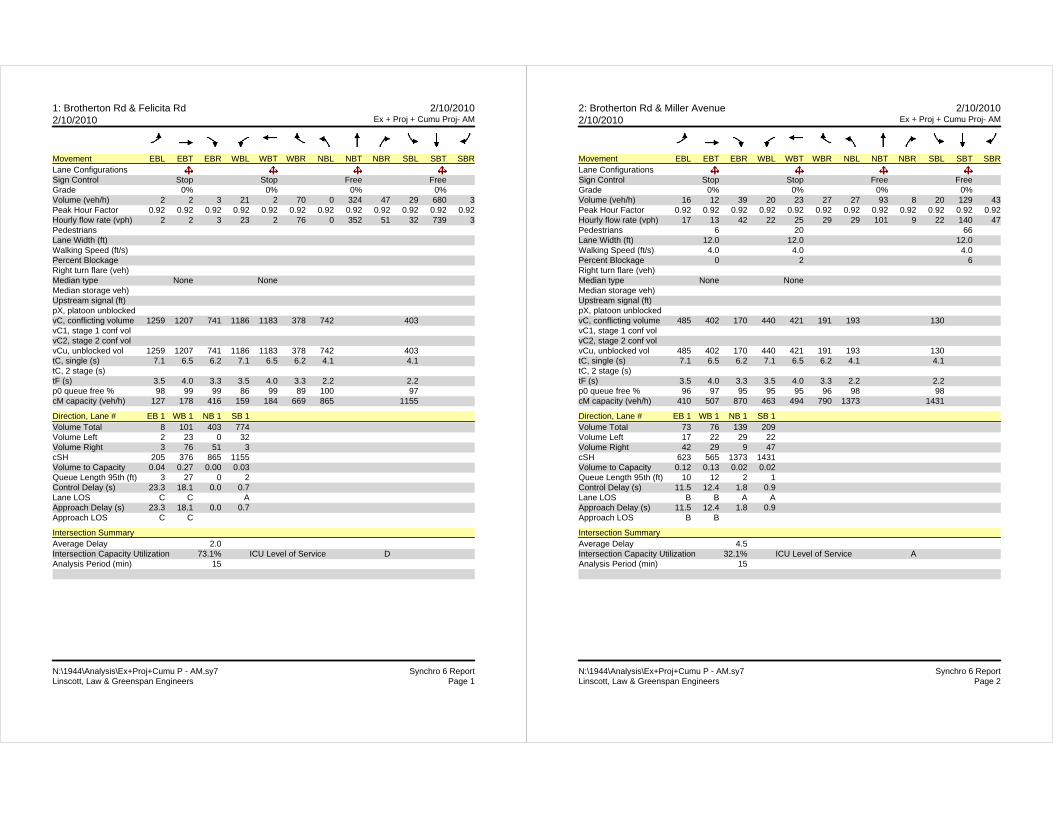
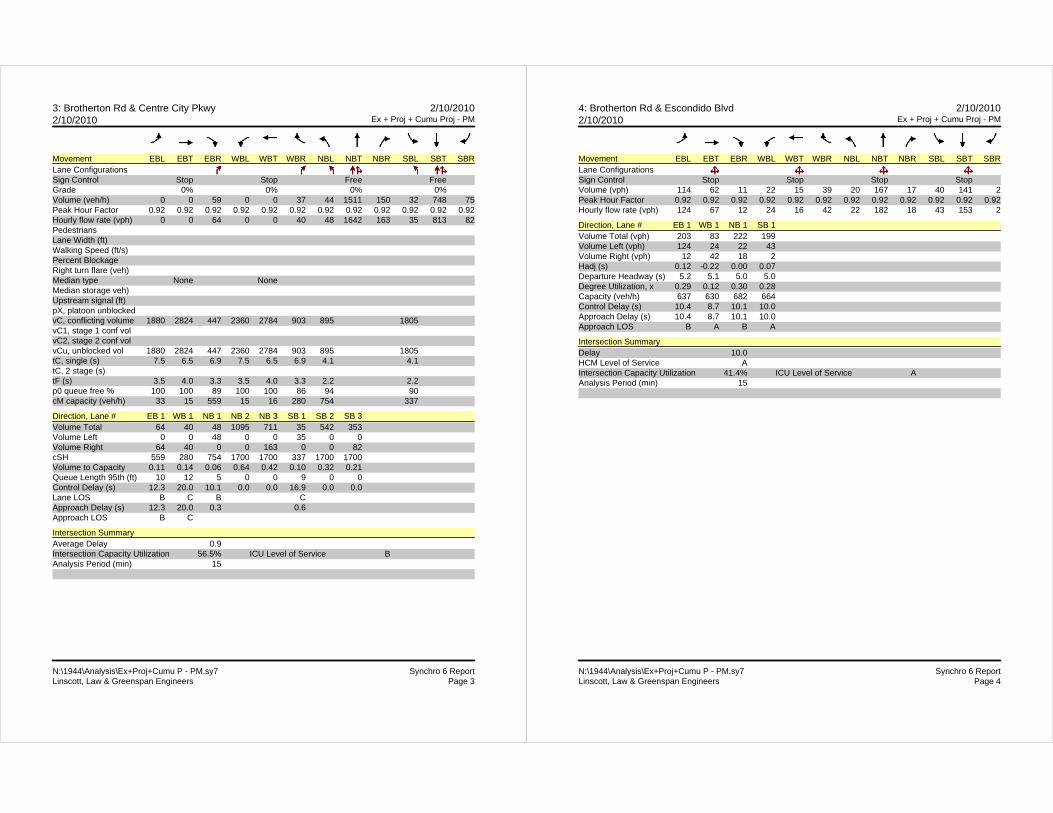
2.0 TRAFFIC OPERATIONS 2.1 PEAK HOUR OPERATIONS Figure 3 depicts the Existing + Project + Cumulative projects AM and PM peak hour intersection turning movement volumes and the 24-hour segment volumes. Attachment B contains the Existing peak hour intersection analysis worksheets.
2.1.1 EXISTING INTERSECTION OPERATIONS Table 1 summarizes the peak hour intersection operations along Brotherton Road. As seen in Table 1, all intersections are calculated to operate at LOS C or better during all three peak periods. The analysis of the School PM peak (2:15 PM to 3:15 PM) is included for comparison purposes only. 2.1.2 EXISTING + PROJECT + CUMULATIVE PROJECTS INTERSECTION OPERATIONS Table 1 summarizes the peak hour intersection operations along Brotherton Road. As seen in Table 1, with the addition of project and other cumulative projects, these intersections are calculated to continue to operate at LOS C or better. The intersection operations (delay and LOS) are comparable to the operations calculated in the June 2008 report. In some cases, the delay has increased by a couple of seconds. Hence, the conclusions in the June 2008 report remain valid.

Mr. Homi Namdari February 10, 2010 Page 4
N:\1944\Report\Ltr Rep.1944.doc
TABLE 1
INTERSECTION OPERATIONS
Intersection ControlType
Peak Hour
Existing Existing + Project + Cumulative Projects
Delaya LOSb Delay LOS 1. Brotherton Rd / Felicita Ave TWSCc AM 23.1 C 23.3 C
School PM 21.2 C - - PM 19.3 C 19.6 C
2. Brotherton Rd / Miller Rd TWSCc AM 12.2 B 12.4 B
School PM 11.2 B - - PM 9.9 A 10.0 A
3. Brotherton Rd / Centre City Pkwy TWSCc AM 13.6 B 15.2 C
School PM 15.7 C - - PM 19.1 C 20.0 C
4. Brotherton Rd / Escondido Blvd AWSCc AM 8.5 A 8.8 A
School PM 8.9 A - - PM 9.6 A 10.4 B
Footnotes: a. Average delay per vehicle in seconds b. Level of Service c. Two-Way-STOP-Controlled intersection. Minor street delay is reported. d. All-Way-STOP-Controlled intersection. Overall intersection delay is reported.
2.2 SEGMENT OPERATIONS Table 2 summarizes the segment operations along Brotherton Road. As seen in Table 2, with the addition of project and other cumulative projects, these segments are calculated to continue to operate at LOS C or better. Therefore, the project traffic has no impact on the subject segments.

Mr. Homi Namdari February 10, 2010 Page 5
N:\1944\Report\Ltr Rep.1944.doc
TABLE 2
STREET SEGMENT OPERATIONS
Street Segment Existing Roadway Class a Capacity b
ADT c
Existing Existing + Project + Cumulative Projects
Brotherton Road
Felicita Ave to Miller Ave Resi Street 2,200 600 815 Miller Ave to Centre City Pkwy Resi Street 2,200 800 1,015
Footnotes:
a. Existing Roadway classification assumed as base condition. b. Capacity of Residential Street roadway facility based on City of Escondido standards. c. Average Daily Traffic
3.0 PROJECT TRAFFIC USING NEIGHBORHOOD STREETS TO
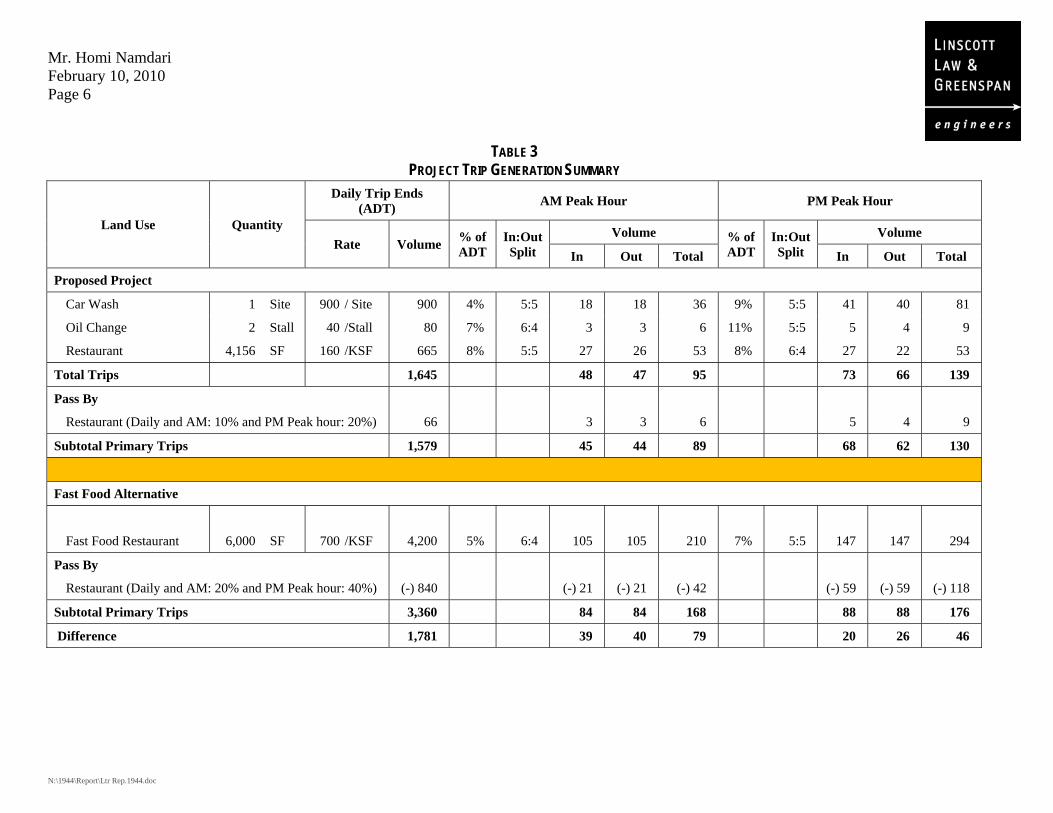
ACCESS NORTHBOUND CENTRE CITY PARKWAY Eastbound left-turns are not permitted at the Brotherton Road / Centre City Parkway intersection. Therefore, project traffic oriented to the north of the project site is not able to return directly to northbound Centre City Parkway. There are several alternative routes available. The neighborhood residents are concerned that traffic could potentially use neighborhood streets to travel north. The most obvious route to the north is to make an eastbound right-turn at the Brotherton Road / Centre City Parkway intersection, proceed south on Centre City Parkway to Citracado Boulevard and make a protected U-turn at the traffic signal at Citracado Parkway and then travel north towards Felicita Avenue. 4.1 PROJECT TRIP GENERATION Table 3 summarizes the estimated project traffic generation. As seen in Table 3, the project is estimated to generate 1,579 daily trips with 95 trips during the AM peak hour and 139 trips during the PM peak hour. It may be noted that the number of trips identified above are primary trips, after accounting for passby traffic. Based on the project trip distribution percentages assumed in the December 2008 report, 36% of the project traffic will potentially utilize Centre City Parkway to access the project site. Therefore, the total amount of traffic that would need to access northbound Centre City Parkway is estimated to be 296 vehicles over one 24-hour period, with 17 during the AM peak hour and 24 during the PM peak hour. It may be noted that only outbound traffic from the project would potentially utilize the neighborhood streets to travel north of the site.
Mr. Homi Namdari February 10, 2010 Page 6
N:\1944\Report\Ltr Rep.1944.doc
TABLE 3
PROJECT TRIP GENERATION SUMMARY
Land Use Quantity
Daily Trip Ends (ADT) AM Peak Hour PM Peak Hour
Rate Volume % of ADT
In:Out Split
Volume % of ADT
In:Out Split
Volume
In Out Total In Out Total
Proposed Project
Car Wash 1 Site 900 / Site 900 4% 5:5 18 18 36 9% 5:5 41 40 81
Oil Change 2 Stall 40 /Stall 80 7% 6:4 3 3 6 11% 5:5 5 4 9
Restaurant 4,156 SF 160 /KSF 665 8% 5:5 27 26 53 8% 6:4 27 22 53
Total Trips 1,645 48 47 95 73 66 139
Pass By
Restaurant (Daily and AM: 10% and PM Peak hour: 20%) 66 3 3 6 5 4 9
Subtotal Primary Trips 1,579 45 44 89 68 62 130
1
Fast Food Alternative
Fast Food Restaurant 6,000 SF 700 /KSF 4,200 5% 6:4 105 105 210 7% 5:5 147 147 294
Pass By
Restaurant (Daily and AM: 20% and PM Peak hour: 40%) (-) 840 (-) 21 (-) 21 (-) 42 (-) 59 (-) 59 (-) 118
Subtotal Primary Trips 3,360 84 84 168 88 88 176
Difference 1,781 39 40 79 20 26 46

Mr. Homi Namdari February 10, 2010 Page 7
N:\1944\Report\Ltr Rep.1944.doc
An additional 137 daily trips with 11 AM and 16 PM peak hour trips are estimated to access northbound Escondido Boulevard. These trips that are destined to northbound Escondido Boulevard are however not considered, since it would be more convenient to use southbound Centre City Parkway to Citracado Parkway and then north on Escondido Boulevard.
4.2 TRIP GENERATION FOR THE MOST INTENSE PERMITTED LAND USE Table 3 also summarizes the estimated traffic generation assuming the most intense permitted land use is constructed. The current permitted land uses at this site include a fast-food restaurant. If the project consisted of a fast-foot restaurant, the project would generate 3,360 daily trips with 168 trips during the AM peak hour and 176 trips during the PM peak hour. It may be noted that the number of trips identified above are primary trips, after accounting for passby traffic. Thus, potentially, the project could have increased the neighborhood traffic by 605 daily trips with 30 AM and 32 PM peak hour trips. However, the currently proposed land uses are estimated to generate much fewer trips. 4.3 TRAVEL TIME ANALYSIS A travel time analysis of two neighborhood routes and the route on Centre City Parkway was conducted during the peak hours. Figure 4 depicts the three potential routes. As seen in Figure 4, the travel time was recorded starting from the project site and ending at the Felicita Avenue / Centre City Parkway intersection for all three routes. Table 4 summarizes the results of this analysis. Three runs each were conducted along each route during each of the three peak hours. Following are the three routes: Route 1: Charise Street / Darby Street / Montview Drive / U-turn on Centre City
Parkway / Felicita Avenue Route 2: C. City Parkway / U-Turn at Citracado Parkway / Felicita Avenue Route 3: Charise Street / Darby Street / Montview Drive / Redwood Street / Felicita
Avenue / Centre City Parkway The travel time was recorded during the AM (7:15 AM to 8:15 AM), the school PM peak (2:00 PM to 3:00 PM) and the traditional PM peak hours (4:30 PM to 5:30 PM).
• Generally, few to no vehicular traffic were observed along the two neighborhood routes (Routes 1 & 3).
• Only one pedestrian was encountered on the sidewalk on Charise Street during the entire exercise.

Mr. Homi Namdari February 10, 2010 Page 8
N:\1944\Report\Ltr Rep.1944.doc
TABLE 4
TRAVEL TIME ANALYSIS
Peak Hour
Route 1 Route 2 Route 3
Total Distance (miles)
Number of STOP
Controlled Intersections
Average Travel Time
Speed (mph)
Total Distance (miles)
Number of STOP
Controlled Intersections
Average Travel Time
Speed (mph)
Total Distance (miles)
Number of STOP
Controlled Intersections
Average Travel Time
Speed (mph)
AM
0.96
3 Stop Controlled
intersections, one park and 1 uncontrolled
U-turn
2 min : 47 sec 20.7
1.19
1 Stop Controlled
intersection, 1 signalized
U-turn
2 min : 45 sec 26.0
0.98 4 Stop
Controlled intersections
3 min : 17 sec 18.0
School PM 2 min : 54 sec 19.8 3 min : 17 sec 21.8 3 min : 13 sec 18.1
PM 3 min : 20 sec 17.3 2 min : 55 sec 24.5 3 min : 14 sec 18.3
Notes: Route 1: Charise Street / Darby Street / Montview / Centre City Parkway / Felicita Avenue Route 2: Centre City Parkway / U-Turn at Citracado Parkway / Felicita Avenue Route 3: Charise Street / Darby Street / Mont View / Felicita Avenue / Centre City Parkway

Mr. Homi Namdari February 10, 2010 Page 9
N:\1944\Report\Ltr Rep.1944.doc
• Route 1 - There are two STOP controlled intersections (Charise Street / Darby Street and Darby Street / Montview Drive) and one uncontrolled U-turn (Centre City Parkway / Escondido Parkway).
• Route 2 – There is one STOP controlled intersection (Brotherton Road / Centre City Parkway) and one signalized U-turn (Centre City Parkway / Citracado Parkway.
• Route 3 – There are 4 STOP controlled intersections (Charise Street / Darby Street and Montview Drive / Darby Street, Montview Drive / Redwood Street and Felicita Avenue / Redwood Street).
• During the AM peak hour, the route with the shortest (average) travel time is Route 2.
• During the School PM peak hour, the route with the shortest travel time is Route 1.
• During the PM peak hour, the route with the shortest travel time is Route 2.
• The difference in travel time between the routes is very small. However, if the overall travel speed is compared, the highest overall travel speed is on Route 2, even though it is the longest route. This is because the posted speed limit on Centre City Parkway is 45 mph, whereas the posted speed limit on the neighborhood streets is 25 mph.
Based on the above, it is concluded that though some people would use the neighborhood streets, most people will use Route 2 to access northbound Centre City Parkway from the site. The people that use the neighborhood streets are likely to be people that live in the neighborhood or in adjacent neighborhoods. One has to be familiar with the neighborhood to use the neighborhood streets. Going through the neighborhood is not much shorter, nor is it faster or more convenient. Assuming about 50% of the project traffic will use the neighborhood streets to travel north, the traffic in the neighborhood will increase by 148 vehicles over an entire day, or, 9 during the AM peak hour and 12 during the PM peak hour. Therefore, it is concluded, that even though traffic on the neighborhood streets may increase due to the project, the increase is minimal and will substantially change the traffic operations in the neighborhood. 4.0 PEDESTRIAN TRAFFIC AM peak period and PM peak period pedestrian volume counts were conducted at the following study area intersections and segments. The pedestrian counts were conducted from 7:00 AM to 9:00 AM and 2:00 PM to 6:00 PM to capture school and adjacent street pedestrian traffic.
Mr. Homi Namdari February 10, 2010 Page 10
N:\1944\Report\Ltr Rep.1944.doc
• Brotherton Road / Felicita Road • Brotherton Road / Miller Avenue • Brotherton Road segment from Felicita Road to Miller Avenue • Brotherton Road segment from Miller Avenue to Centre City
Parkway Figure 2 the pedestrian volumes. Attachment A contains the pedestrian count sheets.
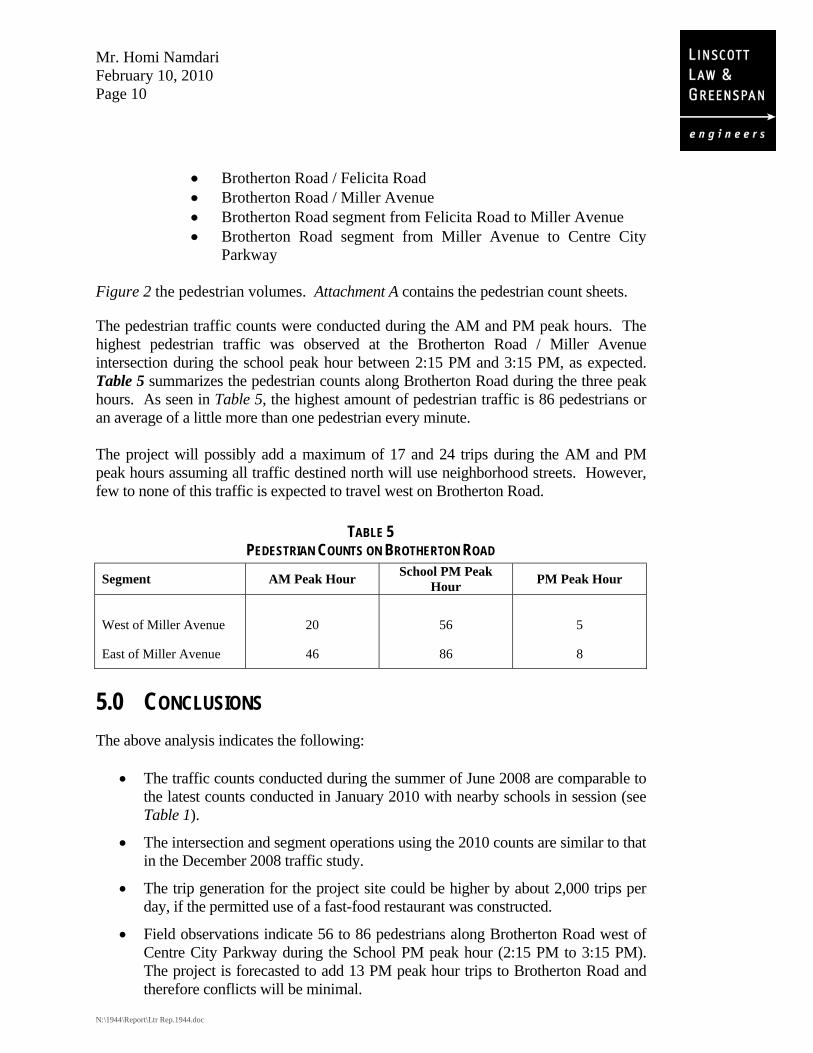
The pedestrian traffic counts were conducted during the AM and PM peak hours. The highest pedestrian traffic was observed at the Brotherton Road / Miller Avenue intersection during the school peak hour between 2:15 PM and 3:15 PM, as expected. Table 5 summarizes the pedestrian counts along Brotherton Road during the three peak hours. As seen in Table 5, the highest amount of pedestrian traffic is 86 pedestrians or an average of a little more than one pedestrian every minute. The project will possibly add a maximum of 17 and 24 trips during the AM and PM peak hours assuming all traffic destined north will use neighborhood streets. However, few to none of this traffic is expected to travel west on Brotherton Road.
TABLE 5 PEDESTRIAN COUNTS ON BROTHERTON ROAD
Segment AM Peak Hour School PM Peak Hour PM Peak Hour
1
West of Miller Avenue 20 56 5
East of Miller Avenue 46 86 8
5.0 CONCLUSIONS The above analysis indicates the following:
• The traffic counts conducted during the summer of June 2008 are comparable to the latest counts conducted in January 2010 with nearby schools in session (see Table 1).
• The intersection and segment operations using the 2010 counts are similar to that in the December 2008 traffic study.
• The trip generation for the project site could be higher by about 2,000 trips per day, if the permitted use of a fast-food restaurant was constructed.
• Field observations indicate 56 to 86 pedestrians along Brotherton Road west of Centre City Parkway during the School PM peak hour (2:15 PM to 3:15 PM). The project is forecasted to add 13 PM peak hour trips to Brotherton Road and therefore conflicts will be minimal.

Mr. Homi Namdari February 10, 2010 Page 11
N:\1944\Report\Ltr Rep.1944.doc
• Travel time analysis on three possible routes revealed no significant difference in travel time. There are however, differences in the type of intersection traffic control and number of intersections along each route which could influence the route used by project traffic destined to the north.
• The increase in peak hour traffic due to the project in the neighborhood is 9 trips during the AM peak hour and 12 trips during the PM peak hour and is not expected to significantly impact traffic operations in neighborhood streets.
Sincerely,
Linscott, Law & Greenspan, Engineers Narasimha Prasad Senior Transportation Engineer cc: File

LINSCOTT, LAW & GREENSPAN, engineers LLG Ref. 3-10-1944 Talk-of-the-Town
FIGURES


LINSCOTT, LAW & GREENSPAN, engineers LLG Ref. 3-10-1944 Talk-of-the-Town
INTERSECTION ANALYSIS WORKSHEETS
- EXISTING

1: Brotherton Rd & Felicita Rd 2/9/20102/9/2010 Ex - AM
N:\1944\Analysis\Ex - AM.sy7 Synchro 6 ReportLinscott, Law & Greenspan Engineers Page 1
Movement EBL EBT EBR WBL WBT WBR NBL NBT NBR SBL SBT SBRLane ConfigurationsSign Control Stop Stop Free FreeGrade 0% 0% 0% 0%Volume (veh/h) 2 2 3 18 2 69 0 324 44 28 680 3Peak Hour Factor 0.92 0.92 0.92 0.92 0.92 0.92 0.92 0.92 0.92 0.92 0.92 0.92Hourly flow rate (vph) 2 2 3 20 2 75 0 352 48 30 739 3PedestriansLane Width (ft)Walking Speed (ft/s)Percent BlockageRight turn flare (veh)Median type None NoneMedian storage veh)Upstream signal (ft)pX, platoon unblockedvC, conflicting volume 1254 1202 741 1182 1179 376 742 400vC1, stage 1 conf volvC2, stage 2 conf volvCu, unblocked vol 1254 1202 741 1182 1179 376 742 400tC, single (s) 7.1 6.5 6.2 7.1 6.5 6.2 4.1 4.1tC, 2 stage (s)tF (s) 3.5 4.0 3.3 3.5 4.0 3.3 2.2 2.2p0 queue free % 98 99 99 88 99 89 100 97cM capacity (veh/h) 128 180 416 160 185 670 865 1159
Direction, Lane # EB 1 WB 1 NB 1 SB 1Volume Total 8 97 400 773Volume Left 2 20 0 30Volume Right 3 75 48 3cSH 206 394 865 1159Volume to Capacity 0.04 0.25 0.00 0.03Queue Length 95th (ft) 3 24 0 2Control Delay (s) 23.1 17.1 0.0 0.7Lane LOS C C AApproach Delay (s) 23.1 17.1 0.0 0.7Approach LOS C C
Intersection SummaryAverage Delay 1.8Intersection Capacity Utilization 71.8% ICU Level of Service CAnalysis Period (min) 15
2: Brotherton Rd & Miller Avenue 2/9/20102/9/2010 Ex - AM
N:\1944\Analysis\Ex - AM.sy7 Synchro 6 ReportLinscott, Law & Greenspan Engineers Page 2
Movement EBL EBT EBR WBL WBT WBR NBL NBT NBR SBL SBT SBRLane ConfigurationsSign Control Stop Stop Free FreeGrade 0% 0% 0% 0%Volume (veh/h) 16 7 39 20 19 27 27 93 8 20 129 43Peak Hour Factor 0.92 0.92 0.92 0.92 0.92 0.92 0.92 0.92 0.92 0.92 0.92 0.92Hourly flow rate (vph) 17 8 42 22 21 29 29 101 9 22 140 47Pedestrians 6 20 66Lane Width (ft) 12.0 12.0 12.0Walking Speed (ft/s) 4.0 4.0 4.0Percent Blockage 0 2 6Right turn flare (veh)Median type None NoneMedian storage veh)Upstream signal (ft)pX, platoon unblockedvC, conflicting volume 483 402 170 437 421 191 193 130vC1, stage 1 conf volvC2, stage 2 conf volvCu, unblocked vol 483 402 170 437 421 191 193 130tC, single (s) 7.1 6.5 6.2 7.1 6.5 6.2 4.1 4.1tC, 2 stage (s)tF (s) 3.5 4.0 3.3 3.5 4.0 3.3 2.2 2.2p0 queue free % 96 98 95 95 96 96 98 98cM capacity (veh/h) 414 507 870 468 494 790 1373 1431
Direction, Lane # EB 1 WB 1 NB 1 SB 1Volume Total 67 72 139 209Volume Left 17 22 29 22Volume Right 42 29 9 47cSH 637 572 1373 1431Volume to Capacity 0.11 0.13 0.02 0.02Queue Length 95th (ft) 9 11 2 1Control Delay (s) 11.3 12.2 1.8 0.9Lane LOS B B A AApproach Delay (s) 11.3 12.2 1.8 0.9Approach LOS B B
Intersection SummaryAverage Delay 4.3Intersection Capacity Utilization 32.0% ICU Level of Service AAnalysis Period (min) 15

3: Brotherton Rd & Centre City Pkwy 2/9/20102/9/2010 Ex - AM
N:\1944\Analysis\Ex - AM.sy7 Synchro 6 ReportLinscott, Law & Greenspan Engineers Page 3
Movement EBL EBT EBR WBL WBT WBR NBL NBT NBR SBL SBT SBRLane ConfigurationsSign Control Stop Stop Free FreeGrade 0% 0% 0% 0%Volume (veh/h) 0 0 18 0 0 14 8 769 39 26 1052 66Peak Hour Factor 0.92 0.92 0.92 0.92 0.92 0.92 0.92 0.92 0.92 0.92 0.92 0.92Hourly flow rate (vph) 0 0 20 0 0 15 9 836 42 28 1143 72PedestriansLane Width (ft)Walking Speed (ft/s)Percent BlockageRight turn flare (veh)Median type None NoneMedian storage veh)Upstream signal (ft)pX, platoon unblockedvC, conflicting volume 1686 2132 608 1522 2146 439 1215 878vC1, stage 1 conf volvC2, stage 2 conf volvCu, unblocked vol 1686 2132 608 1522 2146 439 1215 878tC, single (s) 7.5 6.5 6.9 7.5 6.5 6.9 4.1 4.1tC, 2 stage (s)tF (s) 3.5 4.0 3.3 3.5 4.0 3.3 2.2 2.2p0 queue free % 100 100 96 100 100 97 98 96cM capacity (veh/h) 57 46 439 74 45 566 570 765
Direction, Lane # EB 1 WB 1 NB 1 NB 2 NB 3 SB 1 SB 2 SB 3Volume Total 20 15 9 557 321 28 762 453Volume Left 0 0 9 0 0 28 0 0Volume Right 20 15 0 0 42 0 0 72cSH 439 566 570 1700 1700 765 1700 1700Volume to Capacity 0.04 0.03 0.02 0.33 0.19 0.04 0.45 0.27Queue Length 95th (ft) 3 2 1 0 0 3 0 0Control Delay (s) 13.6 11.5 11.4 0.0 0.0 9.9 0.0 0.0Lane LOS B B B AApproach Delay (s) 13.6 11.5 0.1 0.2Approach LOS B B
Intersection SummaryAverage Delay 0.4Intersection Capacity Utilization 41.2% ICU Level of Service AAnalysis Period (min) 15
4: Brotherton Rd & Escondido Blvd 2/9/20102/9/2010 Ex - AM
N:\1944\Analysis\Ex - AM.sy7 Synchro 6 ReportLinscott, Law & Greenspan Engineers Page 4
Movement EBL EBT EBR WBL WBT WBR NBL NBT NBR SBL SBT SBRLane ConfigurationsSign Control Stop Stop Stop StopVolume (vph) 26 33 5 12 9 31 4 58 5 50 161 0Peak Hour Factor 0.92 0.92 0.92 0.92 0.92 0.92 0.92 0.92 0.92 0.92 0.92 0.92Hourly flow rate (vph) 28 36 5 13 10 34 4 63 5 54 175 0
Direction, Lane # EB 1 WB 1 NB 1 SB 1Volume Total (vph) 70 57 73 229Volume Left (vph) 28 13 4 54Volume Right (vph) 5 34 5 0Hadj (s) 0.07 -0.28 0.00 0.08Departure Headway (s) 4.7 4.4 4.5 4.4Degree Utilization, x 0.09 0.07 0.09 0.28Capacity (veh/h) 704 751 769 793Control Delay (s) 8.2 7.7 7.9 9.0Approach Delay (s) 8.2 7.7 7.9 9.0Approach LOS A A A A
Intersection SummaryDelay 8.5HCM Level of Service AIntersection Capacity Utilization 30.6% ICU Level of Service AAnalysis Period (min) 15

1: Brotherton Rd & Felicita Rd 2/9/20102/9/2010 Ex School - PM
N:\1944\Analysis\School - PM.sy7 Synchro 6 ReportLinscott, Law & Greenspan Engineers Page 1
Movement EBL EBT EBR WBL WBT WBR NBL NBT NBR SBL SBT SBRLane ConfigurationsSign Control Stop Stop Free FreeGrade 0% 0% 0% 0%Volume (veh/h) 1 2 3 20 0 54 0 517 20 27 556 3Peak Hour Factor 0.92 0.92 0.92 0.92 0.92 0.92 0.92 0.92 0.92 0.92 0.92 0.92Hourly flow rate (vph) 1 2 3 22 0 59 0 562 22 29 604 3PedestriansLane Width (ft)Walking Speed (ft/s)Percent BlockageRight turn flare (veh)Median type None NoneMedian storage veh)Upstream signal (ft)pX, platoon unblockedvC, conflicting volume 1296 1248 606 1242 1239 573 608 584vC1, stage 1 conf volvC2, stage 2 conf volvCu, unblocked vol 1296 1248 606 1242 1239 573 608 584tC, single (s) 7.1 6.5 6.2 7.1 6.5 6.2 4.1 4.1tC, 2 stage (s)tF (s) 3.5 4.0 3.3 3.5 4.0 3.3 2.2 2.2p0 queue free % 99 99 99 85 100 89 100 97cM capacity (veh/h) 121 168 497 146 170 519 971 991
Direction, Lane # EB 1 WB 1 NB 1 SB 1Volume Total 7 80 584 637Volume Left 1 22 0 29Volume Right 3 59 22 3cSH 229 307 971 991Volume to Capacity 0.03 0.26 0.00 0.03Queue Length 95th (ft) 2 26 0 2Control Delay (s) 21.2 20.9 0.0 0.8Lane LOS C C AApproach Delay (s) 21.2 20.9 0.0 0.8Approach LOS C C
Intersection SummaryAverage Delay 1.8Intersection Capacity Utilization 65.3% ICU Level of Service CAnalysis Period (min) 15
2: Brotherton Rd & Miller Avenue 2/9/20102/9/2010 Ex School - PM
N:\1944\Analysis\School - PM.sy7 Synchro 6 ReportLinscott, Law & Greenspan Engineers Page 2
Movement EBL EBT EBR WBL WBT WBR NBL NBT NBR SBL SBT SBRLane ConfigurationsSign Control Stop Stop Free FreeGrade 0% 0% 0% 0%Volume (veh/h) 17 5 33 22 10 18 21 69 29 15 85 28Peak Hour Factor 0.92 0.92 0.92 0.92 0.92 0.92 0.92 0.92 0.92 0.92 0.92 0.92Hourly flow rate (vph) 18 5 36 24 11 20 23 75 32 16 92 30Pedestrians 6 20 66Lane Width (ft) 12.0 12.0 12.0Walking Speed (ft/s) 4.0 4.0 4.0Percent Blockage 0 2 6Right turn flare (veh)Median type None NoneMedian storage veh)Upstream signal (ft)pX, platoon unblockedvC, conflicting volume 374 318 114 335 318 177 129 127vC1, stage 1 conf volvC2, stage 2 conf volvCu, unblocked vol 374 318 114 335 318 177 129 127tC, single (s) 7.1 6.5 6.2 7.1 6.5 6.2 4.1 4.1tC, 2 stage (s)tF (s) 3.5 4.0 3.3 3.5 4.0 3.3 2.2 2.2p0 queue free % 96 99 96 96 98 98 98 99cM capacity (veh/h) 508 569 934 559 570 805 1450 1435
Direction, Lane # EB 1 WB 1 NB 1 SB 1Volume Total 60 54 129 139Volume Left 18 24 23 16Volume Right 36 20 32 30cSH 709 631 1450 1435Volume to Capacity 0.08 0.09 0.02 0.01Queue Length 95th (ft) 7 7 1 1Control Delay (s) 10.5 11.2 1.4 1.0Lane LOS B B A AApproach Delay (s) 10.5 11.2 1.4 1.0Approach LOS B B
Intersection SummaryAverage Delay 4.1Intersection Capacity Utilization 31.1% ICU Level of Service AAnalysis Period (min) 15

3: Brotherton Rd & Centre City Pkwy 2/9/20102/9/2010 Ex School - PM
N:\1944\Analysis\School - PM.sy7 Synchro 6 ReportLinscott, Law & Greenspan Engineers Page 3
Movement EBL EBT EBR WBL WBT WBR NBL NBT NBR SBL SBT SBRLane ConfigurationsSign Control Stop Stop Free FreeGrade 0% 0% 0% 0%Volume (veh/h) 0 0 10 0 0 32 17 1205 113 34 444 23Peak Hour Factor 0.92 0.92 0.92 0.92 0.92 0.92 0.92 0.92 0.92 0.92 0.92 0.92Hourly flow rate (vph) 0 0 11 0 0 35 18 1310 123 37 483 25PedestriansLane Width (ft)Walking Speed (ft/s)Percent BlockageRight turn flare (veh)Median type None NoneMedian storage veh)Upstream signal (ft)pX, platoon unblockedvC, conflicting volume 1296 2039 254 1734 1990 716 508 1433vC1, stage 1 conf volvC2, stage 2 conf volvCu, unblocked vol 1296 2039 254 1734 1990 716 508 1433tC, single (s) 7.5 6.5 6.9 7.5 6.5 6.9 4.1 4.1tC, 2 stage (s)tF (s) 3.5 4.0 3.3 3.5 4.0 3.3 2.2 2.2p0 queue free % 100 100 99 100 100 91 98 92cM capacity (veh/h) 101 51 746 51 54 372 1053 470
Direction, Lane # EB 1 WB 1 NB 1 NB 2 NB 3 SB 1 SB 2 SB 3Volume Total 11 35 18 873 559 37 322 186Volume Left 0 0 18 0 0 37 0 0Volume Right 11 35 0 0 123 0 0 25cSH 746 372 1053 1700 1700 470 1700 1700Volume to Capacity 0.01 0.09 0.02 0.51 0.33 0.08 0.19 0.11Queue Length 95th (ft) 1 8 1 0 0 6 0 0Control Delay (s) 9.9 15.7 8.5 0.0 0.0 13.3 0.0 0.0Lane LOS A C A BApproach Delay (s) 9.9 15.7 0.1 0.9Approach LOS A C
Intersection SummaryAverage Delay 0.6Intersection Capacity Utilization 46.9% ICU Level of Service AAnalysis Period (min) 15
4: Brotherton Rd & Escondido Blvd 2/9/20102/9/2010 Ex School - PM
N:\1944\Analysis\School - PM.sy7 Synchro 6 ReportLinscott, Law & Greenspan Engineers Page 4
Movement EBL EBT EBR WBL WBT WBR NBL NBT NBR SBL SBT SBRLane ConfigurationsSign Control Stop Stop Stop StopVolume (vph) 87 45 14 11 13 39 19 115 13 46 105 1Peak Hour Factor 0.92 0.92 0.92 0.92 0.92 0.92 0.92 0.92 0.92 0.92 0.92 0.92Hourly flow rate (vph) 95 49 15 12 14 42 21 125 14 50 114 1
Direction, Lane # EB 1 WB 1 NB 1 SB 1Volume Total (vph) 159 68 160 165Volume Left (vph) 95 12 21 50Volume Right (vph) 15 42 14 1Hadj (s) 0.10 -0.30 0.01 0.09Departure Headway (s) 4.9 4.6 4.7 4.8Degree Utilization, x 0.22 0.09 0.21 0.22Capacity (veh/h) 686 711 725 711Control Delay (s) 9.2 8.1 8.9 9.1Approach Delay (s) 9.2 8.1 8.9 9.1Approach LOS A A A A
Intersection SummaryDelay 8.9HCM Level of Service AIntersection Capacity Utilization 37.2% ICU Level of Service AAnalysis Period (min) 15

1: Brotherton Rd & Felicita Rd 2/9/20102/9/2010 Existing - PM
N:\1944\Analysis\Ex - PM.sy7 Synchro 6 ReportLinscott, Law & Greenspan Engineers Page 1
Movement EBL EBT EBR WBL WBT WBR NBL NBT NBR SBL SBT SBRLane ConfigurationsSign Control Stop Stop Free FreeGrade 0% 0% 0% 0%Volume (veh/h) 2 0 2 2 0 9 3 641 17 13 394 4Peak Hour Factor 0.92 0.92 0.92 0.92 0.92 0.92 0.92 0.92 0.92 0.92 0.92 0.92Hourly flow rate (vph) 2 0 2 2 0 10 3 697 18 14 428 4PedestriansLane Width (ft)Walking Speed (ft/s)Percent BlockageRight turn flare (veh)Median type None NoneMedian storage veh)Upstream signal (ft)pX, platoon unblockedvC, conflicting volume 1181 1180 430 1173 1173 706 433 715vC1, stage 1 conf volvC2, stage 2 conf volvCu, unblocked vol 1181 1180 430 1173 1173 706 433 715tC, single (s) 7.1 6.5 6.2 7.1 6.5 6.2 4.1 4.1tC, 2 stage (s)tF (s) 3.5 4.0 3.3 3.5 4.0 3.3 2.2 2.2p0 queue free % 99 100 100 99 100 98 100 98cM capacity (veh/h) 161 187 625 166 188 436 1127 885
Direction, Lane # EB 1 WB 1 NB 1 SB 1Volume Total 4 12 718 447Volume Left 2 2 3 14Volume Right 2 10 18 4cSH 256 336 1127 885Volume to Capacity 0.02 0.04 0.00 0.02Queue Length 95th (ft) 1 3 0 1Control Delay (s) 19.3 16.1 0.1 0.5Lane LOS C C A AApproach Delay (s) 19.3 16.1 0.1 0.5Approach LOS C C
Intersection SummaryAverage Delay 0.5Intersection Capacity Utilization 46.0% ICU Level of Service AAnalysis Period (min) 15
2: Brotherton Rd & Miller Avenue 2/9/20102/9/2010 Existing - PM
N:\1944\Analysis\Ex - PM.sy7 Synchro 6 ReportLinscott, Law & Greenspan Engineers Page 2
Movement EBL EBT EBR WBL WBT WBR NBL NBT NBR SBL SBT SBRLane ConfigurationsSign Control Stop Stop Free FreeGrade 0% 0% 0% 0%Volume (veh/h) 7 2 2 9 9 17 2 41 3 5 22 7Peak Hour Factor 0.92 0.92 0.92 0.92 0.92 0.92 0.92 0.92 0.92 0.92 0.92 0.92Hourly flow rate (vph) 8 2 2 10 10 18 2 45 3 5 24 8Pedestrians 6 20 66Lane Width (ft) 12.0 12.0 12.0Walking Speed (ft/s) 4.0 4.0 4.0Percent Blockage 0 2 6Right turn flare (veh)Median type None NoneMedian storage veh)Upstream signal (ft)pX, platoon unblockedvC, conflicting volume 184 117 34 112 119 132 38 68vC1, stage 1 conf volvC2, stage 2 conf volvCu, unblocked vol 184 117 34 112 119 132 38 68tC, single (s) 7.1 6.5 6.2 7.1 6.5 6.2 4.1 4.1tC, 2 stage (s)tF (s) 3.5 4.0 3.3 3.5 4.0 3.3 2.2 2.2p0 queue free % 99 100 100 99 99 98 100 100cM capacity (veh/h) 693 753 1034 830 751 852 1565 1508
Direction, Lane # EB 1 WB 1 NB 1 SB 1Volume Total 12 38 50 37Volume Left 8 10 2 5Volume Right 2 18 3 8cSH 749 818 1565 1508Volume to Capacity 0.02 0.05 0.00 0.00Queue Length 95th (ft) 1 4 0 0Control Delay (s) 9.9 9.6 0.3 1.1Lane LOS A A A AApproach Delay (s) 9.9 9.6 0.3 1.1Approach LOS A A
Intersection SummaryAverage Delay 4.0Intersection Capacity Utilization 27.2% ICU Level of Service AAnalysis Period (min) 15

3: Brotherton Rd & Centre City Pkwy 2/9/20102/9/2010 Existing - PM
N:\1944\Analysis\Ex - PM.sy7 Synchro 6 ReportLinscott, Law & Greenspan Engineers Page 3
Movement EBL EBT EBR WBL WBT WBR NBL NBT NBR SBL SBT SBRLane ConfigurationsSign Control Stop Stop Free FreeGrade 0% 0% 0% 0%Volume (veh/h) 0 0 5 0 0 37 23 1450 150 32 692 31Peak Hour Factor 0.92 0.92 0.92 0.92 0.92 0.92 0.92 0.92 0.92 0.92 0.92 0.92Hourly flow rate (vph) 0 0 5 0 0 40 25 1576 163 35 752 34PedestriansLane Width (ft)Walking Speed (ft/s)Percent BlockageRight turn flare (veh)Median type None NoneMedian storage veh)Upstream signal (ft)pX, platoon unblockedvC, conflicting volume 1717 2628 393 2159 2563 870 786 1739vC1, stage 1 conf volvC2, stage 2 conf volvCu, unblocked vol 1717 2628 393 2159 2563 870 786 1739tC, single (s) 7.5 6.5 6.9 7.5 6.5 6.9 4.1 4.1tC, 2 stage (s)tF (s) 3.5 4.0 3.3 3.5 4.0 3.3 2.2 2.2p0 queue free % 100 100 99 100 100 86 97 90cM capacity (veh/h) 45 21 606 24 23 295 829 358
Direction, Lane # EB 1 WB 1 NB 1 NB 2 NB 3 SB 1 SB 2 SB 3Volume Total 5 40 25 1051 688 35 501 284Volume Left 0 0 25 0 0 35 0 0Volume Right 5 40 0 0 163 0 0 34cSH 606 295 829 1700 1700 358 1700 1700Volume to Capacity 0.01 0.14 0.03 0.62 0.40 0.10 0.29 0.17Queue Length 95th (ft) 1 12 2 0 0 8 0 0Control Delay (s) 11.0 19.1 9.5 0.0 0.0 16.1 0.0 0.0Lane LOS B C A CApproach Delay (s) 11.0 19.1 0.1 0.7Approach LOS B C
Intersection SummaryAverage Delay 0.6Intersection Capacity Utilization 54.9% ICU Level of Service AAnalysis Period (min) 15
4: Brotherton Rd & Escondido Blvd 2/9/20102/9/2010 Existing - PM
N:\1944\Analysis\Ex - PM.sy7 Synchro 6 ReportLinscott, Law & Greenspan Engineers Page 4
Movement EBL EBT EBR WBL WBT WBR NBL NBT NBR SBL SBT SBRLane ConfigurationsSign Control Stop Stop Stop StopVolume (vph) 114 62 11 22 15 39 20 127 17 40 130 2Peak Hour Factor 0.92 0.92 0.92 0.92 0.92 0.92 0.92 0.92 0.92 0.92 0.92 0.92Hourly flow rate (vph) 124 67 12 24 16 42 22 138 18 43 141 2
Direction, Lane # EB 1 WB 1 NB 1 SB 1Volume Total (vph) 203 83 178 187Volume Left (vph) 124 24 22 43Volume Right (vph) 12 42 18 2Hadj (s) 0.12 -0.22 0.00 0.07Departure Headway (s) 5.1 4.9 4.9 5.0Degree Utilization, x 0.29 0.11 0.24 0.26Capacity (veh/h) 662 659 686 677Control Delay (s) 10.1 8.5 9.5 9.7Approach Delay (s) 10.1 8.5 9.5 9.7Approach LOS B A A A
Intersection SummaryDelay 9.6HCM Level of Service AIntersection Capacity Utilization 39.4% ICU Level of Service AAnalysis Period (min) 15

LINSCOTT, LAW & GREENSPAN, engineers LLG Ref. 3-10-1944 Talk-of-the-Town
INTERSECTION ANALYSIS WORKSHEETS - EXISTING + PROJECT + CUMULATIVE PROJECTS
1: Brotherton Rd & Felicita Rd 2/10/20102/10/2010 Ex + Proj + Cumu Proj- AM
N:\1944\Analysis\Ex+Proj+Cumu P - AM.sy7 Synchro 6 ReportLinscott, Law & Greenspan Engineers Page 1
Movement EBL EBT EBR WBL WBT WBR NBL NBT NBR SBL SBT SBRLane ConfigurationsSign Control Stop Stop Free FreeGrade 0% 0% 0% 0%Volume (veh/h) 2 2 3 21 2 70 0 324 47 29 680 3Peak Hour Factor 0.92 0.92 0.92 0.92 0.92 0.92 0.92 0.92 0.92 0.92 0.92 0.92Hourly flow rate (vph) 2 2 3 23 2 76 0 352 51 32 739 3PedestriansLane Width (ft)Walking Speed (ft/s)Percent BlockageRight turn flare (veh)Median type None NoneMedian storage veh)Upstream signal (ft)pX, platoon unblockedvC, conflicting volume 1259 1207 741 1186 1183 378 742 403vC1, stage 1 conf volvC2, stage 2 conf volvCu, unblocked vol 1259 1207 741 1186 1183 378 742 403tC, single (s) 7.1 6.5 6.2 7.1 6.5 6.2 4.1 4.1tC, 2 stage (s)tF (s) 3.5 4.0 3.3 3.5 4.0 3.3 2.2 2.2p0 queue free % 98 99 99 86 99 89 100 97cM capacity (veh/h) 127 178 416 159 184 669 865 1155
Direction, Lane # EB 1 WB 1 NB 1 SB 1Volume Total 8 101 403 774Volume Left 2 23 0 32Volume Right 3 76 51 3cSH 205 376 865 1155Volume to Capacity 0.04 0.27 0.00 0.03Queue Length 95th (ft) 3 27 0 2Control Delay (s) 23.3 18.1 0.0 0.7Lane LOS C C AApproach Delay (s) 23.3 18.1 0.0 0.7Approach LOS C C
Intersection SummaryAverage Delay 2.0Intersection Capacity Utilization 73.1% ICU Level of Service DAnalysis Period (min) 15
2: Brotherton Rd & Miller Avenue 2/10/20102/10/2010 Ex + Proj + Cumu Proj- AM
N:\1944\Analysis\Ex+Proj+Cumu P - AM.sy7 Synchro 6 ReportLinscott, Law & Greenspan Engineers Page 2
Movement EBL EBT EBR WBL WBT WBR NBL NBT NBR SBL SBT SBRLane ConfigurationsSign Control Stop Stop Free FreeGrade 0% 0% 0% 0%Volume (veh/h) 16 12 39 20 23 27 27 93 8 20 129 43Peak Hour Factor 0.92 0.92 0.92 0.92 0.92 0.92 0.92 0.92 0.92 0.92 0.92 0.92Hourly flow rate (vph) 17 13 42 22 25 29 29 101 9 22 140 47Pedestrians 6 20 66Lane Width (ft) 12.0 12.0 12.0Walking Speed (ft/s) 4.0 4.0 4.0Percent Blockage 0 2 6Right turn flare (veh)Median type None NoneMedian storage veh)Upstream signal (ft)pX, platoon unblockedvC, conflicting volume 485 402 170 440 421 191 193 130vC1, stage 1 conf volvC2, stage 2 conf volvCu, unblocked vol 485 402 170 440 421 191 193 130tC, single (s) 7.1 6.5 6.2 7.1 6.5 6.2 4.1 4.1tC, 2 stage (s)tF (s) 3.5 4.0 3.3 3.5 4.0 3.3 2.2 2.2p0 queue free % 96 97 95 95 95 96 98 98cM capacity (veh/h) 410 507 870 463 494 790 1373 1431
Direction, Lane # EB 1 WB 1 NB 1 SB 1Volume Total 73 76 139 209Volume Left 17 22 29 22Volume Right 42 29 9 47cSH 623 565 1373 1431Volume to Capacity 0.12 0.13 0.02 0.02Queue Length 95th (ft) 10 12 2 1Control Delay (s) 11.5 12.4 1.8 0.9Lane LOS B B A AApproach Delay (s) 11.5 12.4 1.8 0.9Approach LOS B B
Intersection SummaryAverage Delay 4.5Intersection Capacity Utilization 32.1% ICU Level of Service AAnalysis Period (min) 15

3: Brotherton Rd & Centre City Pkwy 2/10/20102/10/2010 Ex + Proj + Cumu Proj- AM
N:\1944\Analysis\Ex+Proj+Cumu P - AM.sy7 Synchro 6 ReportLinscott, Law & Greenspan Engineers Page 3
Movement EBL EBT EBR WBL WBT WBR NBL NBT NBR SBL SBT SBRLane ConfigurationsSign Control Stop Stop Free FreeGrade 0% 0% 0% 0%Volume (veh/h) 0 0 58 0 0 14 20 789 39 26 1087 97Peak Hour Factor 0.92 0.92 0.92 0.92 0.92 0.92 0.92 0.92 0.92 0.92 0.92 0.92Hourly flow rate (vph) 0 0 63 0 0 15 22 858 42 28 1182 105PedestriansLane Width (ft)Walking Speed (ft/s)Percent BlockageRight turn flare (veh)Median type None NoneMedian storage veh)Upstream signal (ft)pX, platoon unblockedvC, conflicting volume 1778 2234 643 1633 2266 450 1287 900vC1, stage 1 conf volvC2, stage 2 conf volvCu, unblocked vol 1778 2234 643 1633 2266 450 1287 900tC, single (s) 7.5 6.5 6.9 7.5 6.5 6.9 4.1 4.1tC, 2 stage (s)tF (s) 3.5 4.0 3.3 3.5 4.0 3.3 2.2 2.2p0 queue free % 100 100 85 100 100 97 96 96cM capacity (veh/h) 48 39 416 54 37 556 535 751
Direction, Lane # EB 1 WB 1 NB 1 NB 2 NB 3 SB 1 SB 2 SB 3Volume Total 63 15 22 572 328 28 788 499Volume Left 0 0 22 0 0 28 0 0Volume Right 63 15 0 0 42 0 0 105cSH 416 556 535 1700 1700 751 1700 1700Volume to Capacity 0.15 0.03 0.04 0.34 0.19 0.04 0.46 0.29Queue Length 95th (ft) 13 2 3 0 0 3 0 0Control Delay (s) 15.2 11.7 12.0 0.0 0.0 10.0 0.0 0.0Lane LOS C B B AApproach Delay (s) 15.2 11.7 0.3 0.2Approach LOS C B
Intersection SummaryAverage Delay 0.7Intersection Capacity Utilization 43.4% ICU Level of Service AAnalysis Period (min) 15
4: Brotherton Rd & Escondido Blvd 2/10/20102/10/2010 Ex + Proj + Cumu Proj- AM
N:\1944\Analysis\Ex+Proj+Cumu P - AM.sy7 Synchro 6 ReportLinscott, Law & Greenspan Engineers Page 4
Movement EBL EBT EBR WBL WBT WBR NBL NBT NBR SBL SBT SBRLane ConfigurationsSign Control Stop Stop Stop StopVolume (vph) 26 33 5 12 9 31 4 75 5 50 183 0Peak Hour Factor 0.92 0.92 0.92 0.92 0.92 0.92 0.92 0.92 0.92 0.92 0.92 0.92Hourly flow rate (vph) 28 36 5 13 10 34 4 82 5 54 199 0
Direction, Lane # EB 1 WB 1 NB 1 SB 1Volume Total (vph) 70 57 91 253Volume Left (vph) 28 13 4 54Volume Right (vph) 5 34 5 0Hadj (s) 0.07 -0.28 0.01 0.08Departure Headway (s) 4.8 4.5 4.5 4.4Degree Utilization, x 0.09 0.07 0.11 0.31Capacity (veh/h) 685 729 762 789Control Delay (s) 8.3 7.9 8.1 9.3Approach Delay (s) 8.3 7.9 8.1 9.3Approach LOS A A A A
Intersection SummaryDelay 8.8HCM Level of Service AIntersection Capacity Utilization 31.7% ICU Level of Service AAnalysis Period (min) 15

1: Brotherton Rd & Felicita Rd 2/10/20102/10/2010 Ex + Proj + Cumu Proj - PM
N:\1944\Analysis\Ex+Proj+Cumu P - PM.sy7 Synchro 6 ReportLinscott, Law & Greenspan Engineers Page 1
Movement EBL EBT EBR WBL WBT WBR NBL NBT NBR SBL SBT SBRLane ConfigurationsSign Control Stop Stop Free FreeGrade 0% 0% 0% 0%Volume (veh/h) 2 0 2 6 0 11 3 641 22 15 394 4Peak Hour Factor 0.92 0.92 0.92 0.92 0.92 0.92 0.92 0.92 0.92 0.92 0.92 0.92Hourly flow rate (vph) 2 0 2 7 0 12 3 697 24 16 428 4PedestriansLane Width (ft)Walking Speed (ft/s)Percent BlockageRight turn flare (veh)Median type None NoneMedian storage veh)Upstream signal (ft)pX, platoon unblockedvC, conflicting volume 1190 1190 430 1180 1180 709 433 721vC1, stage 1 conf volvC2, stage 2 conf volvCu, unblocked vol 1190 1190 430 1180 1180 709 433 721tC, single (s) 7.1 6.5 6.2 7.1 6.5 6.2 4.1 4.1tC, 2 stage (s)tF (s) 3.5 4.0 3.3 3.5 4.0 3.3 2.2 2.2p0 queue free % 99 100 100 96 100 97 100 98cM capacity (veh/h) 157 184 625 164 186 434 1127 881
Direction, Lane # EB 1 WB 1 NB 1 SB 1Volume Total 4 18 724 449Volume Left 2 7 3 16Volume Right 2 12 24 4cSH 251 274 1127 881Volume to Capacity 0.02 0.07 0.00 0.02Queue Length 95th (ft) 1 5 0 1Control Delay (s) 19.6 19.1 0.1 0.6Lane LOS C C A AApproach Delay (s) 19.6 19.1 0.1 0.6Approach LOS C C
Intersection SummaryAverage Delay 0.6Intersection Capacity Utilization 46.2% ICU Level of Service AAnalysis Period (min) 15
2: Brotherton Rd & Miller Avenue 2/10/20102/10/2010 Ex + Proj + Cumu Proj - PM
N:\1944\Analysis\Ex+Proj+Cumu P - PM.sy7 Synchro 6 ReportLinscott, Law & Greenspan Engineers Page 2
Movement EBL EBT EBR WBL WBT WBR NBL NBT NBR SBL SBT SBRLane ConfigurationsSign Control Stop Stop Free FreeGrade 0% 0% 0% 0%Volume (veh/h) 7 9 2 9 15 17 2 41 3 5 22 7Peak Hour Factor 0.92 0.92 0.92 0.92 0.92 0.92 0.92 0.92 0.92 0.92 0.92 0.92Hourly flow rate (vph) 8 10 2 10 16 18 2 45 3 5 24 8Pedestrians 6 20 66Lane Width (ft) 12.0 12.0 12.0Walking Speed (ft/s) 4.0 4.0 4.0Percent Blockage 0 2 6Right turn flare (veh)Median type None NoneMedian storage veh)Upstream signal (ft)pX, platoon unblockedvC, conflicting volume 188 117 34 116 119 132 38 68vC1, stage 1 conf volvC2, stage 2 conf volvCu, unblocked vol 188 117 34 116 119 132 38 68tC, single (s) 7.1 6.5 6.2 7.1 6.5 6.2 4.1 4.1tC, 2 stage (s)tF (s) 3.5 4.0 3.3 3.5 4.0 3.3 2.2 2.2p0 queue free % 99 99 100 99 98 98 100 100cM capacity (veh/h) 685 753 1034 819 751 852 1565 1508
Direction, Lane # EB 1 WB 1 NB 1 SB 1Volume Total 20 45 50 37Volume Left 8 10 2 5Volume Right 2 18 3 8cSH 747 805 1565 1508Volume to Capacity 0.03 0.06 0.00 0.00Queue Length 95th (ft) 2 4 0 0Control Delay (s) 10.0 9.7 0.3 1.1Lane LOS A A A AApproach Delay (s) 10.0 9.7 0.3 1.1Approach LOS A A
Intersection SummaryAverage Delay 4.5Intersection Capacity Utilization 27.2% ICU Level of Service AAnalysis Period (min) 15
3: Brotherton Rd & Centre City Pkwy 2/10/20102/10/2010 Ex + Proj + Cumu Proj - PM
N:\1944\Analysis\Ex+Proj+Cumu P - PM.sy7 Synchro 6 ReportLinscott, Law & Greenspan Engineers Page 3
Movement EBL EBT EBR WBL WBT WBR NBL NBT NBR SBL SBT SBRLane ConfigurationsSign Control Stop Stop Free FreeGrade 0% 0% 0% 0%Volume (veh/h) 0 0 59 0 0 37 44 1511 150 32 748 75Peak Hour Factor 0.92 0.92 0.92 0.92 0.92 0.92 0.92 0.92 0.92 0.92 0.92 0.92Hourly flow rate (vph) 0 0 64 0 0 40 48 1642 163 35 813 82PedestriansLane Width (ft)Walking Speed (ft/s)Percent BlockageRight turn flare (veh)Median type None NoneMedian storage veh)Upstream signal (ft)pX, platoon unblockedvC, conflicting volume 1880 2824 447 2360 2784 903 895 1805vC1, stage 1 conf volvC2, stage 2 conf volvCu, unblocked vol 1880 2824 447 2360 2784 903 895 1805tC, single (s) 7.5 6.5 6.9 7.5 6.5 6.9 4.1 4.1tC, 2 stage (s)tF (s) 3.5 4.0 3.3 3.5 4.0 3.3 2.2 2.2p0 queue free % 100 100 89 100 100 86 94 90cM capacity (veh/h) 33 15 559 15 16 280 754 337
Direction, Lane # EB 1 WB 1 NB 1 NB 2 NB 3 SB 1 SB 2 SB 3Volume Total 64 40 48 1095 711 35 542 353Volume Left 0 0 48 0 0 35 0 0Volume Right 64 40 0 0 163 0 0 82cSH 559 280 754 1700 1700 337 1700 1700Volume to Capacity 0.11 0.14 0.06 0.64 0.42 0.10 0.32 0.21Queue Length 95th (ft) 10 12 5 0 0 9 0 0Control Delay (s) 12.3 20.0 10.1 0.0 0.0 16.9 0.0 0.0Lane LOS B C B CApproach Delay (s) 12.3 20.0 0.3 0.6Approach LOS B C
Intersection SummaryAverage Delay 0.9Intersection Capacity Utilization 56.5% ICU Level of Service BAnalysis Period (min) 15
4: Brotherton Rd & Escondido Blvd 2/10/20102/10/2010 Ex + Proj + Cumu Proj - PM
N:\1944\Analysis\Ex+Proj+Cumu P - PM.sy7 Synchro 6 ReportLinscott, Law & Greenspan Engineers Page 4
Movement EBL EBT EBR WBL WBT WBR NBL NBT NBR SBL SBT SBRLane ConfigurationsSign Control Stop Stop Stop StopVolume (vph) 114 62 11 22 15 39 20 167 17 40 141 2Peak Hour Factor 0.92 0.92 0.92 0.92 0.92 0.92 0.92 0.92 0.92 0.92 0.92 0.92Hourly flow rate (vph) 124 67 12 24 16 42 22 182 18 43 153 2
Direction, Lane # EB 1 WB 1 NB 1 SB 1Volume Total (vph) 203 83 222 199Volume Left (vph) 124 24 22 43Volume Right (vph) 12 42 18 2Hadj (s) 0.12 -0.22 0.00 0.07Departure Headway (s) 5.2 5.1 5.0 5.0Degree Utilization, x 0.29 0.12 0.30 0.28Capacity (veh/h) 637 630 682 664Control Delay (s) 10.4 8.7 10.1 10.0Approach Delay (s) 10.4 8.7 10.1 10.0Approach LOS B A B A
Intersection SummaryDelay 10.0HCM Level of Service AIntersection Capacity Utilization 41.4% ICU Level of Service AAnalysis Period (min) 15