Embed Size (px)
Citation preview
ECGECG Dr. Mohammed Shaat Modified by : Dr. Amal Al Maqadma.
ElectrocardiographyElectrocardiography It is a voltage
difference, record the electrical activity of the heart as well as valuable information about the heart function and structure.
Willem Einthoven 1924
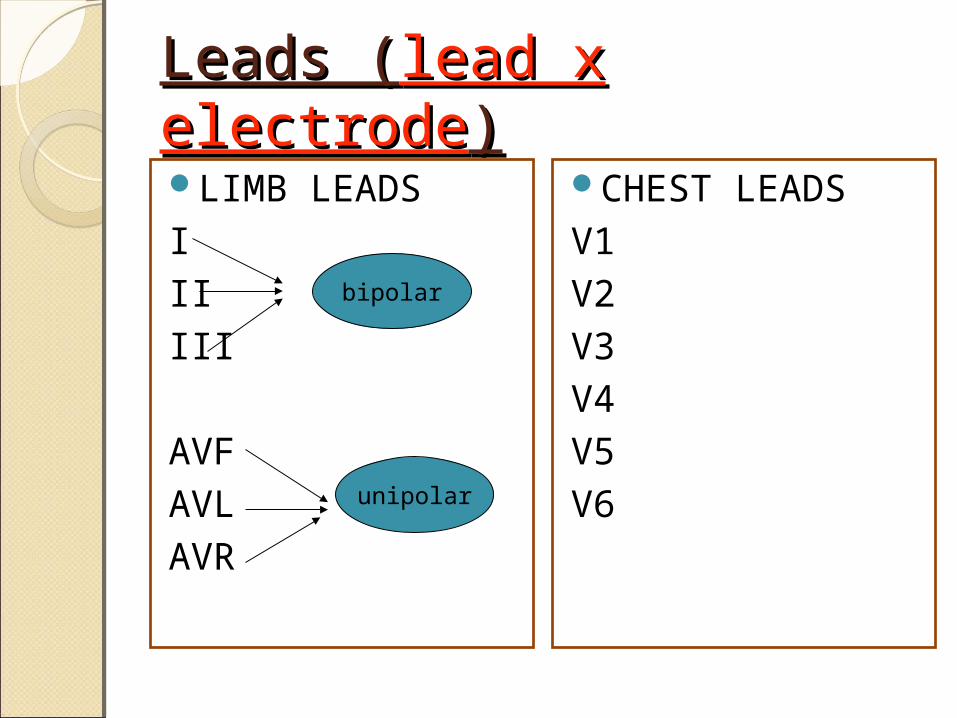
Leads (Leads (lead x electrodelead x electrode))LIMB LEADSIIIIII
AVFAVLAVR
CHEST LEADSV1V2V3V4V5V6
bipolar
unipolar
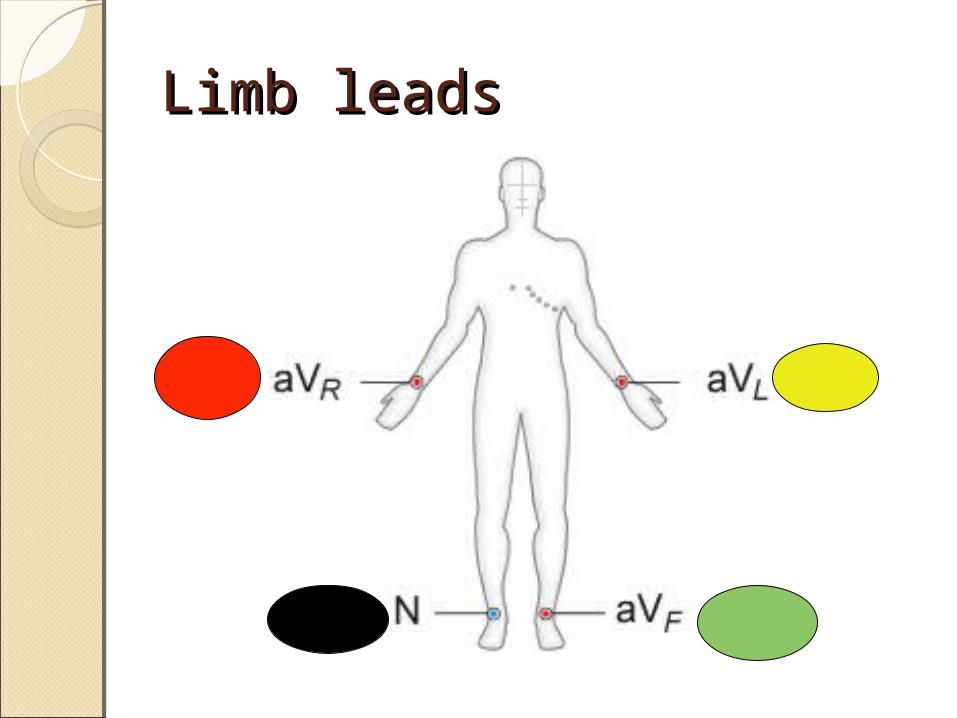
Limb leadsLimb leads
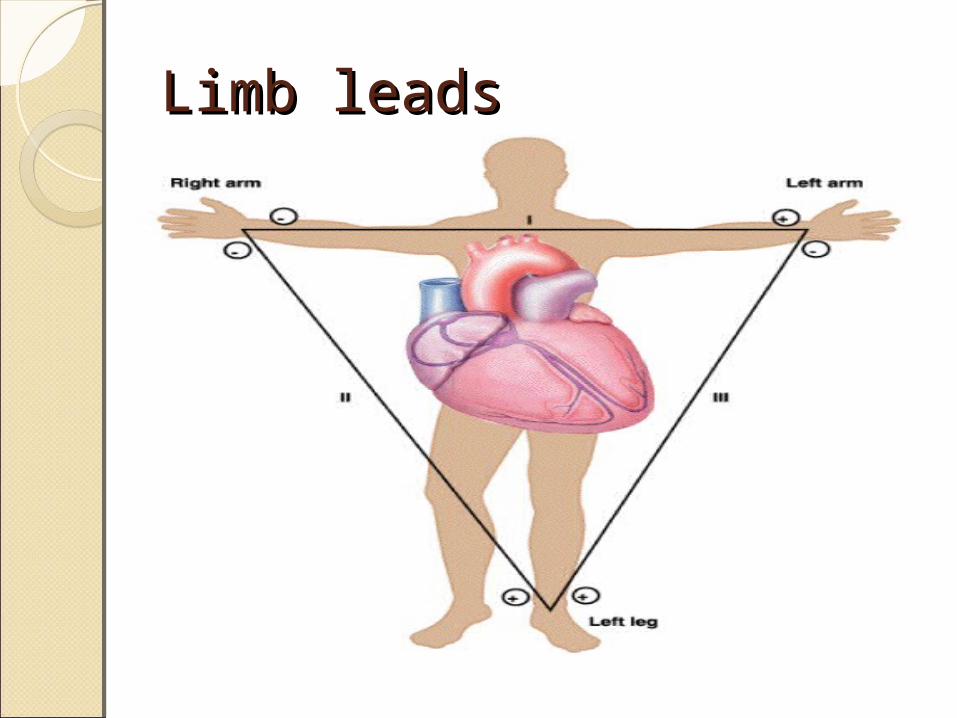
Limb leadsLimb leads
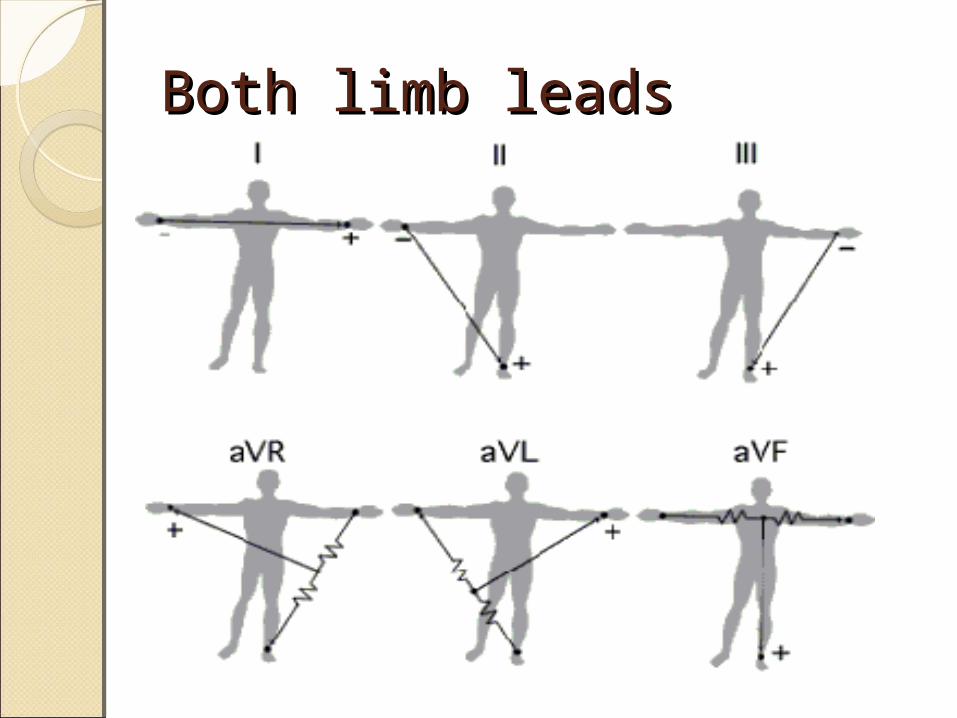
Both limb leadsBoth limb leads
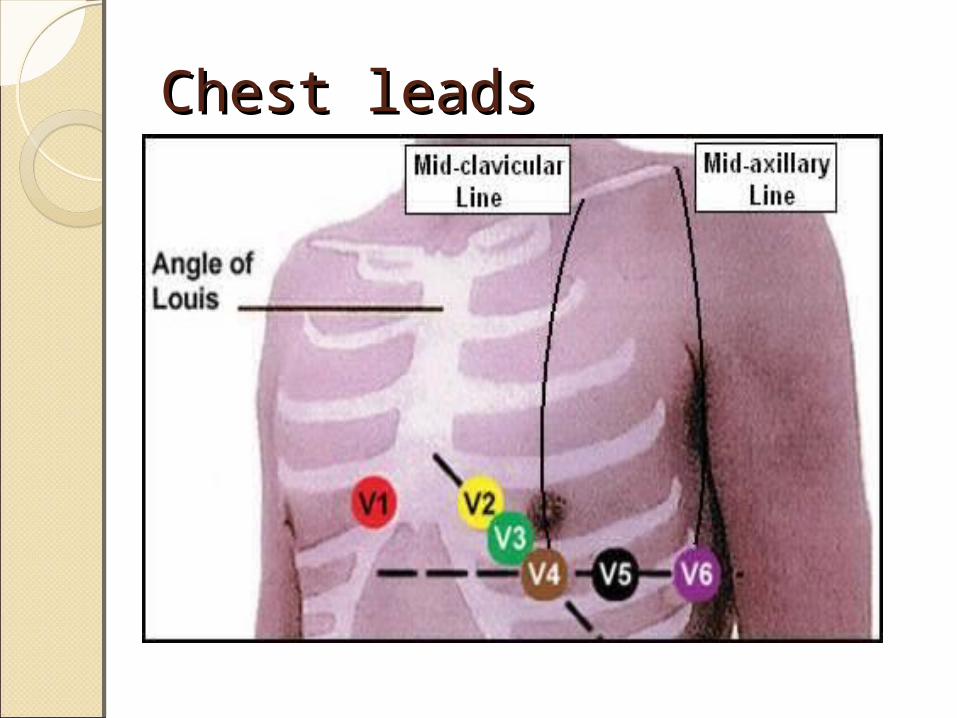
Chest leadsChest leads
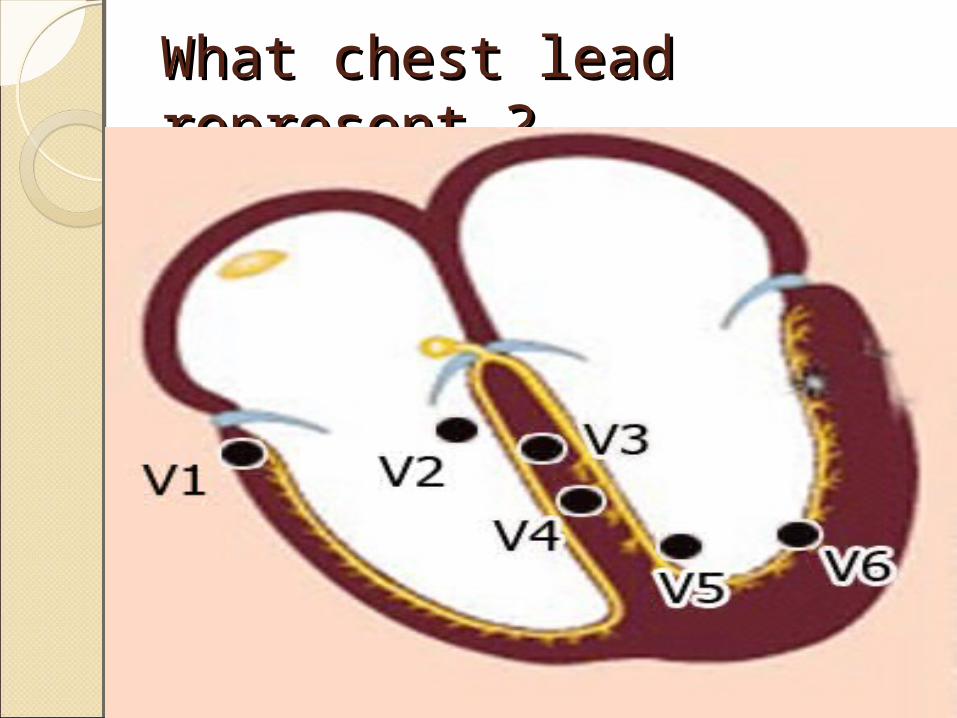
What chest lead represent What chest lead represent ??
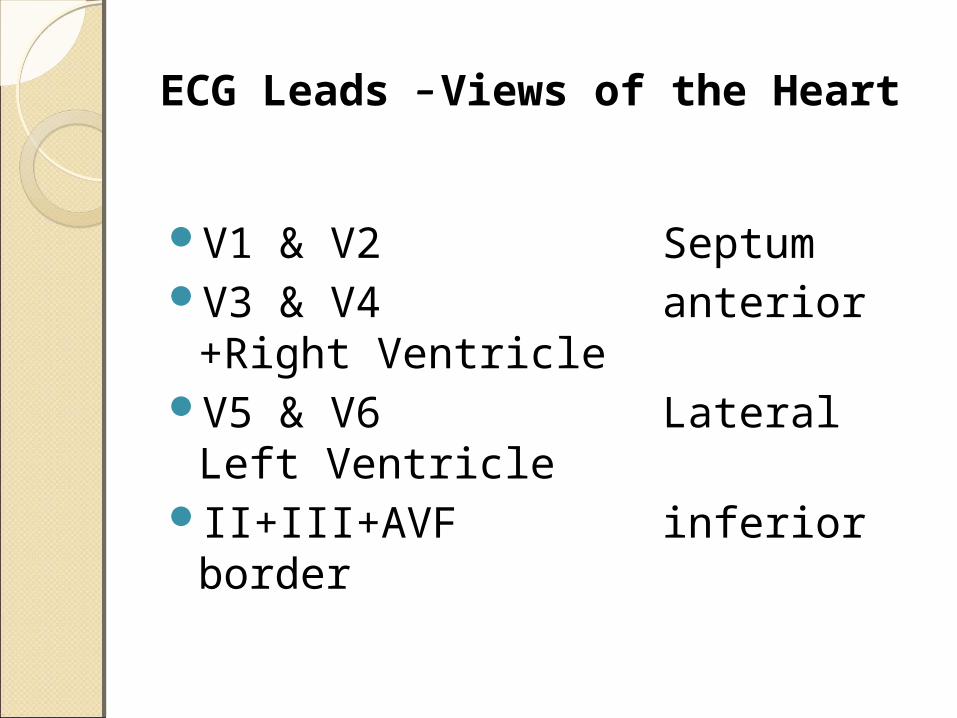
ECG Leads - Views of the Heart
V1 & V2 Septum V3 & V4 anterior +Right
Ventricle V5 & V6 Lateral Left
VentricleII+III+AVF inferior border
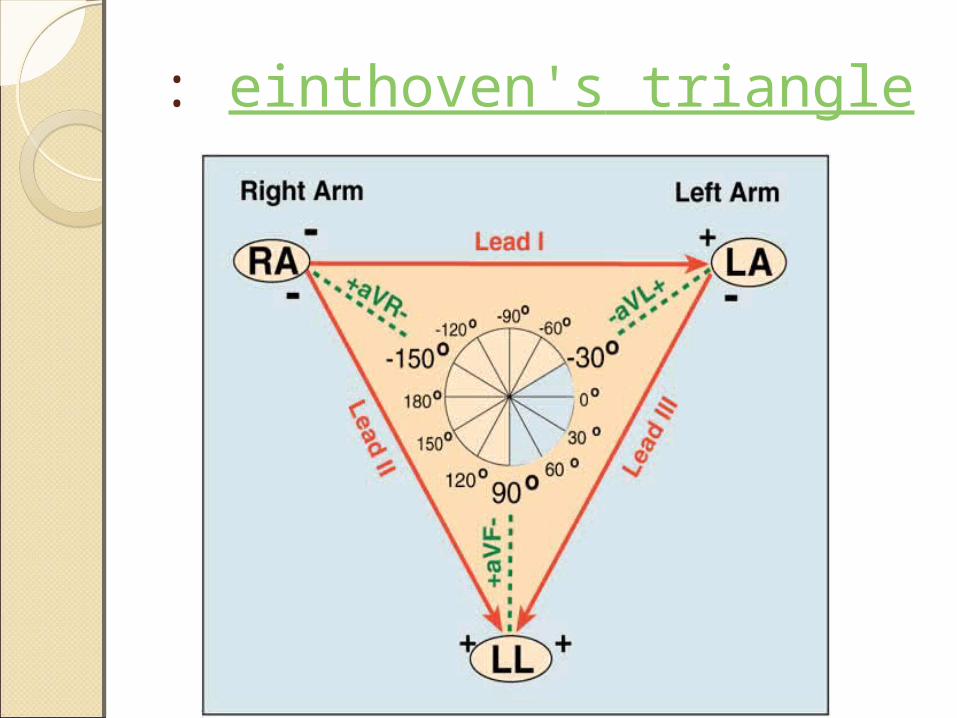
: einthoven's triangle
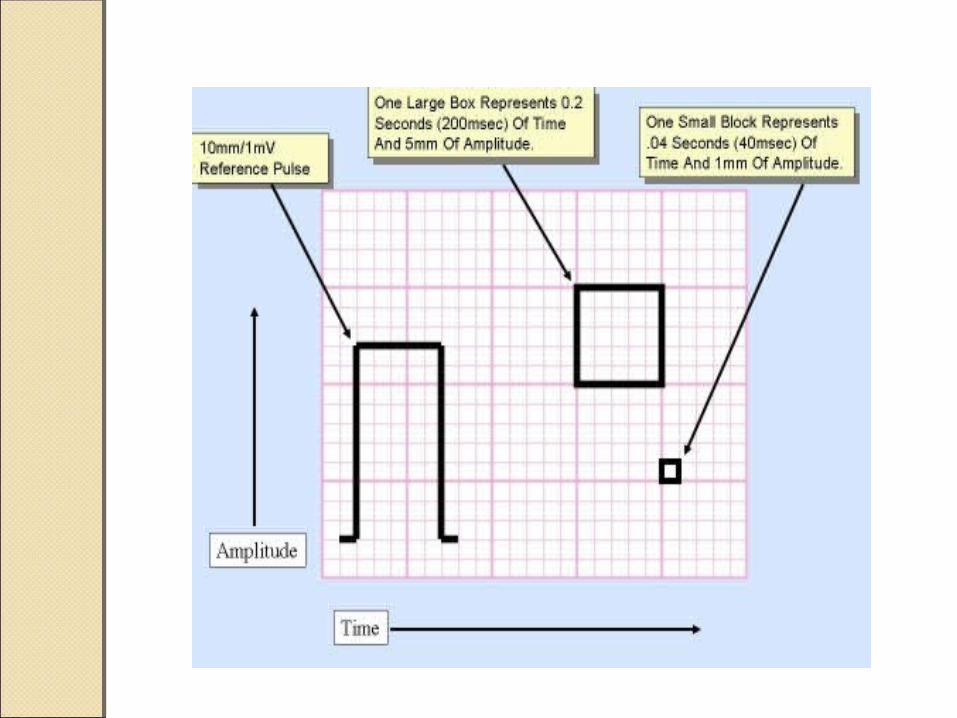
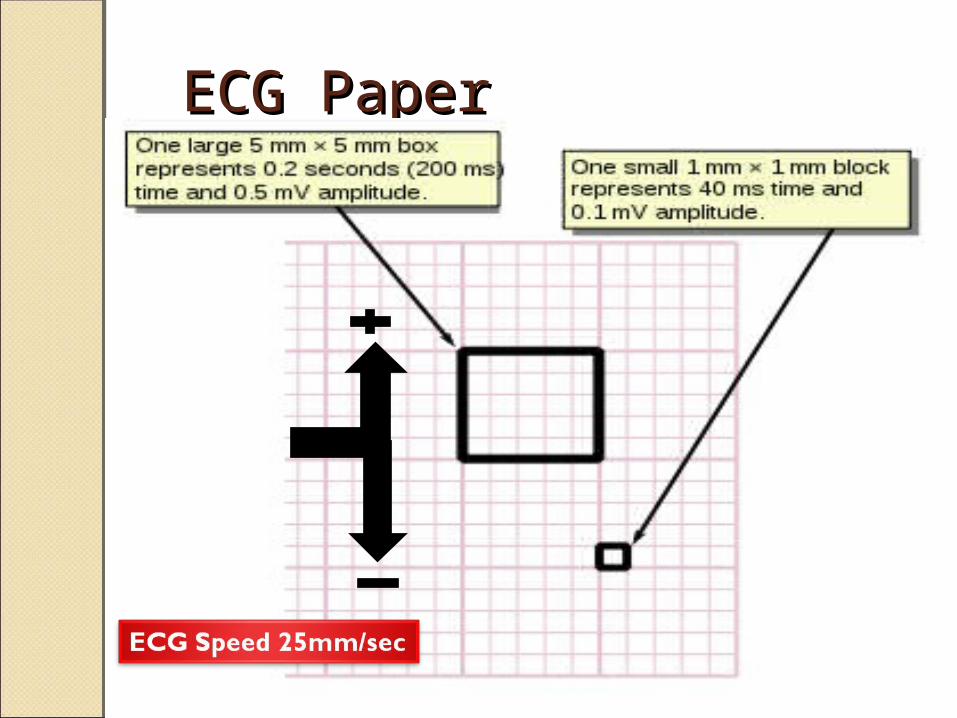
ECG PaperECG Paper
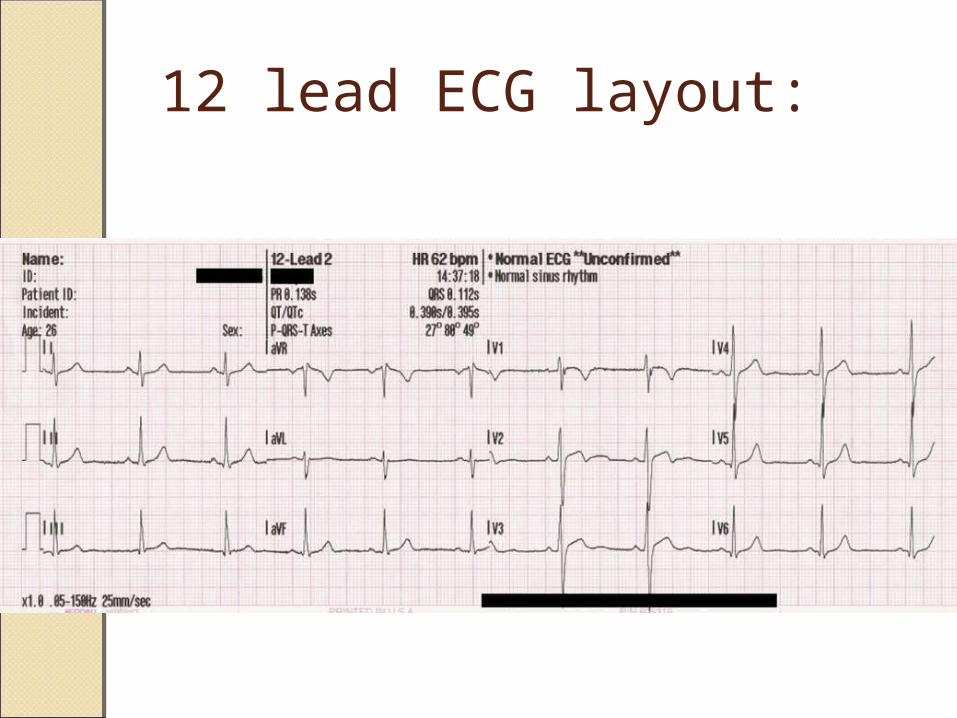
12 lead ECG layout:
See video
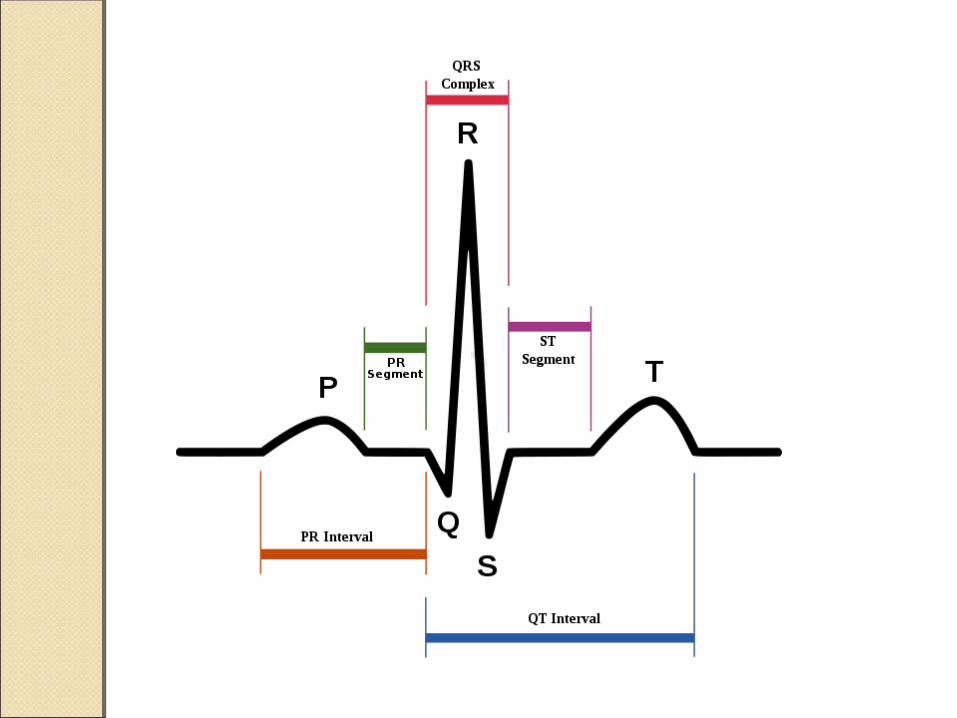
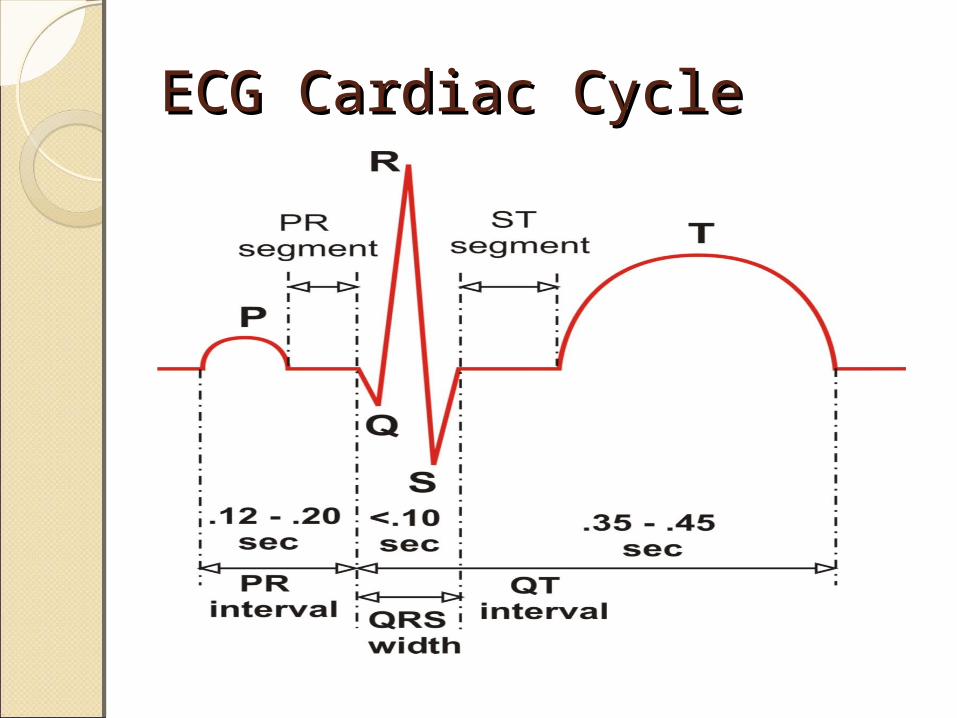
ECG Cardiac CycleECG Cardiac Cycle
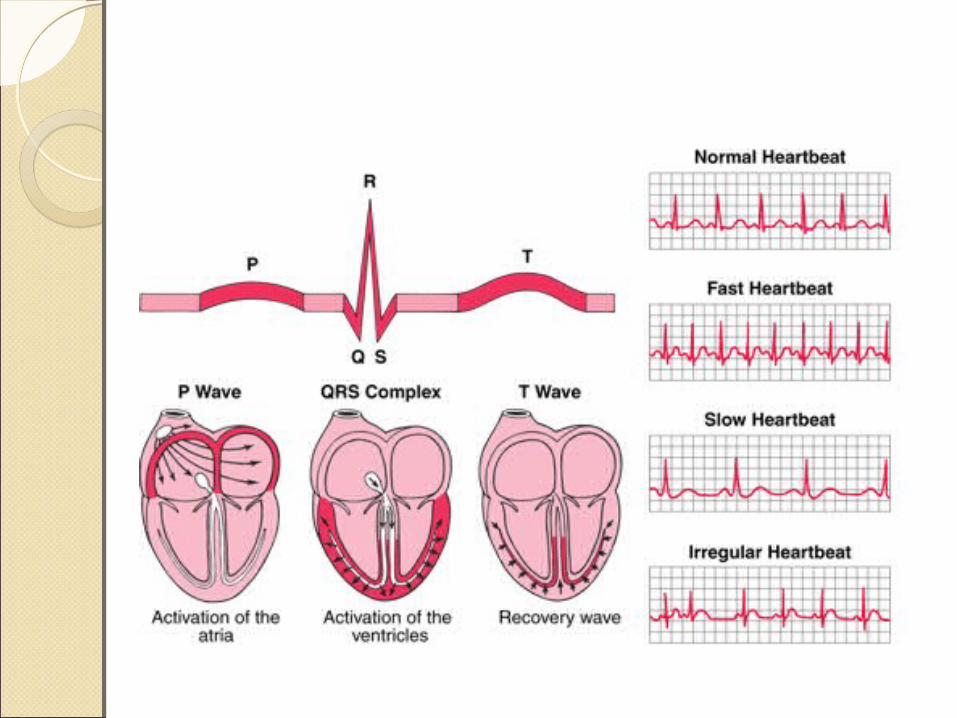
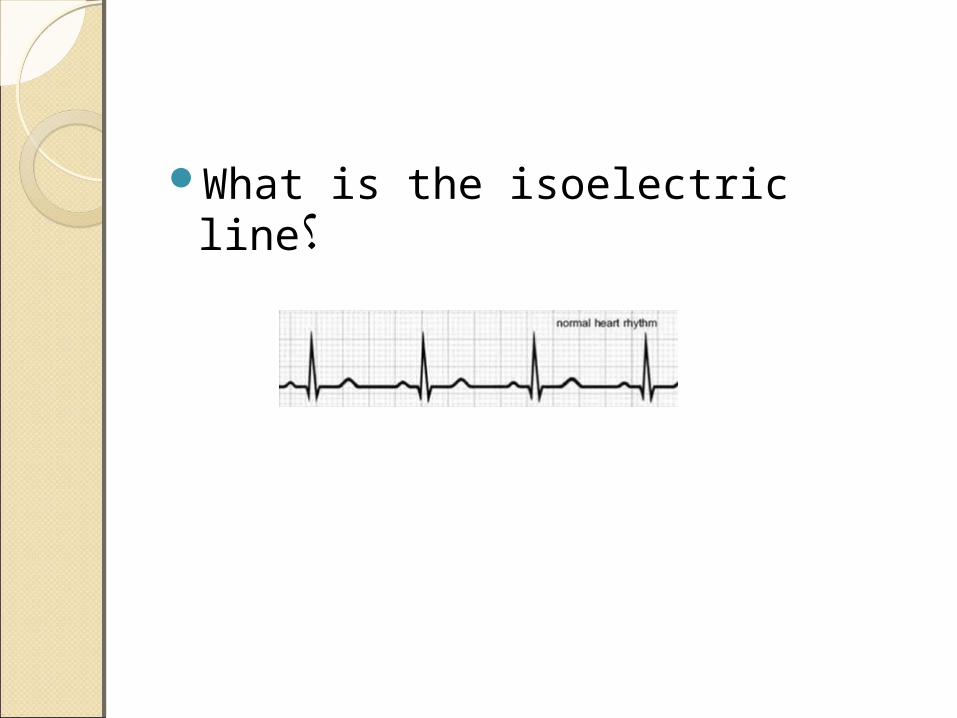
What is the isoelectric line؟
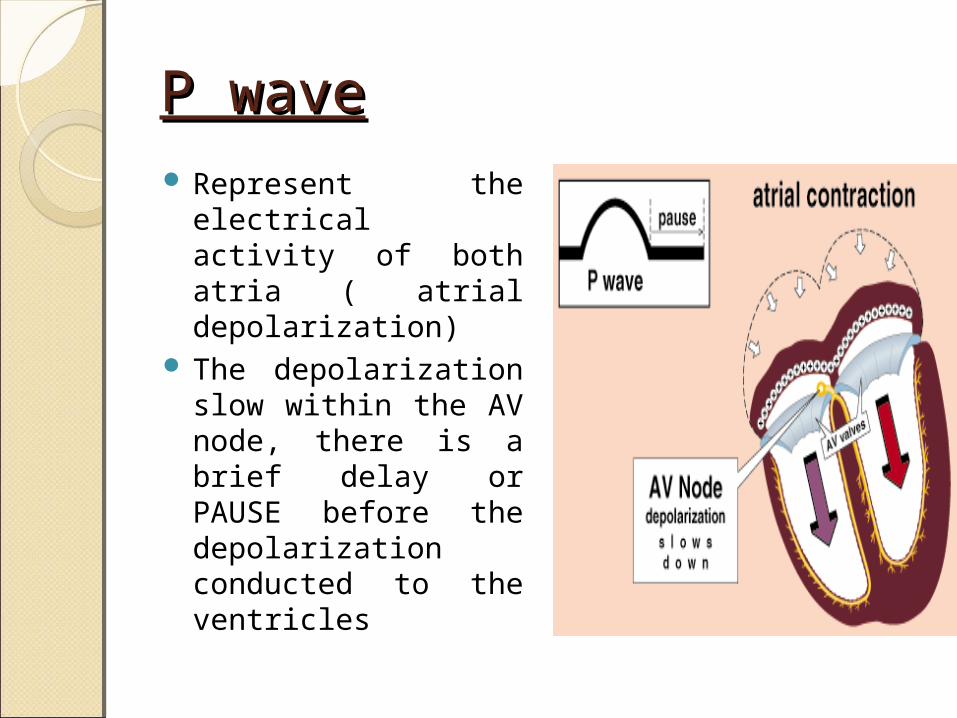
P waveP waveRepresent the
electrical activity of both atria ( atrial depolarization)
The depolarization slow within the AV node, there is a brief delay or PAUSE before the depolarization conducted to the ventricles
Normal duration <0.12 sec
Absent P wave:Atrial fibrillation SA BlockAV Rhythm
Peak P wave:Atrial hypertrophy
PR intervalPR interval
Normally :0.12-0.2sec
Prolonged in : heart block.
Short in : W-P-W syndrome.
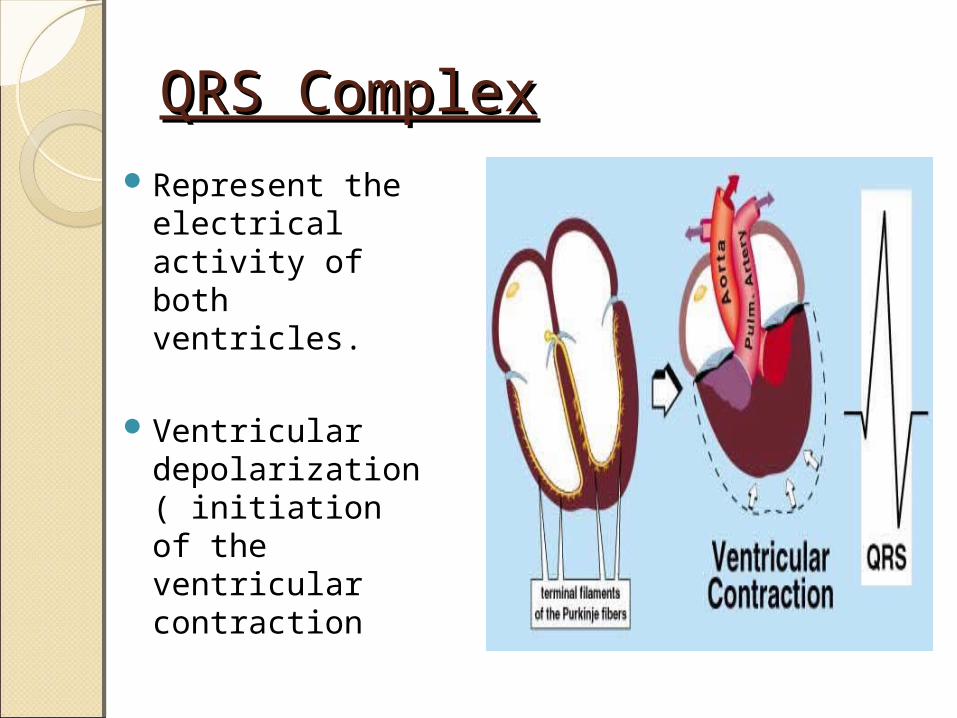
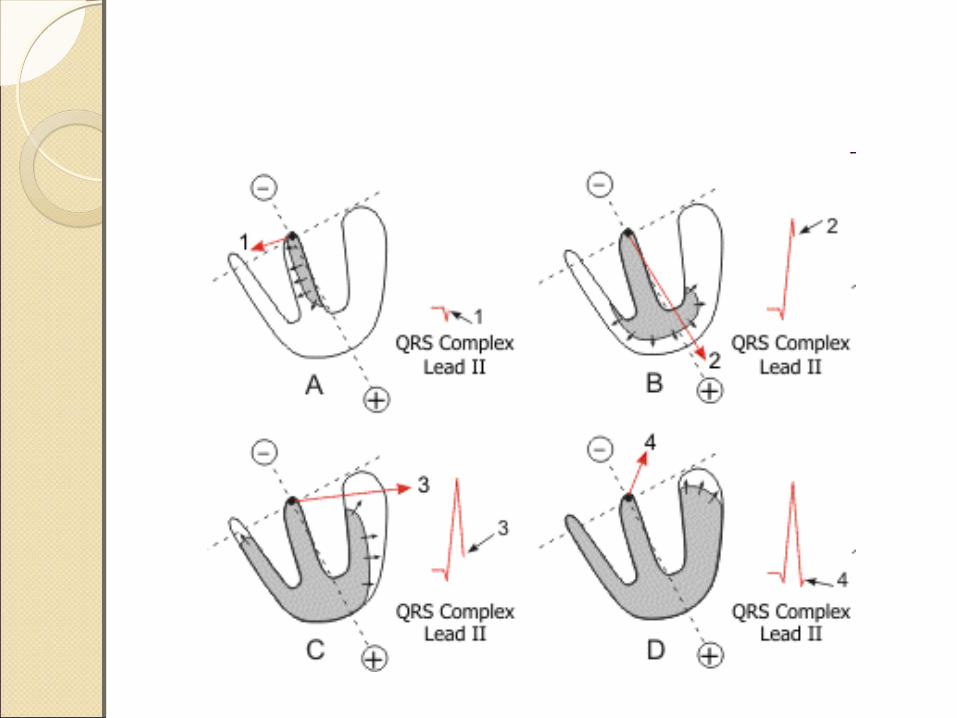
QRS ComplexQRS ComplexRepresent the
electrical activity of both ventricles.
Ventricular depolarization( initiation of the ventricular contraction
QRS ComplexQRS ComplexQQ wave wave
RR wavewave::
SS wave : wave :
: : Normal QRS duration < 0.12 secNormal QRS duration < 0.12 sec
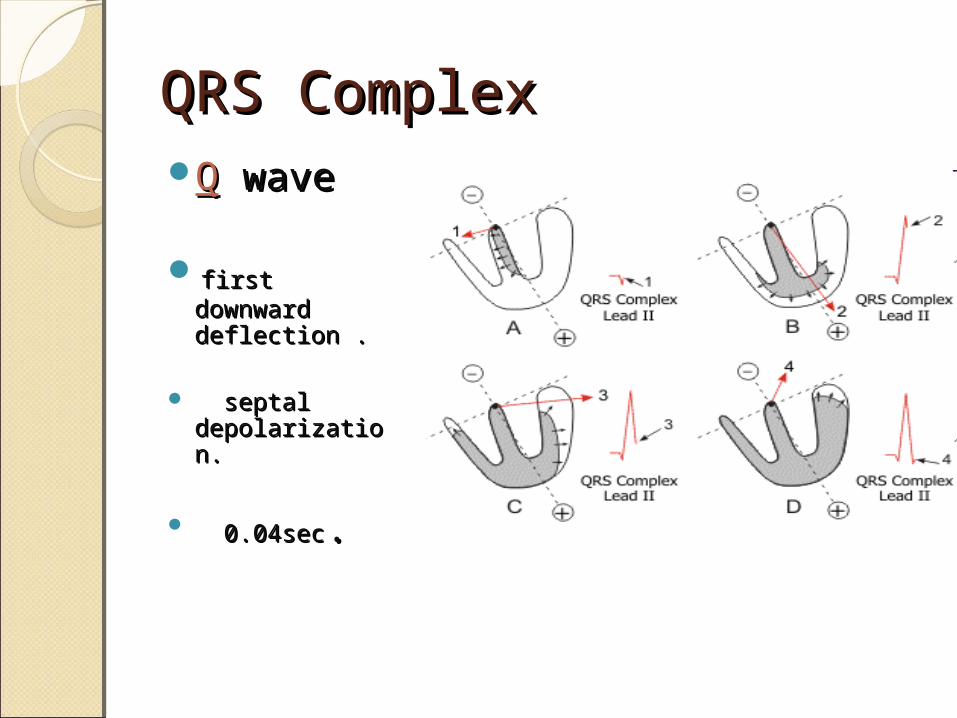
QRS ComplexQRS ComplexQQ wave wave
first first downward downward deflection deflection ..
septal septal depolarization.depolarization.
0.04sec0.04sec..
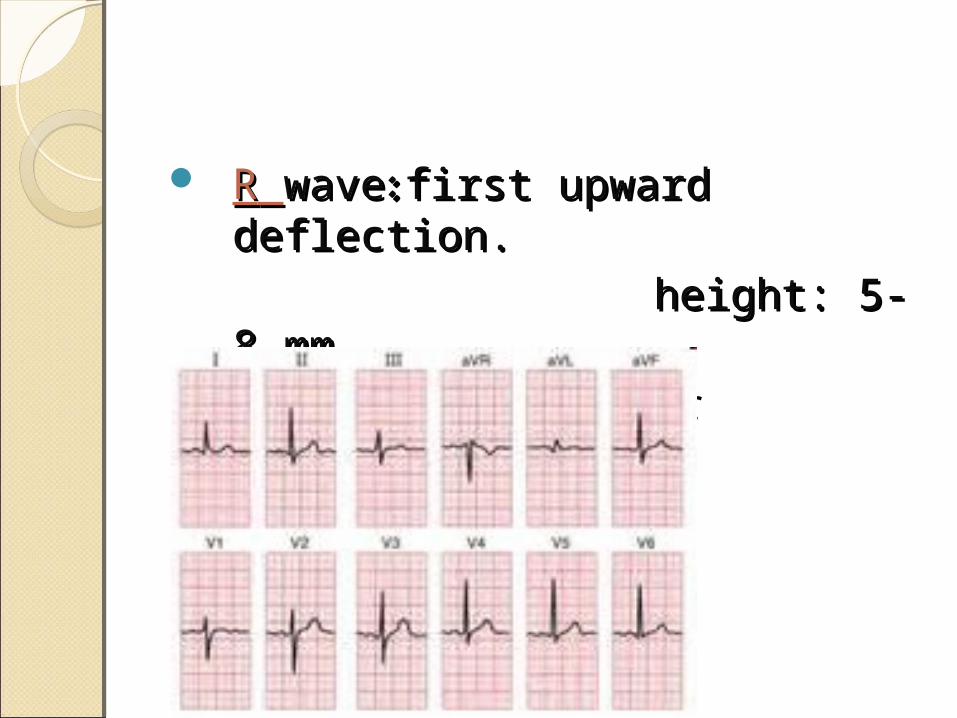
RR wavewave: : first upwardfirst upward deflection.deflection. height: 5-8 mm.height: 5-8 mm. early ventricular
depolarization
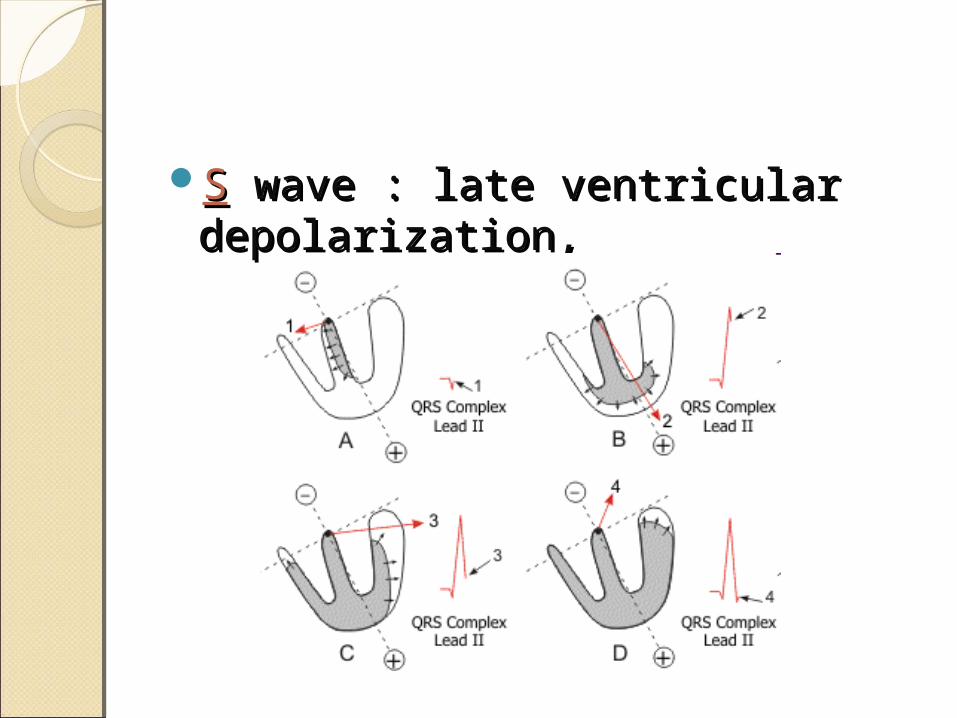
SS wave : late ventricular wave : late ventricular depolarization, depolarization,
Large QRS indicateLarge QRS indicate Ventricular hypertrophy.Ventricular hypertrophy.
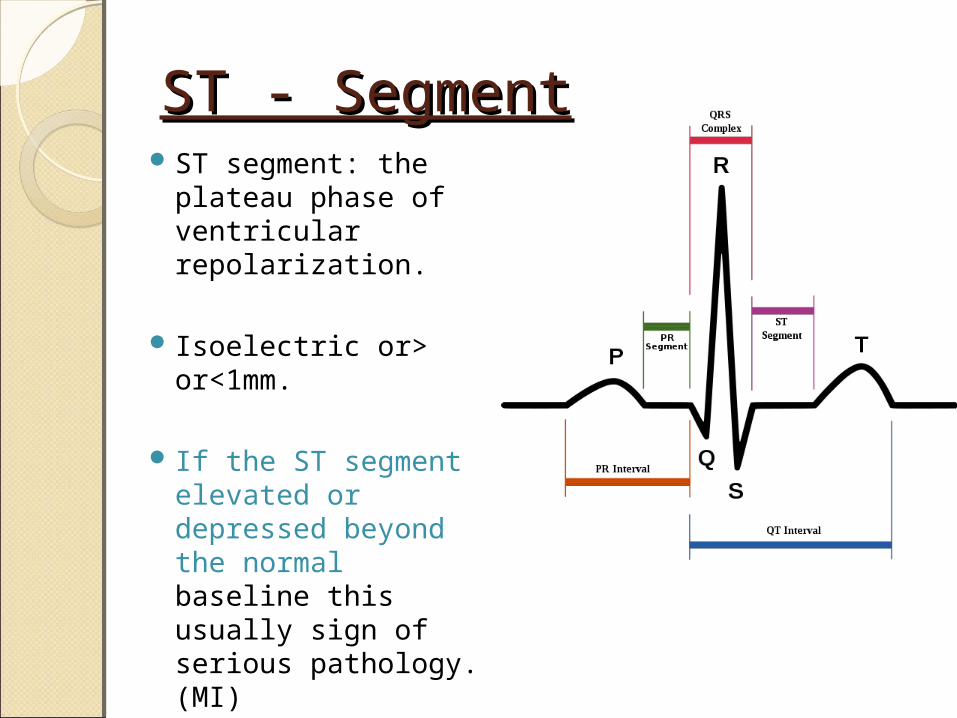
ST - SegmentST - SegmentST segment: the
plateau phase of ventricular repolarization.
Isoelectric or> or<1mm.
If the ST segment elevated or depressed beyond the normal baseline this usually sign of serious pathology. (MI)
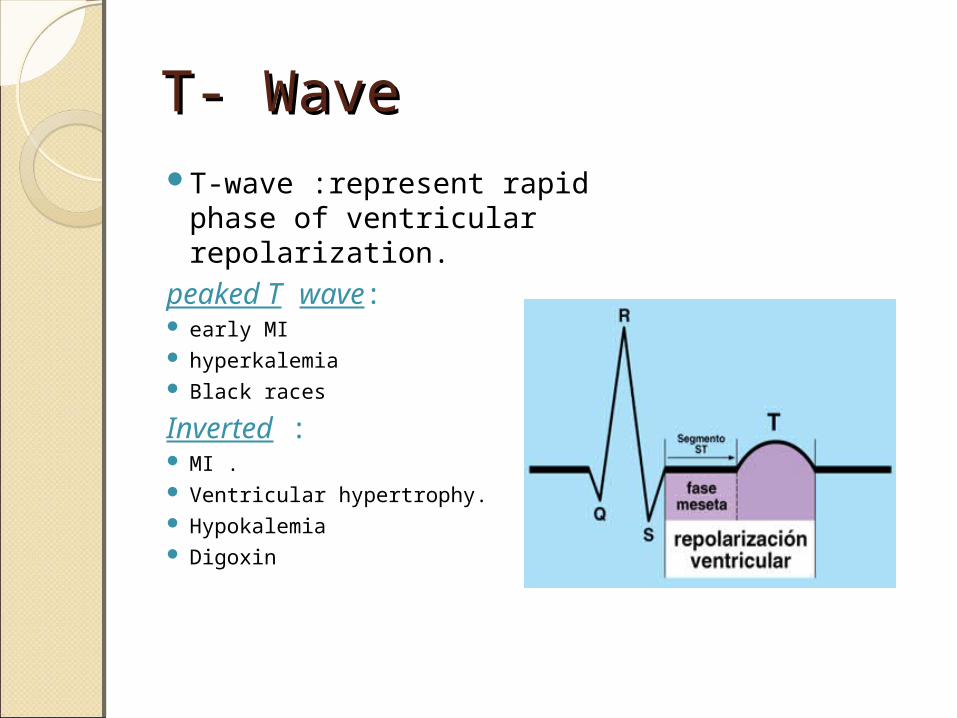
T- WaveT- WaveT-wave :represent rapid
phase of ventricular repolarization.
peaked T wave: early MI hyperkalemia Black races
Inverted : MI . Ventricular hypertrophy. Hypokalemia Digoxin
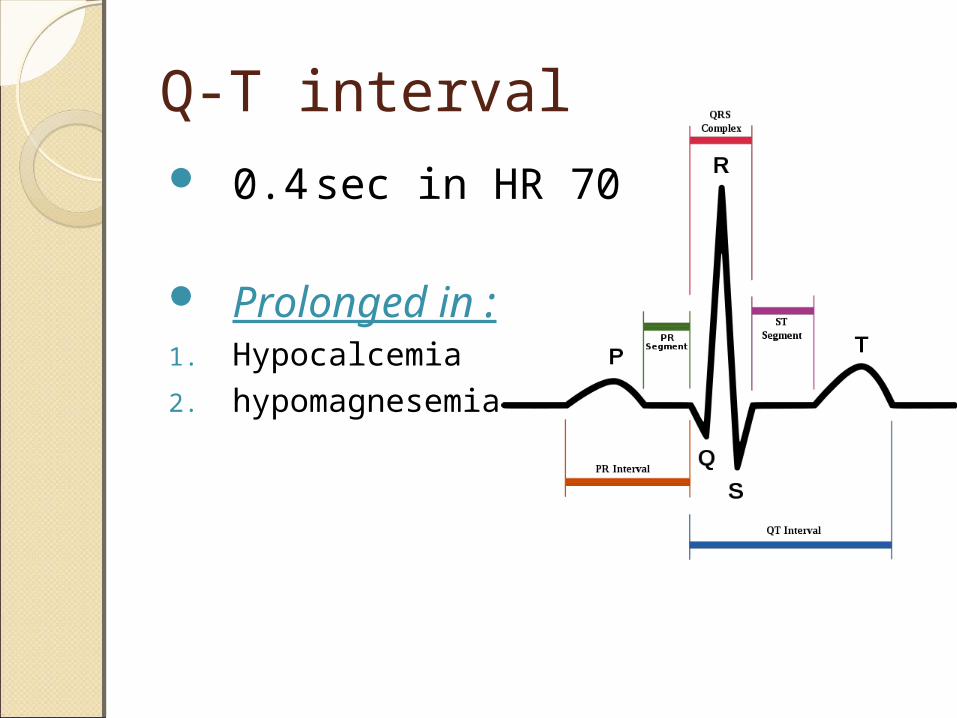
Q-T interval 0.4 sec in HR 70
Prolonged in :1. Hypocalcemia2. hypomagnesemia
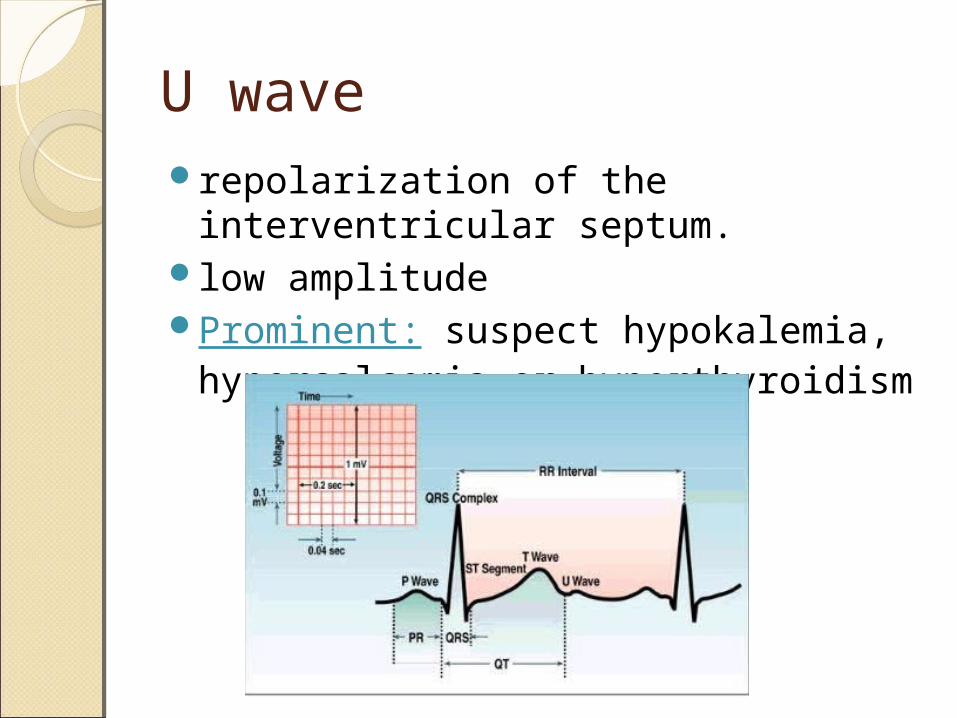
U waverepolarization of the interventricular
septum. low amplitude Prominent: suspect hypokalemia,
hypercalcemia or hyperthyroidism
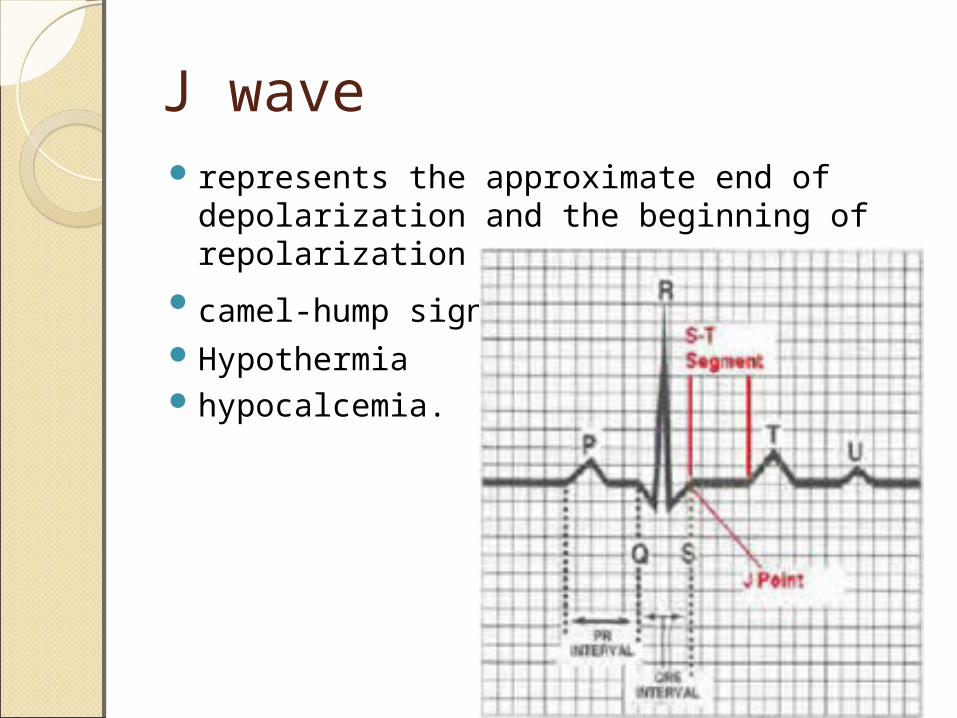
J wave represents the approximate end of
depolarization and the beginning of repolarization
camel-hump sign .Hypothermia hypocalcemia.
Low voltage ECG ObesityEmphysemaCOPDSevere hypothyroidism
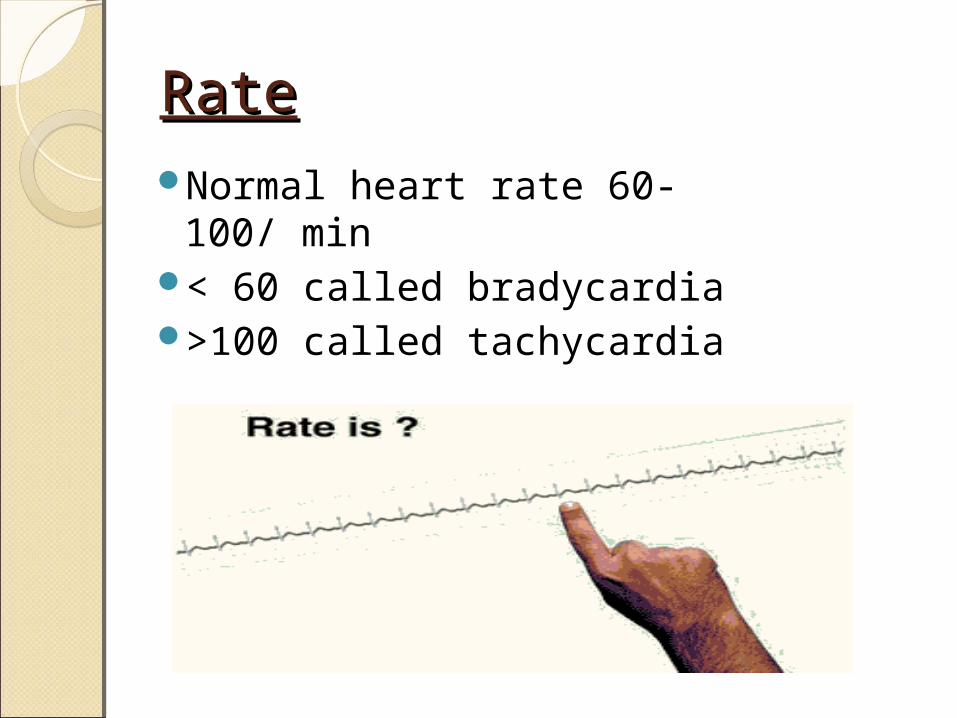
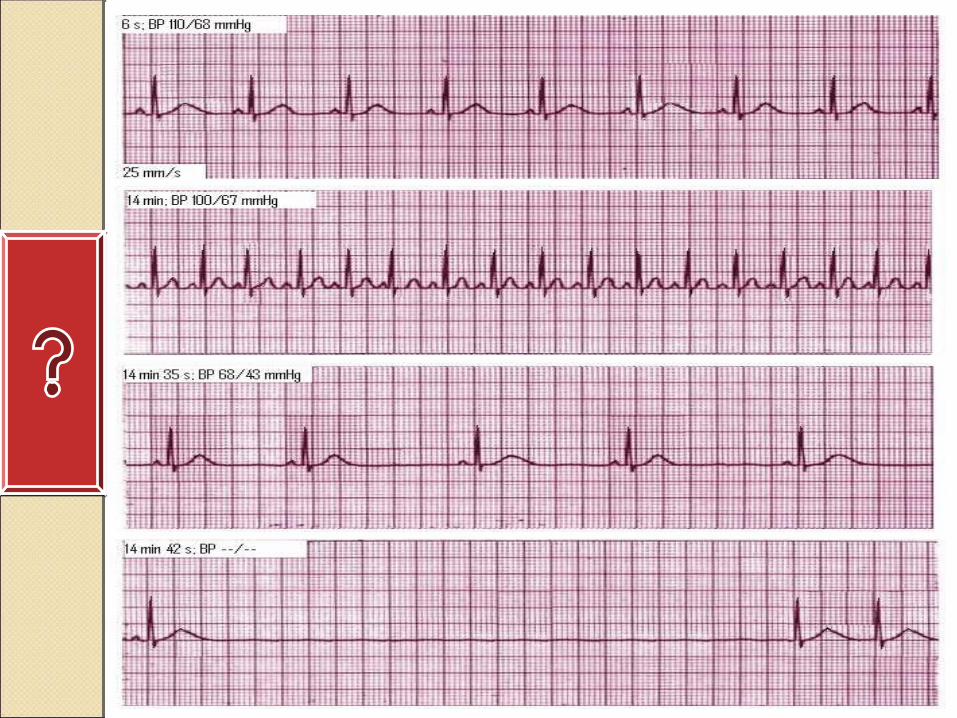
RateRateNormal heart rate 60-
100/ min< 60 called bradycardia>100 called tachycardia
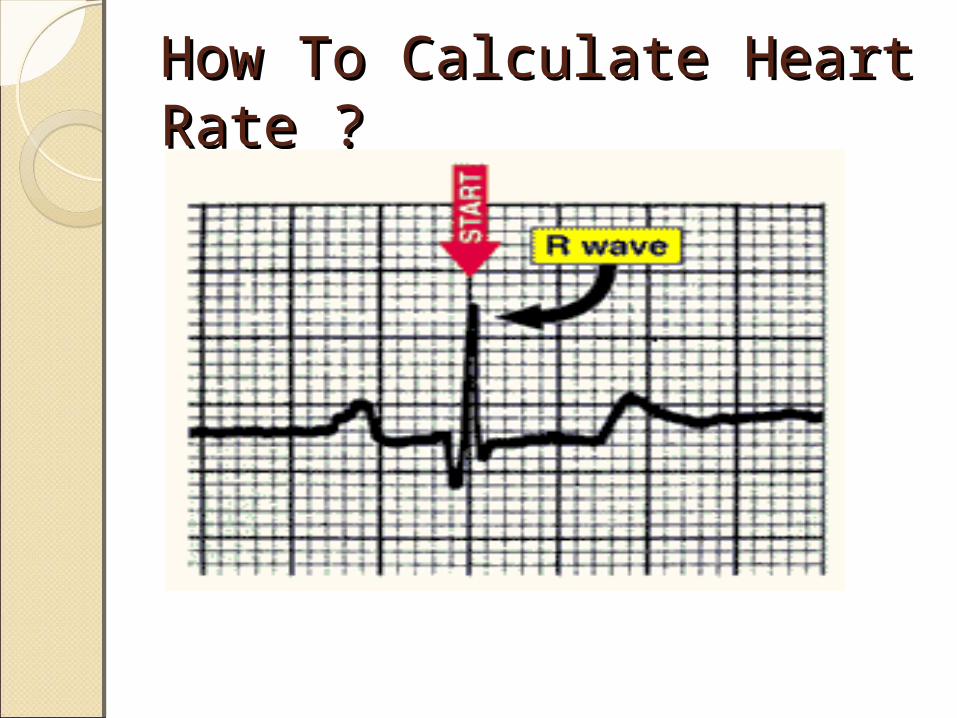
How To Calculate Heart How To Calculate Heart Rate ?Rate ?
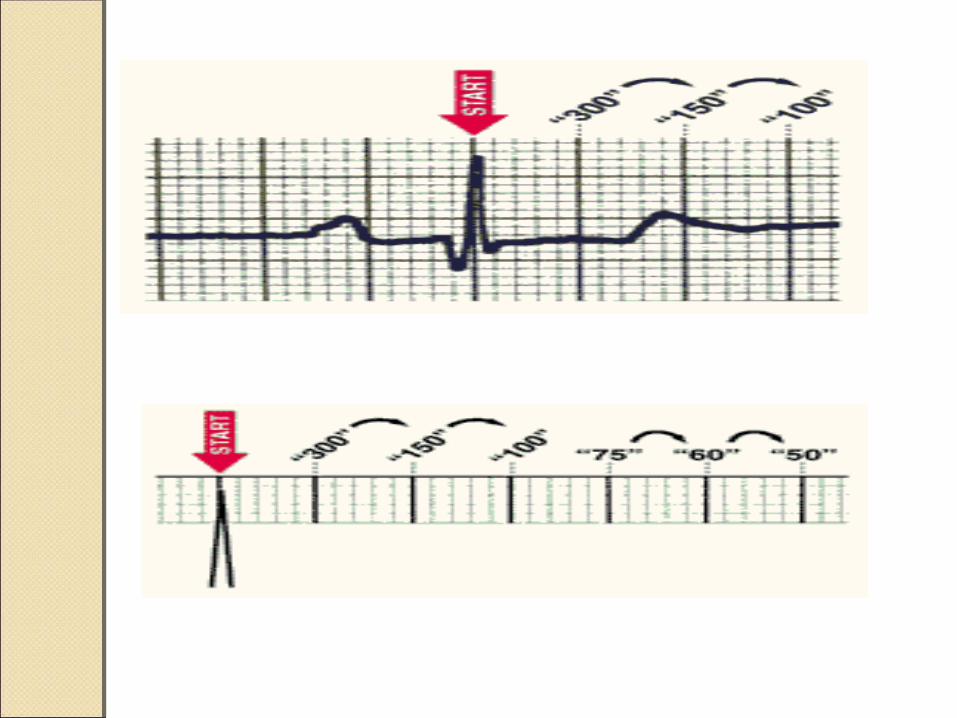
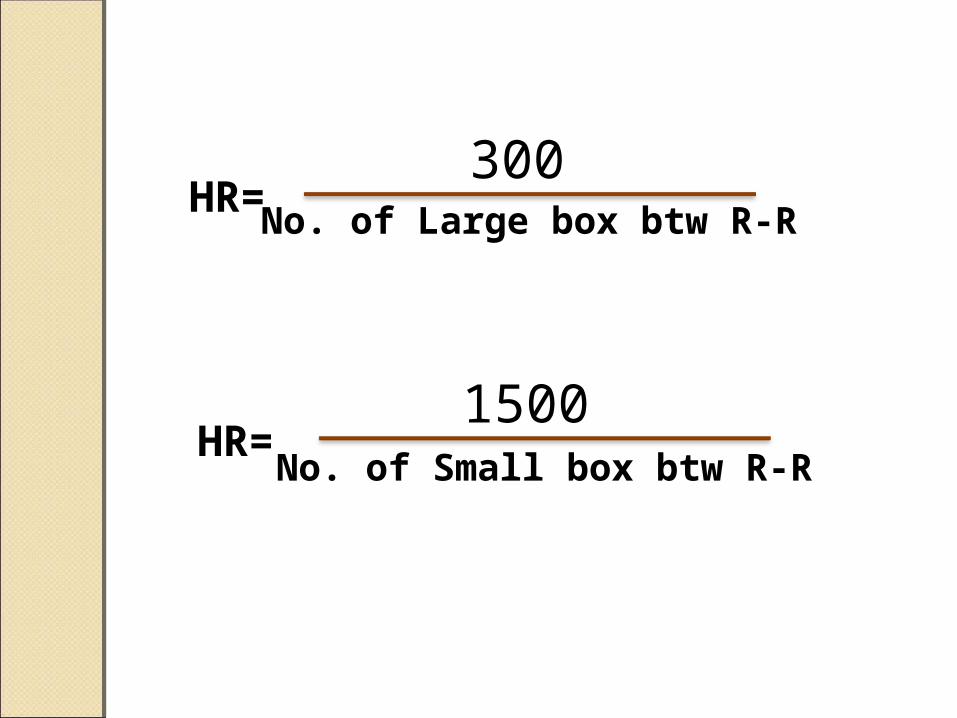
300No. of Large box btw R-R
HR=
1500No. of Small box btw R-R
HR=
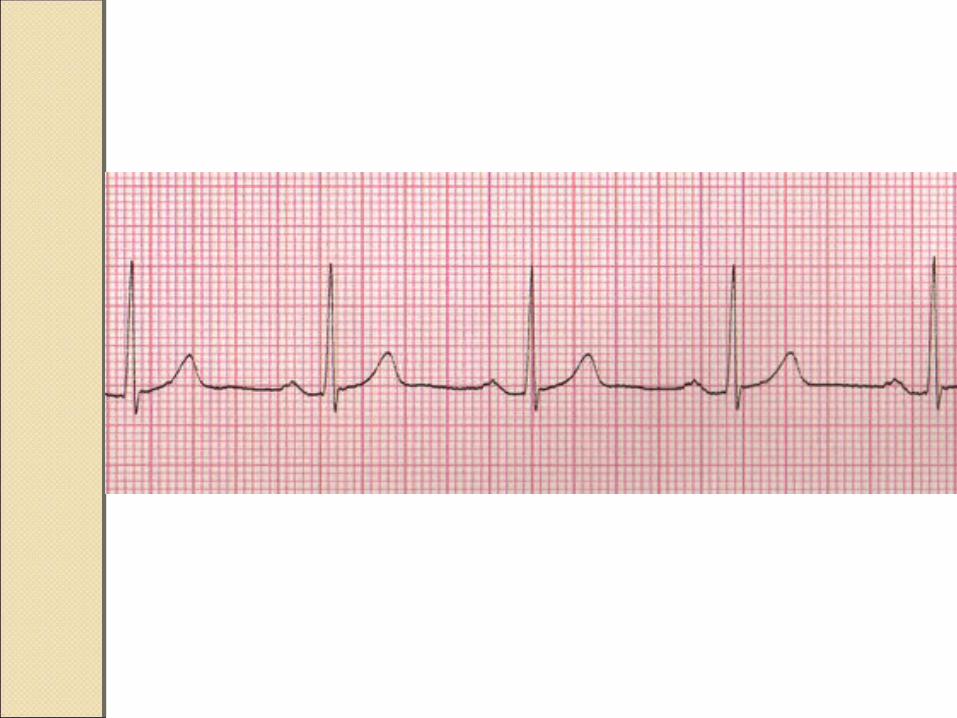

RHYTHMRHYTHM
Look For The Distance between Identical waves.
Most commonly used R-R

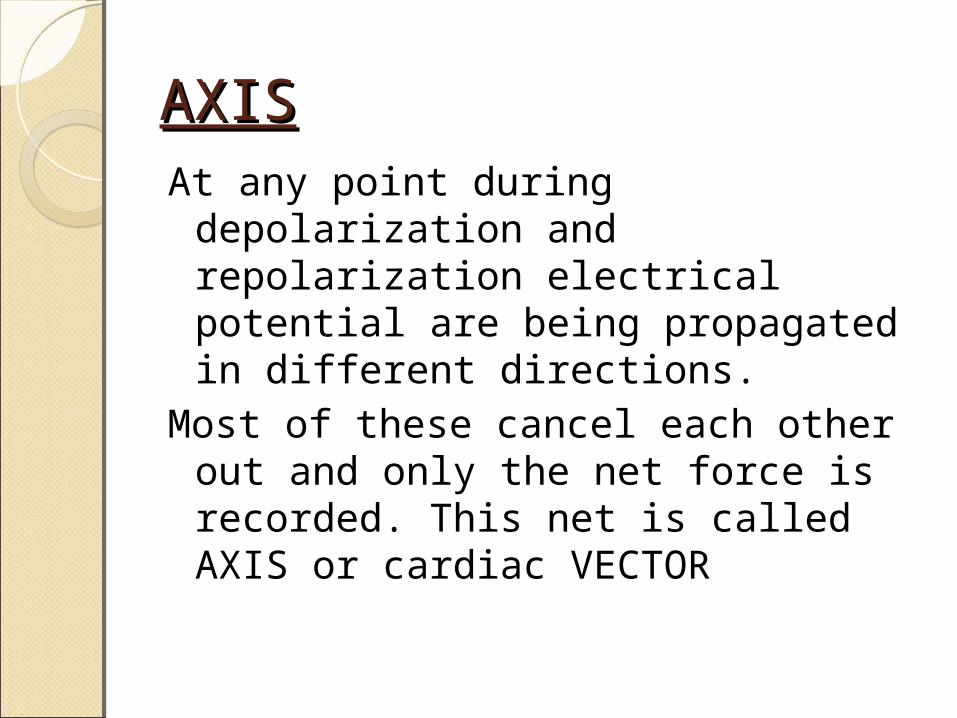
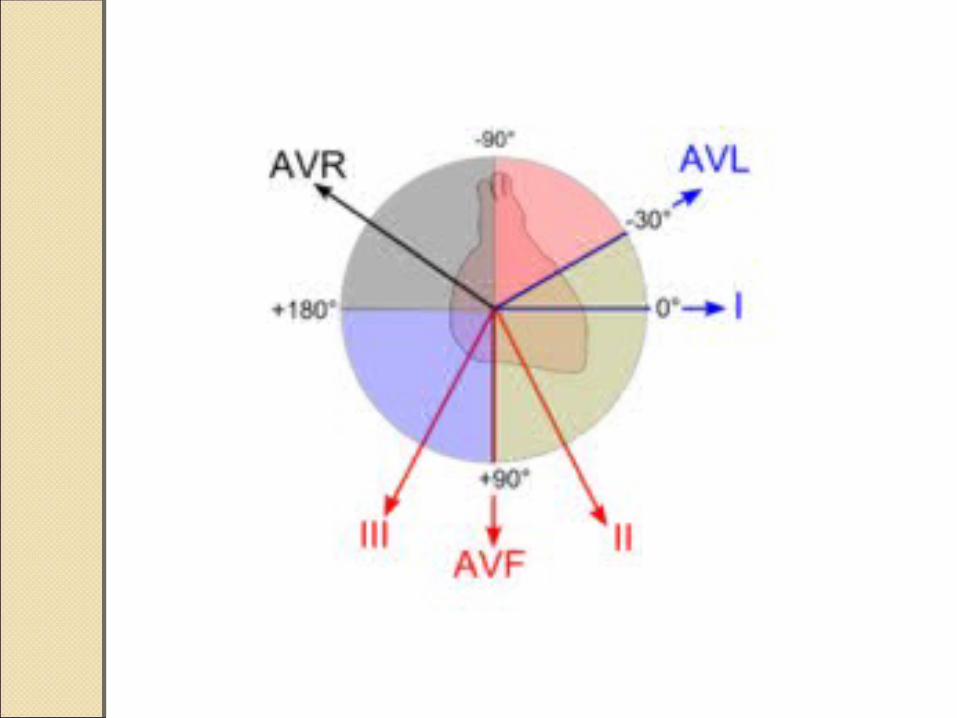
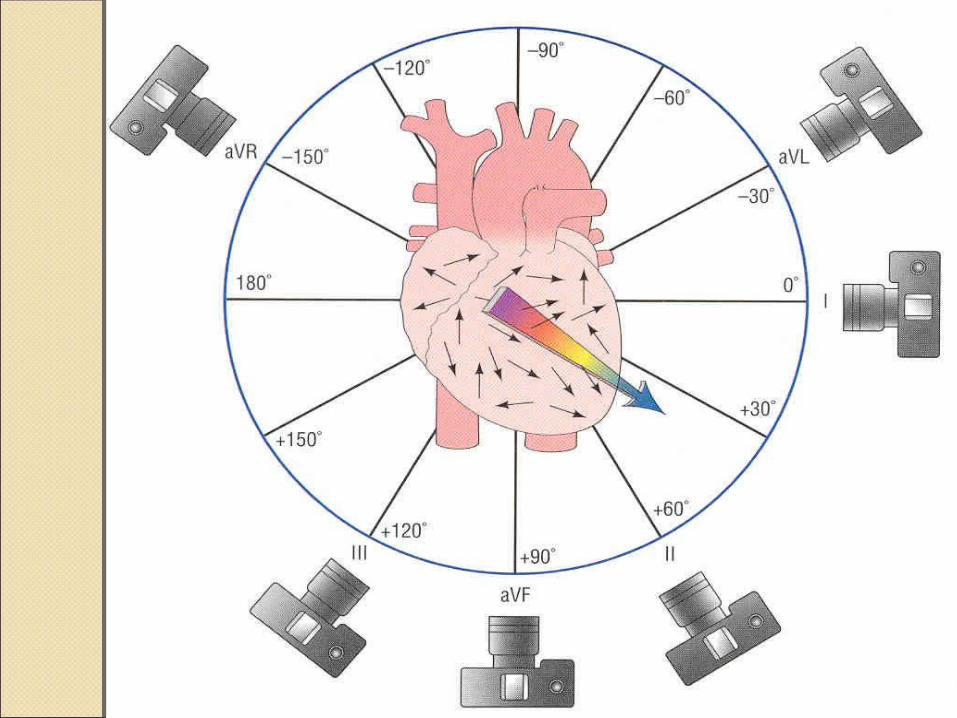
AXISAXISAt any point during depolarization
and repolarization electrical potential are being propagated in different directions.
Most of these cancel each other out and only the net force is recorded. This net is called AXIS or cardiac VECTOR
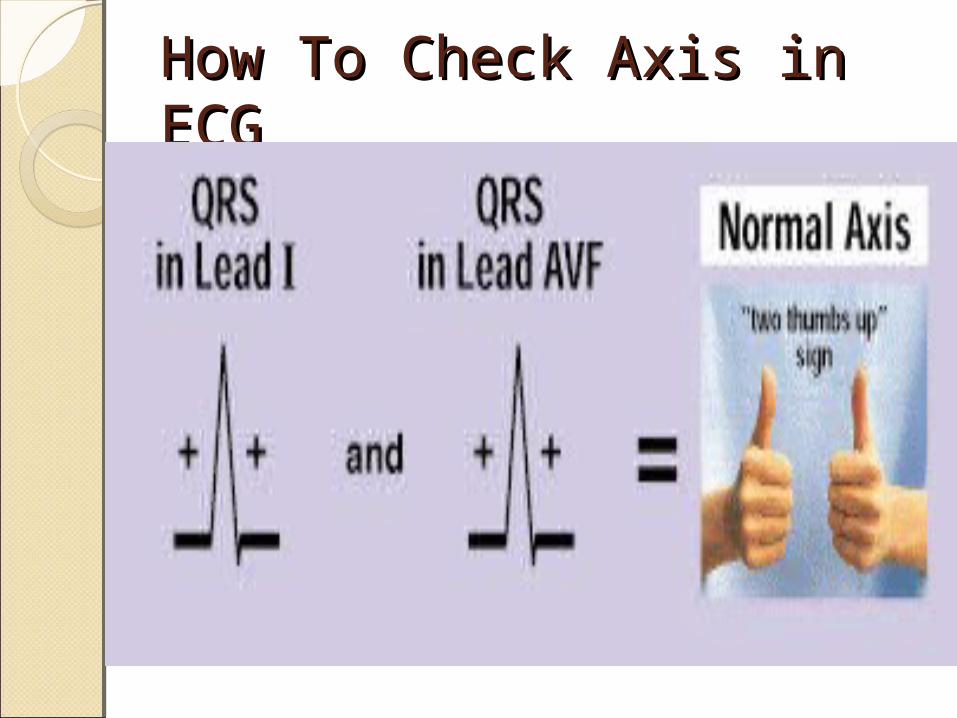
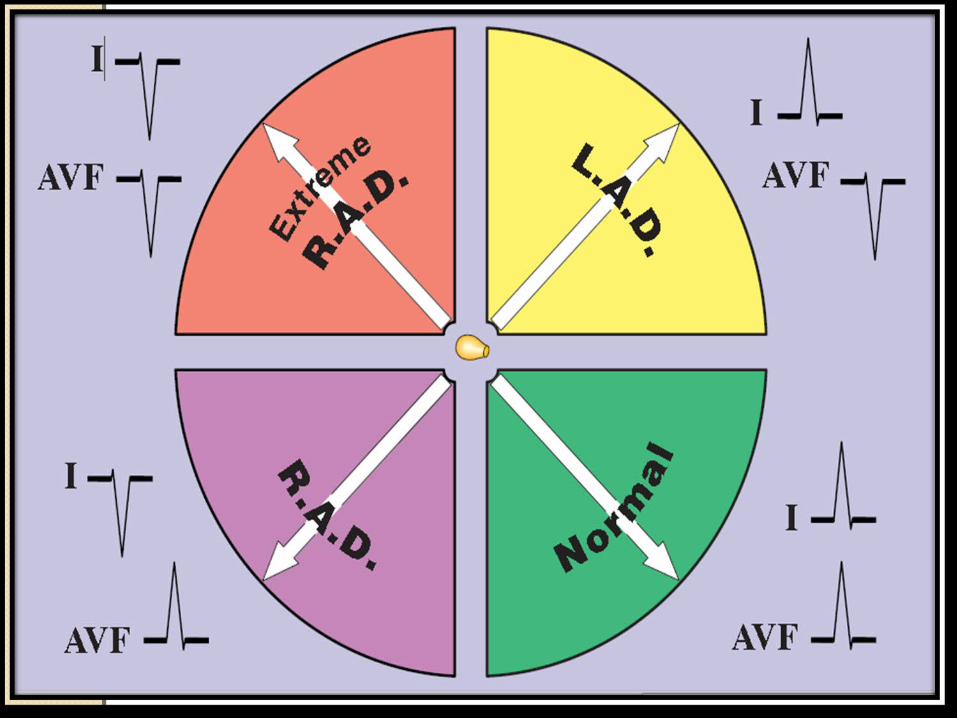
How To Check Axis in ECGHow To Check Axis in ECG
THANKSTHANKS