Embed Size (px)
Citation preview
1
25 February 2013
DOMINO’S PIZZA GROUP plc
PRELIMINARY RESULTS FOR THE 53 WEEKS ENDED 30 DECEMBER 2012
Domino’s Pizza Group plc (“Domino’s”, “DPG”, the “Company” or the “Group”), the leading pizza
delivery company, announces its results for the 53 weeks ended 30 December 2012.
Financial Highlights
System sales1 increased by 12.8% to £598.6m (2011: £530.6m for 52 weeks)
Record profit before tax2, including Germany and Switzerland, of £46.7m, up 10.8% (2011: £42.2m)
Profit before tax2, excluding Germany and Switzerland, increased 14.2% to £49.7m (2011: £43.6m)
Like-for-like sales3 growth of 5.0% in 612 UK mature stores (2011: 3.7% in 557 mature stores)
Earnings per share (pre exceptional items):
o Diluted earnings per share up 14.1% to 21.95p (2011: 19.24p)
o Basic earnings per share up 13.8% to 22.17p (2011: 19.48p)
Statutory basic earnings per share up 14.4% to 19.04p (2011: 16.65p)
Final dividend increased by 16.2% to 7.90p per share (2011: 6.80p)
Record of 69 new stores opened in the period (2011: 62 stores) with two closures (2011: three) resulting in a total of 805 stores in four countries as at 30 December 2012
Online system sales increased by 46.3% to £268.6m (2011: £183.6m) with online sales accounting for 55.7% of UK delivered sales (2011: 44.3%). Of this, 19.7% of online orders were taken through a mobile device (2011: 10.1%)
Adjusted net debt⁴ to EBITDA of 0.5:1 (2011: 0.4:1), highlighting our low financial leverage
2
Commenting on the results Chief Executive Officer, Lance Batchelor, said: “Despite a very challenging economic environment, our people and our franchisees have delivered another impressive set of results. This performance further demonstrates the resilience of the Domino’s Pizza home delivery market. We are making encouraging progress in Germany. This market has good demographics for our business and we are seeing improving trading performances from these stores. I look forward to reporting further progress in due course. We have had a solid start to the first seven weeks of 2013 with like-for-like sales in the UK mature
stores up by 1.6% (2012: 3.8%). Clearly the recent spell of poor weather and widespread snow in
week three and week four has had an adverse impact on trading. During these two weeks, we had a
total of 498 stores closed at some point – almost two-thirds of our UK store network was impacted.
Excluding the days these stores were closed, the underlying like-for-like sales run rate was 2.6%
which is an encouraging early trend.
Stores in the Republic of Ireland were not affected by the snow and are in positive territory with like-
for-like sales in the mature stores up 3.9% over this first seven week reporting period.
I am optimistic about the future and, with the support of our franchisees, we will continue to grow this outstanding business by focusing on opening new stores, testing new store formats and developing new products while always ensuring the customer is at the heart of everything we do”. Corporate Progress
Sold 61 million pizzas during 2012 (2011: 56m)
Platforms now developed for all major mobile operating systems
Created over 1,500 new jobs in stores and expect a similar number in 2013
Acquired the master franchise agreement and 12 stores in Domino’s Pizza Switzerland, Liechtenstein and Luxembourg
Option to acquire the master franchise agreement for Domino’s Pizza in Austria
1 Sales made by all stores in the UK, Republic of Ireland, Germany and Switzerland to the public 2 Pre-exceptional items 3 Like-for-like sales are sales in UK stores that were open before 2011 compared to the
corresponding 53 week period in the prior year 4 Excludes Domino’s Leasing Limited’s non-recourse loans and the non-controlling shareholder
loan in Germany
3
For further information, please contact:
Domino’s Pizza:
Lance Batchelor, Chief Executive Officer 01908 580604
Lee Ginsberg, Chief Financial Officer 01908 580604
Georgina Wald, Head of Corporate Communications 01908 580660
MHP:
Tim McCall, Simon Hockridge, Naomi Lane 020 3128 8100
Numis Securities Limited
David Poutney, James Serjeant 020 7260 1000
A presentation to analysts will be held at 09.30 on 25 February 2013 at Numis Securities Ltd, The
London Stock Exchange Building, 10 Paternoster Square, London, EC4M 7LT.
Notes to Editors:
Domino’s Pizza Group plc is the leading player in the fast-growing pizza delivery market and holds the
exclusive master franchise to own, operate and franchise Domino’s Pizza stores in the UK, Republic of
Ireland, Germany, Switzerland, Liechtenstein and Luxembourg. The first UK store opened in Luton in
1985 and the first Irish store opened in 1991. In April 2011, the Group acquired a majority stake in
the exclusive master franchise to own, operate and franchise Domino’s Pizza stores in Germany. In
September 2012, the Group acquired the master franchise for Switzerland, Luxembourg and
Liechtenstein and an option to acquire the Master Franchise Agreement in Austria prior to the end of
2014.
As at 30 December 2012, there were 805 stores in the UK, Republic of Ireland, Germany and Switzerland. Of these, 621 stores are in England, 51 are in Scotland, 32 are in Wales, 20 are in Northern Ireland, one is on the Isle of Man, two are mobile units, 48 are in the Republic of Ireland, 18 are in Germany and 12 are in Switzerland. Founded in 1960, Domino’s Pizza is one of the world’s leading pizza delivery brands. Through its primarily franchised system, Domino’s Pizza operates a global network of more than 10,000 Domino’s Pizza stores in 75 international markets. Domino’s Pizza has a singular focus – the home delivery of pizza, freshly made to order with high quality ingredients. Customers in the UK can order online at www.dominos.co.uk, in the Republic of Ireland at www.dominos.ie, in Germany at www.dominos.de and in Switzerland www.dominos.ch. In addition, mobile customers can order by downloading Domino’s free iPhone, iPad and Android apps. For photography, please visit the media centre at www.dominos.uk.com, contact the Domino’s Press Office on +44 (0)1908 580732, or call MHP on +44 (0)20 3128 8100.
4
Chairman’s Statement I am very pleased to report another strong set of results. In 2012 Domino’s delivered a record profit before tax and exceptional items of £46.7m, up 10.8%, even after the expected start up losses of £3.0m in our relatively new markets of Germany and Switzerland. This was driven by strong like-for-like sales growth in our core UK market and a record number of new store openings across all our territories. The resilience of the Domino’s Pizza model in these more challenging economic times is a credit to the entrepreneurial spirit of our franchisees who continue to find new ways of retaining the loyalty of and growing our customer base. The strong like-for-like sales growth of 5.0% (2011: 3.7%) in our core UK system sales was driven by a constant focus on the three pillars of Domino’s success: product, service and image. The continued focus on product quality, with a refusal to compromise in the face of ever more rapidly rising commodity prices, is a major reason why customers return. Another is the continuous flow of exciting new products. Service continues to be one of the most important factors as to why customers return to Domino’s for their home delivery pizza and in 2012 we maintained our delivery times and the reliability of our customer service. While focus on product, service and image drive the top line, our operational gearing continues to drive the bottom line still faster. Of particular note is the success of our recent investment in new commissary capacity, which now produces more dough than its predecessor did and still has significant spare capacity to meet increased demand in the future. We are also seeing economies of scale in procurement, marketing, and in our headquarters and distribution functions. The combined effect has driven this critical ratio of system sales to adjusted net profit, in the core UK and Republic of Ireland markets, up by a further 0.2% to 8.4% in 2012. The Group never forgets that the franchisee relationship is at the heart of all we do. I am pleased to see so many of our long standing franchisees thriving and still opening new stores as they reach five, 10 or even 20 years in the Domino’s system. They are sometimes challenging, often thought provoking and always fantastic business partners and I salute them. I am pleased with the progress we are making in Germany. It is still early days of course, but sales growth in the current stores is strong, new stores are opening at encouraging sales levels, franchisees are joining us, and the store opening programme is progressing well. Whilst the cost of putting in place the people and infrastructure needed to develop a new market results in start-up losses, I believe we are on track to achieve profit in Germany by the end of 2015. Switzerland is also a new and exciting market. Prior to our acquisition it had been poorly run for a number of years and this will take time to correct, but it has good potential. We have started the process of refurbishing and relocating the stores to realise that potential and expect to be generating a positive return in 2014. Your company, DPG, is one of the world’s largest Domino’s master franchisees on many measures: store level sales and profit, total system sales and profit, number of employees within the system, quantity of pizzas sold every year and many operational effectiveness measures. Our UK and Irish commissaries continue to rank among the world’s best, scoring the maximum possible five star ratings. By sales, seven of the world’s top ten Domino’s Pizza stores are DPG stores. This is a wonderful foundation to build on. Of course underpinning all DPG’s results are our people. 2012 was Lance’s first full year as our CEO and he has settled in well. His deep understanding and experience of mobile web technologies and international business is exactly what we needed as e-commerce platforms become an even more
5
important route to market and our international reach grows. He is also developing a really strong team around him and in particular I welcome onboard Kory Spiroff as our Managing Director for Germany, Jan Hertzberg as our Marketing Director for Germany, and Brian Trier as our Country Manager for Switzerland. 2012 was a year of real progress and achievement. I know Lance and his team are keen to build on this in 2013 and beyond. I would like to thank them and, of course, our franchisees, for another excellent year and look forward to further progress in 2013.
Stephen Hemsley
Chairman
22 February 2013
6
Chief Executive Officer’s Review INTRODUCTION As I arrive at the end of my first year as your CEO, we have another set of strong results to share. Domino's profit before tax and exceptional items in 2012 reached a new record level of £46.7m (2011: £42.2m). This was an increase of 10.8% (2011: 10.9%), even after accounting for the planned £3.0m of total start up losses in our new German and Swiss businesses. The core UK and Republic of Ireland market saw adjusted diluted EPS rise by a remarkable 17.2% (2011: 18.6%). With a record 69 (2011: 62) new store openings across the group, plus the acquisition of 12 Swiss stores, DPG now operates 805 stores in four countries. That’s a big estate, with the largest sales and profits of any Domino’s master franchise in the world. But I am clear that most of our growth still lies ahead. The UK market still has plenty of scope for store growth, and Germany and Switzerland are virtually virgin territories. DPG is of course evolving over time, as the business grows. We now operate in four international markets, with about 23,000 Domino's people working daily across the HQs, franchisee offices, commissaries, the corporate and franchised stores, and our transport fleet. That's a big business that requires mature processes, disciplines and structures. We also retain an entrepreneurial streak a mile wide, always looking for growth opportunities and new ways to improve the customer experience. One area of personal focus is to ensure we remain hungry for growth, even though we are a market leader. Let’s take a look at each of our key markets: UK The core UK business grew very strongly in 2012 with like-for-like sales up 5.0% year on year (2011: 3.7%) and adjusted PBT (for the UK and Republic of Ireland) up by 14.2% to £49.7m (2011: £43.6m). It is worth noting that if you remove stores that have split their delivery areas and opened a second store in the territory, this like-for-like growth was even higher, at 6.6% (2011:5.1%). I am particularly pleased with the good performance of the core UK business. Despite a challenging retail environment, low consumer confidence and an economy that shrank overall across 2012, we continue to trade well. We sold a remarkable 61 million freshly made pizzas last year in the system. One of my favourite metrics is that around our stores we currently only serve on average 19% of households with delivered Domino’s pizza. That leaves about three quarters of all UK households still to come into the brand, which is a huge growth opportunity. Several of our top franchisees are now serving up to 40% of households. The UK business is now fundamentally a digital (i.e. web and mobile) business, with 55.7% (2011: 44.3%) of delivered sales ordered online. By Q4, this figure had reached 60%, and it shows little sign of slowing down. In one recent week we had a dozen stores receiving over 80% of their delivered sales online – this seems quite extraordinary, but is becoming a regular feature. Going digital is a real advantage for Domino’s. Customers who order online have a higher net promoter score, i.e. they recommend us more often. They themselves order more often, and spend more. Importantly a web transaction generates higher margins for our franchisees, because they do not need to incur labour costs to answer the phones. This has saved franchisees many millions of pounds which can be invested into new store openings, for example. Finally a digital customer is a
7
customer with whom we have a one-to-one relationship. This often allows us to market directly to them, and indeed by year end we had over three million customers who had agreed to allow us to communicate with them via email etc. We believe Domino's is far ahead of any of our UK competitors in this field; and we intend to continue exploiting this strategic advantage. How far can it go? About three quarters of our sales are delivery, and in theory all of these could eventually migrate. Currently many customers still use the phone to order, but the world is changing: some of our franchisees are now actually reducing the number of phone lines into their stores, as they see ever more web orders. One store has even removed the phone number from its menus and seen no decline in sales. An important and dynamic subset of our digital channel is mobile, which grew in 2012 by an extraordinary 195% to reach 19.7% (2011: 10.1%) of all digital sales. Coming from a mobile industry background myself, I can say that this is no accident, but a direct result of our time and energy in this area. We now have sales channels for all the major mobile operating systems (iPhone, iPad, Android and Windows 7) as well as recently refreshed apps which have scored significantly higher on customer ratings than our competitors. Our iPhone, Android and iPad mobile ordering apps won the Best Food & Cooking award in the Carphone Warehouse Appys 2012, which celebrate development and innovation in app technology. Mobile is set to grow rapidly as a proportion of sales; and we will stay ahead of the curve. It is a real competitive advantage for Domino’s that we are fully accessible wherever and whenever our customers want to order a pizza. I am a passionate believer in new product development. This has formed an important part of our 2012 story in the UK, with 14.0% (2011: 11.4%) of all sales coming from items we had not sold a year earlier. We innovated heavily on our Domino’s Stuffed Crust base, launching BBQ, Mexican and other variants through the year. We also launched several new cookie variants, such as triple choc and toffee apple, a pork bites side dish, as well as twisted dough balls – using our own dough as the main ingredient – and new chicken wings in conjunction with Franks’ Hot Sauce. We also saw the return of garlic mozzarella sticks in response to demand from our customers through social media. Excellent new products such as these create news and interest among the current Domino’s customer base. They give customers a reason to visit us more often and allow new users to try us. They also give lapsed users a reason to come back and they keep our competitors guessing. Smart price promotions are also an important part of what we do. While protecting our position as the quality leader in the category, we also look for ways to tempt new consumers to try us, and give our current customers an additional purchase opportunity. During 2012 we continued our Two for Tuesday offer and ran a number of short term, online only deals, helping us to further increase our online sales. More and more of our promotions are targeted to individual customers or small segments via email and web, which makes them more efficient and measurable. Our “Meal Deal Wizard” was launched in 2012 allowing customers using the online channels to ensure they get the very best deal possible. One thing I have really understood since joining the Domino’s board in 2010 is that our obsession with customer service is at the heart of what we do. In 2012 we kick started what we call the “service revolution”. We know that fast delivery of great tasting pizza is the key to happy customers who order more often, so we will never give up challenging ourselves on reducing the delivery time across the system from the very impressive 23.8 minutes on average that we achieved during 2012. But it is not just about speed: it is also about how we talk to our customers; at the doorstep, in our stores or over the phone. Our training teams conducted 20 in store workshops lasting a week each, showing our franchisees what true best practice service looks like.
8
In 2012 we continued evolving our marketing to reflect the ever changing world, and the move of our customers towards digital ordering. Our scale allows us to continue with a full suite of traditional marketing tools, including TV, sponsorships, outdoor and leafleting, while simultaneously adding to our investment in newer tools like email, associate sites, search engine optimisation, digital display and many others. By year end we had reached 747,000 (2011: 330,000) Facebook Fans in the UK and 68,000 followers on Twitter (2011: 18,000). In the UK, we opened 57 (2011: 58) new stores in 2012, ending the year with 727. We remain confident that 1,200 stores is viable, and the property and franchise development teams are working hard at identifying optimal sites with our franchisees, finding stores and gaining planning permission (which can be a slow and cumbersome process). Our franchisees demonstrate a real appetite for more stores and we intend to carry on opening at a similar rate. Our UK commissaries produce our fresh dough and distribute the food materials needed to our franchisees. As the volume builds, we need only minimal extra headcount in a world class efficient commissary such as Milton Keynes. In addition our procurement team can use our scale to buy better, and to protect against commodity price risks. Our 124 UK franchisees are at the very heart of this business. We work with them every day, hand in hand. They now have an average of about 6.3 (2011: 5.7) stores each. Stores are showing improving sales, operating efficiencies and in turn improving profitability faster than the rate of sales growth. Having such strong franchisees gives DPG and the Domino's brand real financial stability, financial strength to grow even in a recession and, of course, passionate and committed focus. It is a huge privilege and pleasure to work with them. Of special note is UK Franchisee Pali Grewal, who in 2012 repeated his 2010 feat of being crowned “World’s Fastest Pizza maker” at the global franchisee event held in Las Vegas. REPUBLIC OF IRELAND Despite the tough economic environment, like-for-like sales, in Euros, stabilised at -0.2%. This improved result was on the back of very hard work by our Irish franchisees, backed by DPG. Irish sales are 31% down from the peak in 2007 but despite this, only one of our 49 Irish Domino’s stores has ever closed. Our ecommerce business continues to grow at a strong rate and is now at 30.4% of all delivered sales, up 20.2% year on year. Mobile incidence is particularly strong at 19.6% of all ecommerce sales. Brand tracking continues to demonstrate that the Domino’s brand is clearly held in high regard in the market. It continues to out-perform the competition on all key attributes of product, service and value. This is testament to the continued commitment to advertising, a continuous pipeline of product innovation, communication of popular bundle meals like The Mega deal and The Double deal and never cutting corners in terms of product quality and our franchisees’ relentless drive to service their customers quickly and reliably. We have been particularly encouraged by the growth seen from extended trading hours, with sales post midnight up 60.4%, in part benefitting from the communication of Late Night opening on TV. Ireland however continues to be a very tough trading environment. We have worked closely with our Irish franchisees during the last year and I have been really impressed with their tenacity. After
9
almost four years of an Irish downturn, only one of the 49 Irish Domino's stores has closed. Our competitors have suffered much more. No one can confidently predict the turn of the economic tide in Ireland, but when it comes, Domino's Pizza will be ready and waiting. In the meantime the stores there continue to generate some of the best operational metrics anywhere in the world, and to delight our customers with great pizza. GERMANY Having inherited just two stores back in April 2011 and reaching six a year ago, we now have 18 open. There is a full pipeline of planned openings in 2013. This is a rapid pace of growth which has been challenging but hugely exciting. In the past year we have seen our first franchisee run stores and we have several more coming aboard in the next few months. Our confidence in and enthusiasm for the German opportunity has grown steadily with more on the ground experience. Our earliest Berlin stores saw their like-for-likes grow by 19.3% and 24.1% respectively in 2012 as we learned ever more about menu and marketing preferences in Germany. Other key indicators look good too – our first three franchise stores in the West have achieved average weekly unit sales (AWUS) of over €12.2k in Q4 with one store now regularly achieving an AWUS of €18k and our new flagship corporate store in Dusseldorf opened in November and achieved sales of over €18k in its first week. It is still early days, we still have much to learn, but we are seeing some really encouraging numbers. We expect to add 18 more stores in 2013, doubling the German footprint to 36 stores. This is an acceleration in the store opening programme compared to the 14 stores in the master franchise agreement. In parallel we will continue to drive weekly sales upwards in our current stores. We are investing for growth, building the required commissary and staffing capacity for the future business. As a result of the accelerated store opening programme and further investment in the central resources to support this growth we are expecting marginally higher losses in 2013 and 2014. We are still on track to reach profitability by the end of 2015. Our Berlin commissary was relocated and substantially upgraded in 2012 and now has capacity to supply at least 50 stores. We will be building a commissary in the west of the country in the coming year, which will add capacity for 100 more stores. All this reflects the momentum and our confidence in the German opportunity. SWITZERLAND In the second half of 2012 we acquired the master franchise agreement for Domino's Switzerland, and took over operation of the 12 stores there. This business has suffered from systemic under-investment and lack of scale. We strongly believe Switzerland can eventually host at least 50 stores and make solid profits. We expect it to be operating profitably by the end of 2014 and we have already begun the process of updating the stores, systems and menus, with an immediate rise in sales. OTHER INTERNATIONAL OPPORTUNITIES With the Swiss deal we also obtained the rights to operate and franchise Domino’s Pizza stores in Luxembourg and Lichtenstein. We also hold an option to acquire the master franchise agreement for
10
Austria before the end of 2014. We will keep all those opportunities under review. Along with the four markets we already operate in, this represents even more international opportunity ahead. CURRENT TRADING We have had a solid start to the first seven weeks of 2013 with like-for-like sales in the UK mature
stores up by 1.6% (2012: 3.8%). Clearly the recent spell of poor weather and widespread snow in
week three and week four has had an adverse impact on trading. During these two weeks, we had a
total of 498 stores closed at some point – almost two-thirds of our UK store network was impacted.
Excluding the days these stores were closed, the underlying like-for-like sales run rate was 2.6%
which is an encouraging early trend.
Stores in the Republic of Ireland were not affected by the snow and are in positive territory with like-
for-like sales in the mature stores up 3.9% over this first seven week reporting period.
GOING FORWARD Despite a very challenging economic environment, our people and our franchisees have delivered another impressive set of results. This performance further demonstrates the resilience of the Domino’s Pizza home delivery market. We are making encouraging progress in Germany. This market has good demographics for our business and we are seeing improving trading performances from these stores. I look forward to reporting further progress in due course. I am optimistic about the future and, with the support of our franchisees, we will continue to grow this outstanding business by focusing on opening new stores, testing new store formats and developing new products while always ensuring the customer is at the heart of everything we do. Lance Batchelor
Chief Executive Officer
22 February 2013
11
Chief Financial Officer’s review The Group’s financial statements for the 53 weeks ended 30 December 2012 (‘the period’) have
been prepared in accordance with International Financial Reporting Standards (‘IFRS’), as adopted by
the EU, as were the results for the comparative period last year.
Financial highlights
2012 was another year of good progress for the Group, delivering a strong financial performance
against a challenging macro-economic background and an increasingly constrained environment for
consumer-facing businesses. With many households experiencing more pressure on available
discretionary spend, harder choices between competing consumption options are having to be
made. A change to save (or pay down debt) during these more uncertain economic times, has forced
consumer-facing businesses to work harder in order to achieve consistent growth. Although trading
conditions were difficult and highly variable over the year, the Group has been able to further
increase sales and profits. Our continued focus on product innovation, exceptional service and the
best quality products has enabled the Group to continue its profitable progress.
In addition to having to manage the business against a backdrop of pressure on household incomes
the Group was also faced with some fairly sizeable commodity price increases during the period. The
Group managed to minimise these input cost pressures by taking out fixed price supply contracts
where possible and being proactive with our suppliers. It is these long term relationships forged with
our suppliers which has proven to be beneficial in these uncertain economic times, with both us and
the suppliers working together to ensure that cost pressures have not had a disproportionate impact
on either the Group’s or our franchisees’ margins and profits nor to the detriment of our suppliers.
In addition we have increasingly harnessed digital media as an ever increasing number of our
customers are ordering their favourite products through our e-commerce platforms and this has
enabled the franchisees to keep part of their store based labour costs down due to the efficiency of
these ordering platforms. These online and mobile orders do not require any further in-store labour
intervention in capturing the order thereby keeping labour costs down in the franchisees’ stores. The
added benefit of these online and mobile orders is that the customers’ orders are always correct!
Our business in Germany has made excellent progress over the year with 12 new store openings in
2012 and we now have 18 stores in that territory. We are encouraged by the sales performance in
our Berlin stores with like-for-likes in the two mature stores increasing by 19.3% and 24.1%. Sales
from our newly opened stores in the west of the country have been strong particularly those stores
operated by our UK franchisees.
During 2012 the Group took advantage of further opportunities to expand into new international
markets by acquiring the assets of 12 stores in Domino's Pizza Switzerland AG (Domino's
Switzerland), including the master franchise agreement (the MFA), which provides the Group with
the exclusive right to operate and franchise Domino's stores in Switzerland, Liechtenstein and
Luxembourg. We also hold an option to acquire the MFA for Austria. The Group believes that the
Swiss market represents an exciting opportunity for the expansion of the Group's business in central
Europe.
12
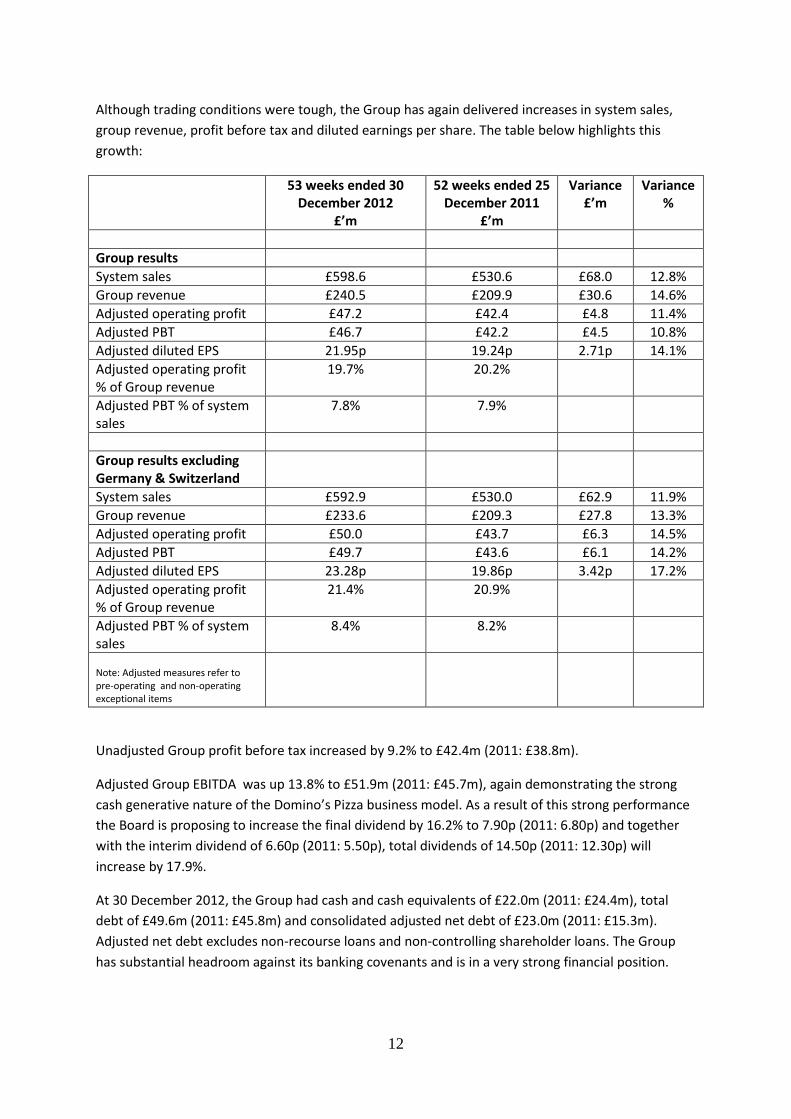
Although trading conditions were tough, the Group has again delivered increases in system sales,
group revenue, profit before tax and diluted earnings per share. The table below highlights this
growth:
53 weeks ended 30 December 2012
£’m
52 weeks ended 25 December 2011
£’m
Variance £’m
Variance %
Group results
System sales £598.6 £530.6 £68.0 12.8%
Group revenue £240.5 £209.9 £30.6 14.6%
Adjusted operating profit £47.2 £42.4 £4.8 11.4%
Adjusted PBT £46.7 £42.2 £4.5 10.8%
Adjusted diluted EPS 21.95p 19.24p 2.71p 14.1%
Adjusted operating profit % of Group revenue
19.7% 20.2%
Adjusted PBT % of system sales
7.8% 7.9%
Group results excluding Germany & Switzerland
System sales £592.9 £530.0 £62.9 11.9%
Group revenue £233.6 £209.3 £27.8 13.3%
Adjusted operating profit £50.0 £43.7 £6.3 14.5%
Adjusted PBT £49.7 £43.6 £6.1 14.2%
Adjusted diluted EPS 23.28p 19.86p 3.42p 17.2%
Adjusted operating profit % of Group revenue
21.4% 20.9%
Adjusted PBT % of system sales
8.4% 8.2%
Note: Adjusted measures refer to pre-operating and non-operating exceptional items
Unadjusted Group profit before tax increased by 9.2% to £42.4m (2011: £38.8m).
Adjusted Group EBITDA was up 13.8% to £51.9m (2011: £45.7m), again demonstrating the strong
cash generative nature of the Domino’s Pizza business model. As a result of this strong performance
the Board is proposing to increase the final dividend by 16.2% to 7.90p (2011: 6.80p) and together
with the interim dividend of 6.60p (2011: 5.50p), total dividends of 14.50p (2011: 12.30p) will
increase by 17.9%.
At 30 December 2012, the Group had cash and cash equivalents of £22.0m (2011: £24.4m), total
debt of £49.6m (2011: £45.8m) and consolidated adjusted net debt of £23.0m (2011: £15.3m).
Adjusted net debt excludes non-recourse loans and non-controlling shareholder loans. The Group
has substantial headroom against its banking covenants and is in a very strong financial position.
13
The ratio of adjusted profit before tax as a percentage of system sales (excluding the losses of the
Germany and Switzerland operations) a key ratio which highlights the strength of the underlying
operational gearing of the business, grew to 8.4% in 2012 (2011: 8.2%). This has been achieved
through higher volumes flowing through our system, continuing focus on and tight control of the
cost base, close management of procurement costs and operational efficiencies across the business.
Group system sales
Group system sales increased by 12.8% to £598.6m (2011: £530.6m for 52 weeks). The main drivers
of this growth were:
Like-for-like sales growth of 5.0% in 612 UK mature stores (2011: 3.7% in 557 mature stores).
Buoyant e-commerce sales, growing by 46.7% to £268.6m (2011: £183.1m for 52 weeks),
supported by the improvement of our android and iPad apps and greater investment in
online marketing and the social media arena.
A record 69 (2011: 62) new store openings, including 12 store openings in Germany (2011:
four). During the year two stores closed (2011: three) both of which were in the UK and
were trial concepts that didn’t meet our return criteria. They have however given us
invaluable insights for new store concept ideas.
Ongoing new product innovation, including an extended range of “Domino’s Stuffed Crust”
pizzas.
Commodity prices
2012 saw continued pressure on certain commodity prices (in particular wheat and milk prices).
Wheat prices rose by over 40% due to the droughts in America and Australia and the flooding in the
UK and Northern Europe. This had a further knock on effect on the price of feed which adversely
impacted the price of chicken, pork and beef. Milk prices were impacted by the aforementioned as
well as the lobbying for increases in the base milk prices paid to farmers. The Group was further
impacted by the removal of the quota subsidies in force in Portugal relating to our tomato growers,
which substantially increased raw material prices for our pizza sauce.
The Group’s continued focus on its strong long term relationships with our key suppliers and taking
advantage of its buying power, enabled us to mitigate the resultant impact of these commodity price
increases by securing longer term fixed price contracts and forward buying in advance of the price
increases taking effect. An example of the benefits of our long term partnerships with our suppliers
was their ability to project the potential increases in the wheat markets and for the Group to take
advantage of weaknesses in the markets to buy forward its flour supply. This proactive policy
enabled the Group to mitigate the increased pricing to franchisees significantly over the year,
protecting not only their margins and ours but also the suppliers. Overall in 2012 the entire food
basket only saw an aggregate increase of 2% over 2011 which was a satisfactory outcome given the
upward pressure on commodities.
14
Net interest charge
The net interest charge for the year, including the non-cash impact of £0.3m (2011: £0.4m) arising
on the unwinding of the discount on the deferred consideration from the acquisition of Domino’s
Leasing Limited was £0.8m, an increase of 39.9% on the prior year (2011: £0.6m).
International
The Group trades in the following four territories, the results of which are disclosed in the segmental
reporting note in the Group Report and Accounts (note 4):
United Kingdom
Republic of Ireland
Germany
Switzerland
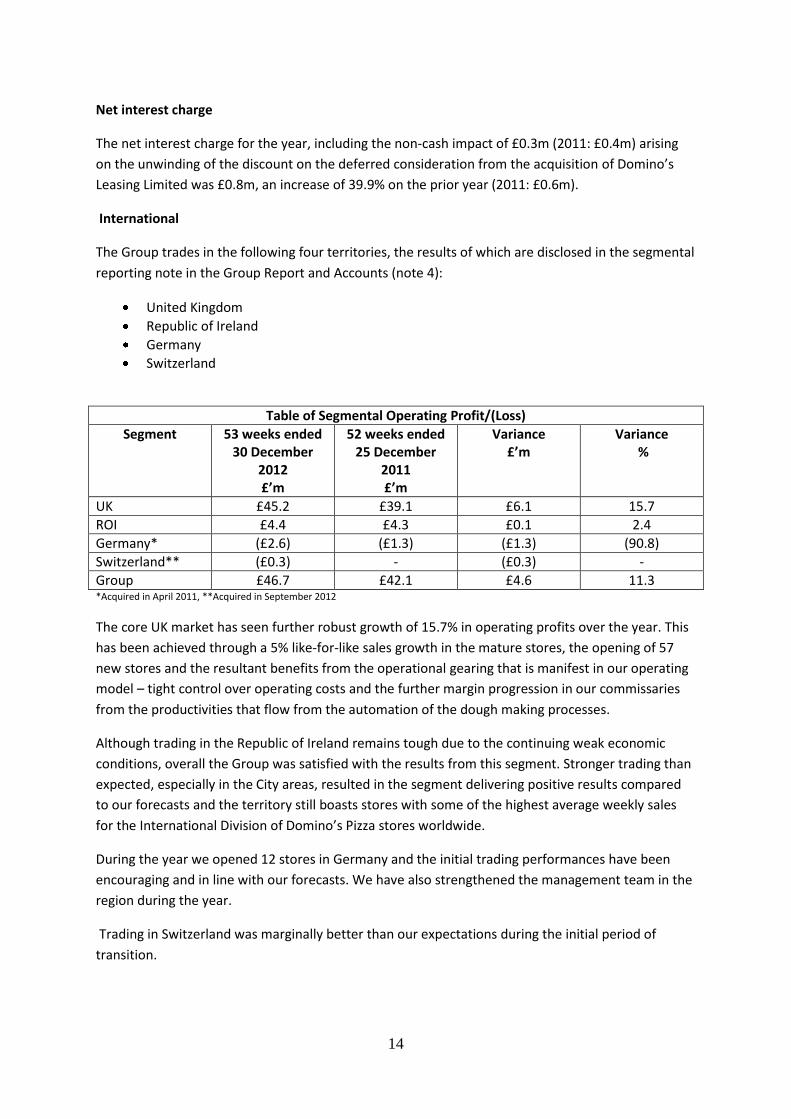
Table of Segmental Operating Profit/(Loss)
Segment 53 weeks ended 30 December
2012 £’m
52 weeks ended 25 December
2011 £’m
Variance £’m
Variance %
UK £45.2 £39.1 £6.1 15.7
ROI £4.4 £4.3 £0.1 2.4
Germany* (£2.6) (£1.3) (£1.3) (90.8)
Switzerland** (£0.3) - (£0.3) -
Group £46.7 £42.1 £4.6 11.3 *Acquired in April 2011, **Acquired in September 2012
The core UK market has seen further robust growth of 15.7% in operating profits over the year. This
has been achieved through a 5% like-for-like sales growth in the mature stores, the opening of 57
new stores and the resultant benefits from the operational gearing that is manifest in our operating
model – tight control over operating costs and the further margin progression in our commissaries
from the productivities that flow from the automation of the dough making processes.
Although trading in the Republic of Ireland remains tough due to the continuing weak economic
conditions, overall the Group was satisfied with the results from this segment. Stronger trading than
expected, especially in the City areas, resulted in the segment delivering positive results compared
to our forecasts and the territory still boasts stores with some of the highest average weekly sales
for the International Division of Domino’s Pizza stores worldwide.
During the year we opened 12 stores in Germany and the initial trading performances have been
encouraging and in line with our forecasts. We have also strengthened the management team in the
region during the year.
Trading in Switzerland was marginally better than our expectations during the initial period of
transition.
15
Exceptional items
Results for the year include total net exceptional costs of £5.1m (2011: £4.5m). The total amount has
been excluded from the adjusted profits and earnings to show the underlying performance of the
business. The exceptional costs in 2012 comprise the following:
Operating exceptional items
o Acquisition and restructuring costs of £2.4m relating to the acquisition of Domino’s
Pizza Switzerland during the year.
o Acquisition and one off costs of £0.6m relating to new UK joint ventures established
during the year.
o An onerous lease charge of £0.5m (2011: £0.9m) relating to three Irish sub-leases
offset by release of prior year provisions where the Group has been able to mitigate
the liability.
o During the year the Group undertook a review of all of its head office central
overhead departments in order to create efficiencies and streamline processes. This
resulted in restructuring and reorganisation costs of £0.8m.
o As a result of the Group reviewing the carrying value compared to the recoverable
amount of assets held, the Group has incurred an impairment charge of £0.2m
(2011: £0.8m) for the year. This was due to the closure of a trial store concept
during the year.
Non-operating exceptional items
o During the year, the Group sold its subsidiary, DP Milton Keynes Limited and
recognised a profit of £0.5m on the sale.
o Included within finance costs is a charge of £0.3m (2011: £0.4m) relating to the
unwinding of the discount on the deferred consideration in relation to the
acquisition of Domino’s Leasing Limited.
Taxation
Excluding the taxation effect of the exceptional items, the effective tax rate is 24.2% (2011: 26.4%).
This is lower than the statutory tax rate in 2011 due to the reduction in the corporation tax rates in
the year and marginally lower than the underlying corporation tax rate of 24.5%. The marginally
lower effective tax rate compared to the underlying corporation rate is due to the level of expenses
not deductible for tax purposes, offset by the impact of the German segment losses, adjustments
relating to prior years and the impact of the lower tax rate applicable in the Group’s Republic of
Ireland subsidiary.
16
Including the effect of exceptional items, the effective tax rate in 2012 was 28.5% (2011: 31.8%). The
effective tax rate includes the following exceptional items:
o Effective 1 April 2012, the corporation tax rate reduced from 26% to 24%, and will further reduce to 23% on 1 April 2013. The impact of this change is to reduce the deferred tax asset by £1.1m (2011: £1.3m). This charge has been recorded in the taxation exceptional items in the Group income statement.
o The taxation impact of the operating and non-operating exceptional items is a reduction of £0.3m (2011: £0.1m) in the overall corporation tax for the year (see note 12 earnings per share).
Group earnings per Share
Adjusted basic earnings per share for the period of 22.17p was up 13.8% on the prior year (2011:
19.48p). Adjusted diluted earnings per share for the period of 21.95p, was up 14.1% on the prior
year (2011: 19.24p).
Unadjusted basic earnings per share for the period of 19.04p, was up 14.4% on the prior year (2011:
16.65p). Unadjusted diluted earnings per share for the period of 18.85p, was up 14.6% on the prior
year (2011: 16.45p).
Dividends
Following the results achieved for the year, the Board is recommending a final dividend for 2012 of
7.90p (2011: 6.80p) per share. This is a 16.2% increase on the final dividend for the prior year.
Together with the interim dividend of 6.60p per share paid on 6 September 2012, the total dividend
for the year will be 14.50p per share, an increase of 17.9% on the dividend paid for the prior year
(2011: 12.30p). The full year dividend is 1.51 times covered by adjusted profits after tax (2011: 1.56
times).
Subject to shareholders’ approval at the Annual General Meeting on 26 March 2013 the final
dividend will be payable on 12 April 2013 to shareholders on the register as at 15 March 2013.
Cash flow and net debt
The Group has a consistent record of delivering strong cash flows and in 2012 this was again the
case. Adjusted Group EBITDA increased by 13.8% to £51.9m (2011: £45.7m). Net cash generated
from operations was £47.5m (2011: £31.5m), an increase of £16.0m on the prior year.
During the year, outflows of £6.6m (2011: £4.0m) of corporation taxes and £30.3m (2011: £16.9m)
of capital expenditure and financial investment were incurred. Included in the capital expenditure
and financial investment was £2.2m (2011: £4.4m) relating to payments to Commerzbank under the
arrangements of the acquisition of Domino’s Leasing Limited as well as £4.7m investment in UK joint
ventures during the year. £5.5m (2011: £1.4m) was loaned to franchisees for the roll out of the new
store ePOS system and £4.8m for new store openings. These loans by Domino’s Pizza to franchisees
for new store openings were provided as one-off short-term bridging loans at a time when one of
the major lenders to franchisees temporarily suspended lending activity during 2012. We have now
17
agreed with two major banks that these new store loans will be refinanced by the banks directly to
the franchisees during the first half of 2013 thereby unwinding these loans from Domino’s Pizza
during the new financial year.
Overall net cash flow before financing was £17.2m (£2011: £14.5m). During the year we have
distributed a further £25.0m (2011: £20.2m) to shareholders through share buybacks of £3.3m
(2011: £2.2m) and £21.7m (2011: £18.0m) in dividends.
In the period, options over 1.4m (2011: 0.3m) shares were exercised generating an inflow of £2.6m
(2011: £0.6m).
DP Capital Ltd continued to provide leasing support to franchisees for their in-store equipment as
well as the refit of existing stores, with new advances of £1.8m (2011: £1.3m). After repayments, the
balance outstanding at the year end on these leases was £3.0m (2011: £3.3m). These facilities are
financed by a limited recourse facility and the amount drawn down at the end of the year stood at
£2.9m (2011: £2.7m).
The Group’s adjusted net debt increased by £7.7m to £23.0m (2012: £15.3m).
The Group monitors the ratio of adjusted net debt to earnings before interest, taxation, depreciation
and amortisation (EBITDA) on a quarterly basis as this is one of the financial covenants for the £30m
five-year facility. The Group includes within net debt, interest bearing loans and borrowings, bank
revolving facilities, less cash and cash equivalents and excludes non-recourse loans and the
Domino’s Pizza Germany non-controlling interest loans. The ratio of adjusted net debt to EBITDA
remains exceptionally low at 0.5 (2011: 0.4) against a covenant of 2.5:1.
Banking facilities
During the year the Group successfully re-financed its £25m five year facility at very competitive
interest rates. During this process the facility was increased from £25m to £30m. This enabled the
Group to have the additional flexibility to take advantage of further international growth
opportunities and acquire Domino’s Switzerland.
At 30 December 2012 the Group had a total of £53.0m of banking facilities of which £8.0m was
undrawn. The main facilities are a £30m five year facility and a £13m seven year term facility which
attract an interest rate of LIBOR plus 135bps and 50 bps respectively.
The Director’s are comfortable that the Group will continue to have sufficient liquidity and
headroom going forward.
Capital employed
Non-current assets increased in the year from £99.1m to £112.5m due to the acquisition of
Domino’s Switzerland and the increase in the new point of sales and new store bridging loans to
franchisees.
Current assets increased from £54.3m to £69.3m. This was predominantly due to an increase in
trade and other receivables of £11.8m offset by a decrease in cash and cash equivalents of £2.4m.
18
Current liabilities decreased from £62.6m to £52.4m, due to the movement of the Group’s £25m
long term facility to non-current liabilities, following the successful refinancing of the facility during
the year, offset by an increase of £12.3m in trade and other payables.
Non-current liabilities increased from £31.1m to £59.0m, due to the movement of the £25m five
year facility from current to non-current liabilities following the refinancing of the facility and due to
the increase of the facility from £25m to £30m.
Treasury management
The Group’s main treasury risks relate to the availability of funds to meet its future requirements
and fluctuations in interest rates. The treasury policy of the Group is determined and monitored by
the Board.
The Group monitors its cash resources through short, medium and long-term cash forecasting.
Surplus cash is pooled into an interest bearing account. The Group monitors its overall level of
financial gearing monthly, with our short, and medium-term forecasts showing underlying levels of
gearing well within our targets and banking covenants, as discussed earlier under cash flow, net
debt and bank facilities.
In addition the Group has invested in operations outside the United Kingdom and also buys and sells
goods and services in currencies other than sterling. As a result the Group is affected by movements
in exchange rates, the Euro in particular. It is the Group’s policy to mitigate these effects by agreeing
fixed Euro rates with its franchisees and suppliers wherever possible.
Conclusion
Although trading conditions were difficult, and the economic backdrop weak, the Group has been
able to further grow its sales, its estate and generate significant cash flows. As always, our people
and franchisees successfully took on the challenge and delivered an excellent set of results. This
performance again demonstrates the resilience of the Pizza home delivery market and Domino’s
business model in particular.
The Group’s international operations are performing in line with our expectations and we are
starting to see encouraging results from our investment in the Germany and Switzerland markets.
We are well positioned to continue our expansion and implement our plans for the future growth of
the Group, backed by our strong balance sheet and low financial gearing. During 2013 we will
continue to:
Focus on our customers by providing excellent value, choice through continued new product innovation and service
Maintain high standards of operational efficiency and execution
Carefully control our costs and seek to mitigate and minimise the impact of inflationary input costs thereby driving operational gearing benefits further
Grow our store portfolio in line with our long term plans
Focus on cash flow, returns and growing shareholder value

19
We will continue our relentless efforts to build a business capable of delivering long-term,
sustainable growth in cash flows to drive shareholder value, which will be returned to shareholders
through share buybacks and dividends.
Lee Ginsberg
Chief Financial Officer 22 February 2013
20
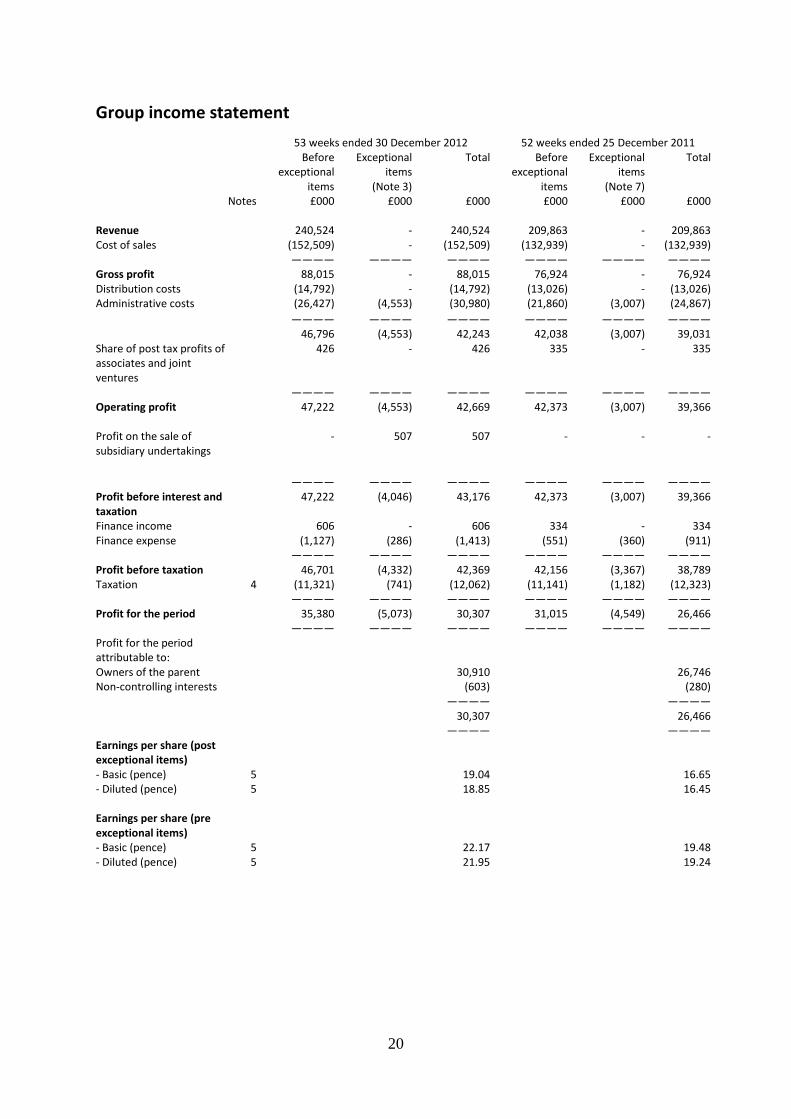
Group income statement
53 weeks ended 30 December 2012 52 weeks ended 25 December 2011 Before
exceptional items
Exceptional items
(Note 3)
Total Before exceptional
items
Exceptional items
(Note 7)
Total
Notes £000 £000 £000 £000 £000 £000 Revenue 240,524 - 240,524 209,863 - 209,863 Cost of sales (152,509) - (152,509) (132,939) - (132,939) ———— ———— ———— ———— ———— ———— Gross profit 88,015 - 88,015 76,924 - 76,924 Distribution costs (14,792) - (14,792) (13,026) - (13,026) Administrative costs (26,427) (4,553) (30,980) (21,860) (3,007) (24,867)
———— ———— ———— ———— ———— ———— 46,796 (4,553) 42,243 42,038 (3,007) 39,031 Share of post tax profits of associates and joint ventures
426 - 426 335 - 335
———— ———— ———— ———— ———— ———— Operating profit 47,222 (4,553) 42,669 42,373 (3,007) 39,366 Profit on the sale of subsidiary undertakings
- 507 507 - - -
———— ———— ———— ———— ———— ———— Profit before interest and taxation
47,222 (4,046) 43,176 42,373 (3,007) 39,366
Finance income 606 - 606 334 - 334 Finance expense (1,127) (286) (1,413) (551) (360) (911) ———— ———— ———— ———— ———— ———— Profit before taxation 46,701 (4,332) 42,369 42,156 (3,367) 38,789 Taxation 4 (11,321) (741) (12,062) (11,141) (1,182) (12,323) ———— ———— ———— ———— ———— ———— Profit for the period 35,380 (5,073) 30,307 31,015 (4,549) 26,466 ———— ———— ———— ———— ———— ———— Profit for the period attributable to:
Owners of the parent 30,910 26,746 Non-controlling interests (603) (280) ———— ———— 30,307 26,466 ———— ———— Earnings per share (post exceptional items)
- Basic (pence) 5 19.04 16.65 - Diluted (pence) 5 18.85 16.45 Earnings per share (pre exceptional items)
- Basic (pence) 5 22.17 19.48 - Diluted (pence) 5 21.95 19.24
21
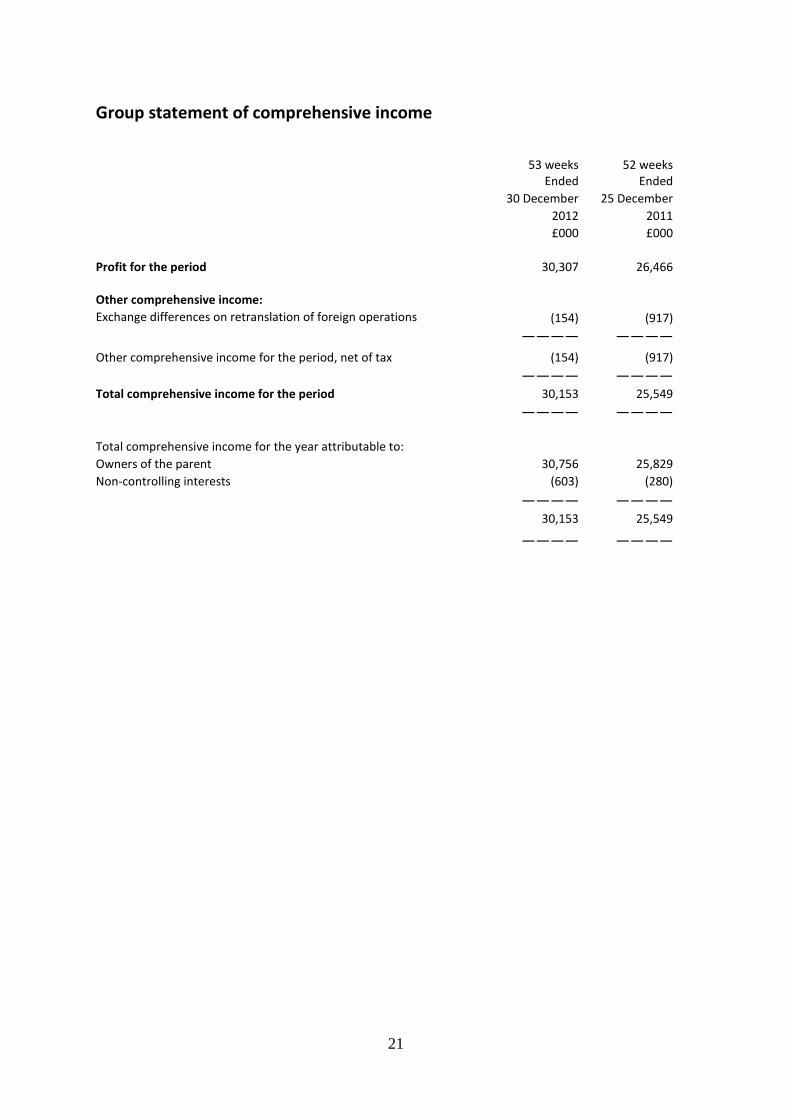
Group statement of comprehensive income
53 weeks 52 weeks Ended Ended
30 December 25 December
2012 2011
£000 £000
Profit for the period 30,307 26,466 Other comprehensive income:
Exchange differences on retranslation of foreign operations (154) (917) ———— ————
Other comprehensive income for the period, net of tax (154) (917) ———— ———— Total comprehensive income for the period 30,153 25,549 ———— ———— Total comprehensive income for the year attributable to:
Owners of the parent 30,756 25,829
Non-controlling interests (603) (280)
———— ———— 30,153 25,549
———— ————
22
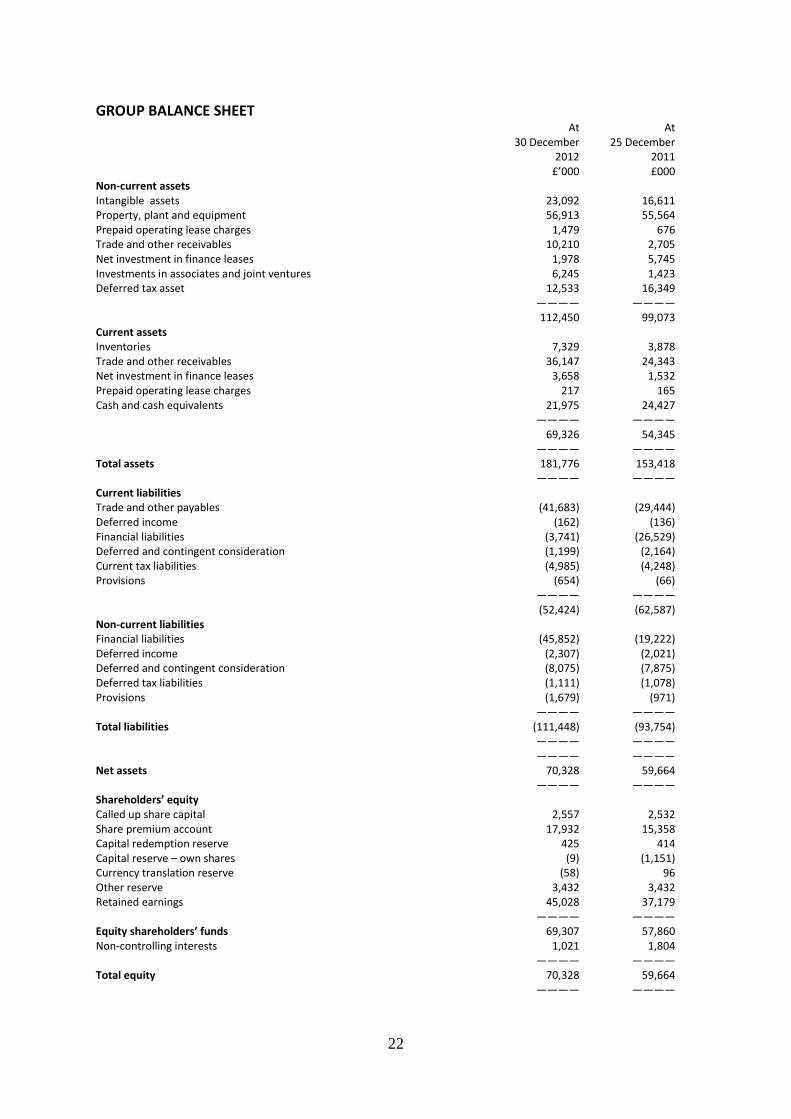
GROUP BALANCE SHEET At At 30 December 25 December 2012 2011 £’000 £000 Non-current assets Intangible assets 23,092 16,611 Property, plant and equipment 56,913 55,564 Prepaid operating lease charges 1,479 676 Trade and other receivables 10,210 2,705 Net investment in finance leases 1,978 5,745 Investments in associates and joint ventures 6,245 1,423 Deferred tax asset 12,533 16,349 ———— ———— 112,450 99,073 Current assets Inventories 7,329 3,878 Trade and other receivables 36,147 24,343 Net investment in finance leases 3,658 1,532 Prepaid operating lease charges 217 165 Cash and cash equivalents 21,975 24,427 ———— ———— 69,326 54,345 ———— ———— Total assets 181,776 153,418 ———— ———— Current liabilities Trade and other payables (41,683) (29,444) Deferred income (162) (136) Financial liabilities (3,741) (26,529) Deferred and contingent consideration (1,199) (2,164) Current tax liabilities (4,985) (4,248) Provisions (654) (66) ———— ———— (52,424) (62,587) Non-current liabilities Financial liabilities (45,852) (19,222) Deferred income (2,307) (2,021) Deferred and contingent consideration (8,075) (7,875) Deferred tax liabilities (1,111) (1,078) Provisions (1,679) (971) ———— ———— Total liabilities (111,448) (93,754) ———— ———— ———— ———— Net assets 70,328 59,664 ———— ———— Shareholders’ equity Called up share capital 2,557 2,532 Share premium account 17,932 15,358 Capital redemption reserve 425 414 Capital reserve – own shares (9) (1,151) Currency translation reserve (58) 96 Other reserve 3,432 3,432 Retained earnings 45,028 37,179 ———— ———— Equity shareholders’ funds 69,307 57,860 Non-controlling interests 1,021 1,804 ———— ———— Total equity 70,328 59,664 ———— ————
23
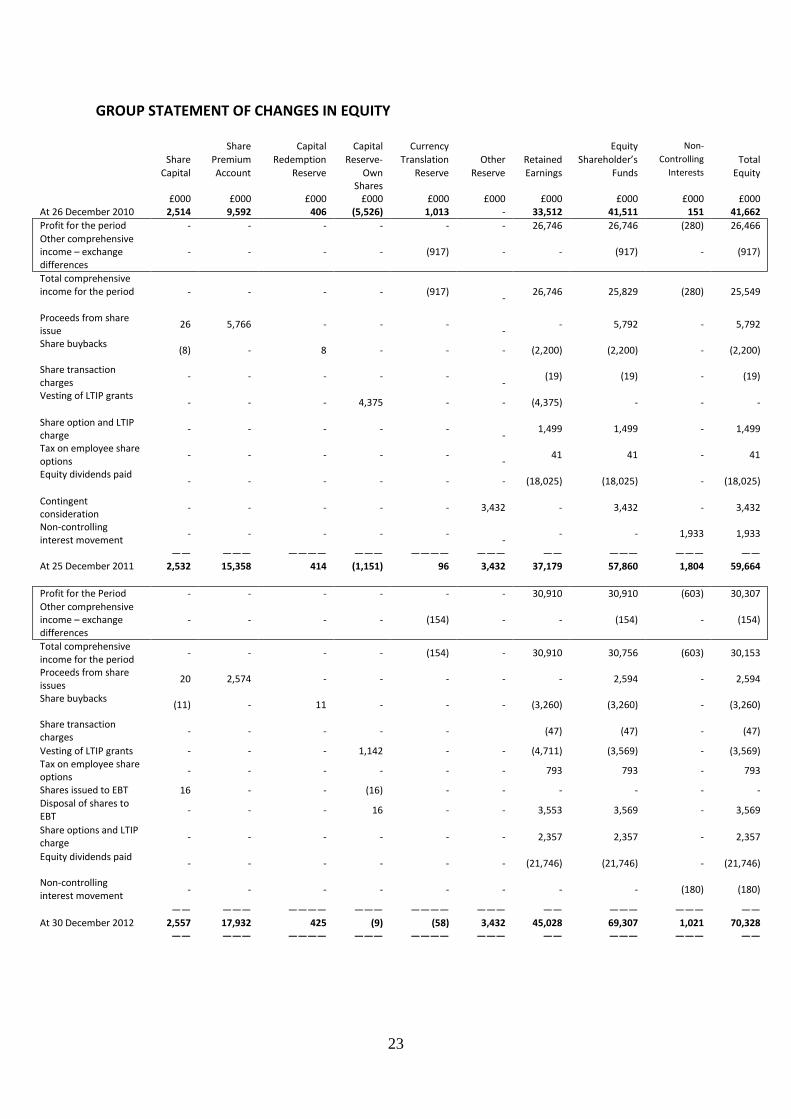
GROUP STATEMENT OF CHANGES IN EQUITY
Share Capital Capital Currency Equity Non-
Share Premium Redemption Reserve- Translation Other Retained Shareholder’s Controlling Total
Capital Account Reserve Own Shares
Reserve Reserve Earnings Funds Interests Equity
£000 £000 £000 £000 £000 £000 £000 £000 £000 £000 At 26 December 2010 2,514 9,592 406 (5,526) 1,013 - 33,512 41,511 151 41,662
Profit for the period - - - - - - 26,746 26,746 (280) 26,466 Other comprehensive income – exchange differences
- - - - (917) - - (917) - (917)
Total comprehensive income for the period - - - - (917)
-
26,746 25,829 (280) 25,549
Proceeds from share issue
26 5,766 - - -
- - 5,792 - 5,792
Share buybacks (8) - 8 - - - (2,200) (2,200) - (2,200)
Share transaction charges
- - - - -
- (19) (19) - (19)
Vesting of LTIP grants - - - 4,375 - - (4,375) - - -
Share option and LTIP charge
- - - - -
- 1,499 1,499 - 1,499
Tax on employee share options
- - - - -
- 41 41 - 41
Equity dividends paid - - - - - - (18,025) (18,025) - (18,025)
Contingent consideration
- - - - - 3,432 - 3,432 - 3,432
Non-controlling interest movement
- - - - -
- - - 1,933 1,933
—— ——— ———— ——— ———— ——— —— ——— ——— —— At 25 December 2011 2,532 15,358 414 (1,151) 96 3,432 37,179 57,860 1,804 59,664
Profit for the Period - - - - - - 30,910 30,910 (603) 30,307 Other comprehensive income – exchange differences
- - - - (154) - - (154) - (154)
Total comprehensive income for the period
- - - - (154) - 30,910 30,756 (603) 30,153
Proceeds from share issues
20 2,574 - - - - - 2,594 - 2,594
Share buybacks (11) - 11 - - - (3,260) (3,260) - (3,260)
Share transaction charges
- - - - - (47) (47) - (47)
Vesting of LTIP grants - - - 1,142 - - (4,711) (3,569) - (3,569) Tax on employee share options
- - - - - - 793 793 - 793
Shares issued to EBT 16 - - (16) - - - - - - Disposal of shares to EBT
- - - 16 - - 3,553 3,569 - 3,569
Share options and LTIP charge
- - - - - - 2,357 2,357 - 2,357
Equity dividends paid - - - - - - (21,746) (21,746) - (21,746)
Non-controlling interest movement
- - - - - - - - (180) (180)
—— ——— ———— ——— ———— ——— —— ——— ——— —— At 30 December 2012 2,557 17,932 425 (9) (58) 3,432 45,028 69,307 1,021 70,328 —— ——— ———— ——— ———— ——— —— ——— ——— ——
24
GROUP CASH FLOW STATEMENT
53 weeks
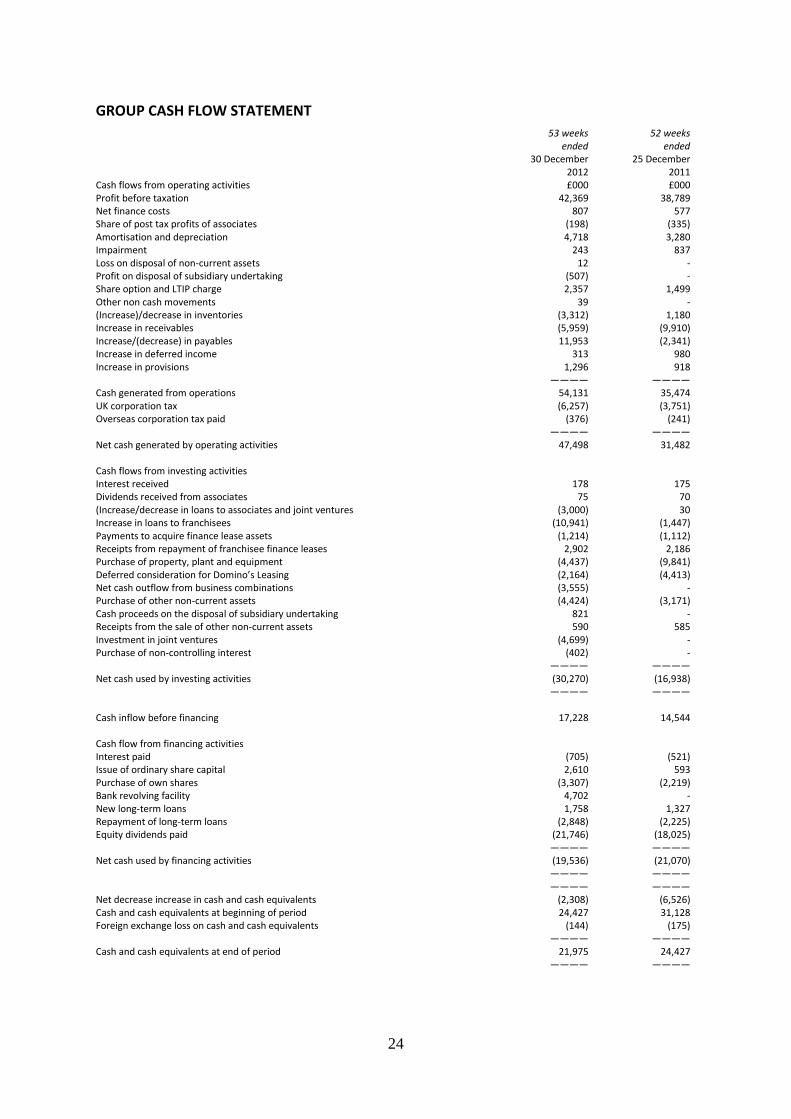
52 weeks ended ended 30 December 25 December 2012 2011 Cash flows from operating activities £000 £000 Profit before taxation 42,369 38,789 Net finance costs 807 577 Share of post tax profits of associates (198) (335) Amortisation and depreciation 4,718 3,280 Impairment 243 837 Loss on disposal of non-current assets 12 - Profit on disposal of subsidiary undertaking (507) - Share option and LTIP charge 2,357 1,499 Other non cash movements 39 - (Increase)/decrease in inventories (3,312) 1,180 Increase in receivables (5,959) (9,910) Increase/(decrease) in payables 11,953 (2,341) Increase in deferred income 313 980 Increase in provisions 1,296 918 ———— ———— Cash generated from operations 54,131 35,474 UK corporation tax (6,257) (3,751) Overseas corporation tax paid (376) (241) ———— ———— Net cash generated by operating activities 47,498 31,482 Cash flows from investing activities Interest received 178 175 Dividends received from associates 75 70 (Increase/decrease in loans to associates and joint ventures (3,000) 30 Increase in loans to franchisees (10,941) (1,447) Payments to acquire finance lease assets (1,214) (1,112) Receipts from repayment of franchisee finance leases 2,902 2,186 Purchase of property, plant and equipment (4,437) (9,841) Deferred consideration for Domino’s Leasing (2,164) (4,413) Net cash outflow from business combinations (3,555) - Purchase of other non-current assets (4,424) (3,171) Cash proceeds on the disposal of subsidiary undertaking 821 - Receipts from the sale of other non-current assets 590 585 Investment in joint ventures (4,699) - Purchase of non-controlling interest (402) - ———— ———— Net cash used by investing activities (30,270) (16,938) ———— ———— Cash inflow before financing 17,228 14,544 Cash flow from financing activities Interest paid (705) (521) Issue of ordinary share capital 2,610 593 Purchase of own shares (3,307) (2,219) Bank revolving facility 4,702 - New long-term loans 1,758 1,327 Repayment of long-term loans (2,848) (2,225) Equity dividends paid (21,746) (18,025) ———— ———— Net cash used by financing activities (19,536) (21,070) ———— ———— ———— ———— Net decrease increase in cash and cash equivalents (2,308) (6,526) Cash and cash equivalents at beginning of period 24,427 31,128 Foreign exchange loss on cash and cash equivalents (144) (175) ———— ———— Cash and cash equivalents at end of period 21,975 24,427 ———— ————

25
Notes to the Group financial statements
1. ACCOUNTING POLICIES
Basis of preparation The preliminary results for the 53 weeks ended 30 December 2012 have been prepared in accordance with International Financial Reporting Standards (IFRS) as adopted by the European Union and are in line with the accounting policies set out in the interim financial statements for the 26 weeks ended 24 June 2012. The financial information in the preliminary statement of the results does not constitute statutory accounts within the meaning of Section 435 of the Companies Act 2006 (the Act). The financial information for the 53 weeks ended 30 December 2012 has been extracted from the statutory accounts on which an unqualified audit opinion has been issued. Statutory accounts for the 53 weeks ended 30 December 2012 will be delivered to the Registrar of Companies following the Company’s Annual General Meeting. The financial statements, and this preliminary statement, of Domino’s Pizza Group plc for the 53 weeks ended 30 December 2012 were authorised for issue by the Board of directors on 22 February 2013 and the balance sheet was signed on behalf of the Board by Lee Ginsberg, Chief Financial Officer. The statutory accounts have been delivered to the Registrar of Companies in respect of the 52 weeks ended 25 December 2011 and the Auditors of the Company made a report thereon under section 235 of the Act. That report was an unqualified report and did not contain a statement under section 498(2) or (3) of the Act
2. SEGMENT INFORMATION For management purposes, the Group is organised into four geographical business units, the United Kingdom, Ireland, Germany and Switzerland, based on the territories governed by the Master Franchise Agreement ("MFA"). These are considered to be the Group's operating segments as the information provided to the chief operating decision makers, who are considered to be the Executive Directors of the Board, is based on these territories. Revenue included in each includes all sales (royalties, commissary sales, rental income and finance lease income) made to franchise stores located in that segment. Segment results for the Ireland segment include both the Republic of Ireland and Northern Ireland as both of these territories are served by the same commissary. The new Switzerland operating segment is in respect of business acquired in Switzerland during the period. Management monitors the operating results of its business units separately for the purpose of making decisions about resource allocation and performance assessment. Segment performance is evaluated based on operating profit or loss. Group financing (including finance costs and finance revenue) and income taxes are managed on a group basis and are not allocated to operating segments.
26
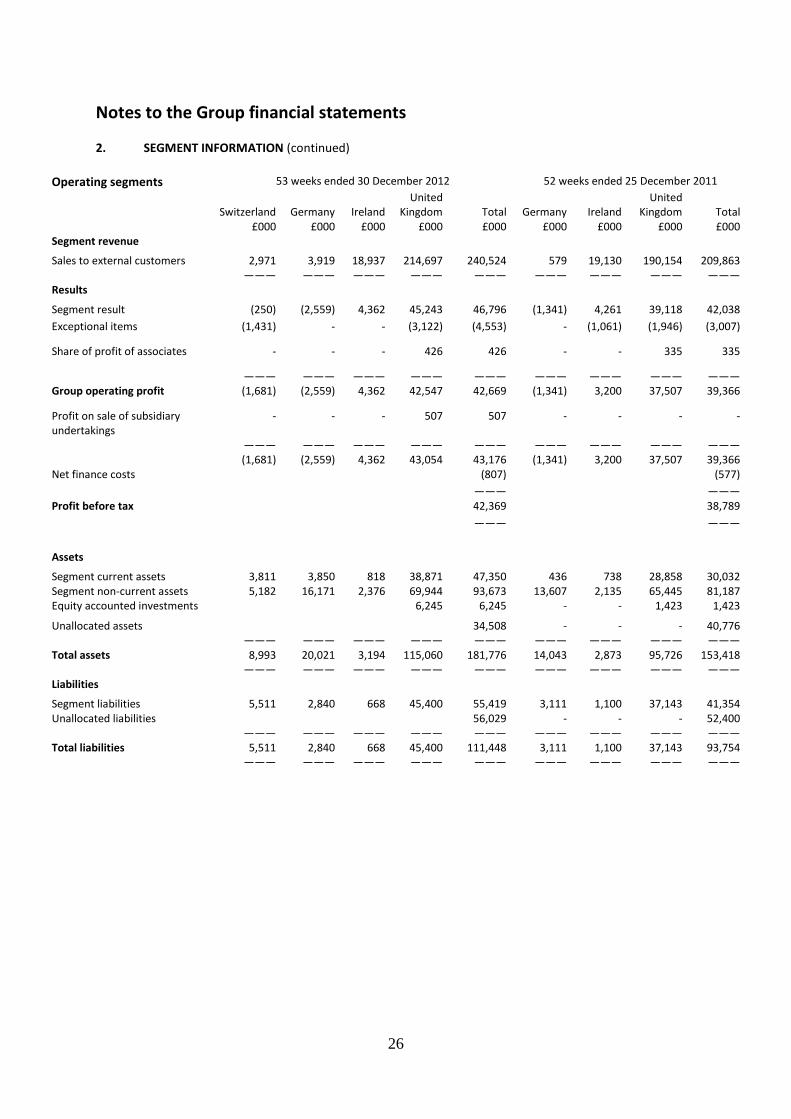
Notes to the Group financial statements 2. SEGMENT INFORMATION (continued)
Operating segments 53 weeks ended 30 December 2012 52 weeks ended 25 December 2011
Switzerland
Germany Ireland
United Kingdom Total
Germany Ireland
United Kingdom Total
£000 £000 £000 £000 £000 £000 £000 £000 £000 Segment revenue Sales to external customers 2,971 3,919 18,937 214,697 240,524 579 19,130 190,154 209,863 ——— ——— ——— ——— ——— ——— ——— ——— ——— Results Segment result (250) (2,559) 4,362 45,243 46,796 (1,341) 4,261 39,118 42,038 Exceptional items (1,431) - - (3,122) (4,553) - (1,061) (1,946) (3,007)
Share of profit of associates - - - 426 426 - - 335 335
——— ——— ——— ——— ——— ——— ——— ——— ——— Group operating profit (1,681) (2,559) 4,362 42,547 42,669 (1,341) 3,200 37,507 39,366
Profit on sale of subsidiary undertakings
- - - 507 507 - - - -
——— ——— ——— ——— ——— ——— ——— ——— ——— (1,681) (2,559) 4,362 43,054 43,176 (1,341) 3,200 37,507 39,366 Net finance costs (807) (577) ——— ——— Profit before tax 42,369 38,789 ——— ——— Assets Segment current assets 3,811 3,850 818 38,871 47,350 436 738 28,858 30,032 Segment non-current assets 5,182 16,171 2,376 69,944 93,673 13,607 2,135 65,445 81,187 Equity accounted investments 6,245 6,245 - - 1,423 1,423
Unallocated assets 34,508 - - - 40,776 ——— ——— ——— ——— ——— ——— ——— ——— ——— Total assets 8,993 20,021 3,194 115,060 181,776 14,043 2,873 95,726 153,418 ——— ——— ——— ——— ——— ——— ——— ——— ——— Liabilities Segment liabilities 5,511 2,840 668 45,400 55,419 3,111 1,100 37,143 41,354 Unallocated liabilities 56,029 - - - 52,400 ——— ——— ——— ——— ——— ——— ——— ——— ——— Total liabilities 5,511 2,840 668 45,400 111,448 3,111 1,100 37,143 93,754 ——— ——— ——— ——— ——— ——— ——— ——— ———
27
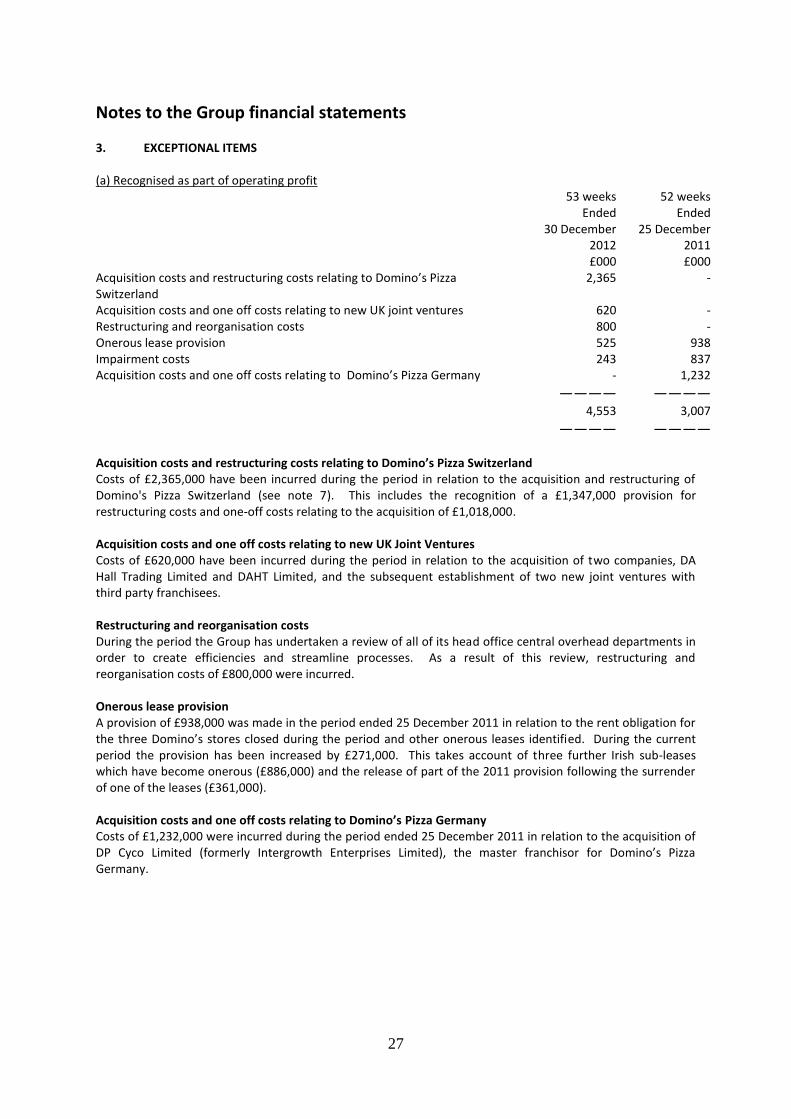
Notes to the Group financial statements 3. EXCEPTIONAL ITEMS (a) Recognised as part of operating profit 53 weeks 52 weeks Ended Ended 30 December 25 December 2012 2011 £000 £000 Acquisition costs and restructuring costs relating to Domino’s Pizza Switzerland
2,365 -
Acquisition costs and one off costs relating to new UK joint ventures 620 - Restructuring and reorganisation costs 800 - Onerous lease provision 525 938 Impairment costs 243 837 Acquisition costs and one off costs relating to Domino’s Pizza Germany - 1,232 ———— ————
4,553 3,007 ———— ————
Acquisition costs and restructuring costs relating to Domino’s Pizza Switzerland Costs of £2,365,000 have been incurred during the period in relation to the acquisition and restructuring of Domino's Pizza Switzerland (see note 7). This includes the recognition of a £1,347,000 provision for restructuring costs and one-off costs relating to the acquisition of £1,018,000. Acquisition costs and one off costs relating to new UK Joint Ventures Costs of £620,000 have been incurred during the period in relation to the acquisition of two companies, DA Hall Trading Limited and DAHT Limited, and the subsequent establishment of two new joint ventures with third party franchisees. Restructuring and reorganisation costs During the period the Group has undertaken a review of all of its head office central overhead departments in order to create efficiencies and streamline processes. As a result of this review, restructuring and reorganisation costs of £800,000 were incurred. Onerous lease provision A provision of £938,000 was made in the period ended 25 December 2011 in relation to the rent obligation for the three Domino’s stores closed during the period and other onerous leases identified. During the current period the provision has been increased by £271,000. This takes account of three further Irish sub-leases which have become onerous (£886,000) and the release of part of the 2011 provision following the surrender of one of the leases (£361,000). Acquisition costs and one off costs relating to Domino’s Pizza Germany Costs of £1,232,000 were incurred during the period ended 25 December 2011 in relation to the acquisition of DP Cyco Limited (formerly Intergrowth Enterprises Limited), the master franchisor for Domino’s Pizza Germany.
28
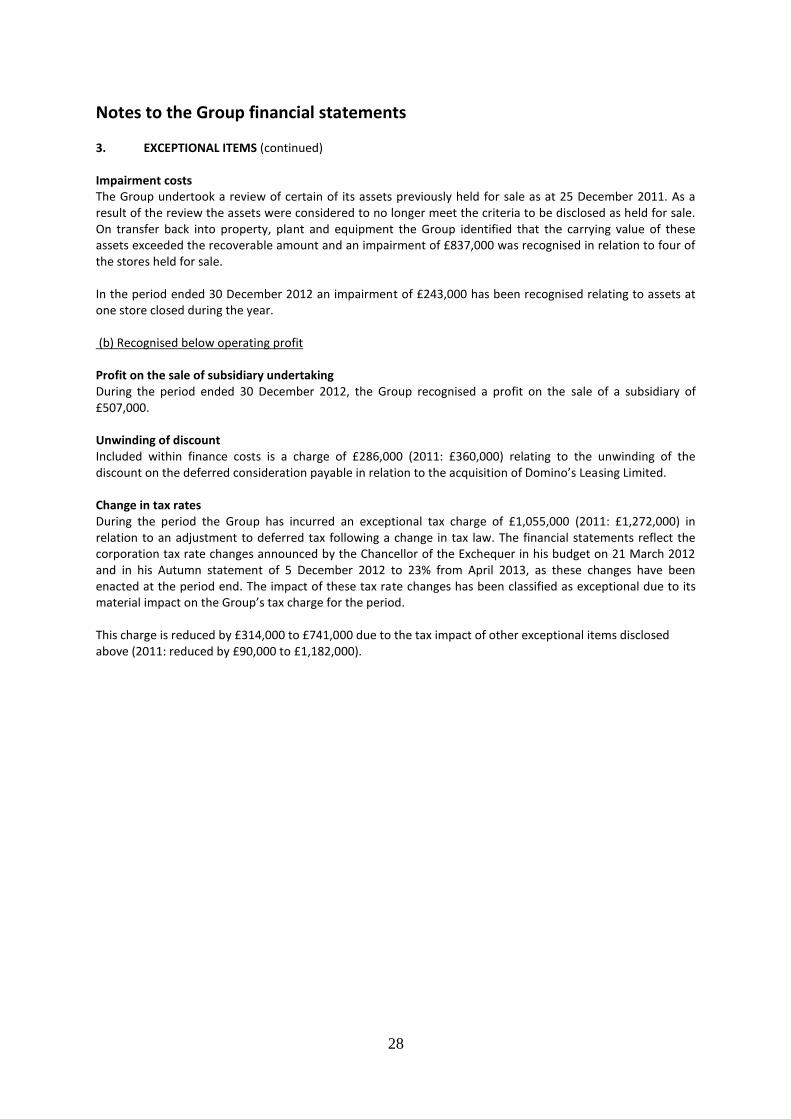
Notes to the Group financial statements 3. EXCEPTIONAL ITEMS (continued) Impairment costs The Group undertook a review of certain of its assets previously held for sale as at 25 December 2011. As a result of the review the assets were considered to no longer meet the criteria to be disclosed as held for sale. On transfer back into property, plant and equipment the Group identified that the carrying value of these assets exceeded the recoverable amount and an impairment of £837,000 was recognised in relation to four of the stores held for sale. In the period ended 30 December 2012 an impairment of £243,000 has been recognised relating to assets at one store closed during the year. (b) Recognised below operating profit Profit on the sale of subsidiary undertaking During the period ended 30 December 2012, the Group recognised a profit on the sale of a subsidiary of £507,000. Unwinding of discount Included within finance costs is a charge of £286,000 (2011: £360,000) relating to the unwinding of the discount on the deferred consideration payable in relation to the acquisition of Domino’s Leasing Limited. Change in tax rates During the period the Group has incurred an exceptional tax charge of £1,055,000 (2011: £1,272,000) in relation to an adjustment to deferred tax following a change in tax law. The financial statements reflect the corporation tax rate changes announced by the Chancellor of the Exchequer in his budget on 21 March 2012 and in his Autumn statement of 5 December 2012 to 23% from April 2013, as these changes have been enacted at the period end. The impact of these tax rate changes has been classified as exceptional due to its material impact on the Group’s tax charge for the period. This charge is reduced by £314,000 to £741,000 due to the tax impact of other exceptional items disclosed above (2011: reduced by £90,000 to £1,182,000).
29
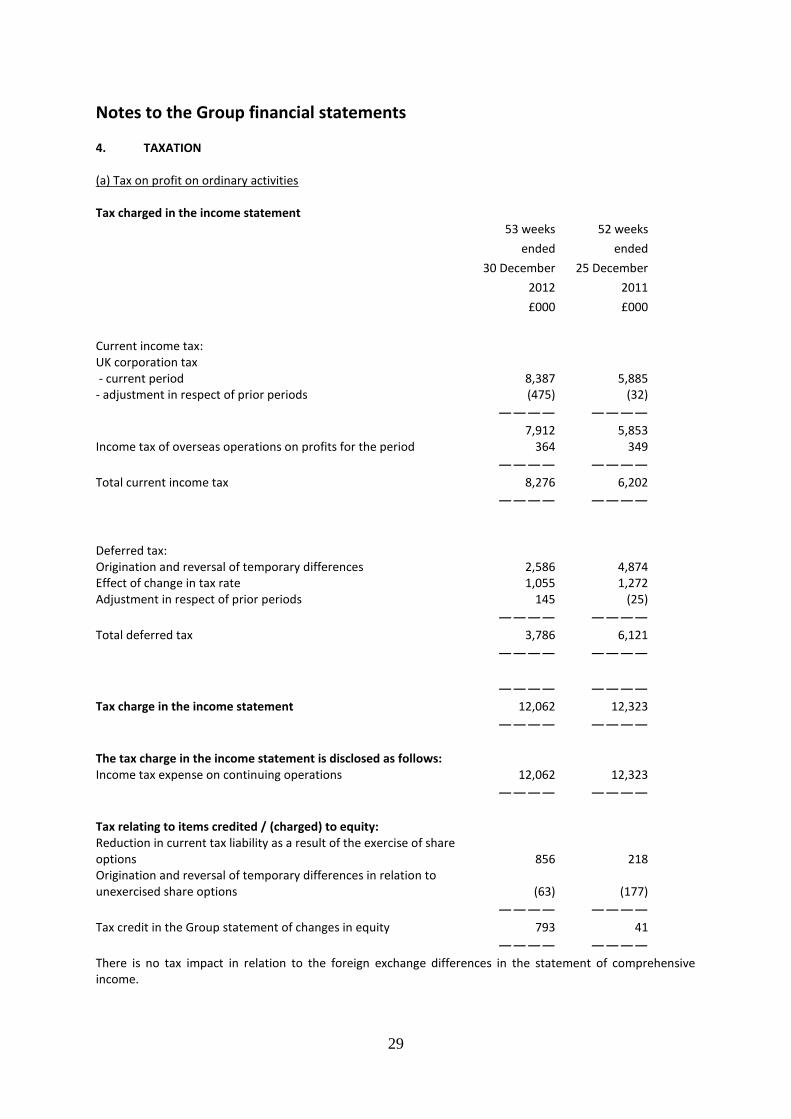
Notes to the Group financial statements 4. TAXATION (a) Tax on profit on ordinary activities Tax charged in the income statement
53 weeks 52 weeks
ended ended
30 December 25 December
2012 2011
£000 £000
Current income tax: UK corporation tax - current period 8,387 5,885 - adjustment in respect of prior periods (475) (32) ———— ————
7,912 5,853 Income tax of overseas operations on profits for the period 364 349 ———— ———— Total current income tax 8,276 6,202 ———— ———— Deferred tax: Origination and reversal of temporary differences 2,586 4,874 Effect of change in tax rate 1,055 1,272 Adjustment in respect of prior periods 145 (25) ———— ———— Total deferred tax 3,786 6,121 ———— ———— ———— ———— Tax charge in the income statement 12,062 12,323 ———— ———— The tax charge in the income statement is disclosed as follows: Income tax expense on continuing operations 12,062 12,323 ———— ———— Tax relating to items credited / (charged) to equity: Reduction in current tax liability as a result of the exercise of share options 856 218 Origination and reversal of temporary differences in relation to unexercised share options (63) (177) ———— ———— Tax credit in the Group statement of changes in equity 793 41 ———— ———— There is no tax impact in relation to the foreign exchange differences in the statement of comprehensive income.
30
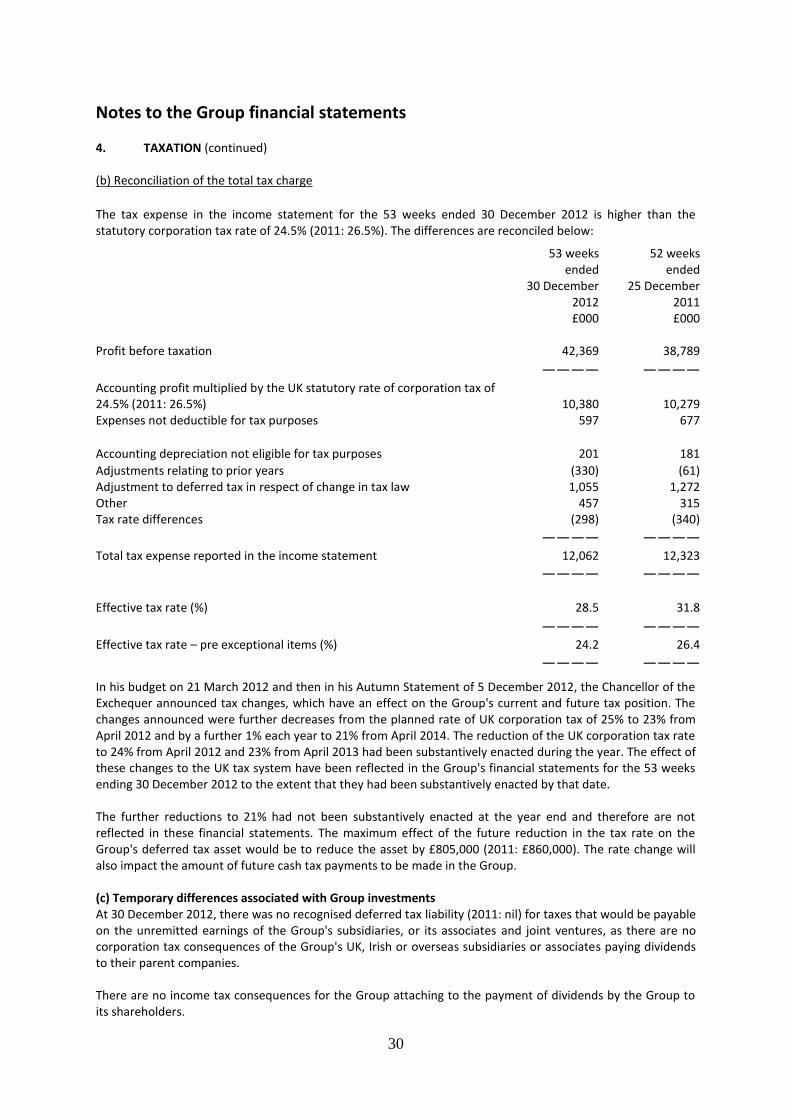
Notes to the Group financial statements 4. TAXATION (continued) (b) Reconciliation of the total tax charge
The tax expense in the income statement for the 53 weeks ended 30 December 2012 is higher than the statutory corporation tax rate of 24.5% (2011: 26.5%). The differences are reconciled below:
53 weeks 52 weeks ended ended 30 December 25 December 2012 2011 £000 £000 Profit before taxation 42,369 38,789
———— ———— Accounting profit multiplied by the UK statutory rate of corporation tax of 24.5% (2011: 26.5%) 10,380 10,279 Expenses not deductible for tax purposes 597 677
Accounting depreciation not eligible for tax purposes 201 181
Adjustments relating to prior years (330) (61) Adjustment to deferred tax in respect of change in tax law 1,055 1,272 Other 457 315 Tax rate differences (298) (340) ———— ———— Total tax expense reported in the income statement 12,062 12,323 ———— ———— Effective tax rate (%) 28.5 31.8
———— ———— Effective tax rate – pre exceptional items (%) 24.2 26.4 ———— ————
In his budget on 21 March 2012 and then in his Autumn Statement of 5 December 2012, the Chancellor of the Exchequer announced tax changes, which have an effect on the Group's current and future tax position. The changes announced were further decreases from the planned rate of UK corporation tax of 25% to 23% from April 2012 and by a further 1% each year to 21% from April 2014. The reduction of the UK corporation tax rate to 24% from April 2012 and 23% from April 2013 had been substantively enacted during the year. The effect of these changes to the UK tax system have been reflected in the Group's financial statements for the 53 weeks ending 30 December 2012 to the extent that they had been substantively enacted by that date. The further reductions to 21% had not been substantively enacted at the year end and therefore are not reflected in these financial statements. The maximum effect of the future reduction in the tax rate on the Group's deferred tax asset would be to reduce the asset by £805,000 (2011: £860,000). The rate change will also impact the amount of future cash tax payments to be made in the Group. (c) Temporary differences associated with Group investments At 30 December 2012, there was no recognised deferred tax liability (2011: nil) for taxes that would be payable on the unremitted earnings of the Group's subsidiaries, or its associates and joint ventures, as there are no corporation tax consequences of the Group's UK, Irish or overseas subsidiaries or associates paying dividends to their parent companies. There are no income tax consequences for the Group attaching to the payment of dividends by the Group to its shareholders.
31
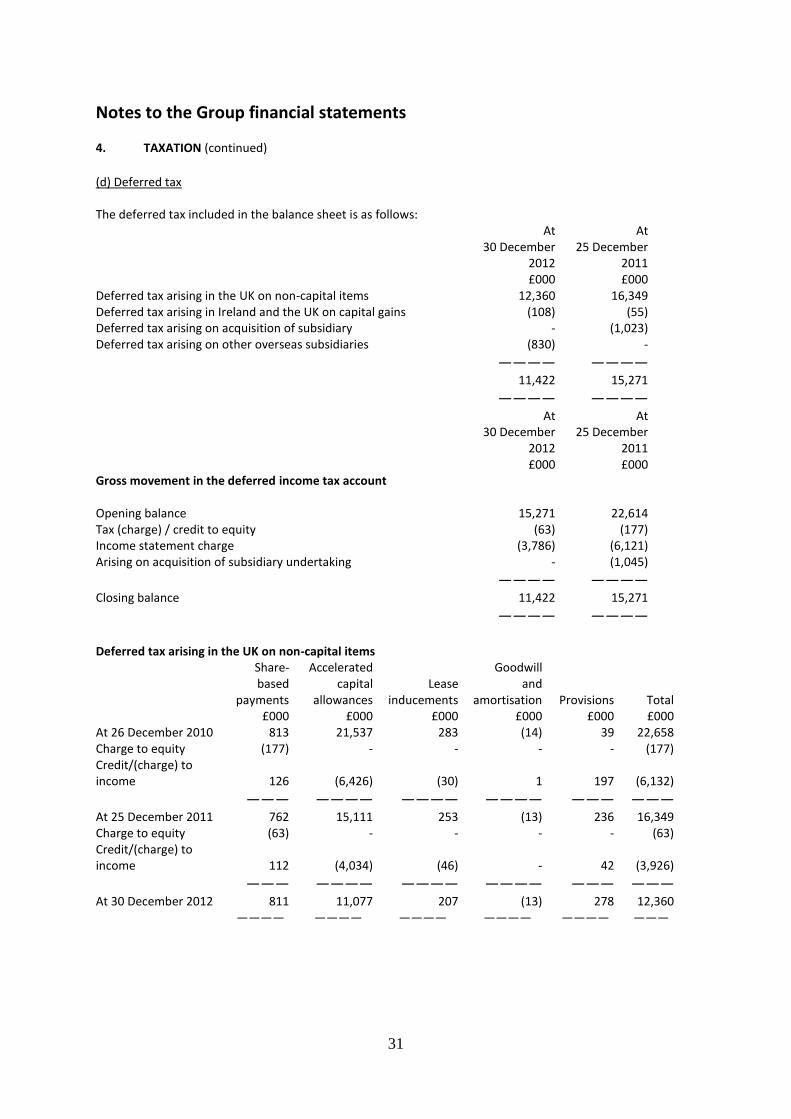
Notes to the Group financial statements 4. TAXATION (continued)
(d) Deferred tax The deferred tax included in the balance sheet is as follows: At At 30 December 25 December 2012 2011 £000 £000 Deferred tax arising in the UK on non-capital items 12,360 16,349 Deferred tax arising in Ireland and the UK on capital gains (108) (55) Deferred tax arising on acquisition of subsidiary - (1,023) Deferred tax arising on other overseas subsidiaries (830) - ———— ————
11,422 15,271 ———— ———— At At 30 December 25 December 2012 2011 £000 £000 Gross movement in the deferred income tax account Opening balance 15,271 22,614 Tax (charge) / credit to equity (63) (177) Income statement charge (3,786) (6,121) Arising on acquisition of subsidiary undertaking - (1,045) ———— ———— Closing balance 11,422 15,271 ———— ———— Deferred tax arising in the UK on non-capital items Share-
based payments
Accelerated capital
allowances Lease
inducements
Goodwill and
amortisation Provisions Total £000 £000 £000 £000 £000 £000 At 26 December 2010 813 21,537 283 (14) 39 22,658 Charge to equity (177) - - - - (177) Credit/(charge) to income 126 (6,426) (30) 1 197 (6,132)
——— ———— ———— ———— ——— ——— At 25 December 2011 762 15,111 253 (13) 236 16,349 Charge to equity (63) - - - - (63) Credit/(charge) to income 112 (4,034) (46) - 42 (3,926) ——— ———— ———— ———— ——— ——— At 30 December 2012 811 11,077 207 (13) 278 12,360 ———— ———— ———— ———— ———— ———
32
Notes to the Group financial statements 4. TAXATION (continued)
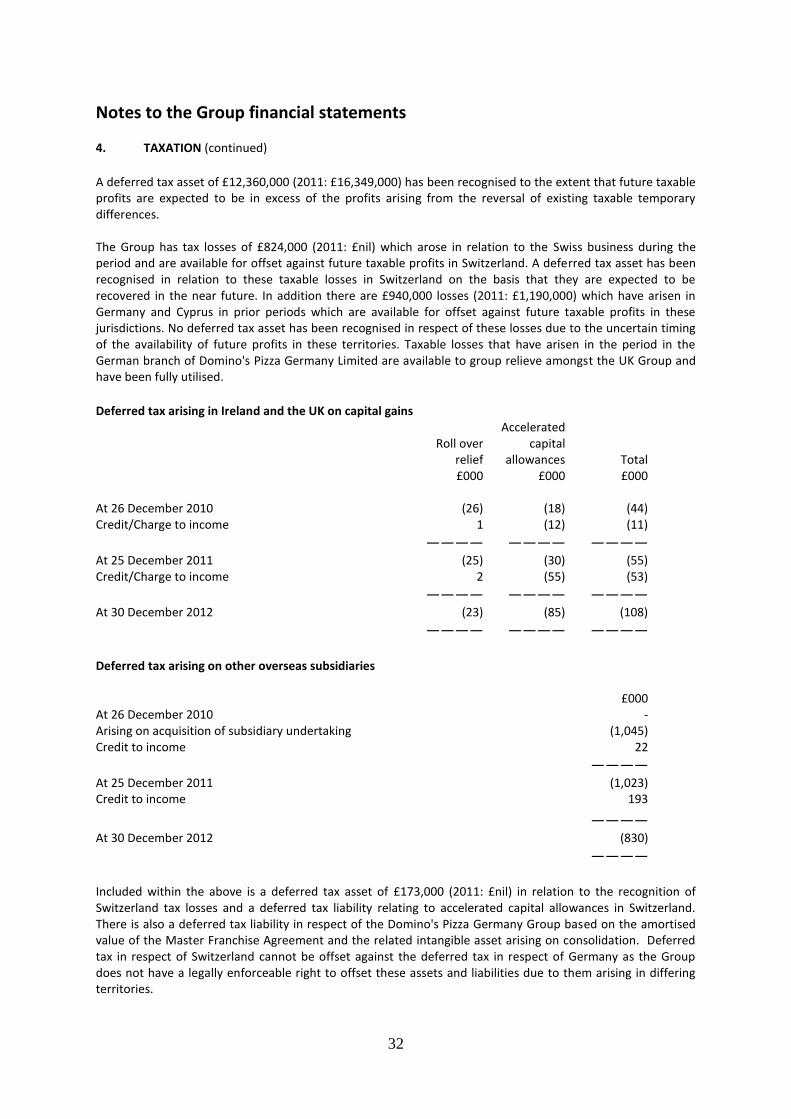
A deferred tax asset of £12,360,000 (2011: £16,349,000) has been recognised to the extent that future taxable profits are expected to be in excess of the profits arising from the reversal of existing taxable temporary differences. The Group has tax losses of £824,000 (2011: £nil) which arose in relation to the Swiss business during the period and are available for offset against future taxable profits in Switzerland. A deferred tax asset has been recognised in relation to these taxable losses in Switzerland on the basis that they are expected to be recovered in the near future. In addition there are £940,000 losses (2011: £1,190,000) which have arisen in Germany and Cyprus in prior periods which are available for offset against future taxable profits in these jurisdictions. No deferred tax asset has been recognised in respect of these losses due to the uncertain timing of the availability of future profits in these territories. Taxable losses that have arisen in the period in the German branch of Domino's Pizza Germany Limited are available to group relieve amongst the UK Group and have been fully utilised.
Deferred tax arising in Ireland and the UK on capital gains
Roll over relief
Accelerated capital
allowances Total £000 £000 £000 At 26 December 2010 (26) (18) (44) Credit/Charge to income 1 (12) (11) ———— ———— ————
At 25 December 2011 (25) (30) (55) Credit/Charge to income 2 (55) (53) ———— ———— ————
At 30 December 2012 (23) (85) (108) ———— ———— ————
Deferred tax arising on other overseas subsidiaries £000 At 26 December 2010 - Arising on acquisition of subsidiary undertaking (1,045) Credit to income 22 ————
At 25 December 2011 (1,023) Credit to income 193 ————
At 30 December 2012 (830) ————
Included within the above is a deferred tax asset of £173,000 (2011: £nil) in relation to the recognition of Switzerland tax losses and a deferred tax liability relating to accelerated capital allowances in Switzerland. There is also a deferred tax liability in respect of the Domino's Pizza Germany Group based on the amortised value of the Master Franchise Agreement and the related intangible asset arising on consolidation. Deferred tax in respect of Switzerland cannot be offset against the deferred tax in respect of Germany as the Group does not have a legally enforceable right to offset these assets and liabilities due to them arising in differing territories.
33
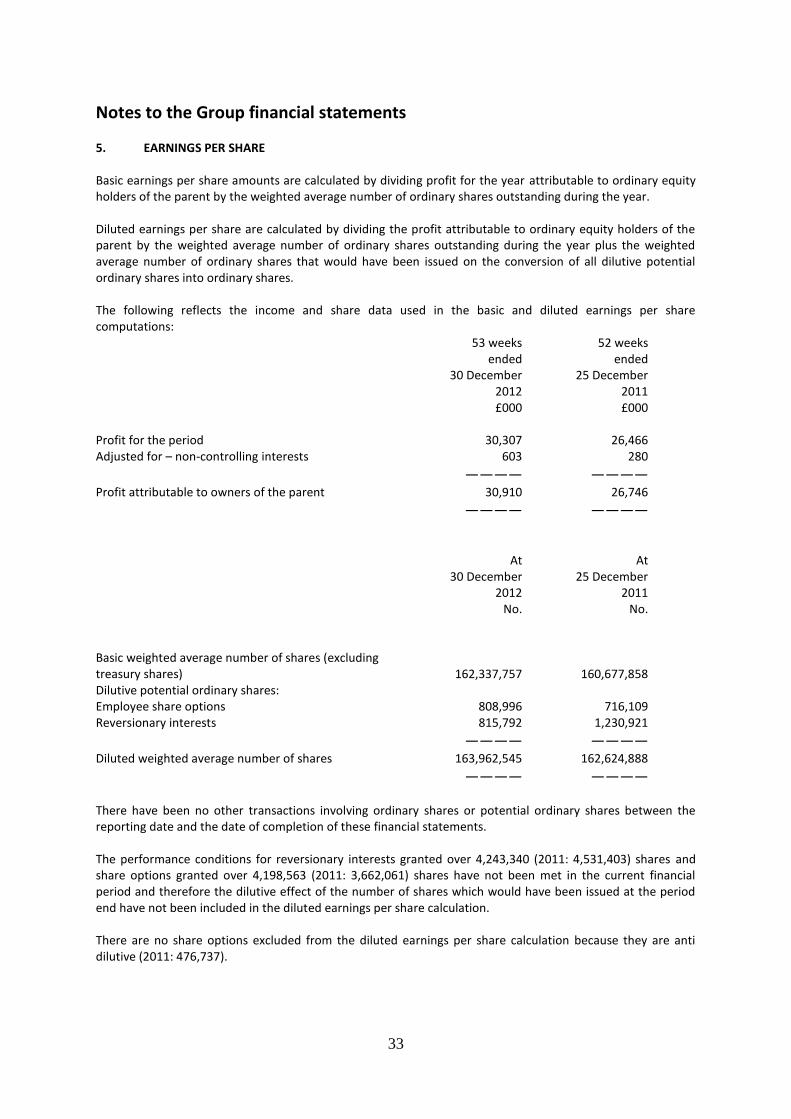
Notes to the Group financial statements 5. EARNINGS PER SHARE Basic earnings per share amounts are calculated by dividing profit for the year attributable to ordinary equity holders of the parent by the weighted average number of ordinary shares outstanding during the year. Diluted earnings per share are calculated by dividing the profit attributable to ordinary equity holders of the parent by the weighted average number of ordinary shares outstanding during the year plus the weighted average number of ordinary shares that would have been issued on the conversion of all dilutive potential ordinary shares into ordinary shares. The following reflects the income and share data used in the basic and diluted earnings per share computations: 53 weeks 52 weeks ended ended 30 December 25 December 2012 2011 £000 £000 Profit for the period 30,307 26,466 Adjusted for – non-controlling interests 603 280 ———— ————
Profit attributable to owners of the parent 30,910 26,746 ———— ————
At At 30 December 25 December 2012 2011 No. No. Basic weighted average number of shares (excluding treasury shares) 162,337,757 160,677,858 Dilutive potential ordinary shares: Employee share options 808,996 716,109 Reversionary interests 815,792 1,230,921 ———— ————
Diluted weighted average number of shares 163,962,545 162,624,888 ———— ————
There have been no other transactions involving ordinary shares or potential ordinary shares between the reporting date and the date of completion of these financial statements. The performance conditions for reversionary interests granted over 4,243,340 (2011: 4,531,403) shares and share options granted over 4,198,563 (2011: 3,662,061) shares have not been met in the current financial period and therefore the dilutive effect of the number of shares which would have been issued at the period end have not been included in the diluted earnings per share calculation. There are no share options excluded from the diluted earnings per share calculation because they are anti dilutive (2011: 476,737).
34
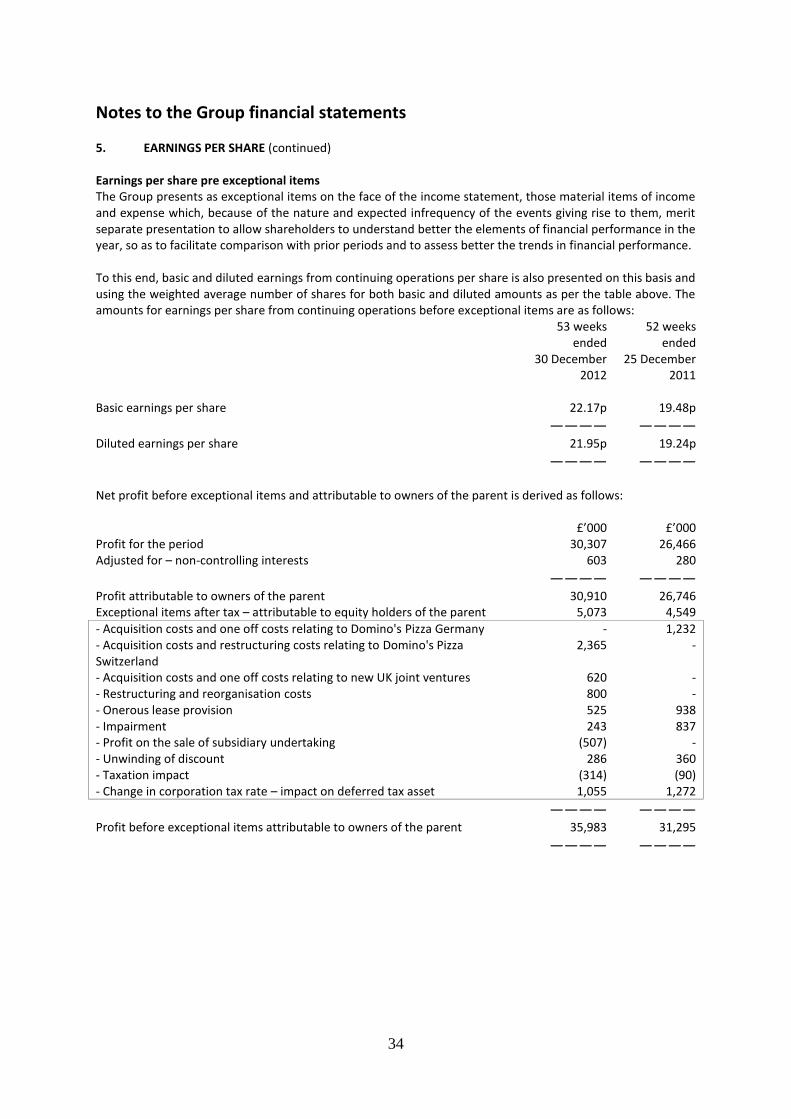
Notes to the Group financial statements 5. EARNINGS PER SHARE (continued) Earnings per share pre exceptional items The Group presents as exceptional items on the face of the income statement, those material items of income and expense which, because of the nature and expected infrequency of the events giving rise to them, merit separate presentation to allow shareholders to understand better the elements of financial performance in the year, so as to facilitate comparison with prior periods and to assess better the trends in financial performance. To this end, basic and diluted earnings from continuing operations per share is also presented on this basis and using the weighted average number of shares for both basic and diluted amounts as per the table above. The amounts for earnings per share from continuing operations before exceptional items are as follows: 53 weeks 52 weeks ended ended 30 December 25 December 2012 2011 Basic earnings per share 22.17p 19.48p ———— ————
Diluted earnings per share 21.95p 19.24p ———— ———— Net profit before exceptional items and attributable to owners of the parent is derived as follows: £’000 £’000 Profit for the period 30,307 26,466 Adjusted for – non-controlling interests 603 280 ———— ———— Profit attributable to owners of the parent 30,910 26,746 Exceptional items after tax – attributable to equity holders of the parent 5,073 4,549
- Acquisition costs and one off costs relating to Domino's Pizza Germany - 1,232 - Acquisition costs and restructuring costs relating to Domino's Pizza Switzerland
2,365 -
- Acquisition costs and one off costs relating to new UK joint ventures 620 - - Restructuring and reorganisation costs 800 - - Onerous lease provision 525 938 - Impairment 243 837 - Profit on the sale of subsidiary undertaking (507) - - Unwinding of discount 286 360 - Taxation impact (314) (90) - Change in corporation tax rate – impact on deferred tax asset 1,055 1,272 ———— ———— Profit before exceptional items attributable to owners of the parent 35,983 31,295 ———— ————
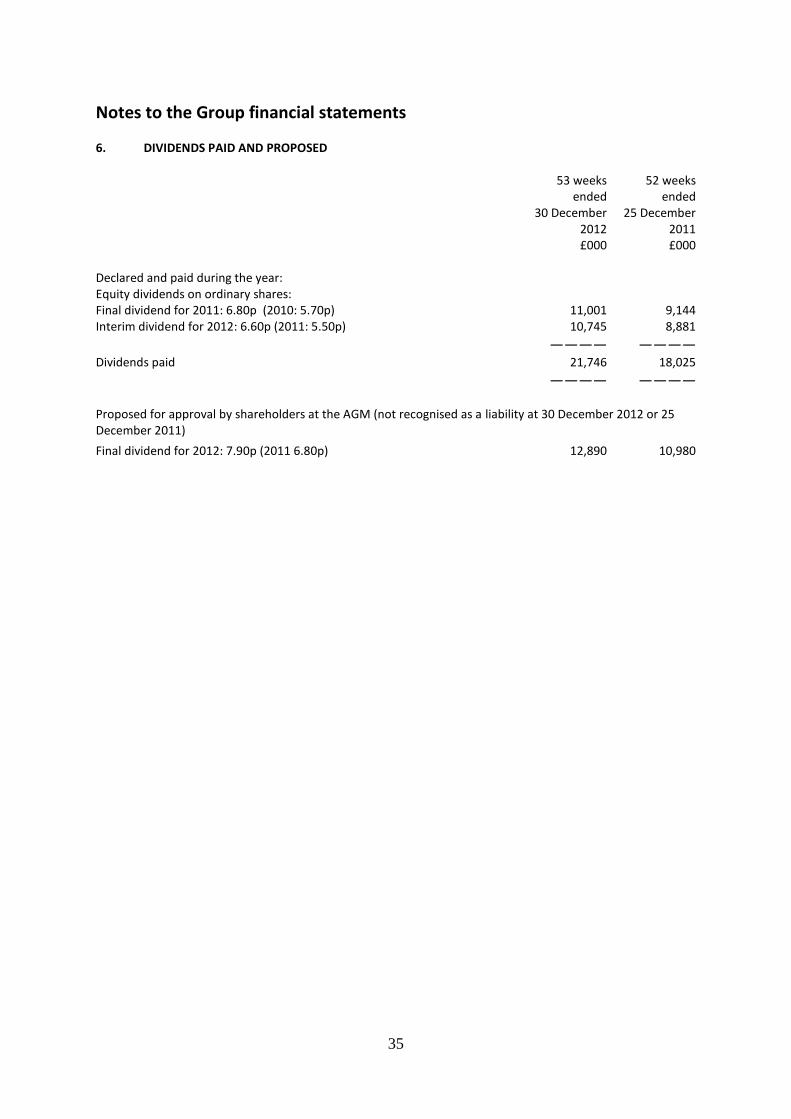
35
Notes to the Group financial statements 6. DIVIDENDS PAID AND PROPOSED 53 weeks 52 weeks ended ended 30 December 25 December 2012 2011 £000 £000 Declared and paid during the year: Equity dividends on ordinary shares: Final dividend for 2011: 6.80p (2010: 5.70p) 11,001 9,144 Interim dividend for 2012: 6.60p (2011: 5.50p) 10,745 8,881 ———— ————
Dividends paid 21,746 18,025 ———— ————
Proposed for approval by shareholders at the AGM (not recognised as a liability at 30 December 2012 or 25 December 2011)
Final dividend for 2012: 7.90p (2011 6.80p) 12,890 10,980
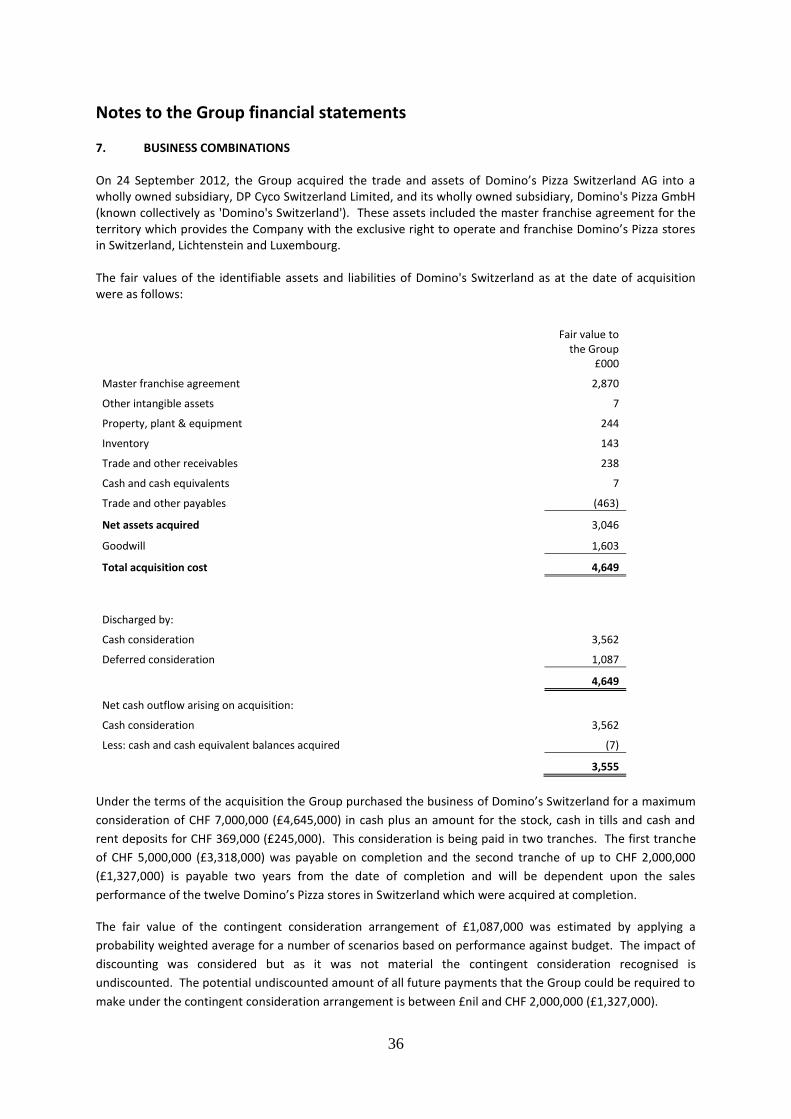
36
Notes to the Group financial statements 7. BUSINESS COMBINATIONS On 24 September 2012, the Group acquired the trade and assets of Domino’s Pizza Switzerland AG into a wholly owned subsidiary, DP Cyco Switzerland Limited, and its wholly owned subsidiary, Domino's Pizza GmbH (known collectively as 'Domino's Switzerland'). These assets included the master franchise agreement for the territory which provides the Company with the exclusive right to operate and franchise Domino’s Pizza stores in Switzerland, Lichtenstein and Luxembourg. The fair values of the identifiable assets and liabilities of Domino's Switzerland as at the date of acquisition were as follows:
Fair value to the Group
£000
Master franchise agreement
2,870
Other intangible assets
7
Property, plant & equipment
244
Inventory
143
Trade and other receivables
238
Cash and cash equivalents
7
Trade and other payables
(463)
Net assets acquired
3,046
Goodwill
1,603
Total acquisition cost
4,649
Discharged by:
Cash consideration
3,562
Deferred consideration
1,087
4,649
Net cash outflow arising on acquisition: Cash consideration
3,562
Less: cash and cash equivalent balances acquired
(7)
3,555
Under the terms of the acquisition the Group purchased the business of Domino’s Switzerland for a maximum
consideration of CHF 7,000,000 (£4,645,000) in cash plus an amount for the stock, cash in tills and cash and
rent deposits for CHF 369,000 (£245,000). This consideration is being paid in two tranches. The first tranche
of CHF 5,000,000 (£3,318,000) was payable on completion and the second tranche of up to CHF 2,000,000
(£1,327,000) is payable two years from the date of completion and will be dependent upon the sales
performance of the twelve Domino’s Pizza stores in Switzerland which were acquired at completion.
The fair value of the contingent consideration arrangement of £1,087,000 was estimated by applying a
probability weighted average for a number of scenarios based on performance against budget. The impact of
discounting was considered but as it was not material the contingent consideration recognised is
undiscounted. The potential undiscounted amount of all future payments that the Group could be required to
make under the contingent consideration arrangement is between £nil and CHF 2,000,000 (£1,327,000).
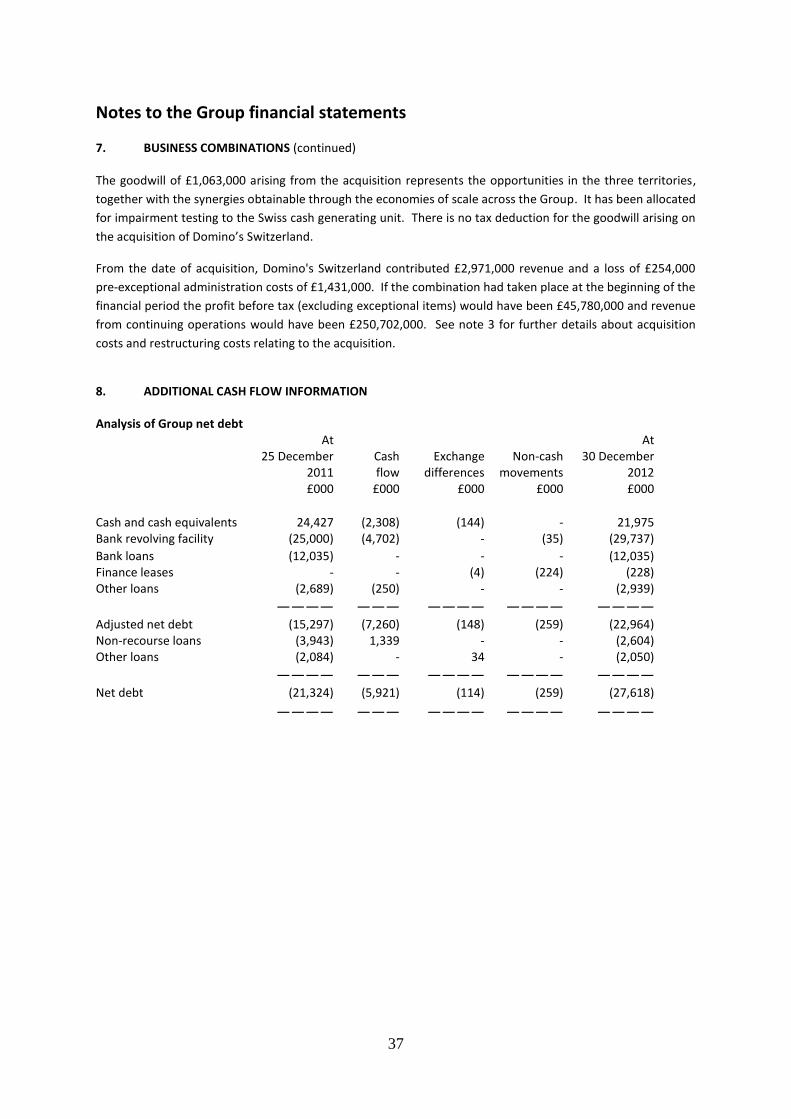
37
Notes to the Group financial statements 7. BUSINESS COMBINATIONS (continued) The goodwill of £1,063,000 arising from the acquisition represents the opportunities in the three territories,
together with the synergies obtainable through the economies of scale across the Group. It has been allocated
for impairment testing to the Swiss cash generating unit. There is no tax deduction for the goodwill arising on
the acquisition of Domino’s Switzerland.
From the date of acquisition, Domino's Switzerland contributed £2,971,000 revenue and a loss of £254,000
pre-exceptional administration costs of £1,431,000. If the combination had taken place at the beginning of the
financial period the profit before tax (excluding exceptional items) would have been £45,780,000 and revenue
from continuing operations would have been £250,702,000. See note 3 for further details about acquisition
costs and restructuring costs relating to the acquisition.
8. ADDITIONAL CASH FLOW INFORMATION Analysis of Group net debt At At 25 December Cash Exchange Non-cash 30 December 2011 flow differences movements 2012 £000 £000 £000 £000 £000 Cash and cash equivalents 24,427 (2,308) (144) - 21,975 Bank revolving facility (25,000) (4,702) - (35) (29,737)
Bank loans (12,035) - - - (12,035) Finance leases - - (4) (224) (228) Other loans (2,689) (250) - - (2,939) ———— ——— ———— ———— ———— Adjusted net debt (15,297) (7,260) (148) (259) (22,964) Non-recourse loans (3,943) 1,339 - - (2,604) Other loans (2,084) - 34 - (2,050) ———— ——— ———— ———— ———— Net debt (21,324) (5,921) (114) (259) (27,618)
———— ——— ———— ———— ————