Embed Size (px)
Citation preview
Domino’s Pizza Investor Presentation
Cowen and Company
7th Annual Consumer Conference
January 12, 2009
2
Forward-Looking Statements
This presentation and our accompanying comments include “forward-looking statements.”
These statements relate to future events or our future financial performance and are subject
to known and unknown risks, uncertainties and other factors that may cause our actual
results, levels of activity, performance or achievements to differ materially from those
expressed or implied by these forward-looking statements This presentation and our
accompanying comments do not purport to identify the risks inherent in an investment in
Domino’s Pizza and factors that could cause actual results to differ materially from those
expressed or implied in the forward-looking statements, include but are not limited to those
risk factors identified in Domino’s Pizza, Inc.’s Annual Report on Form10-K for the fiscal year
ended December 30, 2007, as well as other SEC reports filed by Domino’s Pizza, Inc. from
time to time. Although we believe that the expectations reflected in the forward-looking
statements are based upon reasonable estimates and assumptions, we cannot guarantee
future results, levels of activity, performance or achievements. We caution you not to place
undue reliance on forward-looking statements, which reflect our estimates and assumptions
and speak only as of the date of this presentation. We undertake no obligation to update the
forward-looking statements to reflect subsequent events or circumstances In light of the
above, you are urged to review the disclosures contained in the Domino’s Pizza, Inc. SEC
reports, including the risk factors contained therein.
This presentation contains trade names, trademarks and service marks of other companies.
We do not intend our use or display of other parties’ trade names, trademarks and service
marks to imply a relationship with, or endorsement or sponsorship of, these other parties.
Investment Questions for
Any Company in Today’s Environment
1. Is the business foundation strong?
• Business proposition
• Company position
2. Is the company stable?
3. Is the product attractive to consumers?
• Also needs to be affordable
4. Can the business grow?
5. Is the capital structure right for the business?
6. Does the company reward shareholders?3
4
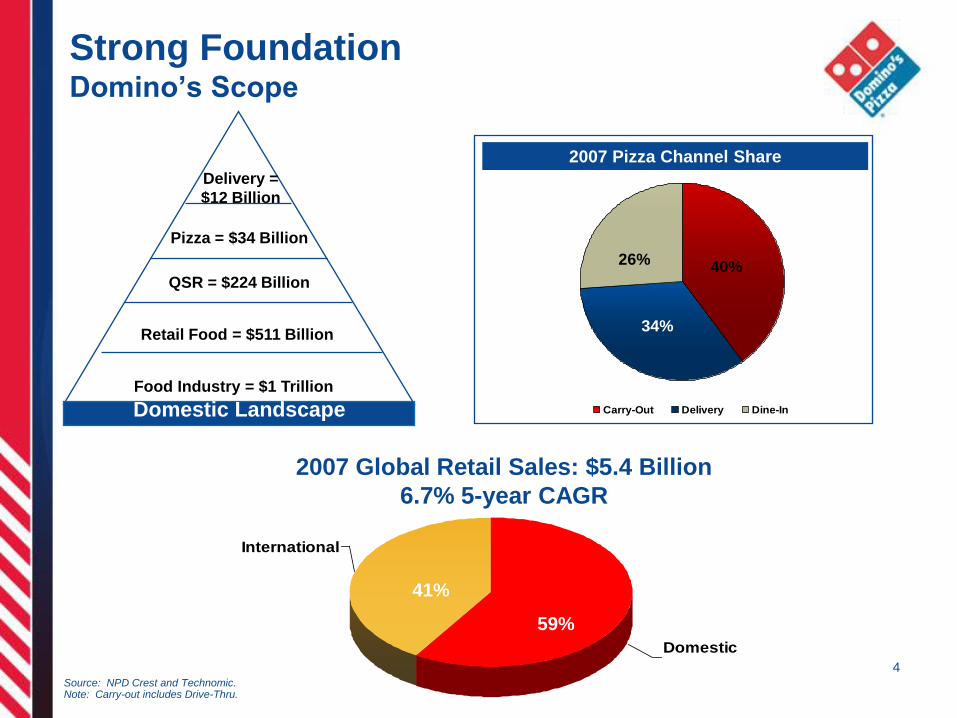
Strong FoundationDomino’s Scope
2007 Global Retail Sales: $5.4 Billion
59%
International
Domestic
2007 Global Retail Sales: $5.4 Billion
6.7% 5-year CAGR
41%
59%
2007 Pizza Channel Share
Carry-Out Delivery Dine-In
34%
40%26%
Delivery =
$12 Billion
Pizza = $34 Billion
QSR = $224 Billion
Retail Food = $511 Billion
Domestic LandscapeFood Industry = $1 Trillion
Source: NPD Crest and Technomic.Note: Carry-out includes Drive-Thru.
5
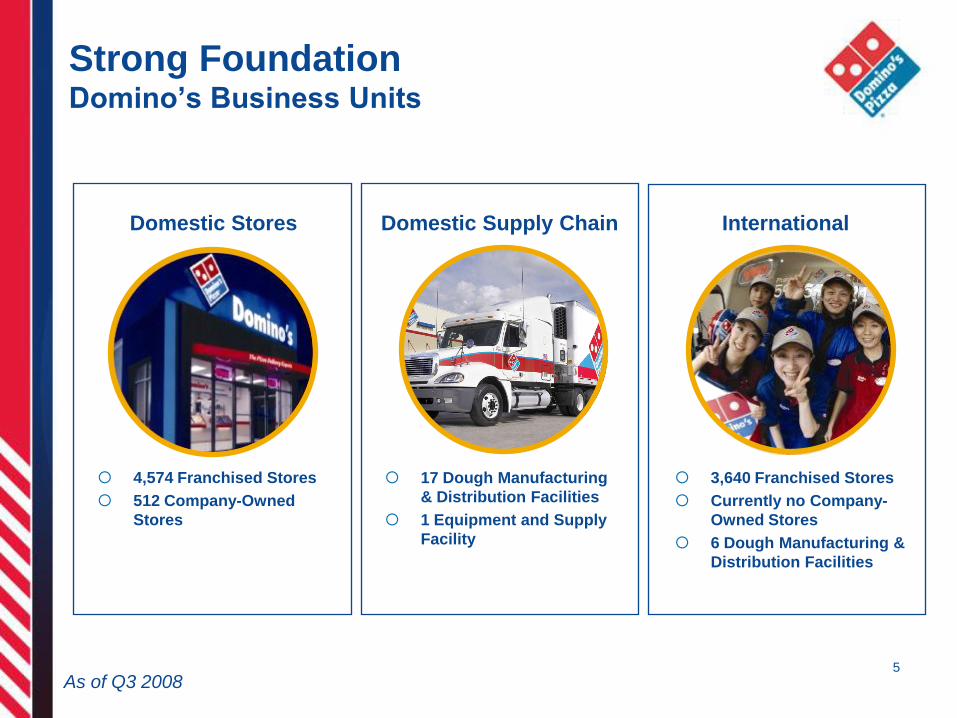
Domestic Stores Domestic Supply Chain International
Strong FoundationDomino’s Business Units
4,574 Franchised Stores
512 Company-Owned
Stores
17 Dough Manufacturing
& Distribution Facilities
1 Equipment and Supply
Facility
3,640 Franchised Stores
Currently no Company-
Owned Stores
6 Dough Manufacturing &
Distribution Facilities
As of Q3 2008
6
Strong FoundationDomino’s Unit Economics
○ Focused and efficient operating model1
• Delivery and carry-out…no dine-in
○ Low cost to open / operate
• $150K - $250K average cost range for new store
– Bargains available for purchase of turnaround stores
• Minimal square footage
• Makeline + oven
○ Steady cash-on-cash returns
Franchise Model Generates Sustainable Returns
¹ Statistics refer to domestic stores only
7
Strong Foundation The Franchise Model
• Franchisees drive Domino’s success
• “No Outside Business Interest” contract clause
– “Have to win with Domino’s Pizza”
• Down cycles as an opportunity to strengthen the system
• During the “perfect storm,” we experienced only nine
Chapter 11 bankruptcy proceedings in our franchise system¹
• Business model still works
– 70 new franchisees in the system through Q3 2008 (vs. 93 for FY
2007)
¹ Domino’s Franchise Service data November 2007 – January 2009
8
Stable Business
Proven 48-Year History
Strong and Consistent Cash Flow Generator
Able to Handle Leverage
Domino’s is a powerful global brand
#1 pizza delivery company in the U.S.
Strong and proven business model with superior returns
Large and growing international presence
Profitable, value-added supply chain
Experienced management team with proven track record
Stock is a value!
9
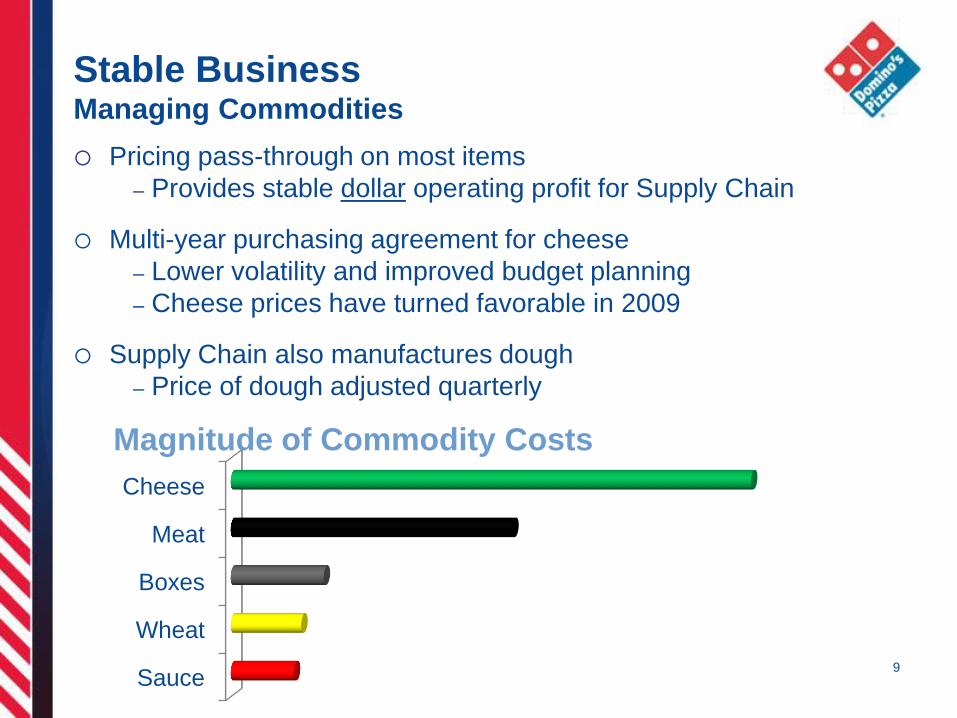
Stable Business Managing Commodities
Pricing pass-through on most items
– Provides stable dollar operating profit for Supply Chain
Multi-year purchasing agreement for cheese
– Lower volatility and improved budget planning
– Cheese prices have turned favorable in 2009
Supply Chain also manufactures dough
– Price of dough adjusted quarterly
Magnitude of Commodity Costs
Cheese
Meat
Boxes
Wheat
Sauce
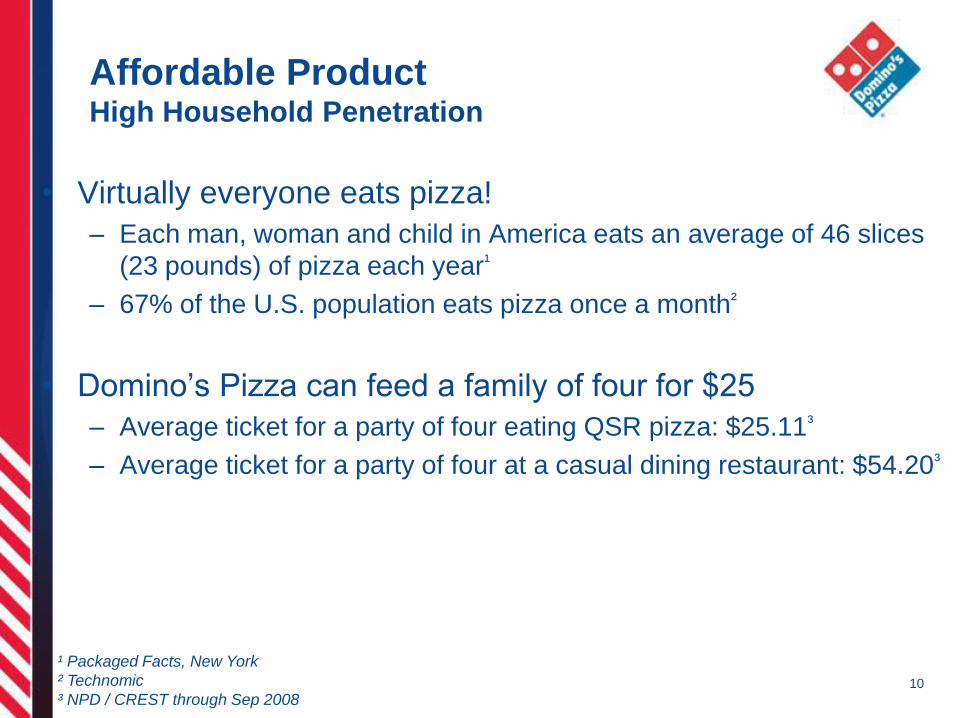
Affordable Product High Household Penetration
• Virtually everyone eats pizza!
– Each man, woman and child in America eats an average of 46 slices
(23 pounds) of pizza each year¹
– 67% of the U.S. population eats pizza once a month²
• Domino’s Pizza can feed a family of four for $25
– Average ticket for a party of four eating QSR pizza: $25.11³
– Average ticket for a party of four at a casual dining restaurant: $54.20³
10
¹ Packaged Facts, New York
² Technomic
³ NPD / CREST through Sep 2008
11
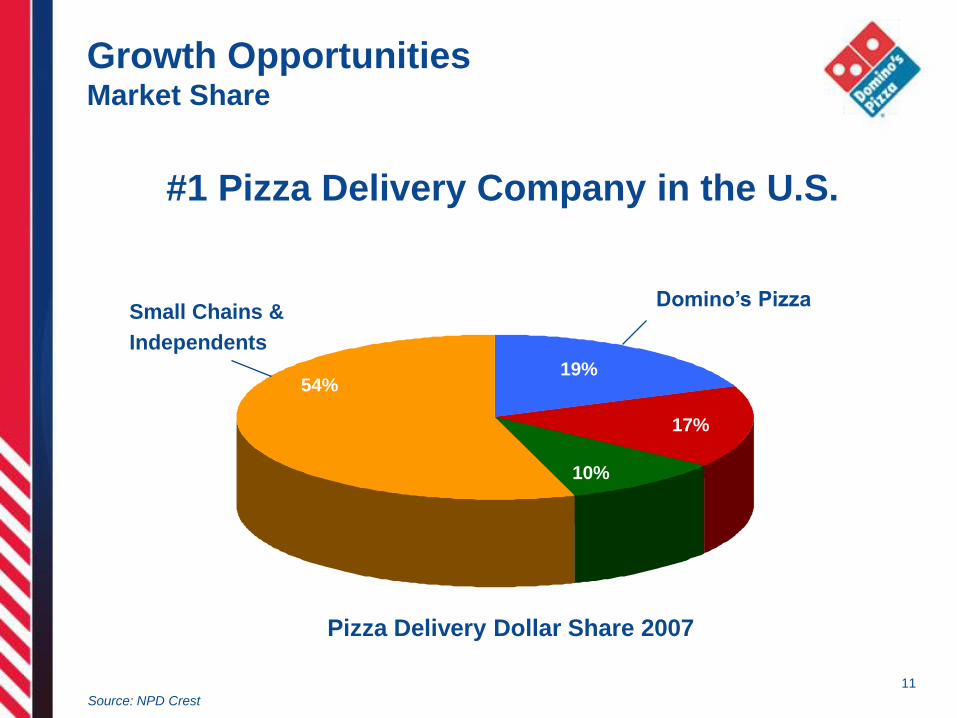
Pizza Delivery Dollar Share 2007
19%
17%
10%
54%
#1 Pizza Delivery Company in the U.S.
Still Room to Grow
Domino’s PizzaSmall Chains &
Independents
Source: NPD Crest 11
Pizza Delivery Dollar Share 2007
19%
17%
10%
54%
Growth Opportunities Market Share
#1 Pizza Delivery Company in the U.S.
Domino’s PizzaSmall Chains &
Independents
Source: NPD Crest
12
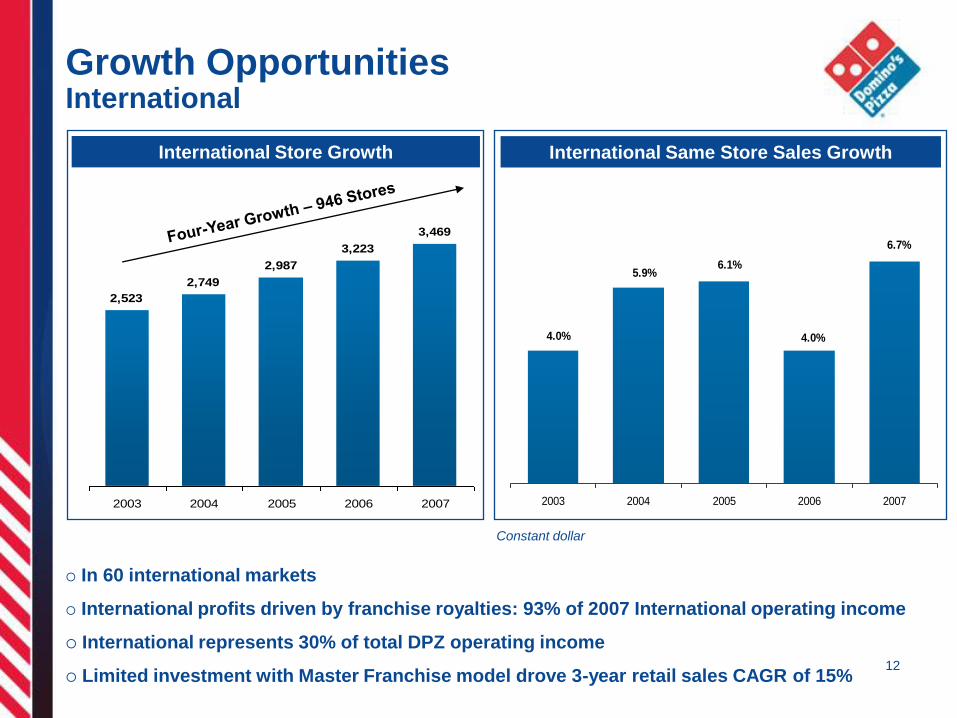
Growth OpportunitiesInternational
In 60 international markets
International profits driven by franchise royalties: 93% of 2007 International operating income
International represents 30% of total DPZ operating income
Limited investment with Master Franchise model drove 3-year retail sales CAGR of 15%
2,523
2,749
2,987
3,223
3,469
2003 2004 2005 2006 2007
4.0%
5.9%6.1%
4.0%
6.7%
2003 2004 2005 2006 2007
International Store Growth International Same Store Sales Growth
Constant dollar
13
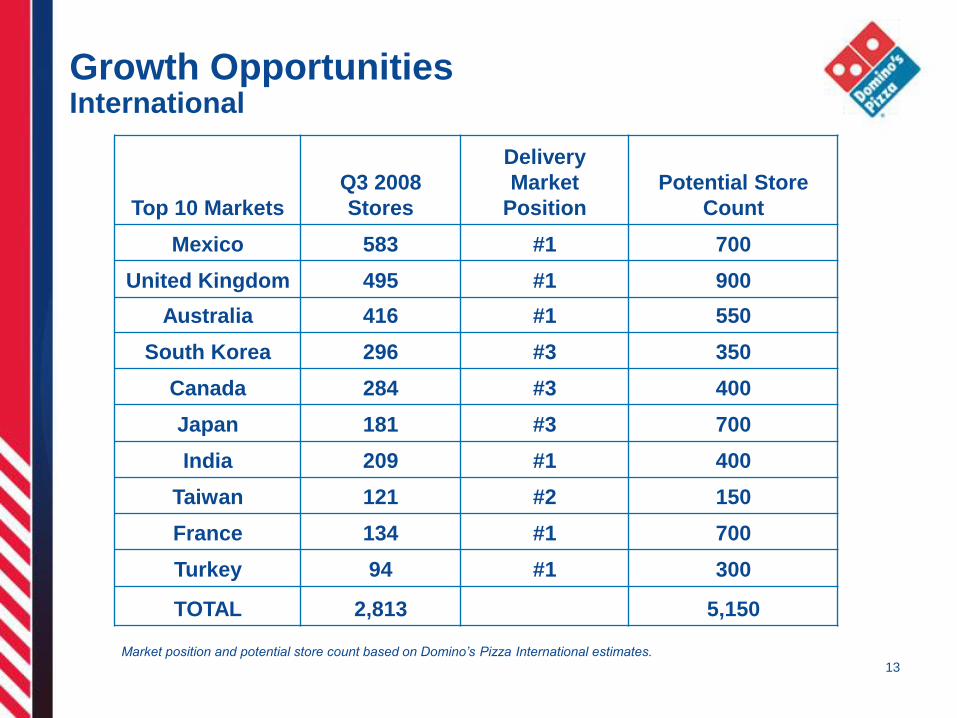
Growth OpportunitiesInternational
Market position and potential store count based on Domino’s Pizza International estimates.
Top 10 Markets
Q3 2008
Stores
Delivery
Market
Position
Potential Store
Count
Mexico 583 #1 700
United Kingdom 495 #1 900
Australia 416 #1 550
South Korea 296 #3 350
Canada 284 #3 400
Japan 181 #3 700
India 209 #1 400
Taiwan 121 #2 150
France 134 #1 700
Turkey 94 #1 300
TOTAL 2,813 5,150
Domestic Growth Opportunities…
• Traffic growth is key – bring excitement back to
Domino’s Pizza
– Sustainable, organic growth
– Today’s traffic = tomorrow’s same-store sales results
• Product platforms, not “product-of-the-month”
– LTOs don’t drive sustained traffic
– Day part expansion
• Timely consumer insight and strategic response
– Delivery charge “management”
– Flexible pricing model (“barbell”)
– Menu strategy
14
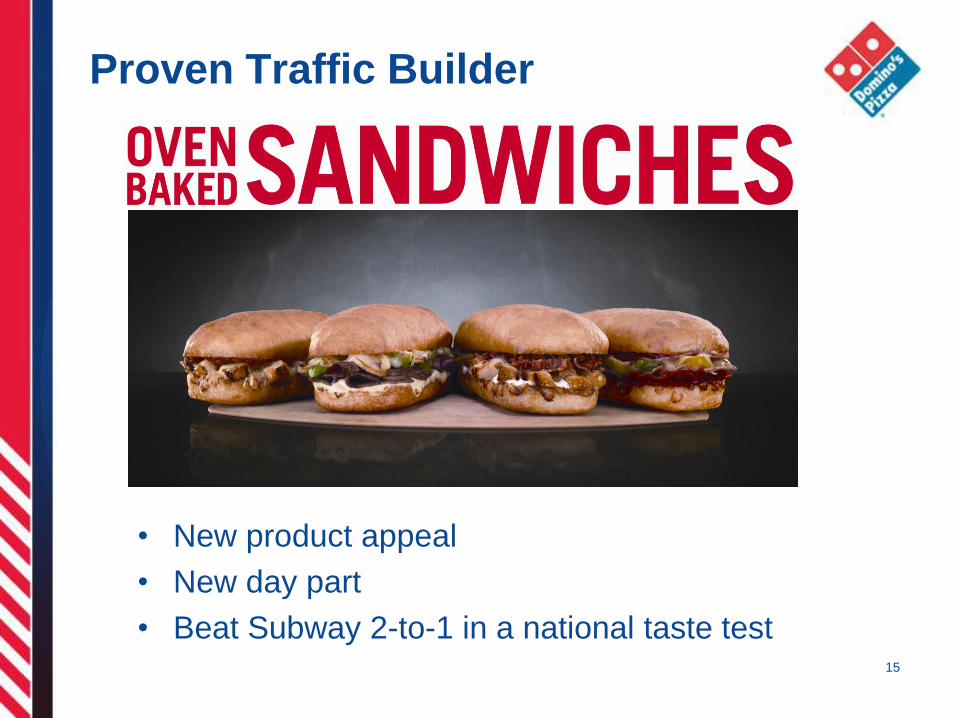
Proven Traffic Builder
• New product appeal
• New day part
• Beat Subway 2-to-1 in a national taste test 15
16
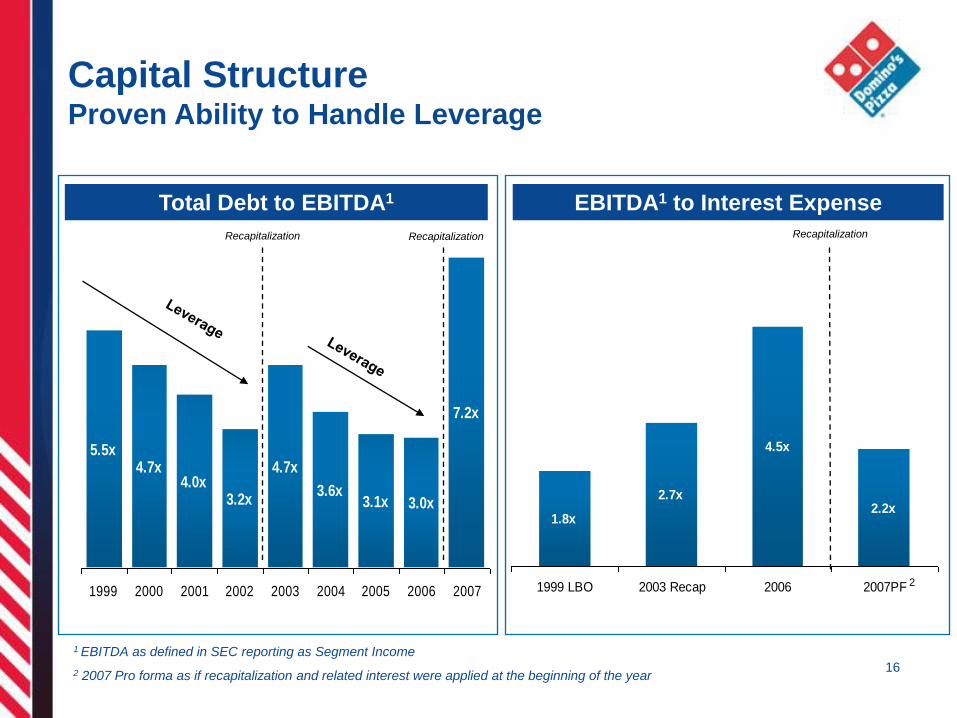
Capital Structure Proven Ability to Handle Leverage
5.5x4.7x
4.0x3.2x
4.7x
3.6x3.1x 3.0x
7.2x
1999 2000 2001 2002 2003 2004 2005 2006 2007
1.8x
2.7x
4.5x
2.2x
1999 LBO 2003 Recap 2006 2007PF
1 EBITDA as defined in SEC reporting as Segment Income
2 2007 Pro forma as if recapitalization and related interest were applied at the beginning of the year
2
Total Debt to EBITDA1 EBITDA1 to Interest Expense
RecapitalizationRecapitalizationRecapitalization
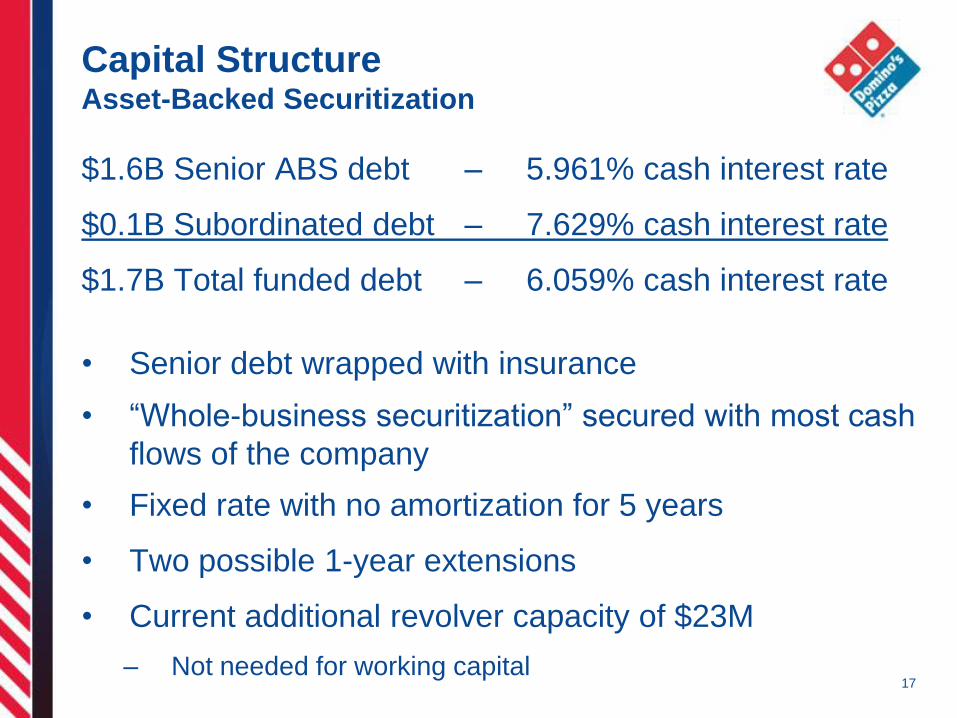
Capital StructureAsset-Backed Securitization
$1.6B Senior ABS debt – 5.961% cash interest rate
$0.1B Subordinated debt – 7.629% cash interest rate
$1.7B Total funded debt – 6.059% cash interest rate
• Senior debt wrapped with insurance
• “Whole-business securitization” secured with most cash
flows of the company
• Fixed rate with no amortization for 5 years
• Two possible 1-year extensions
• Current additional revolver capacity of $23M
– Not needed for working capital 17
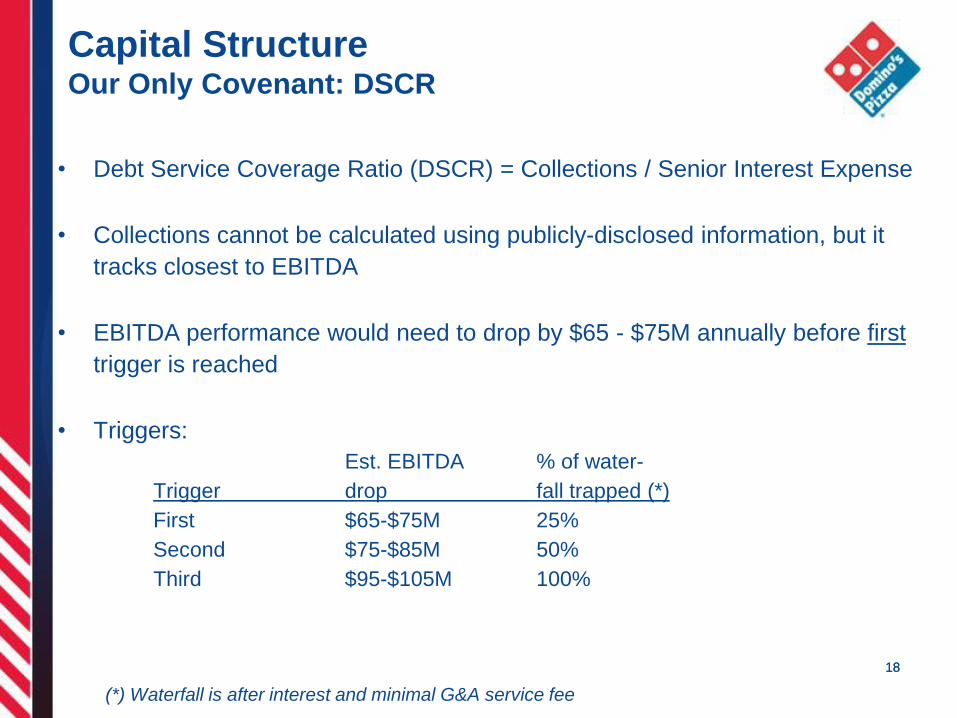
• Debt Service Coverage Ratio (DSCR) = Collections / Senior Interest Expense
• Collections cannot be calculated using publicly-disclosed information, but it
tracks closest to EBITDA
• EBITDA performance would need to drop by $65 - $75M annually before first
trigger is reached
• Triggers:
Est. EBITDA % of water-
Trigger drop fall trapped (*)
First $65-$75M 25%
Second $75-$85M 50%
Third $95-$105M 100%
(*) Waterfall is after interest and minimal G&A service fee
1818
Capital StructureOur Only Covenant: DSCR
19
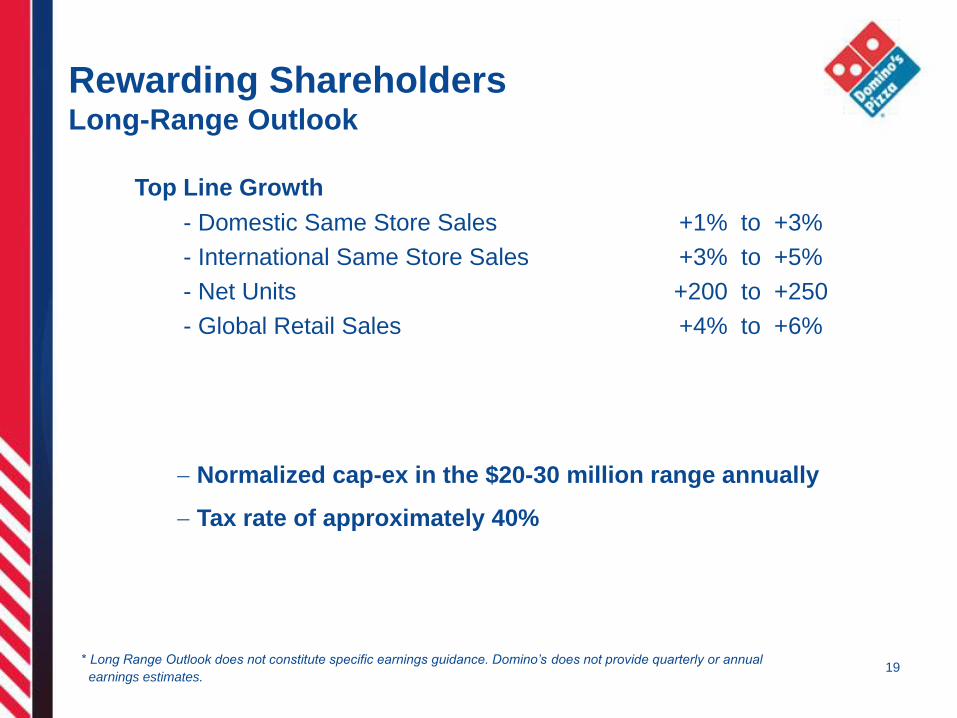
Rewarding ShareholdersLong-Range Outlook
Top Line Growth
- Domestic Same Store Sales +1% to +3%
- International Same Store Sales +3% to +5%
- Net Units +200 to +250
- Global Retail Sales +4% to +6%
* Long Range Outlook does not constitute specific earnings guidance. Domino’s does not provide quarterly or annual
earnings estimates.
Normalized cap-ex in the $20-30 million range annually
Tax rate of approximately 40%
20
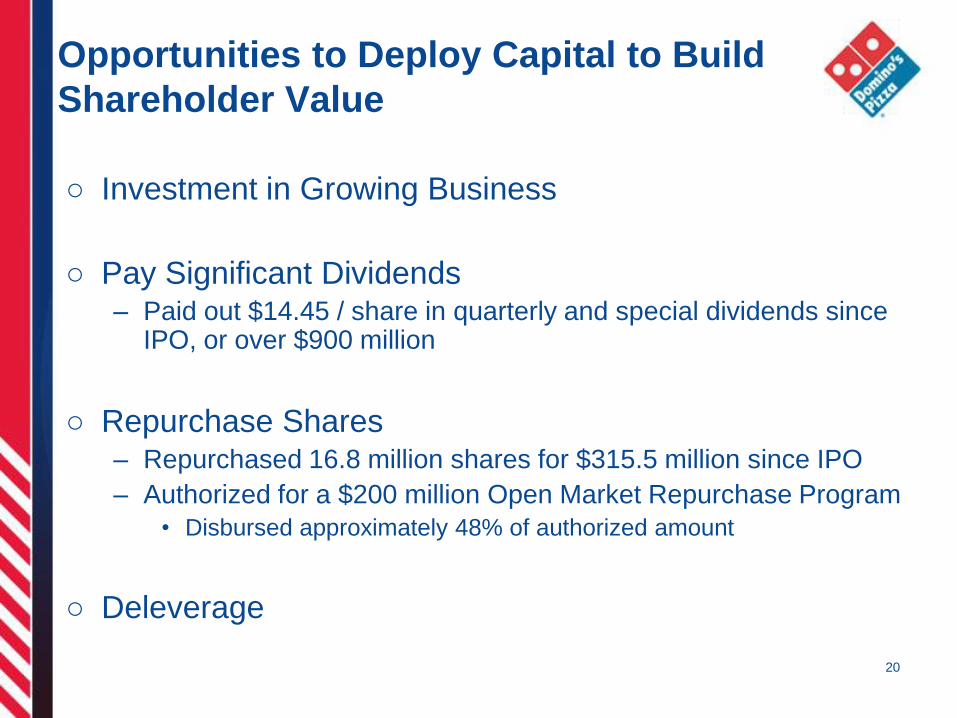
Opportunities to Deploy Capital to Build
Shareholder Value
○ Investment in Growing Business
○ Pay Significant Dividends– Paid out $14.45 / share in quarterly and special dividends since
IPO, or over $900 million
○ Repurchase Shares– Repurchased 16.8 million shares for $315.5 million since IPO
– Authorized for a $200 million Open Market Repurchase Program
• Disbursed approximately 48% of authorized amount
○ Deleverage
Domino’s Pizza
Thank you!