Embed Size (px)
Citation preview

NATIONAL CENTRE FOR SOCIAL SCIENCES AND HUMANITIES
NATIONAL HUMAN DEVELOPMENT REPORT 2001Doi Moi and Human Development in Viet Nam
THE POLITICAL PUBLISHING HOUSEHANOI, 2001
This Report has been produced by a team of Vietnamese socio-economic researchersunder the leadership and coordination of the National Centre for Social Sciences andHumanities with the support of UNDP Viet Nam. All analysis, assessments and policyrecommendations in this Report are those of individual authors who participated in itspreparation and do not necessarily reflect the views of the Government of Viet Nam, theUNDP Viet Nam or the National Centre for Social Sciences and Humanities.

When declaring the birth of theDemocratic Republic of VietNam on 2 September 1945,
while the country was surrounded by dif-ferent kinds of enemies, includingfamine, ignorance and foreign invaders,President Ho Chi Minh solemnly statedthat the rights to live and pursue happi-ness were fundamental, supreme andinalienable rights of every individual andevery nation. He also affirmed to theworld that these were also the ultimategoals for every action of the entireVietnamese people and the young State ofthe Democratic Republic of Viet Nam.
President Ho Chi Minh's declarationwas a quintessence of the nation's humani-tarian tradition forged throughout its thou-sands year old history of national defenceand construction. It was also a combinationof the human being's permanent value andViet Nam's cultural tradition: developmentfor people, by people and of people.
Viet Nam's Doi moi reform process dur-ing the last twenty years is a coherent con-tinuation of that philosophy of develop-ment of the nation and human beings. Bychanging the country's economic mecha-nism, pursuing an open-door policy andengaging the country in proactive interna-tional economic integration, the Doi moiprocess has opened up a new space of verypromising development for the entireVietnamese people. Within that new space,increasingly diverse development opportu-nities are generated; conditions for takingthese opportunities are continuouslyimproved; the country's identity and its
own choices are combined with and inte-grated into the human beings' cultural val-ues and intellectual quintessence.Therefore, among the great achievementsgenerated by the Doi moi process, the mostremarkable ones are, ultimately, thoserelated to human development.
After only a very short period of Doimoi, Viet Nam quickly escaped crisis andentered the orbit of fast and sustainableeconomic growth. The number of peoplestill living in poverty has quicklydecreased. The people's cultural and spiri-tual life has been clearly improved. Everyindividual can access more easily develop-ment opportunities and fully and better par-ticipate in the policy making and imple-mentation process. The State and varioussocial organizations share with the peopleresponsibilities and obligations for nation-al development with increasingly strength-ened mutual trust. The expansion of inter-national relations has increased the world'sunderstanding of Viet Nam, and hence wecan better share each other's developmentachievements. The above outcomes of thecountry's chosen development path in thepresent times truly reflect the socialist ori-entation of the Doi moi process. We cansay with great self-confidence that Doi moiis Viet Nam's right choice.
The Doi moi process has generated anew position and strength for the country'sdevelopment and thus helped better andfully perform tasks in support of humandevelopment. However, it should be clear-ly recognized that the country is nowentering a new stage of development. In a
iiiFOREWORD
Foreword
world of economic globalization and tran-sition to a knowledge-based economy, VietNam is increasingly exposed to emergingopportunities and challenges. In this con-text, the promotion of the whole nation'sstrengths, further reform, proactive inter-national economic integration and furtheracceleration of the country's industrializa-tion and modernization are crucial toimproving the quality of human develop-ment in Viet Nam.
The National Human DevelopmentReport 2001 of Viet Nam, which is the firstever Vietnamese-produced report of thistype, addresses, in a systematic, fairly
comprehensive and in-depth manner, thepresent most fundamental human develop-ment issues in Viet Nam. I hope andbelieve that this Report is a good beginningand reminds all of us of the tasks in supportof human development in Viet Nam asmentioned in the political document of theNinth Communist Party Congress.
I, hereby, have the great pleasure ofintroducing the National HumanDevelopment Report 2001 of Viet Nam toall domestic and international readers andto all those who are making joint efforts forthe sake of Human Development.
iv NATIONAL HUMAN DEVELOPMENT REPORT 2001
PHAN VAN KHAIPrime Minister of the Government
Socialist Republic of Viet Nam

Throughout its history of nationaldefence and construction, VietNam's Communist Party and
Government have always affirmed thatpeople are placed at the center of develop-ment and that people are both an objectiveand an engine of development. This philos-ophy was again emphasized and specifiedat the Ninth National Communist PartyCongress as: "Significantly increasing ourcountry's Human Development Index(HDI)" and "Dramatically improving thequality of the material, cultural and spiritu-al life in a safe and healthy social environ-ment; protecting and improving the naturalenvironment".
In order to provide readers with usefulinformation and reference literature aboutDoi moi and human development in VietNam over the last five decades, theNational Political publishing House, in col-laboration with the National Center forSocial Sciences and Humanities, publishes"National Human Development Report2001 - Doi Moi and Human Developmentin Viet Nam".
This Report focuses on human devel-opment achievements obtained so farthrough the Doi moi reform process in VietNam. Besides the achievements, theReport also indicates serious challengeswhich Viet Nam will be facing and taskswhich will continue to be performed in thefurther reform process for the goal ofhuman development. This is the firstreport that presents Viet Nam's basichuman development indices such as HDI,HPI and GDI for all 61 provinces andcities of the country.
As the Report covers a broad theme,requires a lot of inter-agency collaborationand has been prepared on the basis of lim-ited capacity and experience, shortcomingsare unavoidable. We wish to receive read-ers' comments and suggestions for futureimprovements.
By providing new information andapproaches, the Report is expected to serveas a useful reference material on the coun-try's present development issues.
We have great pleasure of introducingthis publication to readers.
vNOTE BY PUBLISHER
Note by Publisher
Ha Noi, November 2001NATIONAL POLITICAL PUBLISHING HOUSE

vi NATIONAL HUMAN DEVELOPMENT REPORT 2001

viiFOREWORD
The history of humankind is a historyof development in which the goal ofachieving a meaningful, free and
wealthier life has been pursued by all gen-erations. While this noble goal has beencommonly shared and pursued, the waypeople think about development, and thepriorities and objectives they set for them-selves, have often been different acrosstime and space.
During the last 50 years, developmenthas become a real opportunity for manycountries and nations around the world.Enjoying the fruits of independence, manyless developed and formerly dependentcountries placed a heavy emphasis on andstrived for rapid economic growth withhigh hope that this would help them toquickly overcome underdevelopment sta-tus. Economic growth was considered as akey to development. With such a viewdominating development thinking for aquite long time, the ultimate objective ofdevelopment, improving the well-being ofpeople, has sometimes been overlooked. Inmany cases, the human being and its capa-bilities have been considered as merely afactor of production for economic growth.The social aspects of development wereinadequately taken into account, and theresponses were often limited to redistribu-tion of some income supported by the pub-lic sector. Inequality and poverty amongsome segments of the population, were fre-quently considered as necessary costs thatneed to be borne for the sake of economicgrowth and development.
In more recent times, it has been recog-nised that such a limited view of develop-ment did more harm than good to the sus-tainable development process. Hence, anew, more systematic and human approach
to development, viewing it as “a process ofenlarging people’s choices and capabilitiesto live a longer, healthier, wealthier andmore meaningful life" has emerged andbeen widely accepted. Human develop-ment thinking that places people at the cen-tre of development was re-discovered. Thisnew development thinking has been wellreflected and continuously refined in theglobal Human Development Report pub-lished annually by the United NationDevelopment Programme since 1990.Since its first publication, HumanDevelopment Reports have provided astrong influence on the development policydebate in many fora. The HumanDevelopment Reports present a profoundand comprehensive analysis on opportuni-ties and challenges facing the process ofhuman development, stimulating policydebate and offering policy recommenda-tions for both global and national actions.
Following the visible success of theglobal Human Development Reports,many countries have published their ownNational Human Development Reports(NHDRs) in cooperation and with supportof UNDP. Up to 2001, there were morethan 350 reports that have been produced atthe national, sub-national and regionallevel by more than 130 countries and terri-tories. With their richness in subjects, con-tents and analysis touching upon pressingdevelopment issues, National HumanDevelopment Reports have provided sig-nificant contributions to the discussion ofdevelopment policies, while improvingpeople's awareness and their participationin the development process. The humandevelopment index (HDI) system devel-oped and refined by UNDP has made asignificant contribution to the development
Message from NHDR SteeringCommittee Chairperson
policy debate, helping clarify developmentpriorities, and enabling monitoring of thedevelopment process at both the national aswell as international level.
The process of making a firstVietnamese produced National HumanDevelopment Report started in Viet Namtwo years ago when UNDP officially con-sulted with the Vietnamese Government onthe scope for such an initiative. TheNational Center for Social Sciences andHumanities had been given the great honorof being designated the focal point andcoordinator of this activity. Support,advice, suggestions, comments have gener-ously been given to the National Team dur-ing this challenging preparation process.
The theme of this report is "Doi moi(renovation) and Human Development inVietnam". The choice is simple because,doi moi has brought about significantchanges to the country and marked a newstage in its development. The report high-lights the great achievements in humandevelopment that doi moi has produced.The report asserts that doi moi is, in fact aprocess of expanding choices and furtherdeveloping capabilities of the people in alleconomic, social, cultural activities for awealthier, healthier, more knowledgeableand meaningful life. Doi moi also empow-ers people, providing them better opportu-nity to widely participate in the process offormulating and implementing develop-ment policy. All this has resulted inimpressive and widely recognised achieve-ments in all aspects.
Nevertheless, the way ahead for VietNam is full of challenges. The Report triesto reveal these major challenges in light ofthe rapidly changing globalization processand in the era of technological and scientif-ic achievements (especially informationtechnology and the knowledge economy).Further reducing poverty and eliminatinghunger, ensuring decent employment formillions of people, international economicintegration, environmental protection, andsocio-political stability, will all be essentialfor further improving the livelihoods of allthe people.
For the first time, the Report attempts tomeasure key basic human developmentindices such as HDI, HPI (Human PovertyIndex), GDI (Gender Development Index)for all 61 provinces and cities in the coun-try. The results represent a significantachievement, especially given the seriouslack of available data and their consistency.
Since this is the first nationally ledNational Human Development, which hashad the rather difficult task of analyzingthe country's multifaceted, multi-discipli-nary development situation, one cannotexpect the Report to address all pressingdevelopment issues that face this countryin full length and great depth. Neitherevery aspect of development has beentaken into consideration, nor can it beexpected that every single conclusion inthe Report be unanimously shared. We canonly hope that many of these issues will beanalyzed in greater depth in future nationalhuman development reports.
viii NATIONAL HUMAN DEVELOPMENT REPORT 2001
Hanoi November 2001
PROFESSOR DO HOAI NAMVice-Director of the National Centre for Social
Sciences and Humanities, andChairman of the Steering Committee for National
Human Development Report

O n behalf of UNDP, I am verypleased to share with you VietNam's first nationally-led and
produced Human Development Report.It presents an insightful and comprehen-sive account of the country's on-goingreform process in a globalizing world.While the spirit and philosophy of theglobal Human Development Reportsprovided the overall framework to thisReport, the national drafting teamensured that the substance and method-ology were tailored to the Vietnameserealities.
The concept of human development,discussed at length in this report, was thesubject of numerous extensive discus-sions. Many senior Vietnamese warmedto a conceptualisation of developmentthat embraced more than just the maxi-mization of economic growth. Clearly,human development fits well with thearticles in Viet Nam's Declaration ofIndependence, the teachings of Ho ChiMinh, and the "socialist market orienta-tion" of modern Viet Nam. Today, VietNam strives for "a rich people, a strongnation, and an equal and civilised soci-ety", which, as with human development,is a vision that puts people first.
Human development is not simply atechnical challenge with technical solu-tions. Human development involves deepand profound changes to institutionaland governance structures, and there-fore requires broad-based awareness
and popular support. Thus, only aHuman Development Report and strate-gy that is nationally-led and nationally-formulated with broad-based participa-tion can be expected to be truly effective.
For these reasons, this Report adopt-ed the principle of "national ownership"from the very outset. UNDP was a part-ner in producing this report, but it wastruly a minority partner. Foreign inputshave been minimal; advisory and editor-ial. It has been a challenging learningand capacity building experience for allconcerned. But it has also been essentialto produce something that is read andextensively discussed in Viet Nam toensure lasting impact. This approach setsthe tone for future human developmentresearch in Viet Nam, which we are keento support.
Although, in many ways the processof producing this report has been moreimportant than the product, I am con-vinced that you will find this report ofgreat interest. From a typicallyVietnamese perspective, it highlights theachievements of the past, analyzes thechallenges of the future, and proposes awide range of concrete policy measuresto further enlarge all people's capabili-ties and choices. For the first time, it pre-sents human development indices for allprovinces in Viet Nam, which provideuseful insights to the geographic dispari-ties in human development within thecountry. These provincial indices also
ixMESSAGE FROM UNDP VIET NAM
Message from UNDP Viet Nam
provide interesting benchmarks againstwhich future progress and policy impactshould be measured.
This abridged English translation,which is based upon the much fullerVietnamese version, has been preparedto serve the English reader. I wish to
greatly thank all those who have provid-ed ideas, inspiration and put in hardwork during the exciting and demandingpreparation of the Viet Nam HumanDevelopment Report 2001.
x NATIONAL HUMAN DEVELOPMENT REPORT 2001
EDOUARD A.WATTEZResident Representative
UNDP Viet Nam

The Making of the First Nationally-ledHuman Development Report Viet Nam
This is the first Vietnamese-led and - produced Human Development Report on Viet Nam, prepared by a
broad group of independent national specialists, and sponsored and supported by the United Nations
Development Programme (UNDP). The preparation of the Report has had an impact which goes far beyond
the Report itself, since it has substantially contributed to capacity-building, institutional strengthening, data
collection and upstream policy advice.
The preparatory process started in Spring 1999, when, after comparing mandates and capacities, the
National Centre for Social Sciences and Humanities (NCSSH) was selected as the executing agency for
the mission. A few months later, the Prime Minister gave Government approval to prepare the first nation-
ally-led Human Development Report and officially designated NCSSH to be focal point for the project.
In the late Autumn of 1999, the project officially started when NCSSH and UNDP signed an official
Memorandum of Understanding. This has meanwhile led to the establishment of a special Human
Research Institute. A Steering Committee was set up, consisting of representatives from key Government
agencies, to advise on and help guide the preparation process. At the same time, an NHDR research and
drafting team was assembled, while the data gathering for the calculation of human development indices
for all provinces in Viet Nam started. A number of international human development publications, includ-
ing the global HDR 1999 on globalization, were translated into Vietnamese and widely disseminated. To
facilitate the research, UNDP provided the initial analytical and policy framework for analyzing and
assessing the doi moi reform process in terms of its contribution to expanding choices to improve peo-
ple's overall well-being in Viet Nam.
Over the subsequent months, fourteen background papers were prepared by national experts and dis-
cussed at a conference on human development and doi moi reforms in March 2000. Among the more than
one hundred participants were many high level officials, including members of the Strategy Preparatory
Group for the new Ten Year Socio-Economic Development Strategy 2001-2010. This has most certainly
contributed to the fact that in the final version of the Strategy, endorsed by the Party Congress in April
2001, “a substantial improvement in Viet Nam’s human development index” is explicitly included as one
of the main goals for the next decade.
Over the next six months, draft chapters were prepared on the basis of working papers and conference
proceedings. The activities included a week-long retreat in Tam Dao of the main authors and a subsequent
workshop on globalization, which was becoming a topic of intense debate in Viet Nam. Towards the end
of the year 2000, the composition of the NHDR team was adjusted in order to further enrich the first draft.
On the basis of an extensive round of consensus building, the second version, including a translation into
English, was ready just before the Party Congress. The last few months were used to produce an English
summary report, make final adjustments in the Vietnamese version, and to improve the presentation of the
main findings, including the human development indices. During a concluding workshop on 19 October
2001, some further refinements were proposed and have subsequently been incorporated in the final draft
. The Report will be widely disseminated to encourage discussion and debate.
The intensive preparation of the first nationally-led Human Development Report has brought
researchers together, enhanced the awareness and knowledge of human development issues among policy-
makers, and paves the way for more human development research and advice in the near future.
xiTHE MAKING OF THE FIRST NATIONALLY-LED HUMAN DEVELOPMENT REPORT VIET NAM

xii NATIONAL HUMAN DEVELOPMENT REPORT 2001

xiiiLÚÂI NOÁI ÀÊÌU

This National Human DevelopmentReport is a collective work of manypeople and agencies. We especially
acknowledge the contributions of the fol-lowing contributors:
Members of the Steering Committee
Do Hoai Nam, Deputy Director, NCSSH,Chairman
Nguyen Tam Chien, Deputy Minister,MOFA
Do Nhu Dinh , Deputy Minister, MOTNguyen Huu Dung , Director of Institute
for Labour, MOLISAPhan Hång Giang, Director, Institute of
Culture ResearchPham Manh Hung, Deputy Minister, MOHTao Huu Phung, Deputy Minister, MOFTran Quoc Toan, Deputy Head, OOGNguyen Tan Phat, Deputy Minister, MOETNguyen Van Tien , Vice Director, GSOPhan Quang Trung, Deputy Minister, MPI
Members of the NHDR Team
Nguyen Dinh Cu, Vice Director,Population Centre, NEU
Nguyen Manh Cuong, MOLISAPham Xuan Dai, Institute of Sociology,
NCSSHNguyen Thi Kim Dung, Institute of
EconomicsLe Bach Duong, Institute of Sociology,
NCSSHTran Hun Giang, Centre for Women and
Family StudiesPhi Manh Hong, National University,
Department of Economics
Vu Xuan Nguyet Hong, CIEMVu Quoc Huy, UNDPVu Quang Minh, MOFADang Kim Son, Deputy Director, Policy
Department, MARDNguyen Dinh Tai , CIEMBui Tat Thang, Institute of Economics,
NCSSHNguyen Thang, Institute of Price and
MarketVo Tri Thanh CIEMTran Dinh Thien, Institute of Economics,
NCSSH Dao Quang Vinh , MOLISA
Editorial Board
Do Hoai Nam, Principal EditorVu Quoc HuyVo Tri ThanhTran Dinh Thien
We are also very grateful for the excel-lent service provided by a number of peo-ple in the Supporting Staff includingNguyen Trung Kien, Phan Mai Huong,Nguyen Thi Kim Dung, Nguyen Van Tien,Nguyen Thu Thuy, Ngo Tien Phat. Supportfrom various departments of GeneralStatistical Office, Ministry of Science,Technology and Environment, Ministry ofHealh, Ministry of Labour, Invalids andSocial Issues, Ministry of Education andTraining in sharing information and pro-viding technical advice in dealing with datacollection and processing is highly appre-ciated.
Special thanks also go to FormerDeputy Prime Minister, His Excellency
xiiiACKNOWLEDGEMENTS
Acknowledgements

xiv NATIONAL HUMAN DEVELOPMENT REPORT 2001
Nguyen Khanh, as well as Nguyen DuyQuy, Tran Viet Phuong, Tran Duc Nguyen,Pham Tat Dong, Pham Khoi Nguyen, DaoTrong Thi, Vu Tien Loc, Cao Duc Phat, ,Le Dang Doanh, Vo Dai Luoc, Le DuPhong, Do Minh Cuong, Nguyen Hai Huu,Ha Huy Thanh, Vu Tuan Anh, Chu VanLam and Dang Ba Lam each of who haveprovided invaluable advice on the variousdrafts, as well as guidance and encourage-ment to the Team during the preparationprocess.
Our sincere thanks go to UNDP Hanoi,especially Edouard Wattez, UNDPResident Representative for supporting a
genuinely national NHDR process. Specialthanks also to Robert Glofcheski, UNDPChief Resident Economist for developingthe initial policy and analytical frameworkused to analyze and assess the doi moireform process, and for invaluable adviso-ry support throughout the process. Thanksalso to Adam McCarty and Ernst vanKoesveld who provided valuable supportin editing and refining the summarizedEnglish version. Finally, we would like tothank Tran Dinh Nghiem, Anna Cordony,Khuat Duy Hai, Nguyen Thi Le Huyen,Hoang Thi Tuyet and Dang Huu Cu forgraphics and design work.
ADB Asian Development BankAFTA ASEAN Free Trade AreaAPEC Asia-Pacific Economic CouncilASEAN Association of South-East Asian NationsFDI Foreign Direct InvestmentGDI Gender Development IndexGSO General Statistical OfficeHDI Human Development IndexHEPR Hunger Elimination and Poverty Reduction ProgramH P I Human Poverty IndexI C T Information and Communication TechnologyILO International Labour OrganisationI M F International Monetary FundMOLISA Ministry of Labour, Invalids and Social AffairsM P I Ministry of Planning and InvestmentNCSSH National Centre for Social Sciences and HumanitiesNHDR National Human Development ReportNGO Non-governmental OrganizationPPP Purchasing Power ParitySME Small and Medium EnterprisesSOE State-Owned EnterprisesTNC Transnational CorporationsUNCTAD United Nations' Conference on Trade and DevelopmentUNDP United Nations' Development ProgramVLSS Viet Nam Living Standard SurveyWB World BankW T O World Trade Organization
xvCAÁC TÛÂ VIÏËT TÙÆT
ABBREVIATIONS

xvii
FOREWORD AND INTRODUCTORY MESSAGES
OVERVIEW
CHAPTER 1
The Human Development Perspective1.1 The concept of human development1.2 The human development perspective in Viet Nam1.3 Globalization and human development
CHAPTER 2
The Doi moi Process and Human Development2.1 The doi moi reform process and human development2.2 Doi moi: expanding economic choices and opportunities2.3 Impressive poverty reduction2.4. Human development achievements in social areas
CHAPTER 3
Human Development Challenges3.1 Reducing poverty and maintaining equity3.2 Further economic integration3.3 Reducing unemployment and underemployment3.4 Public investment and public services3.5 Protecting the environment
CHAPTER 4
Deepening the Doi moi Process
HUMAN DEVELOPMENT INDICATORS1. Human Development Index (HDI)2. Human Poverty Index (HPI)3. Gender Development Index (GDI)4. Gender Development5. Demography6. Labour7. Health I8. Health II9. Education I10. Education II11. Economy I
TABLE OF CONTENTS
Table of Contents

xviii NATIONAL HUMAN DEVELOPMENT REPORT 2001
12. Economy II13. Agriculture and Food Security14. Infrastructure
NOTE ON STATISTICAL DATA USED IN THIS REPORT
BIBLIOGRAPHY
LIST OF BOXESBox 1.1 Human Development Rediscovered and RedefinedBox 1.2 : Millenium Development GoalsBox 1.3: Towards Achieving the Human Development Goals in Viet NamBox 1.4: Views on GlobalizationBox 1.5: The Truth about Global InequalityBox 1.6: Trade Liberalization and PovertyBox 1.7 Global Human Development Report 2001: new TechnologiesBox 2.1. On the Human Development Index (HDI)Box 2.2: Life has been Changed for the Better in An GiangBox 2.3 Internal Migration and Urbanization In Viet NamBox 3.1 Viet Nam’s Challenges for the Period 2001-2010Box 3.2: Growth is Good for the Poor, but with Human Face it Can Do BetterBox 3.3: Key Objectives of the Action Plan for the Advancement of Women (2001-2005)Box 3.4 : WWW - Weaving Without Web: the Case of the Garment IndustryBox 3.5: Industrial Policy and WTO RegulationsBox 3.6: Employment in Hai Phong and Quang Ninh: A tale of two CitiesBox 3.7: Processing Industries: Capturing the Value AddedBox 3.8 The Science and Technology Sector in Viet NamBox 3.9 Learning from the Asian Tiger Experience
LIST OF FIGURESFigure 2.1: HDI Ranking and GDP for Selected CountriesFigure 2.2 Poverty Reduction During The 1990sFigure 2.3 Viet Nam’s Human Development ParadoxFigure 2.4 GNP Per Capita and Infant Mortality ComparedFigure 3.1: Widening Gaps? Gini Coefficients by Provinces, 1995-1999Figure 3.2: Economic Growth Rates and InequalityFigure 3.3 Great Disparitites: Provinces in their HDI & GDP rankingsFigure 3.4: Per Capita Expenditure For Education From The State Budget and the Average Income
In Provinces/ Cities (1997-98).Figure 3.5: Per Capita Expenditure For Healthcare from the State Budget and the Average Income in Provinces/
Cities (1997-98)
LIST OF TABLESTable 2.1 Landmark Reform and Achievements During Doi moi.Table 2.2: Viet Nam’s Human Development Index over TimeTable 2.3: HDI Ranking for Selected Countries (1999, out of 162 Countries)Table 2.4: GDP and Employment by Type of OwnershipTable 2.5: HPI Ranking for Selected Countries (1999, out of 90 Developing Countries)Table 2.6 Trends in Education Enrolment Rates, by EthnicityTable 2.7: Proportion of Boys and Girls at School

This Report is about human devel-opment in Viet Nam. It attempts toprovide an insight into Viet Nam’s
development process in its modern histo-ry, especially during the reform processknown as doi moi. The reader will findthat through its process of founding andbuilding the nation, Viet Nam has beentrying to determine and to pursue a devel-opment path that could bring happiness toall of its people. To many Vietnamese,therefore, the concept of human develop-ment as expanding people’s capabilitiesand choices, as developed by the UnitedNations Development Programme(UNDP), is not really new (see chapter 1).Nevertheless, there has sometimes been agap between sound policies and theirpractical implementation, which dimin-ished their positive impact on the well-being of the people.
The doi moi reform process, whichstarted in the mid-eighties, provided a newframework for realizing human develop-ment objectives. As a process of expandingchoices for people to improve their well-being, doi moi brought about significantchanges in the people’s opportunities towork, to learn, and to enjoy a meaningfullife. Farmers were granted more freedomto manage and work the land and to deter-mine what crops to cultivate. Consumersgained better access to markets with widervarieties of goods and services. State-owned producers began facing ‘harderbudget constraints’ but were also allowedgreater autonomy as regards what to pro-duce and to whom to sell. These enlargingchoices and opportunities have unleashed
the energy and creativity of manyVietnamese people, leading to impressivehuman development achievements, notablyin terms of poverty reduction. Chapter 2gives a detailed account of these achieve-ments. The doi moi reform process hasclearly resulted in a substantial improve-ment in the well-being of the vast majorityof Vietnamese people. One of the keylessons that Viet Nam has learned from itsown experience with the doi moi process isthat expanding people’s capabilities andchoices is an effective means for realizingthe country's noble goals of development.
Nevertheless, Viet Nam still faces enor-mous challenges, which form the maintopic of chapter 3. They stem from the real-ity that Viet Nam is undergoing a tripletransformation process: from war to peace,from central planning to a market econo-my, and from isolation and estrangement tointernational integration. Recent new sta-tistical evidence of widening disparitiespresented in chapter 3 suggests that main-taining equity is an emerging new chal-lenge facing the country, and will call forpolicies and institutional changes that fur-ther broaden and deepen people's participa-tion in the development process. In addi-tion, based on a rich new data base ofprovincial level human development indi-cators, chapter 3 also highlights how thehuman development situation variesmarkedly across the country, calling fordifferent policy approaches at the locallevel. While the level of income andhuman development tend to be positivelyrelated across most provinces, there are asignificant number of provinces where a
1OVERVIEW
Overview
As a process of expand-ing choices for people toimprove their well-being,doi moi brought about sig-nificant changes in thepeople’s opportunities towork, to learn, and toenjoy a meaningful life.
Maintaining equity is anemerging new challengefacing the country, andwill call for policies andinstitutional changes thatfurther broaden and deep-en people's participationin the developmentprocess.

relatively high level of human develop-ment has been generated despite a lowlevel of provincial income. Notably, relat-ed statistical evidence appears to suggestthat a given level of provincial income cangenerate a higher rate of return in terms ofhuman development, the more equitable isthe distribution of such income. This mayalso explain why Viet Nam has been ableto generate a higher level of human devel-opment for the nation as a whole than mostother developing countries of similarly lowincomes. Chapter 4 argues that, in light ofexperience and evidence to date, the doimoi process needs to be deepened. Thechapter presents a variety of concrete poli-cy recommendations.
The Concept of Human Development
Chapter 1 starts with a discussion of theessential concepts of the human develop-ment approach, thus laying the conceptualfoundation of the report. The human devel-opment approach has been rediscovered inthe course of the twentieth century and hasbecome increasingly popular over the lastdecade. The essence of the approach is thatit considers income expansion as an impor-tant means to development, but treats anexpansion of human choices as the end ofall development efforts. The most criticalof the wide-ranging choices that peoplemay value, are to live a long and healthylife, to be educated, and to have access toresources needed for a decent standard ofliving. Human development can also beexpressed in terms of enlarging people’scapabilities, that is, people’s ability to real-ize what they may value doing or being. Aswith choices, the concept of capabilityclearly embodies a notion of people’s free-dom to determine their overall well-being.Furthermore, human development is notonly about the formation of human capa-bilities, such as improved health, knowl-edge and skills, but also about the use thatpeople make of them in productive, social
and political activities. Only if humandevelopment succeeds in balancing the for-mation and use of human capabilities, willhuman potential be fully realized. This canbe illustrated by the success of the EastAsian economies in promoting an enablingenvironment for the exertion of people’schoices. These countries not only investedheavily in basic capabilities, but peoplewere also enabled to utilize these capabili-ties because of the policies pursued to gen-erate broad-based and rapid growth, andultimately to increase people’s choices.
There are five distinctive features of thehuman development approach. First, peo-ple are clearly moved to centre stage.Development needs to be analyzed andunderstood in terms of people, to whatextent they participate in it or benefit fromit. Secondly, people should not only beconsidered as means, but also as ends ofdevelopment. The human developmentapproach should therefore not to be con-fused with human capital or humanresources theories. The third core notion isempowerment. People should not be treat-ed as passive beneficiaries, but as pro-active participants in the activities, eventsand processes that shape their lives, whichin itself reflects the exertion of a highlyvalued choice. Fourthly, the approach putsemphasis on equal opportunities for allpeople regardless of race, class, religion,sex, and nationality and underscores theimportance of intergenerational equity andenvironmental sustainability. Finally, thehuman development approach is compre-hensive. It refers to the expansion of peo-ple’s choices in all aspects of life, includ-ing economic, political, social, environ-mental, and cultural aspects.
‘Doi Moi’ and Human Development
The chapter continues by arguing that thesocio-economic policies that have beenpursued in Viet Nam, particularly since thelaunch of the doi moi (‘renovation’)
2 NATIONAL HUMAN DEVELOPMENT REPORT 2001
The essence of thehuman developmentapproach is that it treatsan expansion of humanchoices as the end of alldevelopment efforts.

process in the mid-eighties, can largely beconsidered as an implementation of thehuman development approach. Before thereforms, Viet Nam had already recordedrelatively favourable social developmentachievements, relative to other countrieswith a similarly low level of income, par-ticularly in terms of educational attainmentand health services. Considerable humanresource development In many respects,the pre-doi moi period was one of wherethe capabilities of much of the populationwere improved through basic literacy andaccess to basic health facilities. Yet, in theeconomic sphere the expansion of people'scapabilities and choices was severely hin-dered due to maintaining the central plan-ning mechanism for too long. That resultedin material hardship and widespreadpoverty and ultimately led to severe eco-nomic stagnation in the mid-80s. Inresponse, the Sixth Congress of theCommunist Party of Viet Nam in 1986launched the doi moi reform process. Thereforms did not imply a change in develop-ment goals, as the socialist orientation con-tinued to be viewed as superior in meetingpeople’s needs. This orientation was clear-ly reflected in the new slogan: “rich peo-ple, a strong nation and an equal, democra-tic and civilized society”. What it didintend to change was the approach todevelopment. Preserving the socialist ori-entation, the new policy was to support theestablishment of a market economy togeth-er with an active integration into the worldeconomy. The human development resultsof the doi moi process are impressive, par-ticularly in the socio-economic domain,and bode well for its capacity to take up themany challenges that remain.
Globalization and Human Development
The last section of the chapter puts VietNam’s human development achievementsin the context of globalization. Driven bytechnological change and trade liberaliza-
tion, globalization has led to a shrinking oftime and space with new markets, newtools, new institutions, new rules and newvalues. Globalization has played an impor-tant catalytic role in promoting growingprosperity and poverty reduction in manycountries, but actively engaging in globalintegration per se does not guarantee suc-cess. Truly successful integration willrequire proactive policies and timelypreparation in order to maximise the bene-fits for and minimise risks to the well-being of a nation's people.
The relatively liberal and ‘open door’policies of many Asian countries mayagain serve as a good example. Some ofthe ‘miracle’ economies of Asia haveshown that catching up with the developedeconomies within 40-50 years is possible,and have done so through rapid integrationinto the world economy. The major under-lying factors of this success include soundmacro-economic policies, a strong relianceon domestic savings, export-led develop-ment based on comparative advantage,opening up the economy to internationaltrade and investment, actively supportingan enabling environment for private sectordevelopment and heavy investment in peo-ple’s capacities, while preserving modestincome inequalities.
The validity of these factors was notundermined by the financial crisis that hitthe Asian economies in 1997, in itselfbeing an obvious recent example of thepotential destabilising impact of globaliza-tion. It shows that volatility and instabilityare inherent features of today’s globalfinancial system and that resilience andflexibility are crucial to weather the crisis.Those Asian economies that escaped rela-tively unscathed were either flexible andwell-integrated, or were only weakly finan-cially integrated like Viet Nam. Secondly,the crisis showed that opening the financialsystem to the world, especially for short-term capital flows, should be proceededwith care when domestic financial institu-tions and prudential supervision of the
3OVERVIEW
Doi moi did not imply achange in developmentgoals, as the socialist ori-entation continued to beconfirmed as superior inmeeting people’s needs.What it did change wasthe approach to develop-ment.
Globalization has playedan important catalytic rolein promoting growingprosperity and povertyreduction but truly suc-cessful integration willrequire proactive policiesand timely preparation inorder to maximise thebenefits for and minimiserisks to the well-being of anation's people.

financial sector is weak, a situation whichcan be further exacerbated by State-influ-enced lending practices. Thirdly, a numberof the problems that the Asian countriesfaced during the crisis arose only partlybecause governments did too much insome areas, and mainly because they didtoo little in a number of other areas wherethe State has an important role to play.When it comes to minimizing the risksfrom information failures, by ensuring thatessential information from the market ismade available, and by enforcing legalrequirements related to transparency,accountability and reporting of corpora-tions, the State has an essential role to play.
Although the Asian crisis has had a sig-
nificant effect on Viet Nam, especially
through the slowing down of exports andforeign investment inflows, overall Viet
Nam has dealt with the crisis reasonablywell. The country was able to avoid most
of the trouble by steering clear of interna-
tional financial markets, maintaining strictcontrols on foreign exchange transactions,
and relying chiefly on foreign direct invest-ments for foreign capital rather than liquid
portfolio investments and short-term debt.
Further openness will have to be managedcarefully. At the same time, it should be
underlined that not opening up, or keepingrestrictive trade barriers in place, may
involve considerable costs.
Growing inequality is another risk thatis often associated with globalization.
However, it is hard to establish a systemat-
ic link between (changes in) trade and
(changes in) income distribution. Availabledata suggests that emerging market coun-
tries that are highly integrated into the
global economy often, but not always,
exhibit a much more egalitarian incomedistribution than emerging market nations
that are characterized by a low degree of
integration. The level of income disparityin an economy is likely to have more to do
with history, economic growth, price and
wage controls, welfare programmes, andeducation policies than it does with global-
ization or trade liberalization alone. (In the
case of Viet Nam, recent evidence on dis-
parities is analyzed in chapter 3.) In anycase, in order to benefit from trade, poor
people will need to interact with markets,
which requires both infrastructure invest-
ments and institutional measures. It is alsoclear that, especially in the long run, pro-
tection rarely helps the poor. Sound macro-
policies together with targeted policy inter-
ventions are considered more effective.Globalization involves greater cultural
integration. Although this to some extent
may come at the expense of cultural diver-sity, it is expected that a well-entrenched
sense of culture and nationalism will not be‘blown away’, while there are great bene-
fits attached to cultural exchanges. Thereare also some unfounded fears that global-
ization will undermine the country’snational sovereignty. At the same time,
however, it cannot be denied that countriesengaging in successful international inte-
gration need to implement certain reformsand policies that will unavoidably con-
strain the scope for some kinds of econom-ic policies.
Among other requirements, successful
integration demands a flexible economy
that can respond quickly and effectively toany fluctuations in the process of global-
ization. But rather than a surrender of
national sovereignty, this should be seen as
an exercise of sovereignty, to strengthen
the nation’s capacity to determine its own
future. This in turn demands new capaci-
ties and new ways of thinking of both the
Government of Viet Nam and theVietnamese people. As the chapter con-
cludes: “global integration can open the
path to sustainable development – to ‘catch
up’ – but the speed of the journey is deter-
mined by the strength of those who are
walking”.
4 NATIONAL HUMAN DEVELOPMENT REPORT 2001
Global integration canopen the path to sustain-able development – to‘catch up’ – but the speedof the journey is deter-mined by the strength ofthose who are walking.

Institutional Reforms and HumanDevelopment
Chapter 2 reviews in greater detail theresults of the reforms that have been imple-mented over the last two decades. Thereforms have focused on the improvementof the enabling environment and have con-siderably expanded people’s choices. Thispolicy and institutional reform processstarted in agriculture. Land reform in the1980s and early 1990s, especially thereturn of land to farm households fromlarge centrally-controlled state coopera-tives, provided the rural population withmuch greater choice on how to best use andmanage agricultural land. Along withmacro-economic reforms such as price lib-eralization and exchange rate unification,and investments in rural infrastructure andarea development, this promoted bothdomestic and international trade.
As a result of booming rice production,the country has been transformed frombeing a net importer of rice in the mid-1980s to the world’s second largest riceexporter. In addition, farm householdsstarted to diversify towards higher value-added cash crops, like coffee, tea and rub-ber. Although international trade hasbrought great benefits, it has also increas-ingly exposed farmers to fluctuations ininternational prices of commodities such ascoffee and rice, which became painfullyclear over the past two years. Farmers arenot yet able to sufficiently cope with theserisks, for instance through further cropvariation, income diversification, or evencommercial hedging.
In hindsight, agriculture turned out tobe relatively well placed to respond to theincentives created by reforms. In thissense, the transition in Viet Nam has beenquite different from that in Central andEastern Europe and the former SovietUnion. These countries were not denselypopulated rural economies, but highly,albeit inefficient, industrialized economies.
Dismantling the old industrial structureinvolved problems of time, sacrifice, costsand politics with which China and espe-cially Viet Nam had much less to contend.This is not to deny that sectors other thanagriculture were also subject to institution-al reforms and that, especially in the State-dominated industrial sector, furtherreforms will be warranted.
During the nineties, employment inViet Nam grew by more than one millionpeople a year, or at an annual rate of overthree per cent, which was significantlyhigher than in previous decades. Twolessons can be learned from this great suc-cess. First, the transition to a market econ-omy and a more open economy has beenvery effective in unleashing much of thepotential of the Vietnamese people.Although still subject to a relativelyunfavourable environment, the private sec-tor turned out to be most efficient in creat-ing new and sustainable jobs. Promotingthe private sector is therefore a crucialcomponent of a viable human developmentstrategy. Secondly, the State has toacknowledge that it is no longer the only orbest provider of jobs. Instead, it will haveto focus on a more indirect role by estab-lishing and supervising institutions thatfacilitate a proper functioning of the labourmarket. Needless to say, the State will needto keep its responsibility, to ensure theavailability of accessible and affordablesocial services, particularly for the poorestand most vulnerable groups, for examplethrough the effective development andimplementation of the NationalProgramme on Hunger Eradication,Poverty Reduction and Job Creation.
Poverty Reduction in the Nineties
Prior to the adoption of the ‘doi moi’ poli-cies, poverty was widespread, and wellover seventy per cent of the population wasimpoverished. This was due to an evidentlack of choices and opportunities for peo-
5OVERVIEW
The private sector turnedout to be most efficient increating new and sustain-able jobs. Promoting theprivate sector is thereforea crucial component of aviable human develop-ment strategy.

ple to generate and increase incomes , par-ticularly because of the dominance of thecentral planning mechanism. A second andrelated factor was the strong emphasis onjob security and equal living standards,undermining people’s work incentives.Thirdly, people’s capabilities were not ade-quately developed to cope with risks. Mostof the people in Viet Nam live in ruralareas and rely on agriculture and they lacka margin of security against overwhelmingcontingencies, such as drought, floods,storms and other hazards. This was relatedto the low use of modern technologies,insufficient diversification and limitedfinancing capacity.
The doi moi process should not beregarded merely as an economic reformpackage to master the crisis in the mid-1980s. In effect, doi moi is also a compre-hensive program aimed at overcomingpoverty and further developing the country,recognizing that the central planningmechanism was no longer suitable toensure the realization of human develop-ment objectives. The achievements inreducing poverty in Viet Nam have beenimpressive, by any standard. Based on aninternationally-comparable poverty line,poverty incidence fell from well over 70%in the mid-1980s to 58 per cent in 1993 andfurther to an estimated 37 per cent in 1998.In urban areas, poverty declined from 25per cent in 1993 to 9 per cent in 1998,whereas in rural areas, it decreased from 66to 45 per cent.
Looking at other aspects of humandevelopment, especially health and educa-tion, Viet Nam scores considerably higherthan other countries with similarly lowincomes. This is probably due to the com-paratively low level of income inequalityand the high priority the Government hasattached to investing in the social sectors.Adult literacy has risen to 94 percent andnet school enrolment rates now amount to92 and 74 per cent for primary and lowersecondary schools, respectively. Childrenbelonging to the ethnic minority house-
holds have been catching up in terms ofenrolment rates, while gender inequalitieshave narrowed. Stimulated by highersalaries for skilled workers, tertiary educa-tion has gained popularity and an increas-ing number of students are studyingabroad, while new forms of education,such as private and semi-public schools,have emerged. At the same time, enrol-ment, attendance and completion rates areunsatisfactory and relate to the increasingprivate costs of school participation.Quality of education and teaching staff isanother serious concern. Traditional meth-ods of teaching rely heavily on rote learn-ing. Primary and secondary schools stillput much emphasis on memorizing facts,usually with little opportunity to be cre-ative and to express thoughts and ideas.There is a need to modernize the knowl-edge system to make Viet Nam the knowl-edge-based economy it aspires to be.
During the doi moi reform period, pop-ulation policies and family planning pro-grammes were intensified and implement-ed on a larger scale, which together withthe generally improved living conditions,led to a sharp slowing down of populationgrowth. The Government now intends togradually move away from fertility controland family planning towards a policy thatfocuses on free, well-informed choicesthrough access to high quality reproductivehealth care services and the provision ofappropriate information. Such a movewould imply that population policy wouldbecome congruent with the human devel-opment perspective.
In the health sector, doi moi furtherexpanded and improved the existing three-tier health system. The immunization pro-grammes in particular have been highlysuccessful. Today’s official health policycomprises three key elements: (a) itprefers ‘prevention to cure’, (b) combines‘traditional and modern medicine’ and (c)calls for a ‘joint contribution by both theState and people’. During the reform peri-od, the health insurance scheme was
6 NATIONAL HUMAN DEVELOPMENT REPORT 2001
Doi moi should not beregarded merely as aneconomic reform packageto master the crisis in themid-80s. In effect, doi moiis a comprehensive pro-gram aimed at overcom-ing poverty and furtherdeveloping the country.

extended and now covers approximatelytwelve per cent of the population. A rela-tively new phenomenon is the emergenceof the private sector and most notable isthe increasing number of private chemists.Although the rise in the availability ofpharmaceuticals has in principle widenedpeople’s choices, it has also contributed toirrational drug use, an increase in anti-microbial resistance and to growth in pri-vate expenditures on health, whichamounts to no less than about 80 per centof total health expenditures.
Doi moi may be marked as a turningpoint in the area of information and cul-ture. There has been a significantimprovement in provision of and access todifferent kinds of information, while mod-ern information and communication tech-nology (ICT) and the Internet have gainedpopularity. In this field, however, VietNam still lags much behind its own ambi-tions as well as many neighbours in theregion, and there is strong need for morerigorous policies.
Overall, the doi moi reform process hassubstantially expanded people's choices,and also built further upon the develop-ment of people's capabilities which wasalready well advanced from the pre-doimoi period. All of this has been reflected insignificant improvements in the HumanDevelopment Index (HDI) and HumanPoverty Index (HPI). With regard to theHDI, which combines progress in terms ofincome, health and education, Viet Namnow ranks 101st out of 162 countriesworld-wide, which is behind China and thePhilippines, but ahead of Indonesia andIndia. Due to the country’s still relativelyweak performance in terms of access tosafe water and child malnutrition, its rank-ing based on the HPI is somewhat lessfavourable, notwithstanding the progressmade over recent years. But as notedbefore, relative to its income per capita,over the last fifteen years Viet Nam hasclearly become somewhat of a successstory in human development.
Nevertheless, there are at least threereasons not to be complacent. First of all,many human development challengesremain since Viet Nam is still a poor coun-try by international standards, despitebeing mid-way through its transitionprocess. Secondly, as highlighted and ana-lyzed in chapter 3, national averagesobscure the significant human develop-ment disparities by region, ethnicity andgender. Thirdly, the doi moi process hasinflicted significant damage upon the nat-ural environment in terms of bio-diversityloss, solid waste, air pollution and degrada-tion of forests, water and marine resources.Viet Nam’s path to further industrializationand modernization will need to be moreenvironmentally sustainable, in order toensure that future generations will haveopportunities and a quality of life at least asgood as the current one.
Human Development Challenges
As outlined in Chapter 3, the main goalsof the Ten Year Socio-Economic Strategy2001-2010 , approved by the PartyCongress in April 2001, include doublingGDP, eliminating hunger, rapidly reducingpoverty, increasing life expectancy, uni-versal lower secondary education, and,notably, a substantial improvement in thecountry's HDI. Consistent with the humandevelopment perspective, the strategyunderscores the importance of formingand upgrading people’s capabilities as wellas enabling people to put them to use inorder to build the foundations of “a richpeople, a strong nation and an equitable,democratic and civilized society”.However, the easy gains in poverty reduc-tion are probably over, and it will requiregreat efforts for Viet Nam to fulfil itsobjective of reducing its poverty substan-tially in the decade ahead, even if econom-ic growth continues at its robust rate ofaround seven per cent annually. TheGovernment will need to pay more atten-
7OVERVIEW
Recent new evidenceusing income data sug-gests that incomeinequality may be risingmore rapidly than earlierestimates indicated. Thiswill present a new chal-lenge for policy-makers.
National averages obscurethe significant humandevelopment disparities byregion, ethnicity and gen-der.
tion to geographical disparities, particular-ly the many pockets of deep and persistentpoverty in rural and remote areas.
Chapter 3 argues that while economicgrowth in the 1990s has been very good forthe poor in Viet Nam, it could have beeneven better if the fruits had been sharedmore evenly. Although still relatively lowby developing country standards, recentnew evidence using income data suggeststhat income inequality may be rising morerapidly than earlier estimates indicatedbased on expenditure/consumption data.This will present a new challenge for poli-cy-makers. Based on detailed income databy province and urban authority, the ginicoefficient for Viet Nam appears to haverisen significantly from 35.6 in 1995 toaround 40.7 in recent years. While this isaround the same level as China's income-based gini coefficient of 40.4, it may be ofsome concern that Viet Nam appears to bereaching such inequality much more quick-ly and at a much lower level of averageincome per capita than China. (Earlier esti-mates of Viet Nam's gini coefficient usingexpenditure data from the VLSS surveyssuggested that inequality had risen onlymodestly from around 33.0 in 1993 tosome 35.2 in 1998.) Based on income data,more than half the country's provinces (31out of 61) experienced an increase in mea-sured income inequality by at least 10-per-centage points during the four yearsbetween 1995 and 1999. Only nine out ofsixty-one provinces experienced a declinein their income-based gini coefficients, andat a modest rate except for Bac Can.
Income, however, is only part of thedevelopment story. And here in Viet Nam,disparities have been found not only interms of income but also in other humandevelopment dimensions. For the first timeever, this Report presents HDIs and HPIsfor all 61 provinces in Viet Nam. Two gen-eral lessons can be learned from this exer-cise. First, aggregate indicators tend toconceal significant human developmentdisparities within the country. The South-
East and the Red River Delta are consider-ably better off than other regions, especial-ly the North East, North West and CentralHighlands. While good provincial per-formers can compare favourably withcountries like Hungary and Estonia, poorperformers do not score much higher thanLaos, Nepal and Bhutan. Secondly, ananalysis that focuses on income differen-tials may lead to different policy conclu-sions than one that is based on disparitiesin human development. Similar conclu-sions are drawn from the maps on existinggender gaps throughout the country.Gender inequalities vary significantlyacross the country; they are higher the fur-ther provinces lie away from the four majorurban areas. Hence, when designing newpolicies to promote people’s well-being,one has to go broader (by consideringmore than just income) as well as deeper(by looking not only at national averages).In this regard, it is very much recommend-ed that policy-makers take into accountprovincial HDIs and HPIs when formulat-ing new socio-economic policies and allo-cating resources across the country.
Chapter 3 continues by discussing themajor challenges the country faces inachieving these ambitious goals, with aspecific emphasis on the role the State hasto play in this respect. The first is furthereconomic integration, predominantly dri-ven by multilateral and bilateral tradeagreements, and Viet Nam’s ambition tobecome a WTO-member. It is unlikely thatthe country could replicate its past growthperformance without a deepening of tradeand investment relations. The enactment ofthe New Enterprise Law, amendments ofthe Law on Foreign Investment and theimplementation of the Action Programmesupporting small and medium enterpriseshave recently improved the investment andbusiness climate, but more needs to bedone. The competitiveness of the economyremains weak, and the absorption of mod-ern technologies is limited. Increasinginternational economic integration also
8 NATIONAL HUMAN DEVELOPMENT REPORT 2001
It is very much recom-mended that policy-mak-ers take into accountprovincial HDIs and HPIswhen formulating newsocio-economic policiesand allocating publicexpenditures across thecountry.
Easy gains in povertyreduction are probablyover, and Viet Nam willneed great efforts inreducing poverty in themore remote and isolatedareas of the country.

implies that protecting and heavily subsi-dizing existing SOEs will become increas-ingly difficult and unsustainable.
Employment creation remains one ofthe greatest challenges for the next decade.Every year another 1.4 million people willenter the labour market, SOE-reforms willlead to new redundancies, and underem-ployment is still high, especially in ruralareas. Against this background, it is worry-ing that Government policies, either direct-ly or indirectly, often still favour the devel-opment of capital-intensive industries atthe expense of labour-intensive activities,which seriously hinders an employmentfriendly growth process. Experience inrecent years shows that the private sector isby far best placed to provide the necessarynew jobs, also in rural areas. The NewEnterprise Law, which became effective inJanuary 2000, has bolstered the domesticprivate sector. The new Law significantlylowers the costs and administrative burdenof setting up a private enterprise by simpli-fying and removing more than a hundredlicensing requirements and related fees.During the year 2000 alone, 14,400 newsmall and medium sized enterprises and140,000 household businesses were regis-tered, with 500,000 new jobs created.Preliminary indications for the year 2001indicate a similarly large increase in newenterprises and related jobs.
There is also an urgent need to increasethe knowledge and skills and hence theproductivity of existing and new workersthrough vocational and on-the-job training.In this regard, the education and sciencesystem is in need of major overhaul. Thecurriculum should be modernized to bal-ance learning and practising. In addition toan expansion of the number of teachers, thequality of staff needs to be upgraded andconsideration needs to be given to revisingthe incentive system. Investment in build-ings and modern equipment is inadequate.Redressing this shortfall is especiallyurgent in rural and remote areas given thelarge education gaps in these areas. Thescience and technology sector is large, butnot very effective due to the increasingly
outdated knowledge and skills of person-nel, outdated equipment, and lack of link-ages with the business sectors. As a firststep to speed up technological develop-ment, the Government has established anumber of high-tech centres. Access to theInternet is still fairly limited due to highcosts, fees and regulatory controls.
The State can also directly contribute tothe reduction of poverty through the effec-tive allocation of public expenditure, thatis, financing public infrastructure, provid-ing public services and implementing anti-poverty programmes. Finally, the State hasa special responsibility when it comes toprotecting the environment. Public aware-ness of environmental issues needs to bepromoted and environmental considera-tions need to be integrated into economicdecision-making. Furthermore, there is aneed to implement and enforce relevantlaws and to further teach and implementthe concept of sustainable environmentalmanagement to government staff.Moreover, there is a need to implement andenforce relevant laws as well as to upscalethe capacity of government staff for sus-tainable environmental management.Public funds for the environment should beincreased, possibly in combination withuser fees, while the Government, togetherwith international organizations, shouldstep up efforts to benefit from internationalenvironment funds.
Deepening the doi moi process
Based on the analysis in previous chapters,chapter 4 focuses on five key componentsof a comprehensive strategy to enhancehuman development in Viet Nam: (i) accel-erating institutional reforms, especially forthe more effective implementation ofsound policies and laws; (ii) furtheringeconomic restructuring; (iii) promotingrural development; (iv) reforming educa-tion and training, science and technology;and (v) expanding and improving publicservices.
9OVERVIEW
Employment creationremains one of the great-est challenges for the nextdecade. Every year anoth-er 1.4 million young peo-ple will enter the labourmarket.

Institutional reforms will involve a fur-ther improvement of the legal framework,clarifying the ‘rules of the game’ in anopen, market-oriented economy. Thisincludes the development of markets suchas the labour market and the real estatemarket. It is also imperative to establish atruly level playing field for all economicsectors. Rather than making amendmentsto the various laws that regulate businessactivities of different sectors, a unified lawfor all businesses should be made.Furthermore, there is an urgent need toreview laws such as the Land Law, LabourCode, Bankruptcy Law, and the Law onBanking and Financial Institutions, whilenew laws will have to be developed,including a Competition Law, Law onIntellectual Property Rights, and a Law onE-commerce. These new laws should beconsistent with existing laws, internationalstandards and bilateral and multilateralcommitments. Taken together, thisdemands an in-depth review of all regula-tions pertaining to international trade andinvestment.
Improving laws alone cannot guaranteea better business climate or a level playingfield. Laws need to be enforced effectively,which would be part of a bigger package oflegal system and public administrationreforms. At the same time, wider participa-tion of the public into social, economic andpolitical life needs to be promoted. This isworth pursuing for its own sake, that is toempower people, and will also encouragethe State apparatus to improve its perfor-mance. A prime task is thus to acceleratepublic administration reform and to imple-ment grassroots democracy. This wouldfurther help to realize the doi moi principle‘people know, people discuss, people doand people review’. Awareness raising andpublic education is essential to ensure thatpeople better understand their rights, enti-tlements and obligations. It will also helppeople to mitigate bureaucratic constraints,corruption, "undemocratic behaviour" andother such abuses.
In regards to economic reforms,enabling the further development of theprivate business sector will be very impor-tant for achieving the ambitious socio-eco-nomic and human development targets VietNam has set for itself. Although the NewEnterprise Law has considerably con-tributed to a better environment for the pri-vate business sector, efforts need to beintensified to ensure that the Law is effec-tively implemented at local levels through-out the whole country, together with fur-
ther deregulation and other initiatives. Theimportance of local authorities is shown byinitiatives undertaken by some dynamiclocalities which have resulted in a widerspread of productive private activities.
The Government should also pursuefurther SOE-reforms and level the playingfield with other forms of business, includ-ing in the financial sector, where Statedomination is still heavy. These reformsare also urgent in light of commitmentsViet Nam has made through multilateral,regional and bilateral trade agreements . Inthis respect, the Government should workout a comprehensive Economic Integration
Action Plan to implement the agreementsto which Viet Nam is or will become a part,focusing on policy, legislation and institu-tional issues as well as dealing with pro-found fiscal and social consequences. As tothe latter, the Government should considera careful sequencing of trade and invest-ment reforms that the poor in particulardepend upon. A concrete example wouldbe to give priority to liberalization ofinputs for farmers such as fertilizers andseeds, which would enable farmers tocushion the possible negative impact of lib-eralization that they will have to face inother areas.
In the area of rural development, it isimportant that land use rights, especiallythe right to transfer and the right of mort-gage, are effectively enforced. Other insti-tutional measures include the furtherreduction of state monopolies and lowering
10 NATIONAL HUMAN DEVELOPMENT REPORT 2001
Enabling the furtherdevelopment of the pri-vate business sector willbe very important forachieving the ambitioussocio-economic andhuman development tar-gets Viet Nam has set foritself.
remaining barriers to agricultural markets.This would make the market more compet-itive and improve the bargaining power ofsmall farmers. The Government shouldalso further support farmers, including therelatively new and promising form ofestate farming, through the provision ofinformation, better extension services, pro-motion of new technologies, improvedinfrastructure and rural-urban transport,and higher quality alternative supportingservices, especially in more remote areas.
Although in many sectors the role ofthe State will gradually change towardsfacilitation (rather than both "steering androwing the boat"), it will maintain primeresponsibility in the provision of publicgoods and public services, notably educa-
tion, health, social safety nets and the nat-ural environment. Nevertheless, therespective roles and responsibilities of theState and non-State sectors have to bedefined more clearly in these areas as well.In education for example, the Governmentis responsible for ensuring universal pri-mary and lower secondary education,whereas private parties may play a con-structive role in the provision and financ-ing of higher level education and voca-tional training. Rigorous measures are alsonecessary to start building a knowledge-based economy in Viet Nam. The numberand quality of small and medium sized
enterprises is still far too limited to propelthe country up the value-added chain,while state control is still dominant in thissector.
Both in education and health, there is aneed to review the current policy of social-ization, which disproportionately affectsthe poor, and to invest more in the accessi-bility of services and to upgrade their qual-ity by setting minimum standards, promot-ing a culture of service and close monitor-ing. In the field of reproductive health,notably with regard to the threatening epi-demic of HIV/AIDS, the Government
should pursue its move towards better pre-ventive measures, such as counselling andinformation, education and communicationpractices, a wider choice of contraceptivemethods and the improvement of staff.Rapid urbanization and increasing migra-tion, including their impact on publichealth and the environment, should beincluded in socio-economic policies.
To cope with the downsides of tradeliberalization and economic restructuring,as well as to manage the risks associated
with natural disasters, there is a need tostrengthen the social safety net for the mostvulnerable groups. Such strengtheningimplies increasing the coverage, improvingthe targeting, and helping people to bettercope with risks and uncertainties related tonatural disaster, as well as establishing anadequate disaster rehabilitation system.
Given their inter-linkages, the abovepolicy recommendations require a compre-hensive strategy to enhance the formationof people’s capabilities and to improve theenabling environment so that people caneffectively use their capabilities and exer-cise effective choices. For example, the
ease with which private sector firms cancreate new jobs and improve the level ofeducation and health of the poor is animportant determinant of whether tradereforms will create employment and lead tohigher incomes of poor households. Privatesector development, in turn, cruciallydepends on public administration reforms,while the latter requires a bigger role ofpeople themselves in the formulation,implementation and monitoring of publicpolicies and public services, especially atthe grassroots’ level. Without deepeningthe doi moi process, the human develop-ment achievements of the past would be at
risk, and Viet Nam’s vision for the futurewould be difficult to realize. But withdeepening reforms, Viet Nam can continueto be one of the success stories in improv-ing human development.
11OVERVIEW
A comprehensive strate-gy is needed to enhancethe formation of people’scapabilities and toimprove the enabling envi-ronment so that peoplecan effectively use theircapabilities and exerciseeffective choices.

This chapter constitutes the concep-tual basis of the Report. It compris-es three sections. The first section
presents the essential concepts of thehuman development perspective, whichviews the expansion in human capabilitiesand choices, rather than the increase inincome and material wealth, as the end ofall development efforts. This approach -with its philosophical roots going back tothe early leaders of political and economicthought - has become increasingly popularover the last decade. In the second sectionthe focus moves from the conceptual dis-cussion to the development strategies inViet Nam. The socio-economic policiesthat have been pursued, particularly sincethe launch of the doi moi reforms in themid-eighties, can largely be considered asan implementation of the human develop-ment approach, while taking into accountthe specificities of the country. As VietNam is further integrating into the worldeconomy and the global society, the finalsection discusses some human develop-ment challenges and risks in the broadercontext of globalization.
1.1. THE CONCEPT OF HUMAN DEVELOP-MENT
ECONOMIC GROWTH VERSUS HUMAN DEVEL-OPMENT
For centuries humankind has beenobsessed by the goal to free itself of pover-ty and to achieve better livelihoods for all.Expanding production capacity andencouraging economic growth have gradu-ally become the major objectives of nation-
al policy-makers. No doubt, economicgrowth is very important in improvinghuman lives, which is demonstrated by ahuge difference in living standardsbetween people living in more ‘developed’countries – largely being the result ofdecades of economic growth - and thoseliving in ‘developing’ countries. For low-income countries, significant growth rateswill be necessary to overcome widespreadpoverty as well as to create the necessarymeans for human development. For a longtime, growth has been regarded as theessence of the development process, and abias towards the objective of economicgrowth seems to have dominated develop-ment thinking.
With such a view, there is a risk to over-look that people are the genuine target ofdevelopment; often human beings havesolely been considered as a factor of pro-duction to contribute to economic growth.Inequality in terms of choices and thepoverty among certain population groupshave time and again been viewed as beingthe necessary costs of economic growthand development. The social aspects ofdevelopment, if at all taken into account,have often been narrowed down to the needfor redistribution of production outcomesthrough the public sector.
By contrast, the human developmentperspective adopts a more comprehensiveapproach. Although the origins of thisapproach go far back into history, it wasrediscovered in the course of the twentiethcentury (see box 1.1). Especially during the1990s, it has, either implicitly or explicitly,been accepted by an increasing number ofresearchers, policy advisors, politiciansand social practitioners. The first global
13THE HUMAN DEVELOPMENT PERSPECTIVE
CHAPTER 1
The Human Development Perspective

Human Development Report published in1990 defines human development as “theprocess of enlarging people’s choices. Themost critical of these wide-ranging choicesare to live a long and healthy life, to beeducated and to have access to resourcesneeded for a decent standard of living”(UNDP, 1990, p.1). Though concepts arealways broader than their measures, theHuman Development Index (HDI) reflectsthe essential choices of people by combin-ing life expectancy, school enrolment,adult literacy and average income (seechapter 2).
An alternative to defining human devel-opment is to express it in terms of expand-ing people’s capabilities, that is people’sability to achieve. This is echoed in the lat-
est Vietnam Development Report 2001):“[human development is] the process ofexpanding people’s capabilities, the set ofchoices people have available, and ulti-mately the freedoms people enjoy to deter-mine their overall well-being(ADB/WB/UNDP, 2000, p.60).” These arebasically two ways of expressing the sameconcept (see box 1.1).
THE HUMAN DEVELOPMENT PERSPECTIVE
The essence of the human developmentperspective is that it considers incomeexpansion as an important means, andtreats an expansion in people’s choices andcapabilities as the end of all developmentefforts. In doing so, it performs an impor-tant service in questioning the presumedlink between expanding income andexpanding human choices. However,rejecting an automatic and universal linkbetween income expansion and flourishinghuman lives does not imply rejectinggrowth itself. Economic growth is essentialto reduce and alleviate poverty. But from ahuman development perspective, the quali-ty of this growth is just as important as itsquantity. Quantity versus quality is a falsedichotomy. The two are jointly determinedand their interaction is what decideswhether the results will be good, bad, orindifferent. Aspects of ‘quality’, such asequality in health and education, good gov-ernance and environmental protection, arecentral to what the poor - and everybodyelse - value most in economic progress.Conscious public policy is needed to trans-late economic growth into the bettermentof all people’s lives.
A further distinction can be madebetween the formation of human capabili-ties, such as improved health, knowledgeand skills, and the use that people make oftheir acquired capabilities in productive,social and political activities. People neednot only the opportunities to form capabil-ities, but also opportunities to use them.And if the scales of human developmentfail to balance the formation and use ofhuman capabilities, much human potentialwill be frustrated.
14 NATIONAL HUMAN DEVELOPMENT REPORT 2001
Mahbub ul Haq and Amartya Sen and have greatly contributed to the rediscov-ery of the human development approach. This rediscovery is not a new invention.It is a tribute to the early leaders of political and economic thought. The redis-covery of human development became most evident in the publication of theglobal Human Development Reports. The definition of human development inthese reports is directly based on the conceptual framework developed by theNobel laureate Amartya Sen. He makes the distinction between people's func-tionings - reflecting the various things a person may value doing or being - andpeople's capabilities. Functionings may vary from elementary and universallyaccepted ones such as being adequately nourished and escaping avoidable mor-bidity or mortality, to more complex ones and personal states, such as being ableto take part in social life and having self-respect. A person's capabilities refer tothe alternative combinations of functionings that are feasible for one to achieve.In other words, a functioning is an achievement, while a capability is the abilityto achieve. Functionings are more direct expressions of people's living condi-tions, whereas capabilities embody the notion of freedom to choose among awider set of functionings. A stark example of the contrast often cited is that "fast-ing is not the same thing as being forced to starve. Having the option of eatingmakes fasting what it is: choosing not to eat when one could have eat." (Sen,1999, p. 75) The other way of expressing human development, namely as awidening of people's choices, focuses more specifically on the aspect of freedom.However, not all choices available are to be valued. Ultimately, the 'goodness' ofchoices must be valued activities in terms of promoting human well-being.
BOX 1.1Human Development Rediscovered and Redefined
Source:: Mahbub ul Haq, 1998. Reflections on human development; Amartya Sen, 1999.Development as Freedom..

The success of the East Asianeconomies is a case in point. These coun-tries not only invested heavily in basiccapabilities, but were also able to utilizethese capabilities because of policies ofbroad based and rapid growth. The forma-tion of capabilities depends on what iscalled an ‘enabling environment’, or inother words, an environment that enablesthe realization of economic, social andpolitical opportunities. This includesaccess to the resources, means or activitiesto form one’s capabilities. Opportunities,in turn, are based on a person’s entitle-ments, which are defined as the alternativebundles of commodities with which a per-son can establish command, either throughownership of assets or the ability to trade.These commodities are only instrumentallyimportant; the ultimate objective is theconversion of commodities into humanwell-being. To take an example, food inse-curity denotes a lack of entitlement to foodand thus a shortage of food intake.
While opportunities are essential toform capabilities, the effective, efficientand sustainable use of capabilities, in turn,can enhance one’s opportunities. In thisway, vicious circles of human deprivationcan be transformed into virtuous circles ofhuman development. The flip side ofhuman development is ‘human poverty’ or‘capability poverty’, a notion introduced inthe global Human Development Report1997. This concept goes beyond the tradi-tional meaning of poverty as a shortage ofincome. It reflects a severe failure of basiccapabilities, as measured by the HumanPoverty Index (see further chapter 2).
HUMAN DEVELOPMENT POLICIES
Moving from the concept of human devel-opment to human development policies, afirst question is why we should promotehuman development and poverty reduc-tion. Above all, human development is anend itself that needs no further justifica-tion. Secondly, it is a means to higher pro-ductivity. A well-nourished, healthy, edu-cated, skilled labour force is the most
important productive asset. Thirdly, itreduces the population growth and hencethe population pressure, by lowering thedesired family size. Fourthly, human devel-opment is good for the physical environ-ment. The poor are both a cause and themain victim of environmental degradation.Fifthly, reduced poverty contributes to ahealthy civil society, democracy, andgreater social stability ( Streeten, 1994).
Human development policies may beconsidered as comprising of five general,but distinctive features: (i) humanity; (ii)people as means and ends; (iii) empower-ment; (iv) equity and (v) comprehensive-ness. These features will be elaboratedbelow. 1. Humanity: people are moved to the cen-
tre stage. People’s overall quality of lifeis the ultimate end of development.Development needs to be analysed andunderstood in terms of people, to see towhat extent people participate in it orbenefit from it. The crucial issue iswhich growth pattern should be chosento adequately represent the happiness ofhuman beings. Besides income, peoplehave many other interests such as accessto better heath care services, better edu-cation for their children, better housingand having freedom to travel and speak.That the new development thinking triesto ‘humanize’ international economicrelations is indeed an achievement of thehuman development approach, as beingreflected in the global HumanDevelopment Reports published since1990 and followed by numerous nation-al reports all around the world.
2. People are both the means and the endsof development. The human developmentapproach should not be confused withhuman capital development or humanresource management. A common ele-ment in these two approaches is that theyboth consider human beings - particular-ly investment in human capital througheducation, training, health care and thelike - as the most important driving forceof sustainable economic growth. The
15THE HUMAN DEVELOPMENT PERSPECTIVE
The essence of the humandevelopment perspectiveis that it considers anexpansion of people’schoices and capabilitiesas the end of all develop-ment efforts

principal difference is that in the humandevelopment approach people are boththe means and the goals of development,whereas in human capital and humanresource theories, people are mostlytreated as a factor of production or as acapital resource, albeit the most crucialone, for the economic development ofsociety. Although motives differ, theapproaches would have a common inter-est if there were rigid links between eco-nomic production (as measured byincome per head) and human develop-ment (reflected in, for example, theHuman Development Index). However,these two sets of indicators are notalways closely related on a worldwidebasis nor in Viet Nam, as will be dis-cussed in greater detail in chapter 3.
3. Empowerment. The human develop-ment approach is neither paternalisticnor based on charity or welfare con-cepts. Development must be aimed atthe enlargement of people’s own choicesand should not be imposed upon them.Furthermore, people should not be treat-ed as passive beneficiaries, but as pro-active participants in the activities,events and processes that shape theirlives, which in itself reflects the exertionof a generalised highly valued choice.
4. Equity. The human developmentapproach refers to all people regardless ofrace, class, religion, sex, and nationality .If development is to enlarge people’schoices, people must enjoy equitableaccess to opportunities. Developmentwithout equity means a restriction ofchoices for many individuals in a society.Depending on how inequitable the devel-opment process is, it can disenfranchisewhole sections of society. Equity shouldbe understood as equity in opportunitiesboth to form and use one’s capabilities,not necessarily in outcomes. Specialattention needs to be given to disadvan-taged and vulnerable groups such as thepoor, disabled people, the ethnic minori-ties, the people in remote areas, andwomen. Equity is not only important
within generations, but also between gen-erations. Intergenerational equity impliesthat the next generation should in princi-ple be able to enjoy opportunities and aquality of life at least as good as the cur-rent one. Development therefore needs tobe environmentally sustainable.
5. Comprehensiveness. As it is people-cen-tred and treats people not solely asmeans but also as ends, the humandevelopment perspective embraces allsectors of society – not just the econo-my. It refers to the expansion of people’schoices in all aspects of life, includingeconomic, political, social, environmen-tal, governance and cultural aspects andin their interrelations, since all theseaspects are relevant for people’s capabil-ities and hence their personal choices.What does the above imply for the role
the state? First of all, the state should facil-itate the participation of people in thedevelopment process. It should designsound institutions that enable and encour-age people’s participation. For transitioneconomies, the establishment of pro-mar-ket institutions that organize markets aswell as free markets from excessive con-trols and regulations, for example, can beseen as a significant step in the develop-ment process. Markets are, in principle,based on free choices with regard to busi-ness opportunities, consumption possibili-ties as well as voluntary transactionsbetween individuals. It is exactly this free-dom, together with competition, thatmakes markets efficient.
It should be acknowledged, however,that sometimes the conditions for an effi-cient functioning of markets are not met.Examples of such ‘market failures’ areinformation imperfections, natural monop-olies, public goods, externalities, etc.Government interventions are necessary toremedy market failures to avoid that theyadversely impact human development.From a human development perspective,governments also play a crucial role in pro-moting economic growth with equity, thatis to correct market outcomes, and to
16 NATIONAL HUMAN DEVELOPMENT REPORT 2001
Governments play a crucialrole in promoting economicgrowth and ensuring thatgrowth is conducive to theexpansion of all people’scapabilities and choices
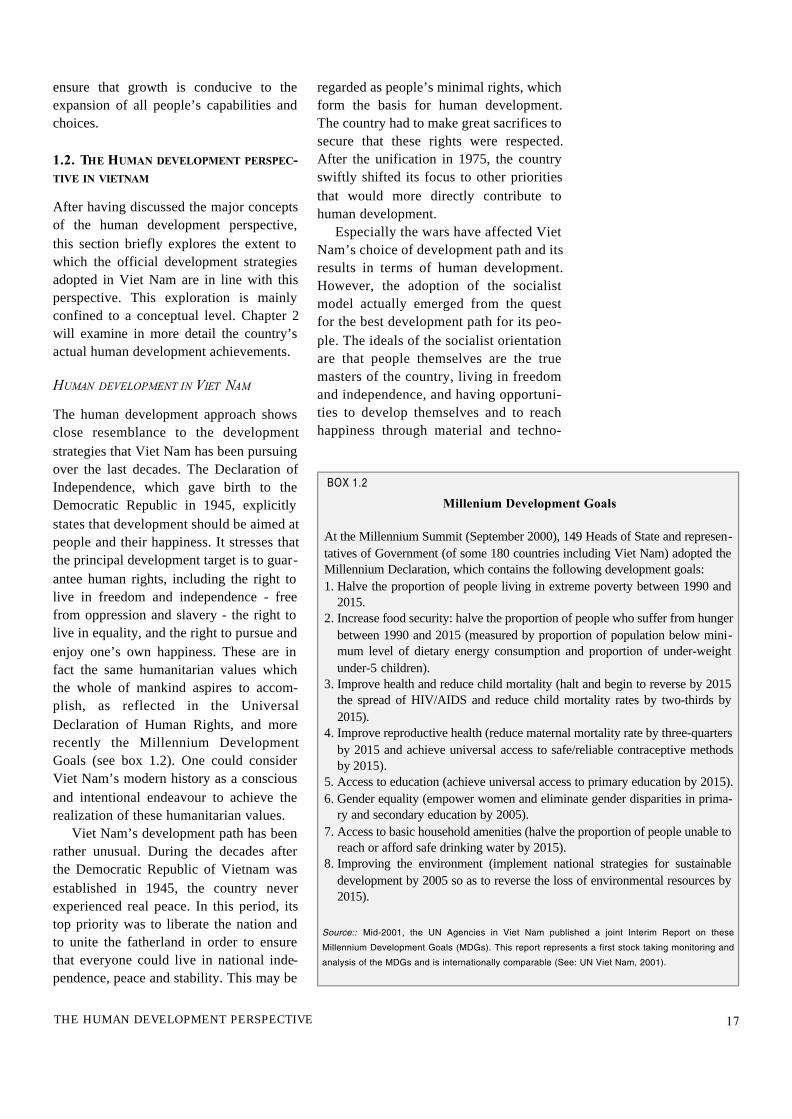
ensure that growth is conducive to theexpansion of all people’s capabilities andchoices.
1.2. THE HUMAN DEVELOPMENT PERSPEC-TIVE IN VIETNAM
After having discussed the major conceptsof the human development perspective,this section briefly explores the extent towhich the official development strategiesadopted in Viet Nam are in line with thisperspective. This exploration is mainlyconfined to a conceptual level. Chapter 2will examine in more detail the country’sactual human development achievements.
HUMAN DEVELOPMENT IN VIET NAM
The human development approach showsclose resemblance to the developmentstrategies that Viet Nam has been pursuingover the last decades. The Declaration ofIndependence, which gave birth to theDemocratic Republic in 1945, explicitlystates that development should be aimed atpeople and their happiness. It stresses thatthe principal development target is to guar-antee human rights, including the right tolive in freedom and independence - freefrom oppression and slavery - the right tolive in equality, and the right to pursue andenjoy one’s own happiness. These are infact the same humanitarian values whichthe whole of mankind aspires to accom-plish, as reflected in the UniversalDeclaration of Human Rights, and morerecently the Millennium DevelopmentGoals (see box 1.2). One could considerViet Nam’s modern history as a consciousand intentional endeavour to achieve therealization of these humanitarian values.
Viet Nam’s development path has beenrather unusual. During the decades afterthe Democratic Republic of Vietnam wasestablished in 1945, the country neverexperienced real peace. In this period, itstop priority was to liberate the nation andto unite the fatherland in order to ensurethat everyone could live in national inde-pendence, peace and stability. This may be
regarded as people’s minimal rights, whichform the basis for human development.The country had to make great sacrifices tosecure that these rights were respected.After the unification in 1975, the countryswiftly shifted its focus to other prioritiesthat would more directly contribute tohuman development.
Especially the wars have affected VietNam’s choice of development path and itsresults in terms of human development.However, the adoption of the socialistmodel actually emerged from the questfor the best development path for its peo-ple. The ideals of the socialist orientationare that people themselves are the truemasters of the country, living in freedomand independence, and having opportuni-ties to develop themselves and to reachhappiness through material and techno-
17THE HUMAN DEVELOPMENT PERSPECTIVE
At the Millennium Summit (September 2000), 149 Heads of State and represen-tatives of Government (of some 180 countries including Viet Nam) adopted theMillennium Declaration, which contains the following development goals:1. Halve the proportion of people living in extreme poverty between 1990 and
2015.2. Increase food security: halve the proportion of people who suffer from hunger
between 1990 and 2015 (measured by proportion of population below mini-mum level of dietary energy consumption and proportion of under-weightunder-5 children).
3. Improve health and reduce child mortality (halt and begin to reverse by 2015the spread of HIV/AIDS and reduce child mortality rates by two-thirds by2015).
4. Improve reproductive health (reduce maternal mortality rate by three-quartersby 2015 and achieve universal access to safe/reliable contraceptive methodsby 2015).
5. Access to education (achieve universal access to primary education by 2015).6. Gender equality (empower women and eliminate gender disparities in prima-
ry and secondary education by 2005).7. Access to basic household amenities (halve the proportion of people unable to
reach or afford safe drinking water by 2015). 8. Improving the environment (implement national strategies for sustainable
development by 2005 so as to reverse the loss of environmental resources by2015).
BOX 1.2Millenium Development Goals
Source:: Mid-2001, the UN Agencies in Viet Nam published a joint Interim Report on theseMillennium Development Goals (MDGs). This report represents a first stock taking monitoring andanalysis of the MDGs and is internationally comparable (See: UN Viet Nam, 2001).
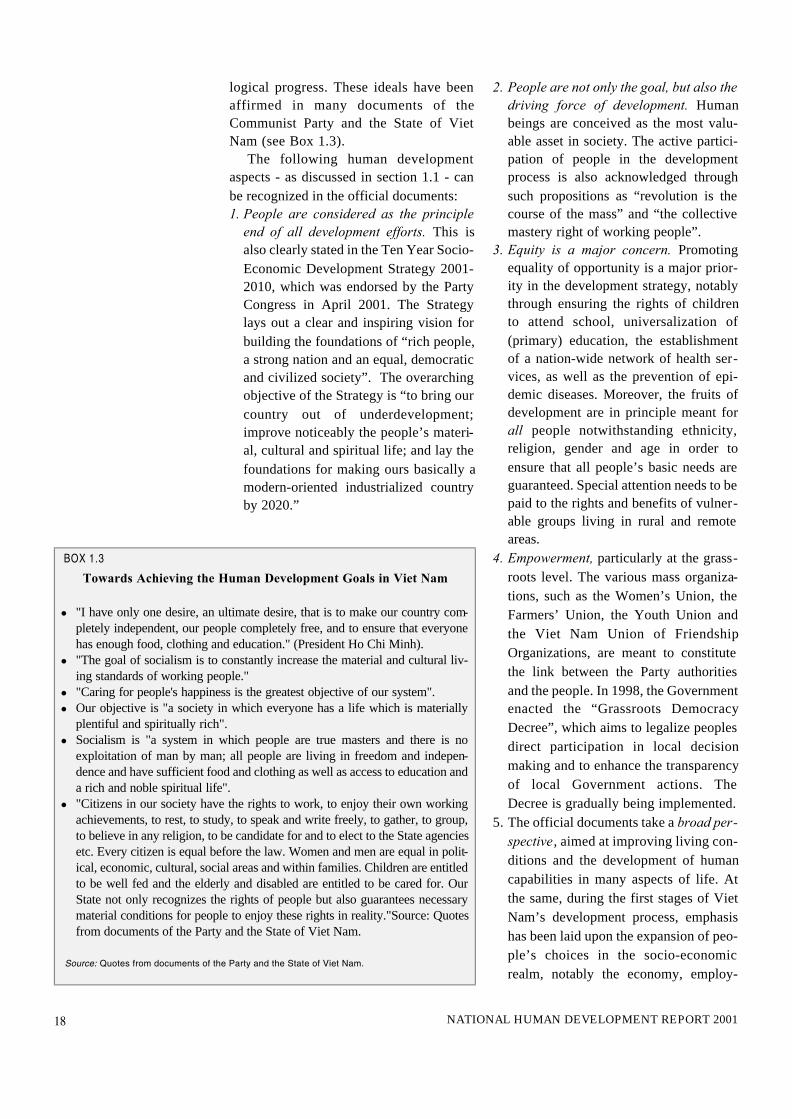
logical progress. These ideals have beenaffirmed in many documents of theCommunist Party and the State of VietNam (see Box 1.3).
The following human developmentaspects - as discussed in section 1.1 - canbe recognized in the official documents:1. People are considered as the principle
end of all development efforts. This isalso clearly stated in the Ten Year Socio-Economic Development Strategy 2001-2010, which was endorsed by the PartyCongress in April 2001. The Strategylays out a clear and inspiring vision forbuilding the foundations of “rich people,a strong nation and an equal, democraticand civilized society”. The overarchingobjective of the Strategy is “to bring ourcountry out of underdevelopment;improve noticeably the people’s materi-al, cultural and spiritual life; and lay thefoundations for making ours basically amodern-oriented industrialized countryby 2020.”
2. People are not only the goal, but also thedriving force of development. Humanbeings are conceived as the most valu-able asset in society. The active partici-pation of people in the developmentprocess is also acknowledged throughsuch propositions as “revolution is thecourse of the mass” and “the collectivemastery right of working people”.
3. Equity is a major concern. Promotingequality of opportunity is a major prior-ity in the development strategy, notablythrough ensuring the rights of childrento attend school, universalization of(primary) education, the establishmentof a nation-wide network of health ser-vices, as well as the prevention of epi-demic diseases. Moreover, the fruits ofdevelopment are in principle meant forall people notwithstanding ethnicity,religion, gender and age in order toensure that all people’s basic needs areguaranteed. Special attention needs to bepaid to the rights and benefits of vulner-able groups living in rural and remoteareas.
4. Empowerment, particularly at the grass-roots level. The various mass organiza-tions, such as the Women’s Union, theFarmers’ Union, the Youth Union andthe Viet Nam Union of FriendshipOrganizations, are meant to constitutethe link between the Party authoritiesand the people. In 1998, the Governmentenacted the “Grassroots DemocracyDecree”, which aims to legalize peoplesdirect participation in local decisionmaking and to enhance the transparencyof local Government actions. TheDecree is gradually being implemented.
5. The official documents take a broad per-spective, aimed at improving living con-ditions and the development of humancapabilities in many aspects of life. Atthe same, during the first stages of VietNam’s development process, emphasishas been laid upon the expansion of peo-ple’s choices in the socio-economicrealm, notably the economy, employ-
18 NATIONAL HUMAN DEVELOPMENT REPORT 2001
l "I have only one desire, an ultimate desire, that is to make our country com-pletely independent, our people completely free, and to ensure that everyonehas enough food, clothing and education." (President Ho Chi Minh).
l "The goal of socialism is to constantly increase the material and cultural liv-ing standards of working people."
l "Caring for people's happiness is the greatest objective of our system".l Our objective is "a society in which everyone has a life which is materially
plentiful and spiritually rich".l Socialism is "a system in which people are true masters and there is no
exploitation of man by man; all people are living in freedom and indepen-dence and have sufficient food and clothing as well as access to education anda rich and noble spiritual life".
l "Citizens in our society have the rights to work, to enjoy their own workingachievements, to rest, to study, to speak and write freely, to gather, to group,to believe in any religion, to be candidate for and to elect to the State agenciesetc. Every citizen is equal before the law. Women and men are equal in polit-ical, economic, cultural, social areas and within families. Children are entitledto be well fed and the elderly and disabled are entitled to be cared for. OurState not only recognizes the rights of people but also guarantees necessarymaterial conditions for people to enjoy these rights in reality."Source: Quotesfrom documents of the Party and the State of Viet Nam.
BOX 1.3Towards Achieving the Human Development Goals in Viet Nam
Source: Quotes from documents of the Party and the State of Viet Nam.

ment, health and education.
HUMAN DEVELOPMENT BEFORE AND AFTER
DOI MOI
From the above it may be concluded that,on a conceptual level, the official develop-ment strategy reflects various essentialaspects of the human development per-spective. It should be noted, however, thatthere is a significant difference in theapproach taken to achieve certain humandevelopment objectives, and the concept ofthe socialist model between the periodsbefore and after the Renovation (doi moi).
Before doi moi, Viet Nam’s develop-ment model was based on a centrally-planned economy. The State was consid-ered the most effective mechanism toensure the collective rights of people and toguide the development process in allaspects of socio-economic life. The objec-tives pursued by the State and the concen-tration of resources in the hands of theState had two distinct consequences. Onthe one hand, despite the country's verylow income and widespread income pover-ty, Viet Nam recorded some relativelyfavourable social achievements, particular-ly in terms of literacy, access to educationand community health care services. Otherachievements such as modest inequality,the advancement of women, and child-care activities are also worth mentioning,especially given the country’s low level ofeconomic development.
On the other hand, the concentration ofpower and resources in the hands of theState seriously inhibited individual oppor-tunities and choices, especially in the eco-nomic sphere, with the consequence thatpoverty was high and widespread. Freemarket transactions and the individual lib-erty of doing business were virtuallystamped out. Planner’s preferences over-ruled consumer needs. The basic decisionof what, how and for whom to produce wastaken directly by the State bureaucracy.The development of individual capabilitiesas well as the people’s participation insocio-economic areas was obstructed by
the “red-tape subsidized” central planningmechanism. This annulled the economicincentives necessary for innovations andefficient production activities.Consequently, the economy became slug-gish and Viet Nam’s income per capitaincreased only very slowly. The stagnatingeconomic performance, later reinforced bythe sharp fall in assistance from the formerSoviet Union, induced the country’s lead-ership to adopt doi moi.
The programme of doi moi (renova-tion) was formally inaugurated at the SixthCongress of the Communist Party ofVietnam in mid-December 1986. It wasmeant to bring about an end to the periodof stagnation and introduce a new era ofrapid economic growth. Doi moi did notimply a change in development goals asthe socialist orientation was still viewed assuperior in meeting people’s needs. Thisorientation was clearly reflected in the newslogan: “rich people, a strong nation and anequal and civilized society”. At the sametime, the doi moi policy emphasized theneed for a change in the approach todevelopment. Preserving the socialist ori-entation, the new policy was to support thedevelopment of an open market economy.
Doi moi redefined the role of the Statein development process. “Caring for peo-ple… is the responsibility of the wholesociety, each unit, each household and it isalso the aim of the Party, the State and allpeople” (Communist Party of Viet Nam,VIII Congress, 1996). The policy of reno-vation called for stepping up efforts toenable the party to ‘serve the people’,while increasing the role of the people inthe political and economic decision-mak-ing process. This was clearly expressed inanother slogan of doi moi: “people know,people discuss, people do, and peopleinspect”.
The reform process, in principle, hasallowed the State to move away from itsattempts to micro-manage the whole eco-nomic process (both "steering and rowingthe boat"), towards a role of macroeco-nomic management and of facilitating an
19THE HUMAN DEVELOPMENT PERSPECTIVE
Doi moi did not imply achange in developmentgoals as the socialist ori-entation was confirmed assuperior in meeting peo-ple’s needs. What doi moidid is to change theapproach to development.

efficient functioning of the market econo-my. At the same time, there remain sever-al areas, notably infrastructure, education,health care, environment and income poli-cy, where direct State interventions werejustified. Moreover, the increased econom-ic growth enabled the State to allocatemore resources to these sectors.
The adoption of a more market-orientedapproach took place in parallel with anactive integration into the world economy,the expansion of external trade and theattraction of foreign direct investment. VietNam gained access to the new resources,technologies, management skills and newmarkets, but had also to face increasinginternational competition. This forced theeconomy to become more efficient andmore dynamic, a process that is far fromcomplete.
In summary, doi moi in Viet Nam maybe considered as the search for and a per-fection of suitable socio-economic poli-cies and institutions in order to ensure thatdevelopment does not only serve people,but is also steered by people. In line withthe human development approach, peopleare increasingly moved towards the centreof development. Doi moi has paved theway for Viet Nam to record remarkableachievements in terms of human develop-ment during the 1990s. Although doi moiis a complex process, the country appearsto be on the right track of development forpeople’s happiness. A more detailedanalysis of these achievements will be pre-sented in chapter 2, while chapter 3 willdiscuss the significant challenges that thecountry still faces, with recommendationsin chapter 4.
1.3 GLOBALIZATION AND HUMAN
DEVELOPMENT
THE NATURE AND CAUSES OF GLOBALIZATION
Viet Nam’s human development achieve-ments of the past and the human develop-ment challenges of the future must not beconsidered in isolation, but should be
placed in the wider perspective of thecountry’s further integration into the world.Taking a Human Development viewpoint,this section briefly looks at the process ofglobalization. Recent years have witnessedan unprecedented debate on the origin andnature of globalization and particularly itspotential impact on world economic, polit-ical and social order. This is understand-able, as globalization has implications forevery nation, community and individual,while many of us have different views on it(see box 1.4).
What in general is meant by globaliza-tion? Globalization is a process of change.It is the process of an increasing number ofinteractions between people in differentcountries at an increasing intensity, madepossible by the continuous decline in inter-national transaction costs. There are twopowerful engines that drive globalization.The first is rapid technological change thatprovides new means of transport and com-munication. They have significantlyreduced the costs and increased the speedof transporting goods and people, as wellas communication between people, thuseffectively ‘shrinking’ time and space. Theglobal economy is thus becoming increas-ingly ‘weightless’. The second drivingforce is the latest wave of liberalization,which is gradually but steadily lowering allkinds of cross-border barriers, therebyfacilitating free flows of capital, goods,services, ideas, and to a lesser extent,labour between nations. The disappearingborders also imply potential threats tohuman security, such as financial volatility,international violence and crime, illegaltrafficking of women and children, and therapidly growing spread of infectious dis-eases like HIV/AIDS.
Globalization is not a new phenome-non, as earlier tides of globalization can befound in the early sixteenth century and theyears 1870-1913. However, this new waveof globalization has many new features(based on UNDP, 1999):
l New markets - foreign exchange, capitaland insurance markets are linked global-
20 NATIONAL HUMAN DEVELOPMENT REPORT 2001
Doi moi in Viet Nam is thesearch for and a perfectionof suitable socio-economicpolicies and institutions forimproving the well-being ofthe nation’s people.
Globalization offers manyopportunities to enhancehuman development for mil-lions of people around theworld. Under the right con-ditions, it can make animportant contribution topoverty reduction and sus-tainable development.However, successful inte-gration will require proac-tive policies and appropri-ate preparation in order tomaximise benefits and min-imise risks associated withglobalization.

ly, operating 24 hours a day, with deal-ings at a distance in real time.
l New tools - Internet links, cellularphone, media networks and on-line elec-tronic communication connect the wholeworld together, the knowledge economyand information society are emerging.
l New institutions: the WTO with author-ity over national governments, themultinational corporations with hugeeconomic power, increasingly strongnetworks of NGOs and new groups ofcountries such as EU, ASEAN, NAFTA,APEC, ASEM, G7, G77.
l New rules - multilateral and bilateralagreements on trade, services and intel-lectual property backed by enforcementmechanisms reduce the scope for nation-al policy.
l New values - a huge number of newproducts tailored to individual demandrather than to mass demand with infor-mation, knowledge, innovation and indi-vidual freedom as new virtues.
GLOBALIZATION AND INEQUALITY AMONG
COUNTRIES
During the last decades globalization hasplayed an important catalytic role in pro-moting growing prosperity. It could beexpected that the process of globalizationwill continue to offer many opportunitiesto enhance human development for mil-lions of people around the world. Underthe right conditions, it can make an impor-tant contribution to poverty reduction andsustainable development. Standing out ofglobalization would imply missing theseopportunities. However, actively engagingin the global integration per se does notguarantee success. Various highly integrat-ed economies have suffered from thevolatility and risks of globalization, induc-ing severe social costs or even setbacks intheir development. Successful integrationwill require proactive policies and appro-priate preparation in order to maximisebenefits and minimise risks associated withglobalization.
Over the last decades, the world hasalso witnessed another phenomenon:growing global inequality (see also box1.5). According to the UNDP’s globalHuman Development Report 1999, theincome gap between the fifth of the world’speople living in the richest countries andthe fifth in the poorest was 70 to 1 in 1997,up from 34 to 1 in 1970 (or 15 to 1 and 13to 1, respectively, when using PurchasingPower Parity (PPP) conversion rates rather
21THE HUMAN DEVELOPMENT PERSPECTIVE
"We should work together to find out measures to maximize positive aspects andminimize negative aspects of the globalization process, particularly prevent thespread of hunger and poverty in developing countries as the participation of thosecountries in the globalization process is to achieve stable and sustainable devel-opment."
Phan Van Khai, The Prime Minister of Viet Nam, 2000
Globalization is a multifaceted phenomenon, which includes the acceleration ofinternational trade, of the flows of labour, capital and technology as well as ofthe transfer of ideas and patterns of living. The impacts of globalization onhuman development must vary greatly with the nature of government policieswith, or accompanying the process of globalization.
Gala Amin, 1999
Globalization implies both increasing autonomy of actors in terms of theirexpanding range of choice as well as increasing dependency on society as awhole. The autonomy of actors increases as their independence decreases. Inother words, the process of globalization implies the transition from autonomywith exclusion (autarchy) to autonomy with inclusion [capability].
Mlinar, Montreal 1999
Globalization is an ongoing process that presents opportunities as well as risksand challenges... [It] can be a powerful and dynamic force for growth and devel-opment. If it is properly managed, the foundations for enduring and equitablegrowth at the international level can be laid.
UNCTAD Bangkok Declaration, 2000
But the main losers in today's very unequal world are not those who are too muchexposed to globalization. They are those who have been left out.
Kofi Anan, UN Secretary General.
Globalization is here to stay. …We can't turn back the clock on globaliza-tion…..Thus, the challenge to us all is to harness the positive aspects of global-ization in the cause of development and poverty reduction, and to offset its lesspositive aspects for those adversely affected. Our watchword must be "global-ization with a human face". Globalization that is inclusive. Globalization thatpromotes social equity and works for the poor.
James Wolfensohn, World Bank President, Bangkok, February 2000
BOX 1.4Views on Globalization

than exchange rate conversions).Moreover, by the late 1990s the fifth of theworld’s people living in the highest-income countries had:l 86% of the world GDP - the bottom
fifth just 1%l 82% of the world export markets - the
bottom fifth just 1%
l 68% of foreign direct investment - thebottom fifth just 1%
l 74% of world telephone lines - the bot-tom fifth just 1.5%.
GLOBALIZATION AND SOUTH EAST ASIA
The concurrence of globalization andgrowing disparities does not necessarilyimply a causal relation between the twophenomena. The same holds for the rela-tion between trade and economic growthon an individual country level. While thecorrelation between trade and economicgrowth is strongly positive (see Figure1.1), there appears to be no automatic linkbetween trade, investment and economicgrowth, whilst the nature and direction ofcausation remains debatable. The AsianDevelopment Bank (1999, p. 83) surveyedtwenty academic studies measuring theimpact of “openness” on economic growthfor samples of between 4 to 108 countriesduring 1950-1988. Five of the studies gaveweak or ambiguous results, while fifteenfound a strongly positive relationship.
More liberal and ‘open door’ policies inmany Asian countries have seen themsurge ahead of most developing countriesin recent decades in terms of both econom-ic growth and human development indica-tors. The ‘miracle’ economies of Asia,while few in numbers and small in popula-tion, have shown that substantially narrow-ing the economic gap with the developedeconomies within 40-50 years is possible,and all have done so through rapid integra-tion into the world economy. The majorunderlying factors of this success includesound macroeconomic policies, a strongreliance on domestic savings, an export-leddevelopment based on comparative advan-tages, opening up the economy to interna-tional trade and investment, actively sup-porting an enabling environment for pri-vate sector development, notably SMEs,and heavy investment in people’s capaci-ties, while preserving modest incomeinequalities (UNDP Viet Nam, 1998).
The validity of these factors has notbeen undermined by the financial crisis
22 NATIONAL HUMAN DEVELOPMENT REPORT 2001
Proponents of globalization claim thatthe process brings universal benefits,while opponents equate it with grow-ing social inequities. But what do weactually mean when we talk aboutglobal inequities? There are at leastthree distinct concepts of inequity.First there is inequality within coun-tries. It is what people mean whenthey argue that globalization may havewidened income disparities in Brazilor in the UK. Second, there is interna-tional inequality, that refers to differ-ences between countries' average percapita incomes, or gross domesticproducts. This is what people meanwhen they describe the effects of glob-alization on countries' economicgrowth rates. Recent studies estimatethat the Gini-coefficient reflectinginternational inequality has increased
from 55 in 1988 to 58 in 1993.However, such a measure hardlygauges the real extent of globalincome disparity, for it assumes thatevery Chinese and every Americanhas the same national mean income.The third concept - global inequality -combines the two previous concepts,and refers to income differentialsbetween all individuals in the world. Itis calculated that the world Gini-coef-ficient increased from 63 in 1988 to 66in 1993. Global income inequalityturns out to be greater than the inter-national inequality. Both measuresinclude countries that have integratedinto the world economy as well ascountries that stayed out of it. It istherefore hard to attribute the growthin inequality to the increasing global-ization (see box 1.6 and around).
BOX 1.5“The Truth about Global Inequality”
Source: Based upon: Matias Lundberg and Branko Milanovic, The truth about global inequality, in:The Financial Times, 25 February 2000.

that hit the Asian economies in 1997. Thecrisis itself is probably the most obviousrecent example of the potential destabilis-ing impact of globalization. It shows thatvolatility and instability are inherent fea-tures of today’s global financial system andthat resilience and flexibility are crucial toweather the crisis. Those Asian economiesthat escaped relatively unscathed wereeither particularly flexible and well-inte-grated (like Taiwan and Singapore), orwere only weakly financially integrated(like Viet Nam and Myanmar). Secondly,the crisis showed that opening the financialsystem to the world, especially for short-term capital flows should be proceededwith care when domestic financial institu-tions and prudential supervision of thefinancial sector are weak. This was exacer-bated by the state-influenced lending prac-tices, either though explicit or implicitguarantees on loans to the banking and cor-porate sectors. Thirdly, it should be notedthat some of the problems that the Asiancountries faced arose because governmentsdid too much in some areas (eg. state-directed and state-guaranteed bank credit),and too little in a number of other impor-tant areas. In the latter case, the state has animportant role in preventing and resolvinginformation failures; enforcing legalrequirements related to transparency,accountability and reporting of corpora-tions; and prudential supervision of finan-cial markets to minimize the likelihood ofmarket failure.
Although the Asian crisis has had a sig-nificant effect on Viet Nam especiallythrough slowing down of exports anddirect foreign investment inflows, overall ithas weathered the crisis reasonably well.Not that the problems that have been iden-tified as the key culprits are totallyunknown in Viet Nam. But the country wasable to avoid most of the trouble by steer-ing clear of international financial markets,maintaining strict controls on foreignexchange transactions, and relying chieflyon foreign direct investments for foreigncapital rather than portfolio investments.
Further openness will have to be managedcarefully. At the same time, not opening upmay involve considerable costs.
GLOBALIZATION AND INEQUALITY WITHIN
COUNTRIES
Globalization not only brings about risks
23THE HUMAN DEVELOPMENT PERSPECTIVE
l Trade policy affects (income)poverty within a country through itseffects on both growth and incomedistribution. The effects of trade onincome distribution have been morefirmly established than its impacton economic growth. This in factmakes trade liberalization a hardreform for policy makers to imple-ment.
l Empirical research shows thatdeveloping countries applying moreopen trade regimes have enjoyedhigher growth rates than thoseimplementing restrictive policies.This conclusion depends cruciallyon how openness is defined. Whenit only includes measures taken atthe border of countries, then growthseems to be nearly unaffected bygreater openness. When openness ismeasured by a wider range of poli-cies - including the level and vari-ability of barriers, distortions in thereal exchange rate (as a proxy forinternational competitiveness),degree of state monopoly of majorexport products, forms of govern-ment - then growth appears to beboosted whenever a country movestowards a more open regime.
l The trade and growth literature alsofinds that an open and transparenttrade policy can foster external dis-cipline, helping to reduce distor-tions on domestic markets, and tonarrow the scope for wrong orunbalanced policies in other areas -'locking in' policy reforms - as wellas rent-seeking and corruption
which do not normally favour thepoor. It is also clear that without acomprehensive strategy involvinginvestment in human resources,infrastructure and the rule of law,freer trade alone does not guaranteesustained growth rates.
l Economic research has establishedthat trade liberalization has a strongredistribution impact on variousincome groups. The standard resultis that if trade barriers benefit therelatively well-off by, for instance,protecting import competing sectorscontrolled by capital owners orskilled and often urban labour-intensive sectors, then trade liberal-ization is likely to redistributeincome to the poor. However due tothe lack of data and the difficulty inisolating trade liberalization fromother reforms and shocks, ourinsight in the systematic linkbetween open trade policy and morepro-poor income distribution is stilllimited.
l A policy of trade liberalization inprinciple can produce positiveeffects on GDP growth and incomedistribution and, abstracting fromthe complex links between growthand inequality, it should in turnhelp reduce poverty. Of course, thefinal result will vary from one caseto another. Needless to say, in orderto benefit from trade, poor peopleneed to interact with markets.Furthermore, it has become clearthat, especially in the long run, pro-tection rarely helps the poor.
BOX 1.6Trade Liberalization and Poverty
Source: Maurizio Bussolo and Henri-Bernard Solignac Lecome, 1999. Trade Liberalization andPoverty, ODI Poverty Briefing.

to the whole economy, but also affects theincome distribution within countries. Aninequitable distribution of benefits andcosts may lead to a greater divide within asociety, and can eventually compromisesocial and political stability. In particular,while the country as a whole is expected togain, certain interest groups will sufferfrom lower tariff rates, reduced non-tariffbarriers, investment liberalization, andoverall increased competition. In variouscountries, for example in China, Indonesiaand Thailand, income disparities havegrown with the increasing integration,although in many cases poverty has fallenas well. In general, it is hard to establish asystematic link between (changes in) tradeand (changes in) income distribution. Thelevel of income disparity in an economymight have as much to do with history,economic growth, price and wage con-trols, welfare programmes, and educationpolicies as it does with globalization ortrade liberalization, although it is compli-cated to unravel such complexities andinterrelations.
The available data nevertheless indi-cates that emerging market countries thatare highly globalized (such as Poland,Israel, the Czech Republic, and Hungary)exhibit a much more egalitarian distribu-tion of income than emerging marketnations that are characterized by a lowdegree of globalization (such as Russia,China, and Argentina). There are someexceptions: Malaysia for example, is moreglobalized but less equal than Poland. Butthe general pattern of higher globalizationand greater income equality holds formany countries, both in mature economiesand emerging markets. These findingsshould reinvigorate the debate overwhether countries are poor and unequalbecause of globalization, or because theyare not globalized.
GLOBALIZATION AND TECHNOLOGICAL
CHANGE
In telecommunication, the invention andrapid development of the world wide web
has brought about for the first time in thehistory of mankind opportunities for peo-ple all over the world to find, access, con-nect, exchange, and discuss informationwithout any constraints. Today, theInternet has become a product that is notpossessed by an individual country, and noinstitution can prevent its development.The development of the Internet will radi-cally change management structure andstyle (see box 1.7).
GLOBALIZATION AND CULTURAL INTEGRATION
Cultural integration is taking place inten-sively and globally. This cultural integra-tion is also driven by strong developmentof information and communication tech-nology, intensification of culture exchangeacross-border, the availability of satellitetelevision, international migration andtourism, and rapid expansion of transna-tional corporations. People learn from eachother new business culture and workingstyles. This kind of cultural interaction and‘transfer’ has an important impact on peo-ple’s lifestyles. This impact is not only pos-itive as it may also result in some loss ofcultural diversity.
But even though the process of interac-tion and integration is moving at an incred-ible pace, people do not appear to becomemore alike. People, with their own culturalheritage, remain distinguishable from oth-ers and appreciate culture flows individual-ly. Furthermore, culture dissemination andexchanges are undertaken differently withcomplicated interactions, mutual accep-tance and enrichment. Every culture willhave its own place in a rapidly changingbut ever enriching global culture. Localcultures by themselves also have beenrestored, preserved and affirmed throughraising recognition of traditional culturalvalues. A well-entrenched sense of cultureand nationalism is probably not going to be“blown away” by globalization.
GLOBALIZATION AND THE NEED FOR NEW
CAPACITIES
Globalization brings about both benefits
24 NATIONAL HUMAN DEVELOPMENT REPORT 2001
Global integration canopen the path to sustain-able development – to“catch up” – but the speedof the journey is deter-mined by the strength anddetermination of thosewho are walking.

and risks. Integration may be regarded as anecessary but not sufficient condition for“catching up” to the human developmentlevels of wealthier countries. But it alsohas its costs. Moreover, integration andfaster development imply faster rates ofsocial and economic change. It is a processof enhanced “creative destruction”.
Global integration does, however,bring with it some loss of economic poli-cy autonomy. As they say, when you join ateam, you cannot play by your own rules.The many international rules, agreementsand conventions impose constraints on thescope to use certain policy instruments.Furthermore, countries engaging in inter-national integration need to implementcertain reforms in wide-ranging areas suchas tariff reductions, service sector compe-tition, labour and environmental regula-tions, intellectual property rights and theprovision of adequate information.Successful integration demands a flexibleeconomy that can respond quickly andeffectively to any fluctuations of global-ization. Ability to change is the main fac-tor for successful integration, maximizingbenefits and minimizing risks. But ratherthan a surrender of national sovereignty,this should be seen as an exercise of sov-ereignty, to strengthen the nation’s capaci-ty to determine its own future.
GLOBALIZATION AND HUMAN DEVELOPMENT
Global integration brings economic growthfrom increased efficiency, specialization,and most importantly, a faster rate of tech-nology transfer. Such growth, however, isnot necessarily equitable, and improve-ments in health and education may lag.More significantly, human developmentitself is a determinant of growth. For glob-al integration is a process of expanding theenabling environment for people – morechoices, more opportunities, more ideas.
Human development, or the capabilities ofpeople, determines how quickly theexpanded environment is being filled withproductive activity. In other words, globalintegration can open the path to sustainabledevelopment – to “catch up” – but thespeed of the journey is determined by thestrength and determination of those whoare walking.
25THE HUMAN DEVELOPMENT PERSPECTIVE
l Technology is a tool for develop-ment – not just a reward of develop-ment. It has been central to humanprogress over the past century andmust be a part of the developmentagenda in the next. But the marketalone will not produce the technolo-gies needed for development nordeliver them to the people who needthem. Public investment and publicpolicy to turn technology to theneeds of development is essential.New technologies are changing thedevelopment environment by com-bining with globalization to createthe network age. Countries need torespond to the opportunities andchallenges that this creates.
l Biotechnology has much potentialfor development, in health and agri-culture. But the risks and rewardsvary from country to country andthe dilemma for many developingcountries is that though the poten-tial benefits may be great, so too arethe challenges of managing therisks well. The dilemma, however,is that making safe use of modernbiotechnology requires biosafetycapacity, with regulation, testing,public communication and debate.This is an extra challenge for most
developing countries because oftheir relative lack of skilled person-nel and weaker communicationsstrategies needed to enable a publicdialogue. Hence the greater theneed to give them support to buildup this capacity.
l Education is critical: many coun-tries need to re-examine their pri-orities and focus. Unleashinghuman creativity is central to acountry’s ability to join the net-work age, and that starts with edu-cation. Developing countries needto reassess their education strate-gies, re-evaluating the importanceand role of secondary and tertiaryeducation in enabling them tobuild up a national technologicalcapacity. But at the same time, in aglobalizing market for highly-skilled labour, it is a growing chal-lenge for developing countries tohold on to the students that theytrain: the demand for such skills inthe global market induces a braindrain. That outflow can be benefi-cial, if it becomes a critical massand creates a diaspora that bringshome not only remittances but alsoventure capital, skills and a strongreputation.
BOX 1.7Making New Technologies Work for Development:
Global Human Development Report 2001
Source: Some of the main messages taken from: UNDP, 2001. Human Development Report 2001:Making New Technologies Work for Human Development

This chapter reviews in greater detailthe achievements of the doi moireform process launched in 1986.
The first two sections argue that most ofdoi moi’s success has been based onimproving the enabling environment inorder to expand people’s choices, particu-larly in the non-State sector. This is reflect-ed in the strong improvement of the‘Human Development Index’ (HDI),which measures the achievements in thekey areas of human development, i.e. stan-dard of living, health and education. Thesubsequent two sections cover the mostimpressive accomplishments: the halvingof poverty from more than 70 per cent inthe mid-eighties to less than 37 per cent inrecent years, and the progress made inhealth and education. Over the last tenyears, life expectancy increased to 68 yearsand adult literacy further improved to 94per cent. But major challenges remain.These will be addressed in the next chapter,which particularly focuses on socio-eco-nomic disparities in Viet Nam.
2.1. THE DOI MOI REFORM PROCESS AND
HUMAN DEVELOPMENT
Before doi moi, Viet Nam was a countrywith a low development level, heavilydamaged by the war. Both its economy andits society were dominated by traditionalagriculture. The State had grounded itsdevelopment policies on the principles ofcentral planning and collective ownership.This allowed the State to take an activepart in mobilizing and allocating nationalresources to achieve social aims. Despiteits low level of economic development,
Viet Nam was able to realize fairlyremarkable human development achieve-ments, especially in the areas of educationand health.
However, by the early 1980s, the weak-nesses in the central planning model beganto manifest themselves. Information wasinadequate or distorted, incentives wereweak or non-existent, and resources wereallocated inefficiently. Economic growthstagnated, inflation rose rapidly, chronicshortages in basic consumption goodsstarted to occur, and public financesderailed. People had very limited opportu-nities to enjoy meaningful jobs and to earndecent incomes. The situation was exacer-bated by the drying up of aid from the for-mer Soviet Union and the collapse of theCMEA-system. The socio-economic crisismade it clear that the prevailing systemseverely restricted individual initiatives.
In light of the emerging crisis, the Stateimplemented some market-orientedreforms, mostly at a micro-level, in orderto ease the ties of the mechanism of ‘cen-tral planning, subsidization and bureau-cracy’. Most notable were the piloting ofthe ‘three-plan system’ for SOEs - startingin 1979 - and the authorization of ‘outputcontracts’ (khoan san pham) in agriculture.These measures gave enterprises andfarmer households the autonomy to buyand sell through free market transactions.Yet, the microeconomic reforms appearedto be insufficient. Although economicgrowth picked up again, persistent macro-economic instability prevailed, with infla-tion well into triple digits. Overall, peo-ple’s living standard remained very low.Moreover, the failure of the ‘price, wages
27DOI MOI AND HUMAN DEVELOPMENT
CHAPTER 2
Doi moi and Human Development
By the early 1980s, theweaknesses in the centralplanning model began tomanifest themselves.Information was inade-quate or distorted, incen-tives were weak or non-existent, and resourceswere allocated inefficiently.People had very limitedopportunities to enjoymeaningful jobs and toearn decent incomes.

and money’ reforms in 1985 proved thatsuccessful macroeconomic reforms werenot possible unless the central planningmodel itself, together with the old way ofthinking, were transformed.
The Sixth Party Congress held inDecember 1986 officially endorsed the doimoi programme. It adopted a comprehen-sive reform package with the aim to build‘a wealthy nation, a powerful country andto establish an equitable and civilized soci-ety’. The major components of doi moiincluded the transition from central plan-ning to a market economy with a socialistorientation, and the implementation of anopen-door policy to facilitate Viet Nam’sactive and gradual integration into regionaland global communities.
It is evident that doi moi – with its focuson expanding people’s choices and reduc-ing human poverty - had a human develop-ment mission. It was a breakthrough inproviding a new policy framework that cre-ated a more favourable environment to pro-
mote people and communities to engageactively in all socio-economic activitiesThe reforms started to be implemented inlate 1987 and were accelerated in 1989.Table 2.1 presents the major landmarks, interms of both new policy intentions andactual results.
REFORMS AND RESULTS
The success of doi moi is reflected in thestrong improvement of Viet Nam's HDI andthe country’s international ranking (box 2.1and table 2.2). Table 2.3 compares VietNam’s human development performancewith that of some other Asian countries. Onthe one hand, it shows that Viet Nam is stillconsiderably lagging behind some otherAsian economies, in spite of some ‘catch-ing up’ over the last decade. On the other, itoutperforms countries with similar averageincomes. In line with the human develop-ment perspective, Viet Nam’s developmentpath has been fairly balanced.
28 NATIONAL HUMAN DEVELOPMENT REPORT 2001
TABLE 2.1 Landmark reform and achievements during doi moi
Year
1978
1981
1985
1986
1987
1988
1989
1990
Major reforms
"Three-part" planning for SOEs
"100" contracting (product contracting) for farmer house-holds
"Price, wages and money" reform
The Sixth Party Congress announced its programme ofrenovation (doi moi)
The first Foreign Investment Law Open-door policy acceler-atedEnactment of Land Law which established agricultural land-use rightsIntroduction of more market-determined exchange rate
Establishment of two-tier banking system Adoption ofResolution 10 on agricultural land-use rights of farmerhouseholds
Removal of two-tier price system Abolishment of quotas formost commodities, except for ten exports and fourteenimports Unification of exchange rate system
Foreign Investment Law amendedApproval of Law on Central Bank, State-owned banks andcredit institutions
Major achievements
SOEs were given more autonomy; market relationshipsstarted to be established
Farmers were given more autonomy in producing and sell -ing their products
Hyperinflation. Planned price system removed, old currencysystem replaced
Launching of doi moi reform process.Breakthrough in economic development thinking, promotinga multi-sector economy with the leading role of the statesector. Transition to a market economy with state manage-ment started
Popularization of new thinking in society
Approval of first joint-ventureExport reached US$1 billion mark for the first time ever
From a rice net importing country, Viet Nam became thethird largest exporter in the worldHigh inflation was curbed
Twenty million tons of grains were producedTwo million tons of crude oil was extracted Total accumulated FDI licence approvals surpassed US$ 1 billion
Doi moi as a process ofexpanding people’s choic-es and reducing humanpoverty - had a humandevelopment mission, pro-viding a new policy frame-work that created a morefavourable environment topromote people and com-munities to engage active-ly in all socio-economicand social activities.

29DOI MOI AND HUMAN DEVELOPMENT
TABLE 2.1 (Continued)
1991
1992
1993
1994
1995
1996
1997
1998
1999
2000
2001
Corporate Law establishing a new framework for activities ofliability limited and joint-venture companies approved
Private companies were entitled to export and import directly
Adoption of New Constitution which officially recognized themulti-sector economy Trade Pact with EU signedExperiments with Equitization of SOEs Hunger Elimination and Poverty Programme (HEPR-pro-gramme) started
Amendments of Land Law Approval of Bankruptcy Law and Environment Law Removalof US's embargo against Viet Nam
Enactment of Labour Code Export licenses for most of goods except rice, wood andcrude oil removedNational Program of safer water and environmental sanita-tion launched
Law on State-Owned Enterprises approved Number ofimport goods controlled by quotas reduced to seven
Regulations on Industrial Property Protection issuedEighth Party Congress debates leading role of SOE sector
All barriers against internal trade of rice removedPrivate enterprises granted licenses to rice export subject tocertain conditionsAdoption of National Action Plan for Women Advancement
New range of non-tariff measures and exchange controls torestrain imports and protect domestic production temporarilyintroduced Implementation of Programme to support most difficult com-munes Start of National Target Employment Programme Approval of Grassroots Democracy Decree
Decree 57 which liberalized export-import rights passedApproval of New Enterprise LawIntroduction of VAT Acceleration of SOE equitization programme
New Enterprises Law becomes effectiveBilateral Trade Agreement with US signedOpening of the Viet Nam Stock Exchange
Ninth Communist Party Congress adopts the Ten YearSocio-Economic Strategy 2001-2010
The industry sector grew by nine per cent
Total accumulated FDI licence approvals surpassed US$ 5billion mark.The number of SOEs reduced while that of private enter-prises began to rise.The literacy rate reached around 87 per centNational program for hunger elimination and poverty reduc-tion (HEPR) started
Poverty survey indicates that poverty declined from wellover 70% to 58% since mid-1980s;First mobile telephone put in use.Relationships with broader international donor communityre-established: first International Donor Conference held inParis
Viet Nam became a member of ASEANTotal accumulatedFDI licence approvals surpassed US$ 10 billion
AFTA membership grantedExport value reached US$5 billion mark Relationship withUS normalized GDP growth rate 9.5 per cent
Total FDI licence approvals reaches US$27 billion, whileGDP growth rate was 9.3 per cent
Rice exports reach level of 3 million tons Crude oil production passed 10 million tons markInternet was first used
Over ninety per cent of children were vaccinatedAnnualpopulation growth rate below two per cent Based on the Viet Nam Living Standard Survey, overallpoverty drops from fifty-eight per cent in 1993 to thirty-seven per cent in 1998APEC membership grantedLiteracy rate increases to 89.4 per centTotal registered FDI passed US$ 30 billion
Rice exports reach 4.5 million tonsViet Nam was granted UN's award for achievement in thefield of population and family planning Life expectancy at birth reached 68.3HDI ranking : 101 outof 162 countries
Economic growth picks up to 6.7 per centNearly 15,000 private enterprises established Adult literacy rate is 94 per cent
IMF and World Bank resume structural adjustment lendingto Viet Nam
Economic growth is at around seven percent ranked secondin the region. Socio-political stability maintainedNearly23,000 private companies have been established with 25,000billion VND of capital, providing nearly 500,000 newjobsApproved a program of SOE reform in the period 2001-2005WB and IMF resumed structural lending.
Year Major reforms Major achievements

Doi moi has galvanized the talents andenergy of millions of people, stimulatedrapid economic growth, curbed inflationand promoted export as well as foreigninvestment. These remarkable achieve-ments should not hide the fact that doi moiis a complex and difficult process. VietNam has had a relatively low startingpoint. Furthermore, as an economy in tran-sition, the old way of thinking in terms ofcentral planning and collective ownershiphas remained highly influential, and theState sector is still inefficient. Moreover,the country will have to take up new chal-lenges, such as further integration into theworld economy and the establishment of aknowledge economy.
2.2 DOI MOI: EXPANDING ECONOMIC
CHOICES AND OPPORTUNITIES
For a variety of reasons unemployment andunderemployment have been and remainsevere problems in Viet Nam. First, there isa serious imbalance between an abundant,young, ready-to-work labour force on theone hand and relatively scarce otherresources such as land and capital on theother. Secondly, the current pattern oflabour utilization is inefficient, due to thedistortions caused by State policies andinstitutions often still reflecting a control-ling rather than facilitating role. Thirdly,despite the general excess supply in the
30 NATIONAL HUMAN DEVELOPMENT REPORT 2001
TABLE 2.2 Viet Nam's Human Development Index over time
Human Development Report* 1995 1996 1997 1998 1999 2000 2001
(Reference year) (1992) (1993) (1994) (1995) (1997) (1998) (1999)Life expectancy at birth (years) 65.2 65.5 66.0 66.4 67.4 67.8 67.8Adult literacy (%) 91.9 92.5 93 93.7 91.9 92.9 93.1Combined enrolment rate (%) 49 51 55 55 62 63 67Real GDP per capita (PPP US$) 1,010 1,040 1,208 1,236 1,630 1,689 1860Human Development Index (value)* 0.611 0.618 0.634 0.639 0.666 0.671 0.682Human Development Index (rank)* 120 121 121 122 110 108 101
* The data are taken from international sources, and may therefore deviate from national data. Due to changes in the methodology and different sets of countries,the HDI ranking is not fully comparable over time. The HDI-values are based on a recalculation of the HDI using the latest methodology. Source: UNDP, Human Development Reports 1995-2001, own calculations.
TABLE 2.3 HDI ranking for selected countries (1999, out of 162 countries)
Combined Real GDP Country HDI rank Life expectancy Adult literacy enrolment ratio per capita
(years) rate (%) (%) (PPP$) HDI
Japan 9 80.8 99.0 82 24,898 0.928Hong Kong 24 79.4 93.3 63 22,909 0.880Singapore 26 77.4 92.1 75 20,767 0.876Malaysia 56 72.2 87.0 66 8,209 0.774Thailand 66 69.9 95.3 60 6,132 0.757Philippines 70 69.0 95.1 82 3.805 0.749China P. R. 87 70.2 83.5 73 3,617 0.718Viet Nam 101 67.8 93.1 67 1,860 0.682Indonesia 102 65.8 86.3 65 2.857 0.677India 115 62.9 56.5 56 2,248 0.571Myanmar 118 56.0 84.4 55 1,027 0.551Cambodia 121 56.4 68.2 62 1,361 0.541Lao PDR 131 53.1 47.3 58 1,471 0.476
Source: UNDP, Human Development Report 2001, pp. 140-143.

31DOI MOI AND HUMAN DEVELOPMENT
In its global Human Development Report, UNDP annually cal-culates the HDI in an attempt to measure the level of humandevelopment and changes therein for almost all countries in theworld. Though concepts are always broader than their measures,the HDI captures three essential dimension's of people's well-being, and is based on the following indicators: (a) life expectan-cy at birth to reflect people's capability to lead a long and healthylife; (b) a combination of adult literacy rate (two-third weight)and the combined gross primary, secondary and tertiary enrol-ment ratio (one-third weight) as an expression of people's capa-bility to acquire knowledge; and (c) GDP per capita (PPP $) as aproxy for people's standard of living.
Calculating the HDI is rather straightforward. The data forevery component is normalized, i.e. values are put on a scalebetween a minimum and maximum. These are derived fromactual observations in the world (in case of life expectancy with25 years as the minimum and 85 years as the maximum or objec-tively fixed (such as the enrolment and literacy rate with a mini-mum of 0% and a maximum of 100%). It shows how far a coun-try has proceeded on the path from the minimum to the maxi-mum. In mathematical terms, every component has its ownindex: I = (actual value - minimum value)/(maximum value -minimum value). Income enters in to the HDI as a surrogate formany of the dimensions not captured in the health and educationindicators. To reflect that a respectable level of human develop-ment does not require unlimited income, GDP per capita incomeis discounted by using the log values with a minimum $100 and
a maximum of $4,000. The HDI then represents the simple aver-age of the individual indices with equal weights.
The advantage of the HDI is that it is 'broader' than GDP percapita. Thinking about development should not be preoccupiedwith material well-being alone, but ultimately focused on enlarg-ing people's capabilities and choices. A disadvantage is that it
does not express possible differences in well-being between menand women. To this aim, UNDP has also developed a gender-related human development index (GDI). The GDI uses the samevariables as the HDI, but includes an adjustment for the dispari-ty in achievements between men and women; countries are 'pun-ished' with a lower index when women enjoy fewer benefits thanmen.
And the HDI should also be 'deeper', reflecting socio-eco-
nomic disparities within the country, as there is no automatictrickle-down of the fruits of development from the growth cen-tre(s) all over the country and its people. Chapter 3 therefore pre-sents some (composite) human development indicators for all 61provinces in Viet Nam to reflect the socio-economic inequalitiesacross the country. Not surprisingly, the figures show that HaNoi and Ho Chi Minh City rank highest in terms of human devel-
opment. More remarkable is that they reach levels of humandevelopment comparable to those of successful transitioneconomies like Poland, Estonia and Croatia. At the lower end,however, provinces like Ha Giang and Lai Chau fail to scoremuch better than Laos, Bhutan and Nepal.
BOX 2.1On the Human Development index (HDI)

labour market, there are shortages ofskilled labour.
AGRICULTURAL REFORMS
Overall, doi moi can also be viewed as aprocess of enlarging employment opportu-nities and enhancing labour productivity.The product contracting system adopted in1981, the household contracting systemimplemented in 1988, together with otherreform measures such as price liberaliza-tion, exchange rate unification in 1989 andthe adoption of New Land Law in 1993helped to dissolve inefficient cooperativesand to expand the opportunities of farmerhouseholds. They started to enjoy land userights and had much greater choice on howto best use and manage agricultural land.As well as the move from monopoly tradepolicy towards competition and price liber-alization, domestic commodity marketshave been established and developed,while international trade has graduallyincreased. Agricultural products can nowbe sold across the country, and fertilizers,petrol, and other agricultural inputs havebecome widely available in rural areas.
The market for land-use rights has alsobeen formed and developed, and is particu-larly vibrant in the Mekong River Deltaand the Central Highlands. In theseregions, residents’ access to bank credithas improved, although borrowing fundsfrom formal credit sources remains diffi-cult since the real estate market is stillunderdeveloped. Nevertheless, recentreforms by the State Bank including easingcollateral requirements and providing moreautonomy to commercial banks haveimproved the access to formal creditsources for rural people. The annualgrowth rate of agricultural credit is around25 per cent. More than half of all farmerhouseholds have access to credit.
Opening up and economic integrationhave further helped to broaden markets foragricultural products and ease farmers’access to agricultural inputs and to newsources of capital, technology and manage-rial skills. From being a net importer of
rice in the eighties, Viet Nam is now thesecond largest rice exporter in the world.Exports amount to 95 per cent of total out-put for coffee, one hundred per cent forcashew, eighty to eighty-five per cent forrubber, ninety per cent for pepper and fiftyper cent for tea. Hence, the opening of theeconomy has been very important in pro-moting agricultural production and produc-tivity and thus incomes in many ruralregions, as was for example witnessed bythe paddy growers in An Giang province(Box 2.2). However, the exposure to theworld market also implies that farmers aremore vulnerable vis-à-vis internationalprice fluctuations, e.g. in the case of coffeeand rice in the first half of 2001.
With the benefit of hindsight, one mayconclude that agriculture was relativelywell placed to respond to the incentivescreated by reforms. In this sense, the tran-sition in Viet Nam has been quite differentfrom, and smoother than, that in Centraland Eastern Europe and the former SovietUnion. These countries were not denselypopulated rural economies, but highly,albeit inefficiently, industrializedeconomies. Dismantling the old industrialstructure involved problems of time, sacri-fice, costs and politics, which China andespecially Viet Nam have not had to con-tend with.
The reforms also facilitated more diver-sified production. Whereas rural develop-ment had been dominated by rice mono-crop production in the past, many agricul-ture activities based on natural advantagesof each region have been flourishingthroughout the 1990s. Good examples arethe substantial growth of aquaculturebreeding in coastal areas, coffee and rubberplanting, and cashew production in theCentral Highlands and the South East. Atthe same time, many new occupationsemerged thanks to new market opportuni-ties. These include growing flowers andornamental trees in the outskirts of Ha Noi,Nam Dinh, Hai Phong and Ho Chi MinhCity, planting fruit trees and raising deer inNghe An and Ha Tinh.
32 NATIONAL HUMAN DEVELOPMENT REPORT 2001
Opening up and economicintegration have furtherhelped to broaden mar-kets for agricultural prod-ucts and ease farmers’access to agriculturalinputs and to new sourcesof capital, technology andmanagerial skills. Frombeing a net importer ofrice in the eighties, VietNam is now the secondlargest rice exporter in theworld.

ECONOMIC RESTRUCTURING
Reforming the State sector by giving moreautonomy to enterprises, encouraging theprivate sector development, creating incen-tives for foreign investment and providingbetter access to foreign markets haveresulted in a new economic structure and amore efficient human resource allocation.During doi moi, more jobs were createdthan in the past when the State and SOEswere the only employers and employeescould not freely choose jobs.
During the period of 1991-1999, thenumber of employed people rose from 30.9million to 39.4 million at an annual rate ofthree per cent. Nine out of every ten newjobs were created in the non-State sector.The State created around five per cent ofnew jobs, slightly more than the newlyemerging FDI-sector. Thus the domesticnon-state sector has been the most impor-tant sector in the direct provision ofemployment opportunities. This sector alsohas great export potential. Data for non-oilexports for the period 1997-99 show thatthe non-State sector’s export volume grewby more than seventy-two per cent whilethe export volume of SOEs rose by lessthan five per cent. Particularly in textileand leather footwear, Viet Nam witnessed astrong growth of labour-intensive exports.
However, it should be noted that with89 per cent of total employment, thehousehold and farm sector is still domi-nant. The share of the corporate privatesector in total employment remains small,accounting for only 1.4 per cent. Thisrelates to the fact that private enterprisesare small in size; only one per cent of theseemploy more than one hundred people.The weak development of the private sec-tor is also reflected in the fact that 78 percent of enterprises are concentrated in onlyfour industries, i.e. food processing, woodproducts, garments and ceramics and glassindustries.
The high and labour intensive growth inthe nineties helped to reduce the urbanunemployment rate from 9-10 per cent in
1991-1992 to about 5.9 per cent in 1996.The Asian crisis pushed the official unem-ployment rate up to 6.9 per cent in 1998and further to 7.4 per cent in 1999, withsome recovery to 6.4 per cent taking placein 2000. While the growth of labourdemand might have slowed down, theincrease in labour supply remains struc-turally high with about 1.3 million newlabour market entrants every year.
The new economic structure has givenbirth to new labour relations which in turnhas led to more efficient human resourceallocation and better utilization of workers’potential. Also, competition has increasedamong the SOE sector, private sector andthe FDI sectors in attracting skilled andwell-trained employees. As a consequence,incomes of employees have improved sig-nificantly. Income per capita has more than
33DOI MOI AND HUMAN DEVELOPMENT
In a survey in Chau Thanh district, An Giang province, researchers asked peopleto compare their present lives with their lives ten years, five years and two yearsago. The findings are presented in the figure below. Most people agreed that theirliving standards had improved. A few people, however, had seen their life dete-riorate over the last ten years mostly because they had very little land. Averageland per capita of these households were around 500 square metres or only one-fifth of the overall average. A very low percentage (about four per cent) claimedthat their lives were much worse than ten years ago. These households, oftenwithout land, had a high number of small children or had frequently sufferedfrom diseases in their families.
BOX 2.2Life Has Been Changed for the Better in An Giang
Source: ActionAid, 1999

doubled over the last fifteen years andaccording to the annual living standard sur-veys, average monthly income per capitagrew by some 75 per cent in the period1994-1999. Incomes increased by 130 percent in urban and 60 per cent in rural areas,implying an increasing urban-rural incomegap. Finally, together with higher incomes,people now find themselves in a position tochoose from a much wider range of goodsand services with a higher quality thanbefore the doi moi programme.
In addition to implementing institution-al and macroeconomic reforms, the Statehas also put in place a series of national tar-get programmes for employment creation,in particular for disadvantaged groups.Over the period 1992-1999, the NationalProgramme on Employment has funded91,621 projects with a total loan amount ofnearly three trillion VND, reportedly creat-ing jobs for more than 2.6 million people(MOLISA 1999). There are many othernational programmes which contributedirectly to the creation of employment andincome generating opportunities, such asthe Five Million Hectares of Reforestation,Programme 135 for the remote areas par-ticularly through investment in infrastruc-ture, and the National Programme onHunger Eradication, Poverty Reductionand Job Creation.
In concluding this section, two charac-teristics of employment growth during thedoi moi period can be identified. First, thetransition to a market economy and a moreopen economy has been effective in
unleashing much of the potential of theVietnamese people. Although still subjectto a relatively unfavourable environment,the private sector turned out to be mostefficient in creating new and sustainablejobs. Promoting the private sector is there-fore a crucial component of a human devel-opment strategy. Secondly, the State has toacknowledge that it is no longer the only orbest provider of jobs. Instead, it will haveto focus on a more indirect role by estab-lishing and supervising institutions thatfacilitate a proper functioning of the labourmarket. Needless to say, the State will keepthe special responsibility to ensure theavailability of accessible and affordablesocial services.
2.3 IMPRESSIVE POVERTY REDUCTION
Prior to doi moi, average per capita incomewas about US$170 per year, and over sev-enty per cent of the population was consid-ered poor. The wide-spread poverty wascaused by a number of factors. First of all,there was an evident lack of opportunitiesfor people to generate and increaseincomes, particularly due to the dominanceof the central planning mechanism. A sec-ond and related factor was the strongemphasis on job security and equal livingstandards, undermining people’s workincentives. Thirdly, people’s capabilitieswere not adequately developed to copewith risks. Most of the people in Viet Namlive in rural areas and rely on agriculture.They lack a margin of security against
34 NATIONAL HUMAN DEVELOPMENT REPORT 2001
TABLE 2.4 GDP and Employment by Type of Ownership
(percentages) GDP by Ownership Employment by Ownership
Share in 1999 Growth 1996-1999 Share in 1999 Growth 1996-1999
Total GDP 100.0 7.0 100.0 3.4Public (State & collective) 49.4 6.9 9.0 1.5Non-State (Total) 40.5 5.1 90.4 3.4
Households & Farms 33.2 4.9 89.0 3.3Private Companies 7.3 9.7 1.4 12.1
Foreign Invested Companies 10.2 18.1 0.6 38.5
Source: GSO, 2000.
The achievements inreducing poverty in VietNam have been impres-sive, by any standard.Poverty incidence fellfrom well over 70% in themid-1980s to around 58per cent in 1993 and fur-ther to an estimated 37per cent in 1998.

overwhelming contingencies, such asdrought, floods, storms and other hazards.This is related to the low use of moderntechnologies, insufficient diversificationand limited financing capacity.
Socio-economic inequality betweenpopulation groups was relatively low. Thiswas possibly the result of a developmentpolicy that put equality as the first concern,expressed in the motto “shortage is no con-cern, inequality is the one”. TheVietnamese tradition of “sharing foods andclothes” and “helping each other” was veryinfluential. Equity concerns played aprominent role in income, education andhealth policies. The relatively low level ofincome inequality helped lessen some psy-chological and social tensions, but the per-sistence and severity of poverty were directeffects and to some extent also the causesfor the socio-economic difficulties thatViet Nam experienced in the course of the1980s. Poverty elimination thereforebecame the utmost goal of Viet Nam'sdevelopment efforts. Hence, doi moishould not be regarded as merely an eco-nomic reform package to master the crisisin the mid-1980s. More fundamentally, doimoi aimed to overcome poverty and furtherdevelop the country, recognizing that thecentral planning mechanism was no longersuitable to ensure the realization of humandevelopment objectives.
The achievements in reducing povertyin Viet Nam have been impressive, by anystandard. Based on the GSO/World Bankoverall poverty line, poverty incidence fellfrom well over 70% in the mid-1980s toaround 58 per cent in 1993 and further toan estimated 37 per cent in 1998. In urbanareas, poverty declined from 25 per cent in1993 to nine per cent in 1998, whereas inrural areas, it fell from 66 to 45 per cent.Over the same period, food poverty fellfrom 25 to 15 per cent (see Figure 2.2)1.
Government figures, using a differentpoverty line, indicate a similar fall inpoverty, from around thirty per cent in theearly nineties to eleven per cent at the endof 2000. According to the recently rede-fined official poverty line, which aims to
capture a larger proportion of vulnerablegroups and to bring the poverty measure-ment closer to the internationally acceptedpoverty line, poverty amounted to seven-teen per cent of the population, or thirteenmillion people, early in 2001.
Along with poverty reduction, hungerwas nearly eradicated. Prior to doi moi,
35DOI MOI AND HUMAN DEVELOPMENT
The doi moi reforms facilitated, andin many ways depended on a varietyof migration flows. Differences ingrowth and hence employment oppor-tunities and a less restrictive migrationpolicy led to increased labour flows,both between rural and urban areasand within these areas. The 1999Population and Housing Censusoffers some valuable insight in thephenomenon of internal migration andurbanization in Viet Nam. Its three percent sample indicates that approxi-mately 6.5 per cent of the populationaged five and over - or 4.5 millionpeople - moved within the period1994-1999. Among these migrants, 55per cent moved within a province, and45 per cent moved across provincialboundaries. About two-thirds of peo-ple that crossed provincial boundariesalso crossed regional boundaries. Theoverall pattern of population redistrib-ution in Viet Nam during the periodshowed marked regional differences,with only the Central Highlands andthe Southeast gaining populationthrough migration. The other sixregions lost population through migra-tion with the greatest loss in the NorthCentral Coast, one of the poorestregions of Viet Nam. Recent migrantswere predominantly young adults;migration rates of the cohort 20-24,are twice as high as the others.Approximately 11.4 per cent of malesand seventeen per cent of females atthese ages changed their place of resi-dence in the five year period.
With regard to migration withinand between urban and rural areas, theCensus shows that in the years 1994-1999:l About 1.5 million people aged five
and over migrated from one ruralplace to another;
l Around 1.2 million people migratedfrom rural to urban places;
l A similar number - 1.2 million peo-ple - moved from one urban area toanother;
l Only 0.4 million people migratedfrom urban to rural areas.Findings also confirm that Ho Chi
Minh City and Ha Noi are magnets formigrants. The net migration over theinterval 1994-1999 amounted to410,553 people, implying a migrationrate of over eight per cent in HCMC.The figures for Ha Noi were 114,617people and 4.29 per cent, respectively.During the nineties, urbanizationincreased markedly, with 23.5 per centof the population living in urban areasin 1999, up from 19.4 per cent in1989. The Government expects that,along with rapid economic develop-ment, the share of the urban popula-tion will grow further to around onethird in 2010 and possibly forty-fiveper cent in 2020. It should be under-lined that the above reflects a kind ofstructural migration over the period1994-1999 and not a temporary or sea-sonal migration, multiple movementsand return migration. These move-ments are generally high in Viet Nam,particularly due to the frequency ofnatural calamities.
BOX 2.3Internal Migration and Urbanization in Viet Nam
Source: GSO/UNDP, Internal Migration and Urbanization in Viet Nam, 2001.
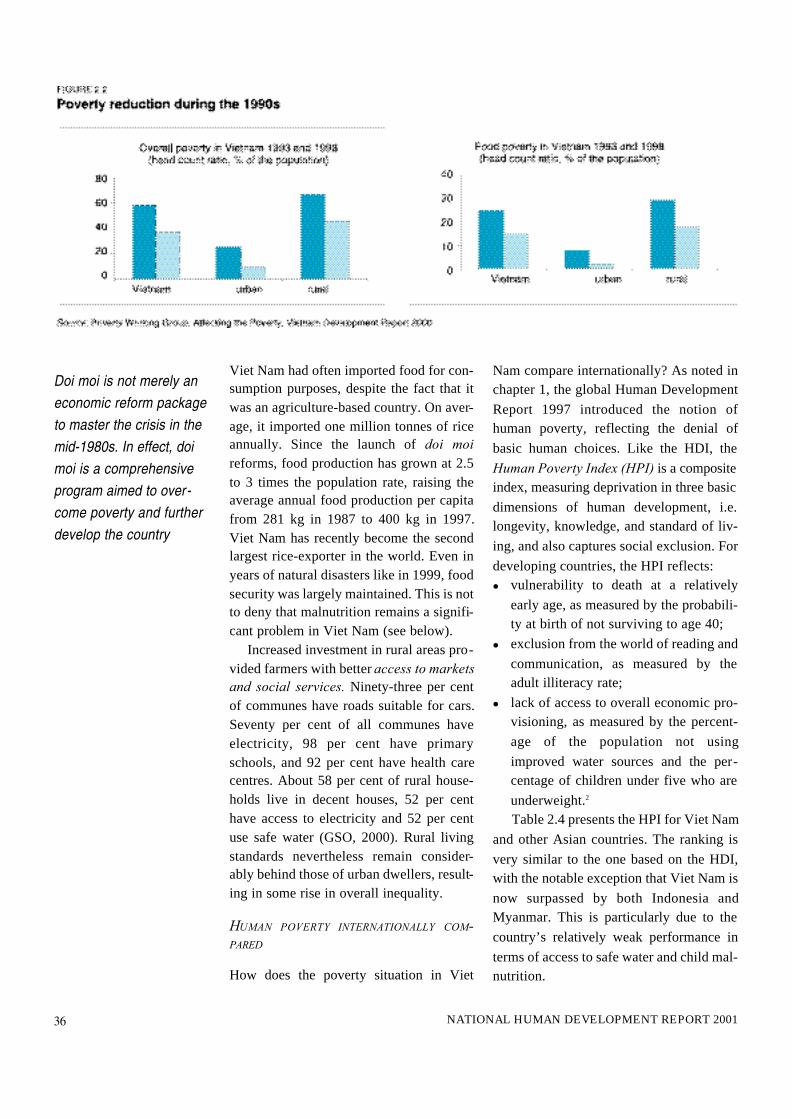
Viet Nam had often imported food for con-sumption purposes, despite the fact that itwas an agriculture-based country. On aver-age, it imported one million tonnes of riceannually. Since the launch of doi moireforms, food production has grown at 2.5to 3 times the population rate, raising theaverage annual food production per capitafrom 281 kg in 1987 to 400 kg in 1997.Viet Nam has recently become the secondlargest rice-exporter in the world. Even inyears of natural disasters like in 1999, foodsecurity was largely maintained. This is notto deny that malnutrition remains a signifi-cant problem in Viet Nam (see below).
Increased investment in rural areas pro-vided farmers with better access to marketsand social services. Ninety-three per centof communes have roads suitable for cars.Seventy per cent of all communes haveelectricity, 98 per cent have primaryschools, and 92 per cent have health carecentres. About 58 per cent of rural house-holds live in decent houses, 52 per centhave access to electricity and 52 per centuse safe water (GSO, 2000). Rural livingstandards nevertheless remain consider-ably behind those of urban dwellers, result-ing in some rise in overall inequality.
HUMAN POVERTY INTERNATIONALLY COM-PARED
How does the poverty situation in Viet
Nam compare internationally? As noted inchapter 1, the global Human Development
Report 1997 introduced the notion ofhuman poverty, reflecting the denial of
basic human choices. Like the HDI, the
Human Poverty Index (HPI) is a compositeindex, measuring deprivation in three basic
dimensions of human development, i.e.longevity, knowledge, and standard of liv-
ing, and also captures social exclusion. For
developing countries, the HPI reflects: l vulnerability to death at a relatively
early age, as measured by the probabili-ty at birth of not surviving to age 40;
l exclusion from the world of reading and
communication, as measured by theadult illiteracy rate;
l lack of access to overall economic pro-visioning, as measured by the percent-
age of the population not using
improved water sources and the per-centage of children under five who are
underweight.2
Table 2.4 presents the HPI for Viet Nam
and other Asian countries. The ranking is
very similar to the one based on the HDI,with the notable exception that Viet Nam is
now surpassed by both Indonesia andMyanmar. This is particularly due to the
country’s relatively weak performance in
terms of access to safe water and child mal-nutrition.
36 NATIONAL HUMAN DEVELOPMENT REPORT 2001
Doi moi is not merely aneconomic reform packageto master the crisis in themid-1980s. In effect, doimoi is a comprehensiveprogram aimed to over-come poverty and furtherdevelop the country

2.3. HUMAN DEVELOPMENT ACHIEVE-MENTS IN SOCIAL AREAS
As noted earlier, Viet Nam clearly distin-guishes itself from other low income coun-tries when it comes to its human develop-ment performance, which may be labelledas Viet Nam's human development para-dox. Although human development com-prises many aspects, this section concen-trates on trends in education and health aswell as people's access to information dur-ing the doi moi period.
VIET NAM'S HUMAN DEVELOPMENT PARADOX
The adult literacy rate and education enrol-ment rate are much higher in Viet Namthan in countries with similar income lev-els. The good performance of the countryin the social sphere is most evident whenlooking at life expectancy (see Figure 2.3).People in Viet Nam live a much longer lifethan those in countries with similar incomelevels like Kenya, Bangladesh, Yemen andMongolia. Life expectancy in for exampleKenya is only 51 years, compared to 68 inViet Nam. And what is more, Viet Nam is,in spite of its limited resources, able toachieve a longevity that comes close to thelevel we find in middle income countries,like Brazil, Turkey, Russia, and Thailand.
While the average income in Brazil is near-ly twelve times as high as in Viet Nam, fig-ures for life expectancy are similar in thetwo countries.
How can this paradox - low income, butsocial performance of a middle incomecountry - be explained? The answer mayrelate to the two major differences betweenthe aforementioned countries on the onehand and Viet Nam on the other. The firstis that income inequality in Viet Nam, atleast up until recent years, was much lesspronounced, although not especially low.The Gini-coefficient, the size of whichranges from 0 (perfect equality) and 1 (per-fect inequality) appears to have been rela-tively modest for Viet Nam by developingcountry standards. Based on expendituredata from the two VLSS surveys, the ginicoefficient was around .33 in 1993 and roseonly modestly to 0.35 in 1998, markedlylower than in Thailand (0.41 in 1995),Brazil (0.59 in 1995) and Russia (0.48 in1993). (However, as analyzed in greaterdepth in chapter 3, recent new evidencesuggests that disparities may have widenedsignificantly further in recent years.) Thesecond possible reason is that theGovernment of Viet Nam places a high pri-ority on expenditure for human develop-ment sectors. Public expenditure on social
37DOI MOI AND HUMAN DEVELOPMENT
TABLE 2.4 HPI ranking for selected countries (1999, out of 90 developing countries)
Underweight Probability of Population not children
dying before 40 Adult illiteracy using safe water under 5 HPICountry HPI rank (%, 1995-2000) rate (%, 1999) (%, 1995-2000) (%, 1995-2000) (%)
Malaysia 13 5.0 13.0 5 18 10.9 Thailand 21 9.0 4.7 20 19 14.0Philippines 23 8.9 4.9 13 28 14.7China P. R. 24 7.9 16.5 25 10 15.1Indonesia 38 12.8 13.7 24 34 21.3Myanmar 43 26.0 15.6 32 39 28.0Viet Nam 45 12.8 6.9 44 39 29.1India 55 16.7 43.5 12 35 34.3Cambodia 78 24.4 31.8 70 52 45.0Lao PDR 66 30.5 52.7 10 40 39.9
Note: Data are taken from international sources and may therefore differ from national statistics.Source: UNDP, Human Development Report 2001, pp. 140-143
The adult literacy rate andeducation enrolment rateare much higher in VietNam than in countries withsimilar income levels.

services, including health and education,amounted to over six per cent of GDP in2000, which is more than a third of all gov-ernment outlays (IMF, 2000). Both factorsare rather typical for socialist countries andcould also have been observed in Centraland Eastern Europe and the Soviet Unionbefore 1989. One of the major challengesfor Viet Nam will therefore be to maintainthese legacies, while transforming thecountry into a modern and industrializedsociety
EDUCATION AND TRAINING
In the early days of the Viet NamDemocratic Republic, President Ho ChiMinh considered illiteracy as one of thethree most dangerous “enemies” alongwith starvation and foreign invasion. Sincethen and rooted in a long tradition, theParty and the State of Viet Nam haveregarded education and training as one ofthe top priorities. Prior to the doi moi pro-gramme, education activities were beingbroadened over the whole country at everylevel. These efforts to stamp out illiteracywere reinforced during the doi moi period.Although the State had to reduce its totaloutlays due to the economic difficulties inthe early 1990s, education expenditureremained high and even rose in real terms.Special emphasis was given to basic edu-cation. Together with contributions by thepeople themselves, this has resulted in a
strong increase in education enrolmentrates for the whole population. But – astable 2.5 shows - ethnic inequalities in edu-cation remain considerable.
Gender inequalities in education havealso narrowed. Presently, enrolment ratesat primary and lower secondary schools aresimilar for boys and girls, but the gendergap is still significant at higher levels ofeducation in spite of some improvementbetween 1993 and 1998 (Table 2.6). Thegender gap is wider amongst the poor andin rural areas.
It is noteworthy that tertiary level edu-cation and vocational training have wit-nessed a sharp increase in the number ofstudents. In the period 1992-1998, thenumber of graduates from specialized sec-ondary schools surged by one hundred andfifty per cent, while the number of gradu-ates from technical schools tripled and thenumbers from universities and collegesnearly quadrupled.
In the course of the doi moi process,new forms of education and training havebeen developed. Before doi moi, there wereonly State-owned schools with class learn-ing. Meanwhile, new systems have beenput in place such as private and semi-pub-lic schools and distance learning, particu-larly with regard to foreign languages andinformation science. The trend of expand-ing private and semi-public schools doesnot only occur in basic education, but sev-eral dozens of universities and colleges of
38 NATIONAL HUMAN DEVELOPMENT REPORT 2001
President Ho Chi Minhconsidered illiteracy asone of the three most dan-gerous “enemies” alongwith starvation and foreigninvasion.

this kind have been established as well.Education and training abroad on a self-financing basis is also encouraged. Hence,people’s choices to form and use theircapabilities have been broadened signifi-cantly.
While Viet Nam has achieved impres-sive results in education, there are still anumber major challenges. The first relatesto school attendance, completion rates andoverall accessibility. The national comple-tion rate is less than seventy per cent withsignificant regional variations. About thir-ty per cent of children aged 12-20 drop outfrom school. For children belonging to thepoorer households, the drop out rate isaround forty per cent. This is related to theincreasing private school fees and relatedcosts, which hit the poor disproportionate-ly. Another serious problem concerns thequality of education and teaching staff.Traditional methods of teaching rely heav-ily on rote learning. The main pedagogicalapproach in primary and secondary schoolsstill involves memorising facts, usuallywith little opportunity to be creative and to
express thoughts, ideas and opinions.There is a need to modernize education tomake Viet Nam the knowledge-basedeconomy it aspires to be.
POPULATION AND FAMILY PLANNING
Given Viet Nam’s limited natural resourcesand its low level of economic develop-ment, the large and rapidly growingVietnamese population has been a majorconcern of the Government over the lastdecades. During the doi moi reform period,population policies and family planningprogrammes were intensified and imple-mented on a larger scale. Together with thegenerally improved living conditions, thishas led to dramatic demographic changesover the 1990s. According to Census data,the total fertility rate (i.e. the number ofbirths per woman) declined from 3.8 in1989 to 2.3 in 1999, though it picked up to2.5 in 2000. As this figure is still higherthan the so-called replacement fertility rateof about 2.1, the population continues togrow, albeit at a slower pace. The popula-
39DOI MOI AND HUMAN DEVELOPMENT
TABLE 2.5 Trends in education enrolment rates, by ethnicity
1992/93 1997/98
Kinh people Ethnic minorities Kinh people Ethnic minorities
Primary school 90.6 63.8 93.3 82.2Lower secondary school 33.6 6.6 66.2 36.5Upper secondary school 7.9 2.1 31.9 8.1Post secondary school 3.2 0.8 10.5 1.4
Source: Viet Nam Living Standard Surveys 1992/1993 and 1997/1998.
TABLE 2.6 Proportion of boys and girls at school
1992/1993 1997/1998
Primary school Male 49.8 50.4Female 50.2 49.6
Lower secondary school Male 51.8 49.7Female 49.2 50.3
Higher secondary school Male 57.9 52.3Female 42.1 47.7
`University and college* Male 59.0 56.3Female 41.0 43.5
Source: Viet Nam Living Standard Surveys 1992/1993 and 1997/1998.

tion growth decreased from 2.1 per cent in1979-1989 to 1.76 per cent in 1989-1999,resulting in a total population size of 76.3million in 1999. About a third of the popu-lation is below 15 years old. With lowerfertility rates, the population will thusbecome progressively older.
A lower number of children and longerspacing between births allowed families toinvest more in their children, while lowermorbidity and mortality - the maternalmortality rate halved between 1990 and2000 - further helped to protect the produc-tive capacity of mothers and in itself con-tributed to improved gender equality. Also,the number of unwanted pregnancies havedecreased due to better and increased useof contraceptives, through which the highcosts of abortions and related health riskscan be avoided.
The Government is now gradually mov-ing away from fertility control and familyplanning towards a policy that focuses onfree, well-informed choices through access
to high quality reproductive health careservices and appropriate information. Inthat sense, the approach is being increas-ingly brought in line with the human devel-opment perspective.
HEALTH SERVICES
As noted earlier, Viet Nam’s performancein terms of health is much higher than onewould expect on the basis of averageincome level alone. Figure 2.2 further illus-trates this point, showing that the countryis a positive ‘outlier’ when looking at therelation between infant mortality and aver-age income. This is largely due to the factthat health has always been a high priorityin the socio-economic development strate-gy of the Government. The official healthpolicy comprises three key elements: (a) itprefers ‘prevention to cure’, (b) combines‘traditional and modern medicine’ and (c)calls for a ‘joint contribution by both theState and people’. The latter principle -also known as ‘socialization’ - does notimply merely cost-sharing between the
40 NATIONAL HUMAN DEVELOPMENT REPORT 2001

State and the people. Rather it requires anactive role of the State in implementinghealth policies and health programmes,whilst people themselves actively partakein these activities, both as beneficiaries andcontributors.
In the early 1960s, Viet Nam startedbuilding a three-tier health system, con-sisting of community health centres, inter-communal clinics and district medical cen-tres and hospitals. The gradual expansionof this system all over the country not onlyhelped the curative care approach toaccomplish better results, but even moreimportantly, it supported the implementa-tion of various preventive health pro-grammes. The extensive network of healthservices further contributed to the dissem-ination of knowledge on health issues, theprevention of diseases and the effectiveimplementation health programmes of theState, notably the effective extendedimmunization programme. Nowadays,more than ninety per cent of all childrenunder one are fully vaccinated, all childrenunder five receive vaccinations againstpolio, while over eighty per cent of preg-nant women are given tetanus vaccination.Preventive programmes against diseaseslike tuberculosis, goiter, hemorrhagicfever, and malaria receive wide popularsupport and can be considered as quitesuccessful.
One of the remarkable features of VietNam’s system of health services is theprominent role played by traditional medi-cine, which is considered as a cost-effec-tive approach to many health problems.Nowadays, seventy per cent of provincesand cities have traditional medical hospi-tals, nearly fifty per cent of hospitals havetraditional medical departments, while halfof the communal medical stations applytraditional methods. The number of privatedoctors practising traditional medicine hasalso grown.
The health system has been furtherexpanded and improved during the doi moiprocess. At the same time, doi moi intro-duced a number of changes. One of them
was the partial liberalization of the healthsector, which particularly led to a rapidgrowth in the number of private pharma-cies. Together with the introduction of userfees, and an effective exemption system,this has contributed to high private spend-ing on health, amounting to no less than 80per cent of total health spending. At somepoint, 85 per cent of the people werebypassing health centres, self diagnosingand directly purchasing drugs, which inturn has led to irrational use of drugs andan increase in anti-microbial resistance.
Another change, which actually tookplace before the doi moi period, has beenthe introduction of a health insurance sys-tem in order to reduce people’s vulnerabil-ity vis-à-vis the high costs related to healthshocks. At present, about twelve per centof the population is covered by the insur-ance system, on either a voluntary or com-pulsory basis, with free health cards forthe poor.
In spite of considerable improvementsin vital health indicators, Viet Nam faces anumber of serious health problems, such asthe still high malnutrition, re-emerging andnew diseases like tuberculosis andHIV/AIDS, new typical life style diseasesand a rising number of traffic accidents.The main challenge will be to tackle theseproblems through improving health poli-cies and programmes while protecting thepositive legacy of the past. One of the keymeasures is to improve the accessibility tohealth services, particularly for the poorand those living in remote areas.
INFORMATION AND CULTURE
Doi moi was a turning point in the area ofinformation and culture. The provision ofand access to different kinds of informationhas improved significantly. Radio and tele-vision coverage has been expanding quick-ly with an increasingly number of channelsas well as broadcasting time, whilst thenumber of newspapers and magazines hasmore than doubled during the nineties. Atthe same time, people have gainedincreased access to modern information
41DOI MOI AND HUMAN DEVELOPMENT

and communication technology (ICT). Thenumber of telephones rose from 129 thou-sand units (or 2 per 1,000 people) in 1991to 2.5 million (or 32 per 1,000) in 1999,while mobile phone subscriptions arebecoming popular. The Internet is anothernew phenomenon in Viet Nam. Officiallyconnected to the global Internet inNovember 1996, Viet Nam currently hasone Internet Access Provider; five InternetService Providers, seventeen InternetCommunication Providers and some localnetworks with more than one hundredthousand Internet subscribers. Althoughstarting at rather low levels Viet Nam isconsidered as one of fast-growing coun-tries with regard to the use of Internet. Thenumber of subscribers is expected to sur-
pass one million before 2003. Despite many positive changes and
much better access to information andknowledge, Viet Nam still very much lagsbehind its own ambitions as well as manyneighbours in the region. The develop-ment of the ICT is severely hampered bya weak telecommunications infrastructureand low penetration rates. These, in turn,are due to limited public awareness,strong regulatory controls and relativelyhigh user fees. Finally, it should be notedthat the Government strongly believesthat the opening up to the world, particu-larly through ICT, needs to be reconciledwith the preservation of national cultureand identity.
42 NATIONAL HUMAN DEVELOPMENT REPORT 2001
The doi moi reform process has clearlyresulted in a substantial improvementin the overall well-being of the vast
majority of the Vietnamese people. In the1990s, Viet Nam opened up to the outerworld, the economy more than doubled insize and became far more dynamic. People’saccess to quality goods and services greatlywidened and human development indicatorsimproved significantly. Based on an interna-tionally comparable expenditure povertyline, poverty declined from well over 70% inthe mid-1980s to around 37% in recent years.
At the beginning of the new century,however, the country is still characterizedby the salient features of a developingcountry in transition. With an official GDPper capita of around US$ 400 (or US$ 1860in PPP-dollars of 1999), the countryremains quite poor by international stan-dards. Much of its huge developmentpotential is still untapped, while it is onlyin the midstream of its transition towards asocialist oriented market-economy.Moreover, while the reduction in povertyover the past fifteen years has been impres-sive by almost any standard, national aver-ages can hide many serious disparities ashighlighted in this chapter.
This chapter starts with a brief outlineof the main goals of the new Ten YearSocio-Economic Development Strategy2001-2010, including the overarching goalof a further rapid reduction in poverty andsubstantial improvement in human well-being over the next decade. The Strategywas approved at the Ninth NationalCongress of the National Party in April2001 (see Box 3.1 and Table 3.1). It explic-itly aims to increase the Human
Development Index (HDI), eliminatehunger and rapidly reduce poverty, in anattempt to repeat the successful results ofthe nineties.
However, the easy gains in povertyreduction are probably over, and greatefforts are required to achieve sizeablepoverty reduction in the decade ahead,even if economic growth continues at itsrobust annual rate of around seven percent. Remaining poverty in the countrywill be increasingly difficult to eradicategiven that the vast majority of the remain-ing poor tend to be more isolated in manyrespects (geographically, ethnically, lin-guistically, socially and in terms of access
43HUMAN DEVELOPMENT CHALLENGES
CHAPTER 3
Human Development Challenges
In April 2001, the Ninth National Congress of the Communist Party adopted theTen Year Socio-Economic Development Strategy 2001-2010. The strategy laysout a clear and inspiring vision for building the foundations of "a prosperous peo-ple, a forceful country and an equitable, democratic and civilized society". Theoverarching objective of the Strategy is "to bring our country out of underdevel-opment; improve noticeably the people's material, cultural and spiritual life; andlay the foundations for making ours basically a modern-oriented industrializedcountry by 2020."
The Strategy identified the following socio-economic development targetsfor 2010:n Doubling of GDP, which implies a growth rate of 7.2% per annumn Domestic savings to be increased to over 30% GDP n Exports to grow at more than twice the rate of GDPn A substantial rise in the country's Human Development Index (HDI) n Eradication of hunger and rapid reduction of the number of poor householdsn Reduction of urban unemployment to 5% and of rural underemployment to 15-
20%n Universalization of lower secondary education for alln Malnutrition rate of children to be reduced from around a third to around 20%n Life expectancy to increase from 68 to 70-71 years.
BOX 3.1Viet Nam’s Challenges for the Period 2001-2010
Easy gains in povertyreduction are probablyover, and great efforts arerequired to achievie size-able poverty reduction inthe decade ahead, even ifeconomic growth contin-ues at its robust annualrate of around seven percent.

to information). This will call for a muchmore targeted multi-pronged approach toreach out to such isolated pockets of hard-ship and poverty to better ensure that therelated poor can better participate in thecountry's development. This will involvenot only broadening and deepening the doimoi reform process, but also more directmeasures such as improving access to use-ful information; improved rural roads andother rural infrastructure; effective socialservices delivery, and other policies whichreduce isolation.
In order to better appreciate the diversenature of the poverty and human develop-ment situation across the country, thischapter also offers an analysis of some newdata on the country’s socio-economic andhuman development disparities, which areeasily obscured by national averages. Forthe first time ever, this Report presentshuman development indices calculated forall 61 provinces in Viet Nam. As also indi-cated in this chapter, new recent evidencesuggests that income disparities may bewidening more significantly than previous-ly believed, presenting yet another newchallenge to policy makers.
In addition to direct policy measuresneeded to reduce isolation of the remainingpoor (including geographic, linguistic,social, ethnic, and isolation from informa-tion), further poverty reduction will alsocall for action in a variety of related policyareas. Therefore, this chapter also discuss-es four such areas in greater detail: interna-tional integration and institutional reforms;unemployment and underemployment;education and training, science and tech-nology; and public investment and publicservices.
3.1. REDUCING POVERTY ADN MAINTAIN-ING EQUITY
Poverty reduction and hunger eliminationremains the greatest challenge for VietNam over the next ten years. As reflectedin the Socio-Economic DevelopmentStrategy 2001-2010, the Interim PovertyReduction Strategy Paper (I-PRSP) and theHunger Eradication and Poverty ReductionStrategy (HEPR-strategy), the Governmentaims to reduce absolute poverty from 17per cent in early 2001 to below 10 per centin 2005 and under 5 per cent in 2010, basedon the national poverty line.
44 NATIONAL HUMAN DEVELOPMENT REPORT 2001
TABLE 3.1 Targets in the Five Year Plan and the Ten Year Strategy
2000 2005 2010
2000 2005 2010Economic growth (% per year) 6.7 7.5 7.2 GDP-share of agriculture (%) 24.3 20-21 16-17 GDP-share of industry (%) 36.6 38-39 40-41 GDP-share of services (%) 39.1 41-42 42-43 Domestic savings (% of GDP) 27 29-30 30 Exports (% of GDP) 48 72 95
Annual creation of jobs (million) 1.2 1.5 -Urban unemployment (%) 6.4 5.4 < 5 Rural underemployment (%) 26.2 20 15-20Share trained labour force (%) 20 30 40
Poverty (national poverty line) (%) 17 10 5 Life expectancy (years) 68 70 71 Enrolment lower secondary education(%) 74 80 100 Child malnutrition (%) 33-34 22-25 20 Under five mortality rate (per 1000) 42 35 32
Annual population growth (%) 1.4 1.22 1.1-1.2 Access to clean water (rural) (%) 44 60 -
Poverty reduction andhunger elimination remainthe greatest challenge forViet Nam over the next tenyears.
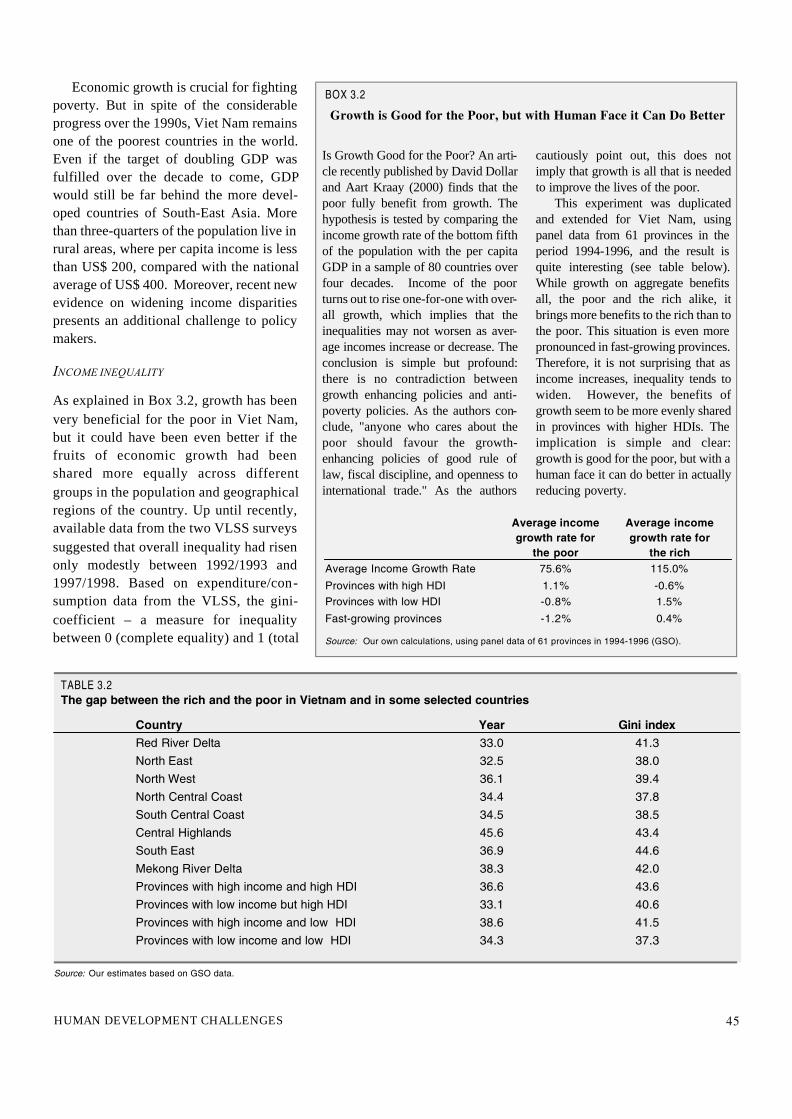
Economic growth is crucial for fightingpoverty. But in spite of the considerableprogress over the 1990s, Viet Nam remainsone of the poorest countries in the world.Even if the target of doubling GDP wasfulfilled over the decade to come, GDPwould still be far behind the more devel-oped countries of South-East Asia. Morethan three-quarters of the population live inrural areas, where per capita income is lessthan US$ 200, compared with the nationalaverage of US$ 400. Moreover, recent newevidence on widening income disparitiespresents an additional challenge to policymakers.
INCOME INEQUALITY
As explained in Box 3.2, growth has beenvery beneficial for the poor in Viet Nam,but it could have been even better if thefruits of economic growth had beenshared more equally across differentgroups in the population and geographicalregions of the country. Up until recently,available data from the two VLSS surveyssuggested that overall inequality had risenonly modestly between 1992/1993 and1997/1998. Based on expenditure/con-sumption data from the VLSS, the gini-coefficient – a measure for inequalitybetween 0 (complete equality) and 1 (total
45HUMAN DEVELOPMENT CHALLENGES
TABLE 3.2 The gap between the rich and the poor in Vietnam and in some selected countries
Country Year Gini indexRed River Delta 33.0 41.3North East 32.5 38.0North West 36.1 39.4North Central Coast 34.4 37.8South Central Coast 34.5 38.5Central Highlands 45.6 43.4South East 36.9 44.6Mekong River Delta 38.3 42.0Provinces with high income and high HDI 36.6 43.6Provinces with low income but high HDI 33.1 40.6Provinces with high income and low HDI 38.6 41.5Provinces with low income and low HDI 34.3 37.3
Source: Our estimates based on GSO data.
Is Growth Good for the Poor? An arti-cle recently published by David Dollarand Aart Kraay (2000) finds that thepoor fully benefit from growth. Thehypothesis is tested by comparing theincome growth rate of the bottom fifthof the population with the per capitaGDP in a sample of 80 countries overfour decades. Income of the poorturns out to rise one-for-one with over-all growth, which implies that theinequalities may not worsen as aver-age incomes increase or decrease. Theconclusion is simple but profound:there is no contradiction betweengrowth enhancing policies and anti-poverty policies. As the authors con-clude, "anyone who cares about thepoor should favour the growth-enhancing policies of good rule oflaw, fiscal discipline, and openness tointernational trade." As the authors
cautiously point out, this does notimply that growth is all that is neededto improve the lives of the poor.
This experiment was duplicatedand extended for Viet Nam, usingpanel data from 61 provinces in theperiod 1994-1996, and the result isquite interesting (see table below).While growth on aggregate benefitsall, the poor and the rich alike, itbrings more benefits to the rich than tothe poor. This situation is even morepronounced in fast-growing provinces.Therefore, it is not surprising that asincome increases, inequality tends towiden. However, the benefits ofgrowth seem to be more evenly sharedin provinces with higher HDIs. Theimplication is simple and clear:growth is good for the poor, but with ahuman face it can do better in actuallyreducing poverty.
BOX 3.2Growth is Good for the Poor, but with Human Face it Can Do Better
Average income Average income growth rate for growth rate for
the poor the richAverage Income Growth Rate 75.6% 115.0%Provinces with high HDI 1.1% -0.6%Provinces with low HDI -0.8% 1.5%Fast-growing provinces -1.2% 0.4%
Source: Our own calculations, using panel data of 61 provinces in 1994-1996 (GSO).
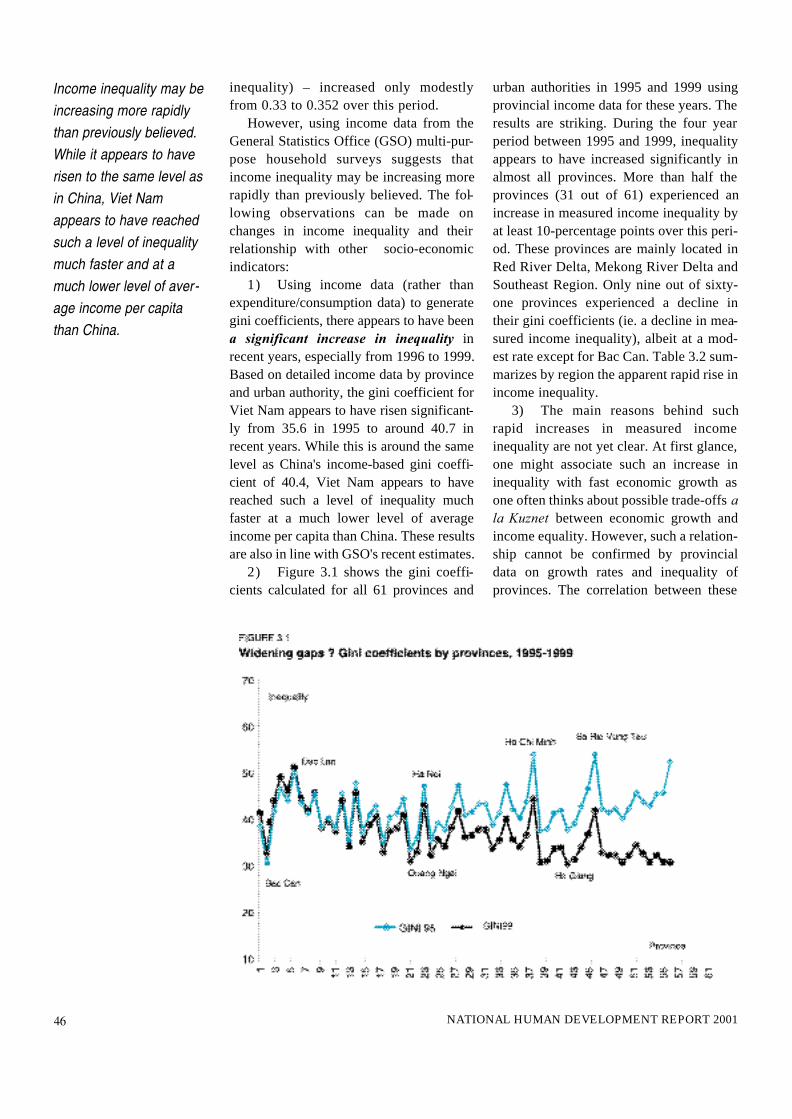
inequality) – increased only modestlyfrom 0.33 to 0.352 over this period.
However, using income data from theGeneral Statistics Office (GSO) multi-pur-pose household surveys suggests thatincome inequality may be increasing morerapidly than previously believed. The fol-lowing observations can be made onchanges in income inequality and theirrelationship with other socio-economicindicators:
1) Using income data (rather thanexpenditure/consumption data) to generategini coefficients, there appears to have beena significant increase in inequality inrecent years, especially from 1996 to 1999.Based on detailed income data by provinceand urban authority, the gini coefficient forViet Nam appears to have risen significant-ly from 35.6 in 1995 to around 40.7 inrecent years. While this is around the samelevel as China's income-based gini coeffi-cient of 40.4, Viet Nam appears to havereached such a level of inequality muchfaster at a much lower level of averageincome per capita than China. These resultsare also in line with GSO's recent estimates.
2) Figure 3.1 shows the gini coeffi-cients calculated for all 61 provinces and
urban authorities in 1995 and 1999 usingprovincial income data for these years. Theresults are striking. During the four yearperiod between 1995 and 1999, inequalityappears to have increased significantly inalmost all provinces. More than half theprovinces (31 out of 61) experienced anincrease in measured income inequality byat least 10-percentage points over this peri-od. These provinces are mainly located inRed River Delta, Mekong River Delta andSoutheast Region. Only nine out of sixty-one provinces experienced a decline intheir gini coefficients (ie. a decline in mea-sured income inequality), albeit at a mod-est rate except for Bac Can. Table 3.2 sum-marizes by region the apparent rapid rise inincome inequality.
3) The main reasons behind suchrapid increases in measured incomeinequality are not yet clear. At first glance,one might associate such an increase ininequality with fast economic growth asone often thinks about possible trade-offs ala Kuznet between economic growth andincome equality. However, such a relation-ship cannot be confirmed by provincialdata on growth rates and inequality ofprovinces. The correlation between these
46 NATIONAL HUMAN DEVELOPMENT REPORT 2001
Income inequality may beincreasing more rapidlythan previously believed.While it appears to haverisen to the same level asin China, Viet Namappears to have reachedsuch a level of inequalitymuch faster and at amuch lower level of aver-age income per capitathan China.

two variables is rather weak. (See Figure3.2) While it appears true that high-growthprovinces seem to have higher incomeinequality, the differences between theGini coefficients across various growthgroups are quite modest. In other words,there appears to be no clear link betweenthe rate of economic growth and thechange in the Gini coefficient. Withingiven growth groups, a more contrastingpicture emerges on the relationshipbetween economic growth and inequality.In some low growth provinces, like KhanhHoa, Dong Thap and Thai Nguyen, incomeinequality increased significantly despitelow growth. In some high growthprovinces, like Quang Ngai, Ben Tre, andPhu Yen, the income gini coefficientremained stable or increased only modest-ly despite high growth.
4) There is, however, a quite strongcorrelation between the level of GDP percapita in general and income inequality.This observation in no way contradicts theprevious one, but together they couldimply that between inequality and growththere may exist an 'accumulated' and hid-den rather than a direct relationship that isnot revealed directly in the short-term, butwill be exposed eventually.
5) Other reasons for the apparentjump in measured income inequality mayrelate to the collapse of commodity prices(especially rice and coffee) since 1998, inparallel with relatively rapid economicgrowth in major urban areas. This wouldtend to show up especially in a significantwidening of urban-rural income disparities(and appears consistent with GSO's esti-mates). However, further research is need-ed to confirm these possible underlyingcauses and potential policy implications.
6) The relationship between inequali-ty and Human Development is also note-worthy. Human development tends to behigher in provinces where the fruits of eco-nomic development seem to be sharedmore equally. This might suggest that for agiven level of income, a more equitabledistribution of such income generates a
higher rate of return per dollar in terms ofhuman development. Alternatively, thiscould imply that high human developmenttends to lessen inequality. The higher ishuman development, the less severe isinequality. Provinces with low income buthigh HDI seem to fare better in terms ofinequality than provinces that have higherincome per capita but are still left behind interms of human development. Nam Dinhand Thai Binh are examples of the firstcase and Gia Lai, Can Tho, Dong Thap areon the other side of the story.
In summary, with accelerated economicgrowth, there would appear to be signifi-cant scope to ensure that economic growthis shared more or less equitably. There isn'tnecessarily a trade-off between faster eco-nomic growth and equality, at least for theshort-term. Provinces are very diverse inachieving economic growth outcomes.They are also very different in translatingeconomic achievements into human devel-opment and the ways these fruits of eco-nomic and human development are sharedamong the people. These observations hintto a number of important policy implica-tions that need to be taken into account inthe process of policy implementation.
HUMAN DEVELOPMENT DISPARITIES
As argued in chapters 1 and 2, income,
47HUMAN DEVELOPMENT CHALLENGES
Provinces are verydiverse in achieving eco-nomic growth outcomes.They are also very differ-ent in translating econom-ic achievements intohuman development andthe ways these fruits ofeconomic and humandevelopment are sharedamong the people.

however, is only part of the developmentstory. The ultimate aim of all developmentefforts should be human development, theexpansion of people’s capabilities andchoices. The international comparison inthe previous chapter showed that in spite ofthe generally positive relationship betweenaverage income and human development,there is a fair amount of variation. Thereare countries, like Viet Nam, that haverather low levels of income, but rank rela-tively high in terms of human development(compared with countries of similarly lowincomes), and vice versa.
The same conclusion holds when welook at the HDIs calculated for the 61provinces and cities within Viet Nam. Map3.1 reflects the disparities in averageincomes in the country. Bia Ria-Vung Taubeing a special case due to the high oil rev-enues, the ranking is headed by HCMC, HaNoi, Binh Duong, Da Nang, Dong Nai andHai Phong. All ten poorest provinces are tobe found in northern Viet Nam. The richestprovinces also rank highest in terms ofhuman development (Map 3.2). The corre-lation between income and human devel-opment is less apparent at the lower end ofboth rankings. Lai Chau, Ha Giang, SonLa, Lao Cai and Bac Can score low on bothrankings, but both Gia Lai and Cao Bangperform worse than one would expect onthe basis of average income alone. Overall,the picture is rather diffuse: 26 out of 61provinces move at least ten places upwardsor downwards when the two rankings arecompared. The contrast is starkest in thecase of Nam Dinh, Ha Tinh, Ninh Binhwith a HDI-ranking of around 25 positionshigher than the GDP-ranking. The inverseis true for An Giang, Ninh Thuan, Dac Lac,Phu Yen and Lang Son, each of whichseem not to be able to translate relativelyhigh average incomes into favourablehuman development outcomes.
At least two conclusions may be drawnfrom Maps 3.2 and 3.3. First, aggregateindicators conceal significant humandevelopment disparities within the country.The South-East and the Red River Delta
are considerably better off than otherregions, especially the North East, NorthWest and Central Highlands. While goodperformers compare favourably with coun-tries like Hungary and Estonia, poor per-formers do not score much higher thanLaos, Nepal and Bhutan. Secondly, ananalysis that focuses on income differen-tials may lead to different policy conclu-sions than one that is based on disparitiesin human development. This is particularlytrue when policy makers intend to targettheir support to the poor provinces ratherthan expecting that overall growth willautomatically trickle down to theseprovinces. In this respect, it is interesting tonote that some countries, including Braziland Bulgaria, have used the HDI in deter-mining the allocation of public funds fromthe centre to the provinces.
Figure 3.3 provides another perspectiveon the relationship between income andhuman development in Viet Nam. When all61 provinces are placed in different quad-rants, depending on their relative rankingsin GDP per capita and HDI, we can seehow diverse is the situation in differentprovinces and how this diversification maylead to interesting policy implications.First of all, the first group of provinces leadby Ha Noi and Ho Chi Minh City includesprovinces that are more advanced in botheconomic and human development. Here,GDP per capita is high and so are the othersocial indicators. These provinces are fac-ing a different set of problems that requireperhaps different approaches and policyinterventions to further improve humandevelopment. Poverty may be less severein these areas but other issues such as envi-ronmental protection, security, social safe-ty nets, migration and labour movementshould be on the agenda. On the oppositeend of the chart, there are a number of lessdeveloped provinces such as Lai Chau,Kon Tum, Lao Cai where people are livingmostly in remote, mountainous areas, rely-ing basically on agriculture and in somecases at a meagre subsistence level. Hereboth economic development and human
48 NATIONAL HUMAN DEVELOPMENT REPORT 2001

49HUMAN DEVELOPMENT CHALLENGES
Map 3.1 Average Income Per Capita in Viet Nam's 61 Provinces
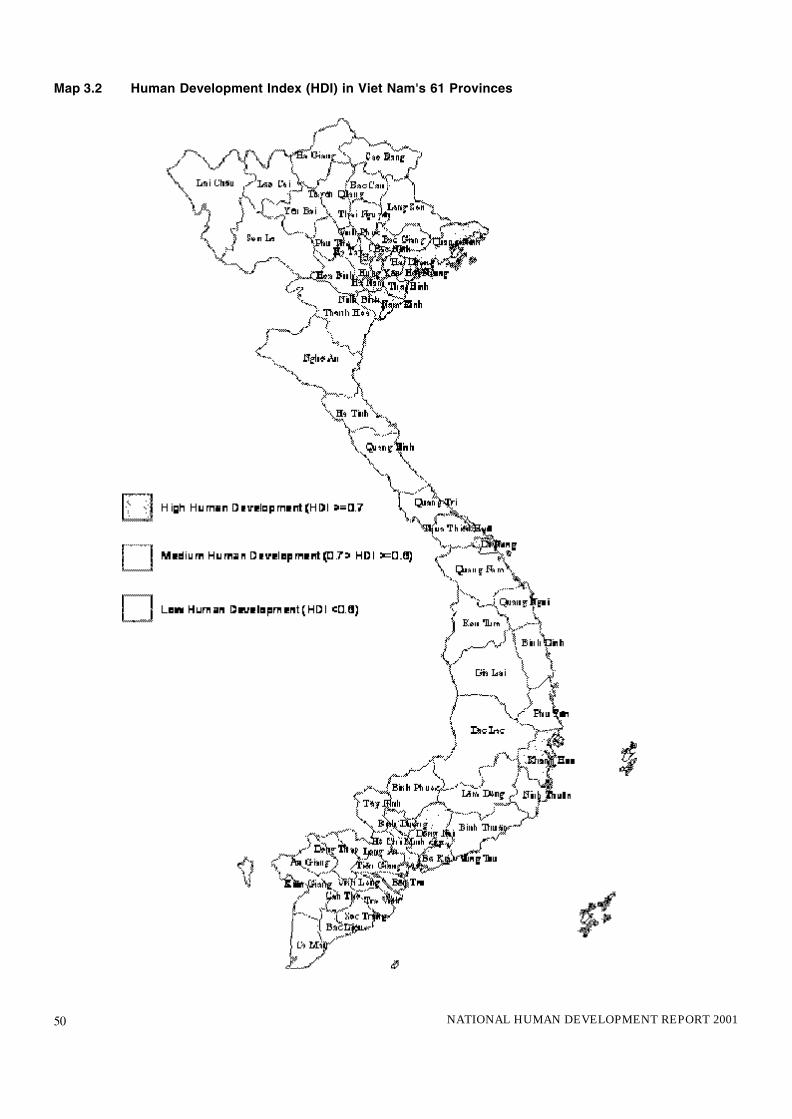
50 NATIONAL HUMAN DEVELOPMENT REPORT 2001
Map 3.2 Human Development Index (HDI) in Viet Nam's 61 Provinces

51HUMAN DEVELOPMENT CHALLENGES
Map 3.3 Human Poverty Index (HPI) in Viet Nam's 61 Provinces

52 NATIONAL HUMAN DEVELOPMENT REPORT 2001
Map 3.4 Gender-related Development Index (GDI) in Viet Nam's 61 Provinces

development are low. The developmentchallenge is enormous and daunting. Basiceducation and sanitation, primary health-care and infrastructure, resettlement anddiversification of production are only fewitems to mention in the list of priorities onthe development agenda for theseprovinces. During the last couple of years,the Government has been making encour-aging efforts to help these areas to over-come poverty and "backwardness".Chapter II already highlighted some ofthese programs but there are many thingsthat need to be done. These provinces needperhaps both well-targeted support and anoverall more enabling environment.
The last two cases where there is apotential gap existing between economicand human development are interestingand deserve more attention. These casesare interesting because it is not so clearwhy the gap exists and what needs to bedone to close the gap. Further research anddiscussion are obviously needed to under-stand the phenomenon, but some insightscan already be drawn. In contrast to the
first two groups of provinces, a third groupincludes provinces where economic gainshave not been well translated into humandevelopment achievements. Theseprovinces are mostly located in the Southof Viet Nam, notably in the Mekong RiverDelta region. Despite relying on agricul-ture for most of their earnings, the incomeper capita in these provinces is relativelyhigh since these region have a very goodposition in producing and exporting diver-sified agriculture products.Underemployment is rather low and eco-nomic growth has been maintained forsome years. However, most of social indi-cators in this region are far from desirable.Inadequate provision of clean water andbasic sanitation, low level of education atall levels and unskilled workers prevailingin the labour force, vulnerability due tonatural disaster and market fluctuationscharacterize these provinces which partlyexplains why these provinces score low inhuman development ranking and povertyreduction is not sustained. There are somehistorical and geographical explanations
53HUMAN DEVELOPMENT CHALLENGES

for this, but there is also much room forpolicy intervention. Better disaster man-agement, more efficient provision mecha-nisms to help vulnerable groups to dealwith uncertainty and risks are just a fewareas for possible actions.
A forth group of provinces present anapparent paradox. These provinces scorewell in many social development indica-tors but their economic achievement israther poor. Despite being relatively poor,these provinces are characterized by a rela-tively high level of education, fairly goodprovision of basic social services and high-ly educated labour forces. Underemploymentis among the highest in the country and for-eign investors are often reluctant to cometo the region, despite the fact that theregion is endowed with skilled labour. Off-farm activities are underdeveloped andpeople often migrate out of the region inthe search of better income-generating andemployment opportunities. Most of theseprovinces are in the North of Viet Nam andnotably in the Red River Delta. There issome explanation on why these provincesare rather stagnated in economic develop-ment, but the business environment playsan important role. Therefore, priority in thedevelopment agenda of these provincesshould be focus more on providing more ofan enabling environment for businessdevelopment, improving information,access to resources and promoting non-
farming activities for both domestic andinternational markets.
An alternative measure to capture thehuman development perspective in quanti-tative terms is the Human Poverty Index(HPI), also discussed in chapter 2. Map 3.4depicts the geographical disparities withinthe country in terms of the HPI and is inline with the maps presented earlier. Allmaps clearly suggest that when designingnew policies to promote people’s well-being in Viet Nam, one has to go broader(by considering not only income) as well asdeeper (by looking not only at nationalaverages).
A further inequality that needs address-ing concerns gender. Chapter 2 maintainedthat gender inequality in Viet Nam is mod-est when compared to other countries. Buthere again, national aggregates hideregional differences. In fact, Figure 3.5indicates that gender inequalities vary sig-nificantly across the country; they arehigher the further provinces lie away fromthe four major urban areas. A moredetailed analysis is presented in Table 3.2shows this gender inequality in eightregions. Among five selected indicators,women, on average score better than menin only one, that is life expectancy. In allother aspects, women appear disadvan-taged in all regions. Women have lessaccess to education, work more hours thanman, and in mainly unskilled jobs.
54 NATIONAL HUMAN DEVELOPMENT REPORT 2001
TABLE 3.2 Gender Comparisons
Region Skilled labour Employment Education Life (expectancy) Human Developmet
Red River Delta 1.07 1.20 1.08 0.96 1.03North East 1.04 1.25 1.11 0.96 1.08North West 1.03 1.23 1.33 0.99 1.12North Central Coast 1.05 1.26 1.10 0.95 1.05South Central Coast 1.08 1.23 1.08 0.98 1.07Central Highlands 1.07 1.22 1.17 1.01 1.12Southeastern 1.06 1.28 1.06 0.97 1.02Mekong River Delta 1.03 1.14 1.07 0.97 1.04All Viet Nam 1.05 1.22 1.10 0.97 1.06
Source: GSO and our own calculation.

Participation of women in business andother decision making positions is rathermodest, especially in remote areas. Whilethis inequality is somehow more serious inthe North West and Central Highlands,most disparities lay within regions ratherthan across regions.
To help address existing gender gaps,the Vietnamese Government has developeda National Plan of Action for theAdvancement of Women 2001-2005. Box3.3 summarizes its main objectives.
Poverty often exacerbates gender dis-parities in limiting disadvantaged womenand girls to form and use their capabilitiesand to participate in and benefit fromdevelopment. In turn, by hindering womenand girls to contribute, gender inequalitiesalso impose costs on productivity and eco-nomic progress. As the global HumanDevelopment Report 1995 aptly puts it:“development that is not engendered isendangered” (UNDP, 1995).
With human poverty reduction as theoverarching challenge, the following sec-tions deal with a number of specific chal-lenges that relate to the indirect and directrole of the State in:
n Further integrating into the world econo-my, especially improving the competi-tiveness of both the domestic and inter-national sector of the Vietnamese econo-my (3.2);
n Intensifying the on-going institutionalreforms, especially the improvement ofthe overall business climate for the non-State sector (3.2 and 3.3);
n Creating sustainable jobs, especially interms of off-farm employment (3.3);
n Upgrading and modernizing the educa-tion and science system (3.4);
n Improving the public infrastructure, ser-vices and targeted programmes (3.5).
3.2. FURTHER ECONOMIC INTERGATION
At present, Viet Nam has diplomatic rela-tions with 167 countries and trade relationswith 154 countries. As discussed inChapter 2, the open door and economic
integration policies have strengthened thecountry’s economic potential and broughtsubstantial benefits to the majority of thepeople. It is unlikely that Viet Nam couldreplicate its past growth performance with-out a deepening of trade and investmentrelations. Economic integration involvesmany issues such as lowering tariffs andremoving non-tariff barriers, simplifyingtrade and custom systems, and improvingregulations for foreign investment. Thissection will focus on what is perhaps thebiggest challenge: increasing the country’scompetitiveness to ensure that it is able toreap the benefits of further integration.Economic integration also reinforces theurgent need for improving the enablingenvironment for private sector develop-ment and SOE-reforms. Still too often, cur-rent policies support inefficient import sub-stitution, discourage export-oriented activ-ities, and impose significant direct andindirect costs on other parts of the econo-my. There is in fact a continued tendency toprovide protection and other forms of sup-port on a selective basis to accommodatethe lack of competitiveness of certainactivities, producers or even whole sectors.
OPEN TRADE POLICIES
Open trade policies are crucial in (a) ensur-ing efficiency and achieving productivity
55HUMAN DEVELOPMENT CHALLENGES
l Implement women’s equal rights in the area of labour and employment toimprove women's economic status and living standards;
l Ensure the realization of women’s equal rights in education and create condi-tions for women to enhance their qualification levels in all aspects;
l Improve women’s health and increase the quality and quantity of the healthcare services and family planning services for women;
l Enhance the role and position and increase the participation of women in lead-ership and decision making, by for example mainstreaming gender in humanresource policies;
l Ensure the realization of women's rights and benefits and facilitate women'sparticipation in socio-economic activities;
l Capacity building and effective operation of the National Machinery for theAdvancement of Women.
BOX 3.3Key Objectives of the Action Plan for the Advancement of Women
(2001-2005)
Still too often, currentpolicies support ineffi-cient import substitution,discourage export-orient-ed activities, and imposesignificant direct and indi-rect costs on other partsof the economy.

growth by providing access to knowledgeand technology; (b) reducing risks throughdiversification of markets and sources ofsupply; (c) subjecting foreign and localenterprises to competitive pressure toimprove efficiency, and (d) locking in goodeconomic management. Without policiesthat involve further dismantling of impedi-ments to exports, Viet Nam is unlikely toexperience growth of manufacturing andservices that can support rapid job creationand income growth in agriculture. Withoutthe continued inflow of foreign invest-ments - targeted at efficient rather thanhighly protected activities - it will be diffi-cult to achieve the investment and produc-tivity improvements needed for growth.Without growth, the Government’s rev-enues will remain stagnant, unable to sup-port an expansion of social services andinfrastructure needed to improve humandevelopment (MPI/UNDP, 2001).
Although trade liberalization is expect-ed to bring about long-term benefits for themajority of the population, some groupsmay suffer from the increased exposure tointernational markets. It is therefore neces-sary to put in place appropriate policies andprogrammes to help people overcome theinitial difficulties and to gradually assisttheir adjustment to the new situation. Suchpolicies and programmes have not yet beenconsidered seriously in Viet Nam, with thepossible exception of a planned pro-gramme for labour redundancies in relationto SOE-reforms.
WEAK EFFICIENCY AND COMPETITIVENESS OF
THE ECONOMY
Although economic growth has picked up
after the Asian crisis, the structure ofgrowth has not changed much. Many otherAsian countries carried out significantreforms to improve the investment climatein response to the crisis, but the latter isstill poor in Viet Nam in spite of recentprogress. There remains a relatively strongfocus on industries with low productivityand competitiveness, preserved by highlevels of protection. Given that productsare mainly consumed in the domestic mar-ket, this creates a negative and unsustain-able spiral. Compared to the year 1987-1995, productivity appears to have fallen inthe period 1996-1999 and lags behindmany countries in the region.
THE BUSINESS ENVIRONMENT IS IMPROVING
BUT STILL NOT SUPPORTIVE
In recent years, the Government hasstepped up efforts to improve the businessenvironment and to attract foreignresources. The enactment of the NewEnterprise Law, amendments to the Lawon Foreign Investment and the implemen-tation of the SME Action Programme mayserve as good examples. Yet, there remainsan urgent need to enhance the competitive-ness of the economy in general and that ofindividual enterprises in particular. Thiscan be illustrated by the latest assessmentof the World Economic Forum. Comparedto other countries in the region as well as toother transition economies, Viet Nam’scompetitiveness is generally considered asrather low (Table 3.4).
As noted earlier, the process of global-ization is driven by lowered transactioncosts, as the impediments to trade and theimpact of modern ICT is reduced. Whilethe tariff reduction schedule for Viet Nam
56 NATIONAL HUMAN DEVELOPMENT REPORT 2001
TABLE 3.3 Growth accounting for Viet Nam 1987-1999
GDP growth Capital Labour Productivity Productivity growth 1987-95 7.4 42.8 22.1 33.9 2.51987-99 7.8 58.1 22.5 18.7 1.4
Source: UNDP/MPI, 2000. Globalization and International integration.
Some groups may sufferfrom the increased expo-sure to international mar-kets. It is therefore neces-sary to put in place appro-priate policies and pro-grammes to help peopleovercome the initial diffi-culties and to graduallyassist their adjustment tothe new situation

is mapped out quite clearly in the frame-work of AFTA, APEC and the BilateralTrade Agreement with the US, the capaci-ty and instruments necessary for integra-tion are still rather weak or only in an earlystage of formation. There is a need todevelop a comprehensive strategy – a“road map” - for implementing the agree-ments to which Viet Nam has committeditself.
With regard to modern ICT, the situa-tion is improving in Viet Nam, but perhapsstill too slowly for the country to take suf-ficient advantage of the new opportunities.Due to regulations that limit access toInternet and other modern means of com-munication, the country faces a risk ofbeing left further behind in this area. Arecent survey in the textile and garmentindustry indicates how slow some industri-al sectors are in adapting to the new way ofdoing business (see Box 3.4).
SOE-REFORMS
International economic integration calls fora profound change in the economic struc-ture. Many SOEs have enjoyed protectionfor a long time and it is doubtful that theycould operate normally, let alone success-fully compete, in the international anddomestic markets once the integrationprocess accelerates and pressure of foreignand domestic competition mounts. SOE-reform will therefore constitute one of themost important issues in the integrationprocess. Although estimates vary, up to 60per cent of SOEs are generally consideredas either inefficient or loss-making. Thesituation is probably even more severe ifall kinds of indirect and direct support bythe State were taken into consideration.
In the SOE-sector, ‘asking for request-and-grant’ practices are still common, aspart of the legacy of the central planningregime. From the perspective of enterpris-es, this may be understandable and evenrational. Yet, the continuation of direct andindirect subsidies to SOEs is costly anddistorts the incentive system of other sec-tors in the economy. Assigning too many
objectives, including social objectives toSOEs such as job creation, only adds to theexisting distortions and is financially notsustainable in the longer run. At present, itis estimated that approximately 150,000workers will become redundant as a resultof the SOE-reform. Further opening up theeconomy may generate new employmentopportunities, but some groups will be netlosers and will need special support.
The State will have to make a hardchoice: to continue supporting ineffectiveenterprises or to take decisive action inregards to reform. One thing is clear. Aslong as Viet Nam commits itself to liberal-izing trade and investment, opening up thedomestic market, and moving towardWTO membership, maintaining the cur-rent policy of protecting and supportingSOEs becomes increasingly difficult.Moreover, traditional industrial policytools, applied by many countries tostrengthen and to support certain indus-tries, will become more restrained underWTO rules and often involve a high risk offailure (Box 3.5).
3.3 REDUCING UNEMPLOYMENT AND
UNDEREMPLOYMENT
Creating sustainable jobs is crucial for theexpansion of people’s choices.Unemployment and underemployment will- through the erosion of people’s capabili-ties - not only reduce the country’s growthpotential, but may also involve high costs
57HUMAN DEVELOPMENT CHALLENGES
TABLE 3.4 Competitiveness ranking: Viet Nam and selected economies
Country 1996 1998 2000
South Korea 21 22 26Thai land 18 30 27Malaysia 9 16 32Philippines 34 33 35Indonesia 15 37 40India 45 53 45China 29 32 46Viet Nam 49 48 52
Source: World Competitiveness Report and EIU, 2000 (for 2000).
The State will have tomake a hard choice: tocontinue supporting inef-fective enterprises or totake decisive action inregards to reform.

for both the individual and society, possi-bly creating an upward pressure on socialwelfare expenditures, intensifying socialproblems as well as endangering socio-economic stability.
Although Viet Nam managed to create
more than a million jobs per year duringthe 1990s, employment creation remainsone of the greatest challenges for the coun-try in the years to come. This is due to anumber of reasons. First, the labour forcecontinues to increase at a rate of three percent annually, which means that every year,another 1.4 million people will enter thelabour market. These are young, oftenunskilled workers with minimal experi-ence, who live in rural areas where land isscarce and opportunities for non-farmingjobs are very limited. Secondly, structuralreform measures, including the SOE-reforms, will be accompanied by a consid-erable number of lay-offs. Thirdly, under-employment, of up to 25-30 per cent inrural areas, is also a serious problem inother sectors where the distinction betweenunderemployment and unemployment isoften blurred.
GROWTH AND EMPLOYMENT
Generally, economic growth provides bet-ter opportunities for employment andincome generation. This is also true in thecase of Viet Nam. However, high growthrates are necessary but not sufficient formore and better jobs. Whether economicgrowth is actually translated into employ-ment depends on many factors, includingthe quality of growth, the structure of theeconomy, the institutional environment andother policy variables. This may be illus-trated by trends in the FDI-sector. Formany years, this sector recorded the high-est growth rate - with an average growthrate of 19 per cent in the period 1994-1999.Yet, employment in FDI sector is still mod-est, accounting for less than one per cent ofthe labour force in 1999. This is largely dueto the fact that FDI inflows have beenmostly channelled into heavy and capital-intensive industries with highly protecteddomestic markets but little job creationcapacities (Economics Institute, 1999). Forinstance, 64.1 per cent of the total FDI dis-bursed in 1998 went to petroleum, heavyindustry, real estate and highly protectedand capital-intensive industries, whilst
58 NATIONAL HUMAN DEVELOPMENT REPORT 2001
Information and Communication Technology (ICT) has become increasinglyimportant for doing business in this fast-globalizing world. E-commerce and M-commerce are not merely fashionable words but are in actual fact profoundlychanging the way of doing business all over the world. The real competitivenessof an industry lies in its capacity to cope with and to benefit from this change.However, Viet Nam faces a real danger of being left out of the ICT-revolution.Although the country seems to be largely aware of this risk, the pace of adjust-ment is slow and a comprehensive strategy to respond to the new opportunitiesis still missing.
Recently, the Institute of Economics undertook a survey among some 100garment and textile enterprises. The industry is important in terms of export earn-ings and seems to have a relatively strong perspective in the world market due toits labour advantages. However, the industry faces a real danger of eroding itscompetitive edge, since it is not ready for the modern way of doing business.
Less than a quarter of the surveyed enterprises had computers and nearly halfof those with computers did not use them for management, marketing and cus-tomer services. Furthermore, nearly three-quarters of the surveyed enterpriseswere not at all familiar with the Internet. In fact, only one out of ten private com-panies had access to the Internet. High costs of communication due to significanttelecommunication costs and numerous regulations to protect monopolies in theIT-sector, together with other administrative measures, which make access to theworld’s virtual highway difficult and costly.
BOX 3.4WWW - Weaving Without Web: the Case of the Garment Industry
Source: Institute of Economics: A Study on the Competitiveness of the Textile and GarmentIndustry, 2000.
The effectiveness of industrial policy especially in Japan and Korea has beenwidely debated. Recent studies suggest that although industrial policy in Japanand Korea resulted in certain growth achievements, these were outweighed by thenegative effects on the banking system due to various forms of government sub-sidies and guarantees favouring certain industries. The implementation of indus-trial policy must therefore be carefully considered. In addition, many instrumentsof industrial policy used in the past will be less likely or even impossible to beapplied within the framework of WTO. This is not only true for support to infantindustries but also for export promotion instruments and assistance to the agricul-ture sector, among others. Developing countries need to focus on creating a soundmarket system in line with building institutions and infrastructure, supportingresearch and development activities and implementing competition policy.
BOX 3.5Industrial Policy and WTO Regulations
Source: Howard Pack. Industrial policy: a stimulus or a poison for economic growth, World Bank,2000. Bijit Bora, P.J. Lloyd and Mair Pangestu, Industrial policy and WTO, 2000.

only 12.4 per cent was allocated to the lightindustries and other sectors which aremuch more labour intensive and probablymore sustainable. Generally policies, eitherdirectly or indirectly, are still biasedtowards the development of capital-inten-sive industries, a fact that seriously hindersan employment friendly growth process.
The private sector plays a vital role ingenerating employment. Evidence overrecent years has shown that the private sec-tor is the sector that provides most of thenew jobs with relatively low levels ofinvestment. In 1998, the private industrialsector accounted for only 22 per cent ofoutput but employed 64 per cent of thetotal labour force in the industrial sector(Dao Quang Vinh, 2000). Data of employ-ment in the 1990s also shows that mostemployment growth has come from thenon-state sector, especially household andsmall and medium enterprises. While manyindustries were severely affected by theAsian economic crisis, the private enter-prises weathered the crisis rather well. Thedifference in job creation in different envi-ronments is reflected in the experiences ofHai Phong and Quang Ninh provinces(Box 3.6).
The New Enterprise Law, whichbecame effective in January 2000, has bol-stered the domestic private sector. The newLaw significantly lowers the costs andadministrative burden of setting up a pri-vate enterprise by simplifying and remov-ing more than a hundred licensing require-ments and related fees. During 2000,14,400 new small and medium sized enter-prises and 140,000 household businesseswere registered, with 500,000 new jobscreated. This growth rate was exceptional,relative to earlier years, and indicates a ris-ing business confidence in the country.However, unequal competition with theState sector, regulatory requirements, aswell as problems of access to land, capital,technology and markets continue to limitthe potential of the formal private sector.Consequently its overall contribution toemployment growth remains small in com-
parison with other Asian countries.Capacity building is another crucial issue.In light of the increasing international com-petition, it is essential that managers andworkers get the opportunity to understandand practice the modern and consumer ori-ented approach of doing business.
OFF-FARM EMPLOYMENT
The agriculture sector accounts for two-thirds of total employment and totalincome in rural areas. However, in 1998,unemployment in rural areas stood at 19per cent of the labour force, while under-employment amounted to some 29 percent. Due to limited and declining cultivat-ed land per capita, modest absorption ofmodern technologies, low levels of invest-ment in research and extension, weakness-es of supportive infrastructure and ser-
59HUMAN DEVELOPMENT CHALLENGES
Hai Phong and Quang Ninh are two provinces located in the Eastern North ofRed River delta. Both provinces belong to the North Triangle of Growth.However, in recent years, the development patterns in these provinces havediverged, leading to notable differences in employment generation.
The private sector has played an important role in Hai Phong. During 1996and 1997, Hai Phong generated 55,470 jobs, about 30,000 of these in the privatesector. In the following year, the private sector was responsible for nearly all jobcreation, creating ten times as many jobs as the state sector, particularly in thenewly emerged shoe industry. In less than 10 years, the industry grew from anegligible size to the city’s biggest employer and foreign exchange earner. Atpresent, the industry is the most important employer in the city with close to30,000 jobs, of which half can be found in the private sector. In the same period,the share of employment rose from about one per cent to over 20 per cent of theindustrial labour force in the province. Even during the Asian crisis, bothemployment and production in this industry increased.
At the same time Quang Ninh, a neighbouring province is facing seriousproblems with regard to employment generation. The private sector is underde-veloped and labour is mainly employed in the coal sector. The efficiency of thissector remains very weak and labour productivity is low. In 1999, due toupheavals in the international market, the consumption of coal fell back, causingCoal General Corporation - a state-owned monopoly - to suspend its production.The restructuring of the coal sector will inevitably lead to a large number of laid-off workers. Employment generation in other sectors will be a pressing issue thatQuang Ninh will have to address urgently.
BOX 3.6A Tale of Two Cities: Employment in Hai Phong and Quang Ninh
Source: Adapted and updated from David Dapice, 1998.
The private sector plays avital role in generatingemployment.

vices, and a lack of agricultural diversifica-tion, underemployment is expected tobecome an even more serious problem.Provinces with the highest levels of under-employment were Quang Tri (57.5 percent) Hung Yen (59.3 per cent), Hai Duong(67.4 per cent) and Ha Tinh (72.0 per cent,MOLISA, 1999). Policy measures promot-ing better and more diversified employ-ment in rural areas to ensure people ‘leav-ing farming without leaving village’through rural industry development, pro-viding local services, traditional craft vil-lage development, have been implementedwith some success. In order to generatemore value added, there appears to be aparticular need to establish and furtherdevelop processing industries in rural areas(see Box 3.7).
Rapid growth in the off-farm sector isurgently needed to create opportunities foremployment and to assist rural householdsto diversify and raise incomes, but is ham-pered by a number of constraints. Some ofthem are associated with specific risks anduncertainties in agricultural production andthe absence of appropriate mechanisms tohandle these risks. Other constraints are
similar to those that the non-State sectorgenerally faces.
QUALITY OF THE LABOUR FORCE
The non-State sector, particularly the cor-porate private sector, has not yet been ableto realise its full potential. Moreover, expe-riences of other countries in the regionindicate that it also needs to move up thevalue chain in order to avoid being caughtin a low cost labour trap. Therefore, thesector does not only need to create morejobs, it will also have to increase theknowledge and skills and hence productiv-ity of the existing and new labour force.
By international standards, the skillslevel of Viet Nam’s labour force is still rel-atively low, although literacy levels arequite high. In 1998, unskilled labouraccounted for 86.7 per cent of Viet Nam’stotal labour force with correspondingshares in rural areas and urban areas of91.9 per cent and 66.3 per cent, respective-ly. There appears to be a rather close corre-lation between the share of unskilledlabour and the underemployment rate. Theinadequate vocational training system isone of the main reasons for the insuffi-ciently skilled labour force, and has beenneglected in favour of more general formsof education.
NATIONAL PROGRAMMES FOR JOB CREATION
Being aware of the role of job creation fornational development, the Government hasundertaken great efforts in directly sup-porting employment. To this aim, theNational Programme for HungerElimination and Poverty Reduction(HEPR) and the National Program ofEmployment Promotion have been devel-oped, and were recently merged into oneProgramme for Hunger Elimination,Poverty Reduction and Job Creation.According to MOLISA these programmesmay generally be considered as effective,although their implementation has high-lighted that some issues that may need fur-ther consideration (ILO, 2000). Firstly,these programmes rely mainly on subsi-
60 NATIONAL HUMAN DEVELOPMENT REPORT 2001
The underdevelopment of agricultural product processing and rural industries isone of the “bottlenecks" in rural economic development. The ratio of processedagricultural products is still very low: sugarcane (30 per cent); tea (60 per cent),vegetable and fruits (5 per cent), meat (1 per cent), aqua-products (25 per cent).Processing facilities with modern machinery are scarce; most are long-estab-lished, backward-equipment and low-tech processing facilities for rice, tea, veg-etables and fruits, and sugar care. In general, the capacities of the processingindustry and after-harvest technology have a long way to go to meet the require-ment of agricultural product quality and efficiency. Most of agricultural productsare sold as raw or semi-processed materials. Physical conditions of rural indus-trial facilities and of household business are poor owing to low investment for thearea: only 18.6 per cent are housed in concrete buildings, 15.0 per cent are with-out electricity, and in 63 per cent of the firms, work is done manually. Productsof rural industries are mainly domestic market-oriented, except for some tradi-tional crafts and fine arts. Many items are poor in style, quality, package andmarketing.
BOX 3.7Processing industries: Capturing the Value Added
Source: Nguyen Thang, Occasional Paper, 2000.
Rapid growth in the off-farm sector is urgentlyneeded to create opportu-nities for employment andto assist rural householdsto diversify and raiseincomes, but is hamperedby a number of constraints.

dized credit. According to internationalNGOs, subsidized credit (to well belowaverage market interest rates) may actuallyreduce access by the poor due to competi-tion with more creditworthy borrowerswho gain access through indirect means.Subsidized credit may also distort the func-tioning of the credit market, including themobilization of new resources, as well asaffect the sustainability of the programmes.Secondly, data on the EmploymentPromotion Programme shows that theinvestment costs to create new jobs hastended to increase, from 0.7-0.8 millionVND in 1992- 1994 to 1.4 million VND in1998 and 2.2 million VND in 1999(MOLISA, 2000), reflecting a decreasingefficiency. This may be partly related to thefact that many of new jobs are still createdin the agricultural sector rather than in off-farm industries. Finally, there seems to becontinuous need to strengthen the capacityto implement, monitor and coordinate theprogrammes in order to render them moreeffective.
3.4. IMPROVING THE KNOWLEDGE AND
INFORMATION SYSTEM
As noted earlier, Viet Nam should not onlymake use of the advantage of low labourcosts, it should also increase the labourproductivity by absorbing modern skills,new knowledge and the latest informationand communication technologies (ICTs).The continuously changing nature of tech-nologies demands not only new skills, butalso creativity in applying new knowledgeand flexibility to adjust to changes. This isparticularly important for Viet Nam, as ithas been a relative latecomer in this area.The weaknesses in the current educationand science system need to be given seri-ous attention as they manifest themselvesto an increasing extent. There is thus aneed for fundamental and comprehensivereform in the education programme, inteaching and learning methods as well asupgrading teachers’ capacities and schoolinfrastructure.
EDUCATION AND TRAINING
There are various shortcomings in the edu-cation and training programmes. The firstand foremost is that education and trainingprogrammes generally focus on the provi-sion of ‘textbook knowledge’ with studentsbeing rather passive recipients of knowl-edge. Also, ‘learning’ tends to heavilydominate ‘practising’ rather than to be inbalance with each other. Moreover, there isa clear mismatch between supply anddemand: the knowledge provided oftenfails to respond to the demands of thelabour market. Many people seem to studyonly to attain ‘degrees’ and ‘certificates’rather than to acquire relevant and applica-ble knowledge. More specifically, foreignlanguages and computer science - the twobasic components of a modern educationsystem - are not paid due attention.
Another challenge facing Viet Nam isthat teaching staff does not meet the newrequirements of a modern education sys-tem, both in terms of quantity and quality.In the school year 1998-99, the pupils-to-teacher ratio at primary education was 30.5at a national level, with significant region-al disparities. In cities and deltas this figureis lower, but rural and mountainous areasface a lack of teachers, particularly at highschool levels. The most pressing problem,however, pertains to the quality and quali-fication of teachers. This is partly becausethe education and training programmes arenot appropriate, and partly due to lowsalary levels, which do not provide enoughof an incentive to upgrade qualifications.During the school year 1998-99, only 77.2per cent of primary school teachers reachedthe national teaching standards. In ruraland mountainous areas this rate is muchlower. For example, in the mountainousprovince of Lao Cai, the figure was only52.8 per cent. It should be added that thenational teaching standards do not fullyrespond to the demands of a globalizingeconomy and Viet Nam’s ambition tobecome a knowledge-based economy.
Meanwhile, school infrastructure is still
61HUMAN DEVELOPMENT CHALLENGES

in poor condition in spite of some improve-ment over recent years. Firstly, there is anapparent lack of classrooms, which neces-sitates two shifts a day in most secondaryschools, and sometimes even requires anight shift in some colleges and universi-ties. Classes are often over-crowded: thereare on average 35.5 pupils per class in pri-mary schools; 41.6 per class in lower sec-ondary schools; and 48.4 per class in uppersecondary schools (GSO, 1999).Particularly in rural and remote areas,classrooms are often in very poor conditionwith leaf roofs, soil walled classrooms anda shortage of tables and chairs.
Secondly, schools at both secondaryand tertiary levels lack the normal studyingmaterial and experimentation facilities, letalone modern equipment. Only a smallnumber of students in big cities are in aposition to use modern tools and equip-ment for learning foreign language andcomputer science. In general, budgetexpenses for schools have been too smalland the education programs have beenbiased towards mostly ‘word teaching’rather than the experimental and practisingmethods.
The huge knowledge and educationgaps across the country present anothergrave problem. The low level of socio-eco-nomic development and the poor infra-structure in many isolated rural and moun-tainous areas hamper people’s access to
education, knowledge and technology. Inmountainous provinces, illiteracy rates arehigher, there are only a few qualified teach-ers, and enrolment rates at all schoolinglevels are low (see Table 3.6).
SCIENCE AND TECHNOLOGY
Two salient features characterize the pre-sent situation with regard to science andtechnology in Viet Nam: low capacitywithin the science and technology sector(see Box 3.8) and weak linkages with othersectors of society. In this respect, it isworthwhile to refer to the experiences ofthe East Asian countries over the lastdecades (see Box 3.9).
Viet Nam has designed four PriorityTechnology Programmes, namely theProgramme of Information Technology,the Programme of Biology Technology, theProgramme of Material Technology, andthe Programme of Automatic Technology.As a relative latecomer and given thefinancial constraints, it is very importantfor Viet Nam to decide what to do and howto do it. The Government considers theestablishment of a number of high-techcentres as a key step to implement technol-ogy programmes as well as an importanttool to bridge the gap between science andtechnology on the one hand and the busi-ness sector on the other. This process isstill in an initial stage.
62 NATIONAL HUMAN DEVELOPMENT REPORT 2001
TABLE 3.6 The education gap
Adult literacy rate (1999) Net enrolment rate (1998/99) Number of post-graduates
Lai Chau 51.3 28.0 13Gia Rai 69.3 38.6 51Binh Phuoc 88.2 43.4 10Tra Vinh 82.5 42.9 0Nationwide 90.3 70.0 8,569Ha Noi 96.9 76.2 5,872Thai Binh 94.6 67.9 265Nghe An 92.8 55.7 363Dong Nai 92.5 54.9 100
Based on: The Population Census in April 1999.

ACCESSING TO INFORMATION AND KNOWL-EDGE
As information and knowledge becomesmore widespread, people’s access to infor-mation and knowledge is basically deter-mined by three following factors: (i) edu-cation level; (ii) real income; and (iii) insti-tutions and policies that affect the access toinformation. All three factors haveimproved during the doi moi process, butthe changes have not kept pace with thespread of information flows and the devel-opment requirements.
In respect to education level, the highliteracy rate is certainly a favourable con-dition. However, the majority of the popu-lation lives in rural areas and often onlyhave basic education, whilst only those thathave mastered the English language caneffectively use the Internet. Besides, givenlow income levels the priority for the mostVietnamese remains to meet basic needssuch as food, clothes, housing and trans-port, as well as to manage risks. The major-ity of families spend about three-quartersof their income satisfying these demands;only the remainder is available for thestudy of their children, buying newspapers,radio, television, telephone and a comput-er, as examples.. In this respect, it shouldbe noted that consumption goods are morecostly than necessary due to the relativelyhigh protection of many manufacturingindustries. The high price of communica-tion services further hinders people’saccess to information, especially theInternet. The telephone charges in Vietnamare high in comparison with the averageincome level and depend on whether callsare within or outside a province or city.Nearly 40 per cent of total telephones arein Hanoi and HCMC, while their popula-tion accounts for only ten per cent of thenational population. The number of tele-phones per 1,000 people in Hanoi and HoChi Minh City is many times higher than inother provinces. Access to telecommunica-tion is still limited in rural and remote areas(Table 3.7).
Another final hindrance is that ‘gate-ways’ to the Internet are still narrow. Thisnot only hinders information exchangesbut also increases the access fees.Consequently, many ‘golden’ opportuni-ties, for example large-scale e-commerce,are being lost.
3.5. PUBLIC INVESTMENT AND PUBLIC SER-VICES
In addition to indirect measures that aim toimprove the enabling climate for theexpansion of people’s choices, the Statecan also directly contribute to the reductionof poverty through the allocation of publicexpenditures, that is, financing publicinfrastructure, providing public servicesand implementing anti-poverty pro-grammes. In these areas, the State faces afive-fold challenge.
Firstly, there is a general lack of publicfunds, which is exacerbated by the gradualdecline of tax revenues in recent years. In
63HUMAN DEVELOPMENT CHALLENGES
The current situation of science and technology is far from optimistic. Someobservations:
Large in number but weak in quality: Viet Nam has numerous workers in sci-ence and technology but the quality of workers is rather low. There are biasestoward university graduates rather than technicians and towards people with aninterest in vocational training. There is a lack of scientific leaders.
A team of old ‘guards’: The average age of scientists is high: 60 per cent ofuniversity graduates are over 45 years old; the average age of professors, associ-ate professors in research institutes is 57 years old. There is no team of young andcapable scientific and technological experts to replace the old-aged team.
Concentrated in urban centres: The network of scientific institutions isunequally spread over the country, mostly centralized in two big cities Hanoi andHCMC (80 per cent). A large number of scientific research institutions form ahigh burden for the state budget with unprofitable investments.
Ill-equipped: The scientific and technological infrastructure is poor; facilitiesand equipment are out-dated, even worse than those of elite manufacturing enter-prises in the same field.
Disconnected: The link between scientific research and the socio-economiclife and business activities is weak. Research does not attach to and originatefrom real demands. Business does not rely much on science and technology dueto the undeveloped nature of the competitive environment.
Adapted from "Strategy for scientific and technological development to theyear 2010", Ministry of Science, Technology and Environment.
BOX 3.8The Science and Technology Sector in Vietnam
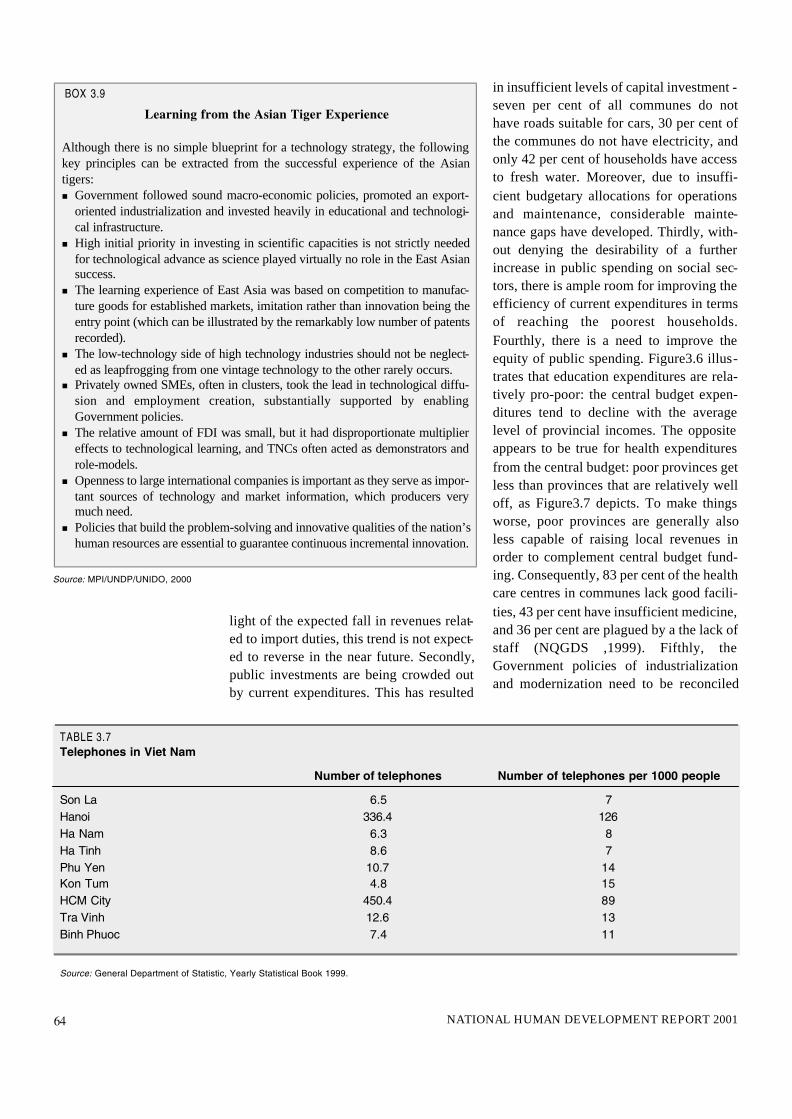
light of the expected fall in revenues relat-ed to import duties, this trend is not expect-ed to reverse in the near future. Secondly,public investments are being crowded outby current expenditures. This has resulted
in insufficient levels of capital investment -seven per cent of all communes do nothave roads suitable for cars, 30 per cent ofthe communes do not have electricity, andonly 42 per cent of households have accessto fresh water. Moreover, due to insuffi-cient budgetary allocations for operationsand maintenance, considerable mainte-nance gaps have developed. Thirdly, with-out denying the desirability of a furtherincrease in public spending on social sec-tors, there is ample room for improving theefficiency of current expenditures in termsof reaching the poorest households.Fourthly, there is a need to improve theequity of public spending. Figure3.6 illus-trates that education expenditures are rela-tively pro-poor: the central budget expen-ditures tend to decline with the averagelevel of provincial incomes. The oppositeappears to be true for health expendituresfrom the central budget: poor provinces getless than provinces that are relatively welloff, as Figure3.7 depicts. To make thingsworse, poor provinces are generally alsoless capable of raising local revenues inorder to complement central budget fund-ing. Consequently, 83 per cent of the healthcare centres in communes lack good facili-ties, 43 per cent have insufficient medicine,and 36 per cent are plagued by a the lack ofstaff (NQGDS ,1999). Fifthly, theGovernment policies of industrializationand modernization need to be reconciled
64 NATIONAL HUMAN DEVELOPMENT REPORT 2001
Although there is no simple blueprint for a technology strategy, the followingkey principles can be extracted from the successful experience of the Asiantigers:n Government followed sound macro-economic policies, promoted an export-
oriented industrialization and invested heavily in educational and technologi-cal infrastructure.
n High initial priority in investing in scientific capacities is not strictly neededfor technological advance as science played virtually no role in the East Asiansuccess.
n The learning experience of East Asia was based on competition to manufac-ture goods for established markets, imitation rather than innovation being theentry point (which can be illustrated by the remarkably low number of patentsrecorded).
n The low-technology side of high technology industries should not be neglect-ed as leapfrogging from one vintage technology to the other rarely occurs.
n Privately owned SMEs, often in clusters, took the lead in technological diffu-sion and employment creation, substantially supported by enablingGovernment policies.
n The relative amount of FDI was small, but it had disproportionate multipliereffects to technological learning, and TNCs often acted as demonstrators androle-models.
n Openness to large international companies is important as they serve as impor-tant sources of technology and market information, which producers verymuch need.
n Policies that build the problem-solving and innovative qualities of the nation’shuman resources are essential to guarantee continuous incremental innovation.
BOX 3.9Learning from the Asian Tiger Experience
TABLE 3.7Telephones in Viet Nam
Number of telephones Number of telephones per 1000 people
Son La 6.5 7Hanoi 336.4 126Ha Nam 6.3 8Ha Tinh 8.6 7Phu Yen 10.7 14Kon Tum 4.8 15HCM City 450.4 89Tra Vinh 12.6 13Binh Phuoc 7.4 11
Source: General Department of Statistic, Yearly Statistical Book 1999.
Source: MPI/UNDP/UNIDO, 2000

with environment protection, which willprobably require an increase in publicexpenditures in this area.
Obstacles in capital mobilization arecontributing factors as to why regional dis-parities are difficult to resolve. Althoughthe State has had a special programme ofinfrastructure development in extremelypoor communes (accounting for only 9 percent of all poor), the number of beneficia-ries remains small. Capital resources arefar below actual needs, and are surelyinsufficient to cover maintenance costs.Support from international organizations isessential to assist in filling the gapsbetween the available resources and theactual needs. At the same time, there isample room to improve the economic effi-ciency of such programmes.
Another bottleneck is the limited accessto credit for production and business activ-ities of the poor, especially in rural areas.Looking at the actual lending and borrow-ing by households in the VLSS 1997/1998,there is indeed evidence of credit marketfailure or credit rationing: access to creditis restricted by a lack of collateral and alack of reputation. It is estimated that in1999 over 80 per cent of the poor house-holds in need of credit were not able to bor-row on the official market. As a conse-quence, many had to turn to the informalcredit markets, where they faced higherinterest rates. The credit programmes sup-ported by the State do not seem to offermuch solace. Subsidizaton of interest ratesis probably not sustainable and has pushedsmall credit organizations out of the creditmarket.
Subsidized credit, however, still consti-tutes a major component of the NationalTarget Programme for HungerEradication, Poverty Reduction and JobCreation, being coordinated by theMinistry of Labour, Invalids and SocialAffairs (MOLISA). Other componentsinclude basic infrastructure, and legalassistance to ethnic minorities, sedentariza-tion, and staff training in public health andeducation services. It now combines the
National Target Programme for HEPR(Programme 133) and the support to the1,715 poorest communes in mountainousand remote areas (Programme 135). Theseprogrammes have recorded notableachievements in poverty reduction in vari-ous regions (MOLISA 1999). This is not todeny that several problems need to beaddressed, such as the inability to mobilizediversified resources to sustain pro-grammes; weak co-ordination between
65HUMAN DEVELOPMENT CHALLENGES

government agencies; insufficient targetingof the support towards those living inextreme poverty; weak implementationcapacity at local levels; and a low partici-pation of people.
Finally, there is a need to improve thecoverage, effectiveness and efficiency ofsocial safety nets. Although the share ofthe Government’s budget spent on safetynets is relatively high for a low -incomecountry, the main weakness of the systemis that the majority of the beneficiaries arenot the poor. The reason is that the largestshare of the spending is directed towardsSocial Security and Special Transfers,which benefit former State sector employ-ees and war veterans. The only formal pro-tection available for the poor consists ofthe Fund for Pre-Harvest Starvation andDisaster and to a smaller extent the Fundfor Regular Relief, which receive only lim-ited funding from the central Government.Farmers especially, and those working inthe informal sector, are not covered bysocial insurance and hardly benefit fromsocial relief. In addition to the weak target-ing and low coverage of the poor, the grantamount provided under the two Fundsreaching the poor is modest, as it dependson limited local budgets. Also, none of theexisting safety net mechanisms address inan appropriate way social costs of reformsand community risks.
One typical example of a communityrisk is natural disasters, particularly floods,which is one of the main causes of povertyof many people in Viet Nam. The policydealing effectively with risks has to focuson three aspects: preventing risks, mini-mizing risks and relieving the effect of dis-asters. Although the warning system fornatural disasters is quite strong, and thedelivery of emergency relief assistance tomitigate the impacts of disasters on peopleis relatively efficient, there is still ampleroom for improvements. One of the mostpressing needs is an adequate disasterrehabilitation system that could restorepeople’s livelihoods, and rehabilitate socialservices and infrastructure. Support from
communities and society is in its initialstages, and rather insignificant in regardsto the requirements of poor people.
CHALLENGES IN PROTECTING THE ENVIRON-MENT
Since the launching of doi moi in 1986,high economic growth rates, high popula-tion growth and migration flows haveresulted in increased pressure on VietNam’s natural environment. Evidence ofincreased environmental degradation isreflected in the following facts:
n Forest degradation . Illegal logging,along with war-time defoliation, migra-tion and investment projects, have led toreduced forest cover. Forest cover fell to28 per cent of the country's area (from43 per cent in 1943). Despite theGovernment’s efforts to tackle the prob-lem through National ReforestationProgrammes such as Programme 327and the Five Million HectareReforestation Programme, forest degra-dation remains serious.
n Biodiversity loss. The degradation offorests, wetlands, and coral reefs andtrade in endangered species threaten VietNam’s unique biodiversity. Over 700species are listed in the Red Data Bookof Viet Nam as threatened, and hundredsof thousands of wild animals are cap-tured every year for illegal wildlifetrade. In 1995, about 28 per cent ofmammals, ten per cent of birds, and 21per cent of amphibians and reptiles wereat risk.
n Water resources degradation. Domesticand industrial wastewater is dischargeddirectly into canals, rivers and lakes.Organic substances, pesticides, fertilis-ers, heavy metals, toxic chemicals, andoil spills pollute surface and groundwaters. The use of chemical substancesis high compared to other countries andexpected to rise further. About ninety percent of industries have no wastewatertreatment facilities. Groundwater quanti-ty and quality has decreased.
66 NATIONAL HUMAN DEVELOPMENT REPORT 2001
Subsidizaton of interestrates is probably not sus-tainable and has pushedsmall credit organizationsout of the credit market.
n Air pollution. Pollution from vehiclesand heavy industry is a serious problemand has a negative impact on health inlarge cities such as Ha Noi and HCMC.Air pollution levels regularly exceed twoto five times accepted standards.Pollutants from industries (e.g., thermalpower, chemicals, metallurgy, mining)such as sulfure dioxide (SO2) are oftentwo to three times higher than permitted.
n Solid wastes. Both domestic and indus-trial solid wastes are being dumped inunprotected sites causing serious pollu-tion, especially in large cities.
n Degradation of marine resources. Near-shore fisheries have largely collapsedand fishermen have suffered sharpdeclines in income. Small-scale dyna-mite and cyanide fishing has becomemore widespread.
The need for rapid industrialization andmodernization poses many challenges inthe field of environment management.GDP is planned to double over the next tenyears, the share of industry is targeted torise from 36-37 per cent in 2000 to 42-43per cent in 2010, and urbanization isexpected to grow from less than a quarterin 2000 to a third by 2010. Great emphasisupon the further development of heavyindustries, such as steel, cement, miningand chemicals will put further pressure onthe environment. For example, it is esti-mated that with the current pattern ofgrowth in place, pollution will increase by3.8 times in ten years, equivalent to agrowth rate of fourteen per cent per annum(World Bank, 1996). Expenditure on healthcare associated with industrial pollutionalready accounts for 0.3 per cent of GDP.These costs are projected to rise to around1.2 per cent of GDP in ten years time(WB/UNDP/ADB, 2000). Growing urban-ization also puts great pressure on manyurban management issues, including urbantransportation, waste management, watersupply and drainage.
The first challenge is therefore toexplore ways to achieve the country's
objectives through a less environmentallydamaging pattern of growth.Environmental considerations need to beintegrated into economic decision-making,especially with regard to the energy andinfrastructure sectors. In all sectors, there isa need to absorb modern technologies,notably ICT. At present, about 76 per centof machinery and equipment embodiestechnologies from the fifties and sixties,seventy per cent are worn out and nearlyfifty per cent are second-hand or just newlyrenovated.
Secondly, there is a need to furtherimprove the implementation and enforce-ment of the Law on EnvironmentalProtection and related documents, as wellas to upgrade the capacity of Governmentstaff to engage in sustainable environmen-tal management. Although Viet Nam hascommitted to various international treaties,including the Convention on InternationalTrading in Endangered Species of WildFauna and Flora, the Montreal Protocol,the Basel convention on the Control ofTrans-Boundary Movements of HazardousWastes and their Disposal, its capacity toimplement these agreements is ratherweak.
Furthermore, although awareness ofenvironmental issues and sustainabledevelopment has increased, it is still lowand far from a level that could catalysemuch needed actions. The use of economicinstruments, such as user charges, may alsocreate incentives for changing behaviourand may be more effective than relying onadministrative measures alone. Also, ahigher level of public participation shouldenhance accountability, particularly at thelocal level.
Finally, financing for the environmentis limited in the national budget, andmobilization of international environmentfunds such as the Global EnvironmentFacility and Montreal Protocol hasremained relatively minimal. With thedevelopment of the NationalEnvironmental Strategy 2001-2010, theGovernment has made an important step
67HUMAN DEVELOPMENT CHALLENGES
The need for rapid indus-trialization and moderniza-tion poses many chal-lenges in the field of envi-ronment management.Environmental considera-tions need to be integrat-ed into economic deci-sion-making.

forward in mainstreaming the environmentinto policy making, building and improv-ing its institutional and legal framework aswell as strengthening overall environmen-tal management.
CONCLUDING REMARKS
At the end of the chapter it may be con-cluded that the human development chal-lenge, particularly poverty reduction,remains urgent in Viet Nam. The countryremains one of the poorest countries in theworld, while the gap between the rich andthe poor tends to widen and regional dis-
parities are considerable. Many causes ofpoverty have not been overcome in a sus-tainable manner and the risk that peoplewill remain or fall back into poverty is seri-ous. Moreover, it should be noted that thetask of “catching up” with more advancedcountries will in fact be very much depen-dent on the process of poverty reduction.After having discussed the reforms neededin a number of key areas, chapter 4 willdiscuss the major policy measures thathave to be taken in order to fulfil the ambi-tious target of rapid poverty reduction overthe next ten years.
68 NATIONAL HUMAN DEVELOPMENT REPORT 2001
The socio-economic policies thathave been pursued in Viet Nam,especially since the launch of the
doi moi programme, have clearly put peo-ple at the centre of development. Beforedoi moi, the centrally planning mechanismprovided only weak incentives and limitedopportunities for people to form and usecapabilities and hence to enlarge theirchoices. Doi moi however broughtremarkable achievements through promot-ing a multi-sector economy with diversi-fied forms of ownership, moving towardsa more open and market-oriented econo-my, proactively engaging in internationaleconomic integration as well as expandingand upgrading public services.
This is not to deny that doi moi hasbeen and still is a complicated process,especially given the fact that Viet Namremains a poor and populous country intransition. As highlighted in the Ten YearSocio-Economic Development Strategy2001-2010, the country aims to substan-tially improve the quality of people’s lifeover the decade to come, which is verymuch supported by the international com-munity. One of the most difficult tasks willbe to overcome the institutional con-straints that limit the mobilization andeffective utilisation of resources for devel-opment, harm the country’s competitive-ness and affect the quality of growth. Suchtasks are more challenging, as they need tobe taken up in the context of globalizationwith unprecedented technological changesand rapidly growing interdependencies.Therefore, consolidating and deepeningthe doi moi process will play a decisiverole in establishing the industrialized and
modernized country Viet Nam aspires tobe by 2020.
Based on the analysis in previous chap-ters, this chapter will focus on five keycomponents of a comprehensive strategy toenhance human development in Viet Nam:(i) accelerating institutional reforms partic-ularly for the effective implementation ofpolicies and laws; (ii) furthering economicrestructuring; (iii) promoting rural devel-opment; (iv) reforming education andtraining, science and technology; and (v)expanding and improving public services.Policy recommendations in these five areasare briefly discussed below.
ACCELERATING INSTITUTITIONAL REFORMS
Over the last twenty years, institutionalreforms have led to profound changes innearly all sectors of the economy, includ-ing agriculture, private households andexternal trade. Further reforms will bemore complicated since they will touchupon many fundamental issues related toland, SOEs, the financial sector, State man-agement, social policies and people’s par-ticipation. Deepening the doi moi processtherefore requires not only new ways ofthinking but also determination to carry outreforms by the Vietnamese leadership andpeople.
Reforming economic institutions firstof all calls for further improvement of thelegal framework, clarifying the ‘rules ofthe game’ in an open, market-orientedeconomy. This includes the developmentof markets such as the labour market andthe real estate market. Also imperative is toestablish a truly level playing field for alleconomic sectors. Rather than making
69DEEPENING THE DOI MOI PROCESS
CHAPTER 4
Deepening the Doi moi process
Deepening the doi moiprocess therefore requiresnot only new ways ofthinking but also determi-nation to carry out reformsby the Vietnamese leader-ship and people.

amendments to the various laws that regu-late business activities of the different sec-tors, a unified law for all businesses shouldbe made. Furthermore, there is an urgentneed to review laws such as the Land Law,Labour Code, Bankcruptcy Law, and theLaw on Banking and Financial Institutions,while new laws will have to be developed,including a Competition Law, Law onIntellectual Property Rights, and a Law onE-commerce. These new laws should beconsistent with existing laws, internationalstandards and bilateral and multilateralcommitments. Taken together, thisdemands a comprehensive review of theexisting system of regulations pertaining tointernational trade and investment.
Improving the legal system alone can-not guarantee a better business climate anda level playing field. Laws need to beenforced effectively, which should be partof bigger package of public administrationreforms. At present, the State’s interven-tion in commercial areas is still heavy, withcumbersome administrative proceduresand low quality business support services.Moreover, corruption has become ofincreasing concern to both the Party andGovernment. In some important areastransaction costs and risks of doing busi-ness have increased. Rent-seeking behav-iour ultimately undermines the dynamicdevelopment of the business sector and theeconomy’s overall competitiveness. Majordirections in public administration reformswill therefore include streamlining admin-istrative procedures, reducing ‘giving-ask-ing’ practices, increasing transparency andaccountibility of the State, fighting corrup-tion, as well as improving the quality ofpublic sector and public services.
At the same time, wider participation ofthe public into social, economic and politi-cal life needs to be promoted. This is worthpursuing for its own sake - in empoweringpeople – but also to ecourage improve-ments in the capacity and quality of theState apparatus. However, public participa-tion will only be effective if it is organizedin an open, equitable and transparent man-ner. A prime task is thus to accelerate pub-
lic administration reform and to implementgrassroot democracy. This will help to real-ize the doi moi principle ‘people know,people discuss, people do and peoplereview’. The role of associations and massorganizations as representatives of differ-ent social groups and stratas of societyshould be promoted further.
The effectiveness of people’s participa-tion not only depends on opportunities, butalso on people’s capabilities to participate.Awareness raising and public education areessential to ensuring that people betterunderstand their rights, entitlements andobligations. It would also help mitigatebureaucracy, reduce corruption, and dis-courage "undemocratic behaviour".
FURTHERING ECONOMIC RESTRUCTURING
Economic reforms include a comprehen-sive set of policy measures in areas ofSOEs, the financial sector, and externaltrade as well as measures to promote pri-vate sector development.
Further SOE-reforms are necessary toincrease the efficiency of the sector andbuttress the competitiveness of the wholeeconomy. The Government plans to equi-tize, divest or close a third of the 5300SOEs in the years 2001-2003. This willfree up capital, land, and skilled labour forthe private sector. The remaining SOEswill need to be subjected to greater disci-pline and transparency through theenforcement of hard budget contraints andthe use of external audits. Furthermore, theGovernment should promote a level play-ing field through a revision of its invest-ment and subsidy policies and a removal ofother forms of SOE-protection.
In parallel, the financial sector is inneed of a major overhaul. A sound andeffective financial sector is critical formaintaining macroeconomic stability aswell as mobilising and wisely usingresources for development. There is a needto implement comprehensive reforms thatcould substantially increase the indepen-dence and supervisory capacities of the
70 NATIONAL HUMAN DEVELOPMENT REPORT 2001
Wider participation of thepublic into social, eco-nomic and political lifeneeds to be promoted.

State Bank, restructure State-owned andjoint-stock banks, seperate “policy” fromcommercial objectives in banking actitivi-ties and foster fair competition in the bank-ing sector.
By signing multilateral, regional andbilateral trade agreements, Viet Nam hasmade commitments to gradually move toan environment of uniform and low tariffrates. These agreements, however, have animpact that go well beyond trade. TheGovernment should therefore work out acomprehensive Economic IntegrationAction Plan to implement the agreementsto which Viet Nam is or will become partyto. It should focus on policy, legislationand institutional issues as well as dealingwith the profound fiscal and social conse-quences. As to the latter, the Governmentshould consider a careful sequencing oftrade and investment reforms which thepoor particularly depend upon. A concreteexample would be to give priority to liber-alization of inputs for farmers such as fer-tilizers and seeds, while still respectingdeadlines in already signed trade agree-ments. Such sequencing would enablefarmers to cushion the possible negativeimpact of liberalization that they will haveto face in other areas.
The private sector will have a biggerrole to play in successfully implementingGovernment policies to attain the ambi-tious targets Viet Nam has set for itself.Although the New Enterprise Law hasconsiderably contributed to a better envi-ronment for the private sector, effortsneed to be stepped up to ensure that theLaw is properly implemented at the locallevel throughout the whole country,together with further deregulation andother initiatives.
PROMOTING RURAL DEVELOPMENT
As discussed in chapter 3, boosting agricul-tural productivity, diversifying productionand promoting non-farm business activitiesare crucial to ensure food security, increaseincomes and reduce people’s vulnerability
in rural area. The enactment of the newLand Law - realizing land use rights forfarmers - will be an important measure toachieve these aims. The effective enforce-ment of these rights, including the right totransfer and the right of mortgage, alsorequires that proper administrative condi-tions be put in place. Special considerationneeds to be given to women entrepreneurs.They have more difficulty than men in rais-ing capital because they are less likely to benamed as the owner of assets used for col-lateral, e.g. land and housing.
Other institutional measures include theelimination of State monopolies and lower-ing entry barriers of agricultural markets.This would make the market more compet-itive and improve the bargaining power ofsmall farmers. Carefully selected price orincome support systems as well as com-modity insurance schemes might also beconsidered to assist individual farmers tocope with price volatilities. TheGovernment should also further supportfarmers through the provision of informa-tion, better extension services, promotionof new technologies, improved infrastruc-ture and rural-urban transport and higherquality of other supporting services, espe-cially in more remote areas.
Further promotion of estate farming iswarranted. This relatively new form of pro-duction organization has already broughtabout visible and encouraging results: bet-ter utilization of resources, especially landin remote areas, providing new jobs andincome to many. In addition to existingencouragement by the Government and theabove-mentioned general support to thesector, there is a need for further clarifica-tion of many issues to provide much betterconditions for this new form to develop,including more clear and enforceable regu-lations on land, taxation, and labourrecruitment.
REFORMING EDUCATION AND TRAINING ,SCIENCE AND TECHNOLOGY
The development of education and trainingas well as science and technology is notonly important for the succesful implemen-
71DEEPENING THE DOI MOI PROCESS
The private sector willhave a bigger role toplay in successfullyimplementingGovernment policies toattain the ambitious tar-gets Viet Nam has setfor itself.

tation of the modernization and industrial-ization strategies but also directly rein-forces the people-centred developmentapproach that Viet Nam has chosen overthe last decades.
As in other sectors, there is a need tobetter define the roles and responsibilitiesof the State and non-State sectors. Whilethe Government has a responsibility toensure universal primary and lower sec-ondary education, private parties may playa constructive role in the provision andfinancing of higher level education andvocational training. As to the latter, animportant role for the State sector wouldremain in encouraging the market to workand in ensuring and monitoring the qualityand accessibility of the services provided.In this respect, there is a need to review thecurrent policy of socialization, which dis-proportionally affects the poor. TheGovernment might consider introducingexplicit measures to ensure access to schol-arships for higher education for studentsfrom poor families.
With regard to the quality of the edu-cation system, the Government shoulddefine a clear national set of service stan-dards for basic education that can be guar-anteed to every pupil or specify a mini-mum performance level for each school.The regular measurement of the perfor-mance of schools against such standardswould result in an improved quality ofservices provided. Furthermore, the basiceducation curriculum could be modern-ized by moving away from static learningto a modern dynamic and flexible knowl-edge system that encourages creative andinnovative thinking and makes use of thelatest information technologies. In paral-lel, links between the education systemand demand for skilled labour need to beenhanced through more involvement ofthe business sector.
The idea of building a knowledge-based economy is new from both a theo-retical and practical point of view. First ofall, it requires a high sense of urgencyamong policy-makers to abandon thereluctance to remove the regulatory con-
trols, reduce telecommunication tariffsand to allow competition among Internetservice providers. Secondly, there is aneed to establish a real market for scienceand technology that bridges the gapbetween researchers, scientists, producersand entrepreneurs. Due to the dominanceof supply-led approaches, costly mis-matches between supply and demandoccur frequently. To remedy this weak-ness, more incentives and market opportu-nities are needed, such as trade fairs, incu-bators, clustering and networking. Thiswould not only enhance interactionbetween the institutions, but also promotesound competition.
The experience of the Asian tigersshows that the critical mass of demandcomes from new and often clusteredSMEs, whereas the technology transfer bymultinational corporations has also beensupportive. In Viet Nam, however, thenumber and quality of SMEs is still toolimited to be able to bring the country upthe value chain, which underscores theimportance of speeding up the develop-ment of the private sector as discussed ear-lier. Among other challenges in this sectoris the recruitment of young and competentexperts, whilst it also important to promotedemocracy within the science and technol-ogy community and to encourage creativi-ty, open discussion and better access tonew information and knowledge.
EXPANDING AND IMPROVING PUBLIC
SERVICES
Although in many sectors the role of theState will need to gradually changetowards facilitating and away from tryingto both "steer and row", it will need tomaintain direct responsibility for the provi-sion of public goods and public services,notably education, health and social saftynets. In spite of the progress made duringthe doi moi process, there are major chal-lenges to be faced. The following focuseson health and social safety nets.
First of all, like for education, healthservices need expansion and upgrading,particularly at the commune and district
72 NATIONAL HUMAN DEVELOPMENT REPORT 2001
While the Governmenthas a responsibility toensure universal primaryand lower secondaryeducation, private partiesmay play a constructiverole in the provision andfinancing of higher leveleducation and vocationaltraining.
levels. Efforts need to be undertaken toimprove the technical quality of servicesthrough in-service training, supervision,quality assurance mechanisms, and thelike. This must be accompanied by mea-sures that make public health services moreclient-friendly, and requires a wide rangeof activities promoting professional ethicsand a culture of service. Equally importantas a rise in the number of health workersare efforts to increase the quality and moti-vation of health workers, together withappropriate salaries and measures to elimi-nate the demand for unofficial fees.
Precise information on the health statusof the population and particularly onregional and socio-economic disparities inhealth should be improved in order to con-stitute the basis for setting health priorities.This would also enable the Government toformulate region specific targets, whichwould allow for more realistic and tailoredprograms for disadvantaged regions, espe-cially in the light of the significant territor-ial disparities in health. In view of theseverity of the problem, HIV/AIDS needsspecial attention through public educationand measures to reduce stigmatization.
In relation to this, the availability andaccessibility of services needs to beenhanced. To avoid overburdening of thepoor, the current exemption system is to beimproved together with an expansion of thecoverage of the health insurance scheme.Involvement of private parties in the healthsector should be encouraged but with closesupervision of the State. Furthermore,health targets related to problems whichlead to premature and avoidable mortality,such as childhood illnesses, abortion,malaria and traffic accidents would help toconcentrate attention upon the appropriateinterventions.
In order to repond to these challenges, itis essential to increase Government spend-ing on health care and preventive activitiesfocusing on more disadvantaged and iso-lated regions such as Northern Mountains,Central Highlands, and the Mekong RiverDelta. Such programmes would includeprimary health care service and preventive
measures for common diseases, the main-tenance and further development of localhealth care networks, programmes forclean water, environmental protection andfood safety. With regard to the environ-ment, the Government should speed up theimplementation of the NationalEnvironmental Strategy in an attempt toreconcile industrialization and moderniza-tion with environment protection, whichwill probably also require an increase inpublic expenditures in this areas.
In the field of reproductive health, theGovernment should pursue its movetowards better preventive measures, suchas counselling and information, educationand communication practices, a widerchoice of contraceptive methods and theimprovement of staff. Also worth pursuingis a further integration of demographic andpopulation planning into the socio-eco-nomic planning. Important demographicaspects such as rapid urbanization, increas-ing migration, ageing population andchanges in population structure should beincorporated in socio-economic policypreparation.
To cope with the downsides of trade lib-eralization and economic restructuring aswell as to manage the risks associated withnational disasters, there is a need tostrengthen the social safety net for the mostvulnerable groups. Firstly, theGovernment’s HEPR-programme could beimproved in a number of ways, i.e. throughmore clear institutional arrangements, abetter division of responsibilities betweenministries; more appropriate targeting ofassistance, more close monitoring andevaluation, increased participation anddecentralization and less emphasis on sub-sidized credits. Secondly, the targeting ofexisting social safety nets should beimproved considerably, while the coverageis to be expanded. Thirdly, there is a needto design special programme support to thepoor who face frequent risks, natural disas-ters and unforeseen events. While a betterearlier warning system to prevent and min-imize losses is essential, direct support
73DEEPENING THE DOI MOI PROCESS
To cope with the down-sides of trade liberaliza-tion and economicrestructuring as well as tomanage the risks associ-ated with national disas-ters, there is a need tostrengthen the socialsafety net for the mostvulnerable groups.

through an Emergency Relief Programmewith a wide coverage, high quality servicesand greater responsiveness is highly desir-able. Developing an insurance scheme anda well-targeted Contingency Fund wouldhelp people, especially the poor to bettercope with risks and uncertainties, as will anadequate disaster rehabilitation system.
IN NEED FOR A COMPREHENSIVE HUMAN
DEVELOPMENT STRATEGY
Given their interlinkages, the above policyrecommendations demand a comprehesen-sive strategy. For example, the ease withwhich the private sector firms can createnew jobs and the level of education andhealth of the poor are important detemi-nants of whether trade reforms will createemployment and lead to higher incomes ofpoor households. Private sector develop-ment, in turn, crucially depends on the
public administration reforms, while thelatter requires a bigger role of the peoplethemselves in the formulation, implemen-tation and monitoring of public policiesand public services, especially at thegrassroot’s level. Such a comprehensivestrategy would enhance human develop-ment and reduce poverty by creating anenvironment in which there are moreopportunities for the poor to earn a livingor to work their way out of poverty, and bygiving people more voice in decisions thathave a bearing on their lives. Withoutdeepening the doi moi process, the humandevelopment achievements of the past areat risk and Viet Nam’s ambitions for thefuture might turn illusionary. But with it,Viet Nam will continue to walk along apath of success in regards to the promotionof human development.
74 NATIONAL HUMAN DEVELOPMENT REPORT 2001

75DEEPENING THE DOI MOI PROCESS

Action Aid Vietnam (1999). "Ha TinhProvince: A Participatory PovertyAssessment", Hanoi.
Adam McCarty,(2000). Human Develop-ment and Globalisation. NHDRBackground paper, Hanoi.
Agrawal, N. (1996). "The benefits ofGrowth for Indonesia Worker". PolicyResearch Working Paper 1637. WorldBank.
Anand, S. and A.K.Sen, "SustainedDevelopment: Concepts and Priorities"(in Vietnamese Translation), in NationalCenter for Social and Human Sciencesof Vietnam (ed.) Human Development:From Conception to Strategy and Action(in Vietnamese). The National PoliticalPublishing House, Hanoi, 1999.
Asian Development Bank (1999a). AsianDevelopment Outlook 1999. Manila.
Asian Development Bank (1999b)."Vietnam: Greater Stability throughGood Governance - Key Issues forConsideration", Hanoi.
Bales (1999). "Vietnam: On the Road toLabor - Intensive Growth?".Background Paper for VietnamDevelopment Report, 2000.
Barro, R.J. (1999). Determinants ofEconomic Growth: A Cross-CountryEmpirical Study. MIT Press,Massachusetts.
Benson, C. (1997) "The Economic Impactof Natural Disasters in Vietnam", ODIWorking Paper No. 98.
Bhagwati, J. & Srinivasan, T.N. (1999)Outward-Orientation and Development:Are Revisionists Right?". EconomicGrowth Centre Discussion Paper. Yale
University. [http://www.esg.uqam.ca/ideas/data/Papers/wopyalegr806.html]
Birdsall, N. "Managing Inequality in theDeveloping Word" in N. Birdsall (1999).Inequality and Market in a GlobalizingWord.
Birdsall, N., Ross, D. and Sabot, R. (1995).“Inequality and Growth Reconsidered:Lessons from East Asia” in The WorldBank Economic Review. Vol. 9, No. 3.September, pp.477-508.
Bui Tat Thang, (2000). Economic Reformsin Viet Nam. NHDR Background paper,Hanoi.
Bui Van Hue (1999) "In order to MakeEducation and Training Sector Prosper:Teacher Training Colleges Need to beImproved First" in Vietnam's SouthernEducation and Training Entering 21stCentury. (in Vietnamese), The YouthPublishing House.
Carnoy, Castells, Cohen & Cardosa (1993).The New Global Economy in theInformation Age. PennsylvaniaUniversity Press.
Center for Development Studies Swansca(1998). Stakeholder Analysis of PrimaryEducation in Vietnam. The UnitedKingdom.
Center for International Economic (1998).Vietnam's Trade Policies. Camerra andSydney.
Cherry, C. (1978). World Communications:Threat or Promise?. Wiley, Chichester.
Chong-Yah, L. (1991). Development andUnderdevelopment. Longman SingaporePublishers Ltd., Singapore.
CIEM (1998). "Social Policy Framework inthe Transition Process to Market
75BIBLIOGRAPHY
Bibliography

Economy – International Experiencesand Practical Problems in Vietnam".
Collier, P. and Willem, J. (1999) “Why HasAfrica Grown Slowly?” in The Journalof Economic Perspectives, Vol. 13, No.3. Summer, pp.3-22.
Communist Party of Vietnam (1996)."Resolution on Development StrategyOrientation for Education and Trainingin the Industrialization andModernization Period and the Tasks upto 2020" (in Vietnamese).
Dang Duc Cuong (1999). "The MajorEducation and Training Events beforeEntering into 21st Century " inVietnam's Southern Education andTraining Entering 21st Century . (inVietnamese), The Youth PublishingHouse.
Dang Kim Son, (2000). Agriculture andRural Development. NHDR Backgroundpaper, Hanoi.
Dao Quang Vinh, (2000). Labour,Employment in Viet Nam . NHDRBackground paper, Hanoi.
Dao Trong Hung (1999). DevelopmentTrend Forecast of Vietnam's SouthernEducation and Training in the beginningyears of 21st Century (in Vietnamese).The Youth Publishing House.
Dapice, D. and Cao Duc Phat (1994) "RuralReform, Poverty Reduction and HungerEradication" in Perkins, D. and others(eds.). (1994) In Search of the Dragon'sTrail: Economic Reform in Vietnam,Harvard Institute for InternationalDevelopment.
Datt, G and Ravallion, M. (1992) "Growthand Redistribution Component ofChanges in Poverty Measures" inJournal of Development Economics 38.
David Dollar (2000), Growth is Good forthe Poor?
Development Strategy Institute (DSI),Ministry of Planning and Investment(2000). Non-state business sector devel-opment and job creation. Hanoi
Development Strategy Institute (DSI),Ministry of Planning and Investment
(2000). Choices and opportunitiesDevelopment Strategy Institute (DSI),
Ministry of Planning and Investment(2000). Globalization and internationaleconomic integration
Development Strategy Institute (DSI),Ministry of Planning and Investment(2000). Further perspectives on thechallenges of integration
Development Strategy Institute (DSI),Ministry of Planning and Investment(2000). The role of the state and themarket in the economy of Viet Nam
Development Strategy Institute (DSI),Ministry of Planning and Investment(2000). Agriculture and rural develop-ment
Development Strategy Institute (DSI),Ministry of Planning and Investment(2000). Rural development and off farmemployment
Development Strategy Institute (DSI),Ministry of Planning and Investment(2000). Science, technology and indus-try for Viet Nam.
Dicken, P. (1998) Global Shift:Transforming the World Economy, PaulChapman, London.
Dollar, D. Glewwe, P. and Litvack, J.(1998) "Household Welfare andVietnam's Transition". World BankRegional and Sectoral Studies.
Easterlin, R.A. (2000). “The WorldwideStandard of Living Since 1800” in TheJournal of Economic Perspectives. Vol.14, No. 1. Winter, pp.7-26.
Elaine Morrision and Oliver Dubois (1998).Sustainable Livelihoods in UplandVietnam: Land Allocation and Beyond.IIED.
Florde, A. and S. D. Vylder (1996). FromPlan to Market. Westview Press.
Government of Vietnam (1997). "NationalPlan of Action for Advancement ofWomen in Vietnam by the Year 2000"(in Vietnamese), Women's PublishingHouse.
Griffin, K and T. McKinley (1992).Towards a Human Development
76 NATIONAL HUMAN DEVELOPMENT REPORT 2001

Strategy”. UNDP Occasional Paper No.6. New York.
GSO (1993). Vietnam Living StandardsSurvey 1992-1993 (in Vietnamese),Hanoi.
GSO (1995). Women and Men (InVietnamese), Hanoi: StatisticalPublishing House.
GSO (1996). Non-state Sector in the open-door Period 1991-1995 (in Vietnamese).Hanoi: Statistical Publishing House.
GSO (1999). Vietnam Living StandardsSurvey 1997-1998 (in Vietnamese) .Hanoi.
GSO (1999a). Data on Agriculture-Forestryand Fishery 1990-1998 and Forecast2000 (In Vietnamese). Hanoi: StatisticalPublishing House.
GSO (1999b). Data on Socio-economic in61 Provinces and Cities (InVietnamese). Hanoi: StatisticalPublishing House.
GSO (2000). Vietnam Social Indicators (inVietnamese), Hanoi.
GSO (various years). Statistical Yearbook(in Vietnamese), Hanoi: StatisticalPublishing House.
Ha Huy Thanh (1990). "Primary, SecondaryEducation, and Training" in Dao VanTap (ed.). Vietnam Economy 45 years (inVietnamese), Hanoi: The Socio-SciencePublishing House.
Hainsworth, Geoffrey B. (1993). "HumanResource Development in Vietnam" inMya Than & Joseph L.H.Tan (eds.).Vietnam's Dilemmas and Options: TheChallenge of Economic Transition in1990s. Asean Economic Research Unit.Singapore: Institute of Southeast AsianStudies.
Haq, M. (1997). Basic needs: A ProgressReport. World Bank.
Huynh Xuan Hoang (1997). Some Opinionon Agriculture and Rural DevelopmentStrategy of Vietnam (in Vietnamese).Hanoi: Agricultural publishing house.
IMF (1999). "Vietnam: Statistical Annex".IMF Staff Country Report.
Institute for Economic Research of Ho Chi
Minh City (1996). "Migration, HumanResources, Employment andUrbanization of Ho Chi Minh City" (inVietnamese). National PoliticalPublishing House.
Institute for Economics (1999). TheNominal and Effective Rate ofProtection by Industry in Vietnam.Hanoi
Institute for Economics (2000), Study onVietnam's Textile and GarmentCompetitiveness, Hanoi.
IRRI (1993). "IRRI Rice Almanac",Manina.
Johnson, A. (1998). "Vietnam: Criticalissues in Rural Finance". Presentationon Rural Finance to joint MARD/WorldBank Rural Strategy Workshop.
Kozul-Wright, R. (1995) “Transnationalcorporations and the nation-state”. in J.Michie & J. Grieve-Smith (eds.)Managing the Global Economy. OxfordUniversity Press, Oxford, Chp. 6.
Krueger, A. (1999) “Developing Countriesand the Next Round of MultilateralTrade Negotiations”, World Bank PolicyResearch Working Paper 2118,Washington.
Krueger, A., Srinivasan, T.N., Singh, N.K.,& Zutshi, B.K. (1999) Panel Discussionon The Seattle Ministerial Conference:Road Ahead for Developing Countries.ICRIER.
Krueger, A.B. (1997) “International LaborStandards and Trade” in Bruno, M. &Pleskovic, B. (eds.) Annual World BankConference on Development Economics,1996. Washington D.C.
Le Bach Duong,(2000) Education in VietNam. NHDR Background paper, Hanoi.
Le Thi Nham Tuyet, Gender andDevelopment in Vietnam (inVietnamese), Hanoi: Social-SciencePublishing House.
Le Thi Quy (1999). "Domestic Violence inVietnam" (in Vietnamese). Center forFamily and Women Studies, Hanoi.
Le Tuong Lan (1998). Vietnam FinancialStatistical Yearbook (in Vietnamese).
77BIBLIOGRAPHY

Financial Publishing House.Lijane, L. & Weitz, A. (1998). “External
Resource Flows to DevelopingCountries”. UNDP Bureau forDevelopment Policy Working Paper No.3, New York.
Lipumba, N. (1999). “Opportunities andChallenges of Globalization: Can Sub-Saharan Africa Avoid Marginalisation?”in Globalization with a Human Face.Background Papers for UNDP HumanDevelopment Report 1999, Vol. 2.
Litvack, J.I and Rondinelli, D.A. (1999)."Market Reform in Vietnam: BuildingInstitutions for Development". QuorumBooks, U.S.A
McPherson, J.M. (1990). Battle Cry forFreedom: The American Civil War .Penguin UK.
Michie, J. & Smith, J. G. (1995). Managingthe Global Economy. Oxford UniversityPress.
Ministry of Agriculture and RuralDevelopment (1997). Rural Industriesand Services in Vietnam 1997 (inVietnamese). Agricultural PublishingHouse.
Ministry of Culture and Information (1999).Cultural Statistical Yearbook 1998 (inVietnamese). Hanoi.
Ministry of Health (1999). HealthStatistical Yearbook (in Vietnamese).Hanoi.
Ministry of Labor, Invalid and SocialAffairs (2000). " A Synthesis Report onPoverty Reduction and HungerEradication Program" (in Vietnamese).Hanoi.
Ministry of Planning and Investment.(1998)."Agricultural and RuralDevelopment- Important Factors ofEconomic Development and SocialStabilization". Documentation for ParisDonor Conference.
Ministry of Science, Technology andEnvironment (1999). Strategy onDevelopment Vietnam's Science andTechnology up to 2010 (Draft Paper) (inVietnamese), Hanoi.
MPDF (1999a). "Vietnam's Under-sizedEngine: A Survey of 95 Larger PrivateManufactures". Mekong ProjectDevelopment Facility. Hanoi.
MRDP (1999b) "Lao Cai Province: AParticipatory Poverty Assessment".Vietnam- Sweden Mountain RuralDevelopment Facility. Hanoi
National Committee for Advancement ofWomen in Vietnam (1995) Data onVietnamese Women 1985-1994 (inVietnamese). Hanoi: StatisticalPublishing House.
Nguyen Canh Toan (1999). "The RecentPosition of Pedagogic Sector andTeaching Occupation". Vietnam'sSouthern Education and TrainingEntering 21st Century (in Vietnamese).The Youth Publishing House
Nguyen Dinh Cu, Pham Mai Huong (2000).Population, Family Planning duringreform process. NHDR Backgroundpaper, Hanoi.
Nguyen Dinh Tai (1999). "SocialImplication of the ASIAN FinancialCrises for Vietnam". RegionalConference on the Impact of the AsianCrises on the Southeast AsianTransitional Economic. Phnom Penh,Cambodia, January 19-22,1999.
Nguyen Dinh Tai, (2000). Social Equity by(CIEM). NHDR Background paper,Hanoi.
Nguyen Manh Cuong, (2000). SocialSafety Nets. NHDR Background paper,Hanoi.
Nguyen Nghia Dan (1999) "Thinking onFirst National Priority", Vietnam'sSouthern Education and TrainingEntering 21st Century (in Vietnamese).The Youth Publishing House.
Nguyen Nhat Tuyen (1999). "LandLegislation Project: A Study of Female-Headed Households and Land Tenure".SIDA
Nguyen Sinh Cuc (2000). "Why is theIncome, Expenditure and BuyingCapacity of Farmer still low?" (InVietnamese). Workshop on People
78 NATIONAL HUMAN DEVELOPMENT REPORT 2001

Participation in Rural Development.Hanoi.
Nguyen Sinh Cuc and Nguyen Van Tiem(1996). A haft Century Development ofAgriculture and Rural in Vietnam, 1945-1995 (in Vietnamese). Hanoi:Agriculture Publishing House.
Nguyen Thang, (2000). Expanding Choicefor Farmers. NHDR Background paper,Hanoi.
Nguyen Thanh Bach, "Mekong River DeltaEconomic" (in Vietnamese), TheMargarine of Research Economic, No.261, February 2000.
Nguyen Thi Thu Hang (1999). "TheInternational Market for Vietnam's RiceExports: Opportunities and Challenges".Hanoi.
Nguyen, N.B, Fetzer, J and Haughton, J(forthcoming). "Rice Policy inVietnam", National EconomicsUniversity Hanoi and Siffolk University.Boston.
Nguyen, V. (1998). "Liverstock Productionin Vietnam" in Lincoln InternationalLtd, Strengthening Capacity for theRenewal of Rural Development inVietnam. UNDP. Hanoi.
OCED (1996). "Shaping the 21st Century:The Contribution of DevelopmentCooperation". Paris.
O'Connor, D. (1998). "Rural industrialdevelopment in Vietnam and China: AStudy in Contrasts". OCEDDevelopment Center Technical PaperNo. 140. Paris
OECD (1996) “Globalization: what chal-lenges and opportunities forGovernments?” [http://www.oecd.org/puma/gvrnance/strat/global.htm].
Oxfam GB (1999) "Tra Vinh Province: AParticipatory Poverty Assessment". HaNoi.
Oxfam GB UK and Ireland (1996) "Reporton the Financing and Delivery of BasicSocial Services at the Commune Levelon Ky Anh, Ha Tinh, Vietnam", Hanoi.
Pack, H. "Industrial Policy: Medicine forStimulating Economic Growth or
Poison" in Byjit Bora, P.J. Lloyd andMair Pangestu (2000) Industrial Policyand WTO .
Perkins, D. (1998). "Rural Industrialization:Vietnam's experience and possiblelessons from China", in LincolnInternational Ltd. StrengtheningCapacity for the Renewal of RuralDevelopment in Vietnam. UNDP. Hanoi
Pham Minh Hac (1998). "VietnamEducation Entering the 21st Century" (inVietnamese), International Conferenceon Vietnamese Study, Hanoi.
Pham Minh Hac (1999). "EducationReforms". Vietnam's SouthernEducation and Training Entering 21stCentury (in Vietnamese). The YouthPublishing House.
Pham Van Dong (1999). "Education: FirstNational Priority, Future of Nation".Vietnam's Southern Education andTraining Entering 21st Century (inVietnamese). The Youth PublishingHouse.
Pham Xuan Dai, (2000). Health Care in VietNam. NHDR Background paper, Hanoi.
Phi Manh Hong, Human Development:Concept and Realities in Viet Nam .NHDR Background paper, Hanoi.
Pissarides, C.A. (1997) “Learning byTrading and the Returns to HumanCapital in Developing Countries” in TheWorld Bank Economic Review. Vol. 11,No. 1. January, pp.17-32.
Population and Family Planning Council(1999) "Report on Intervention Project:Developing Counseling Materials onDomestic Violence for the Ho Chi MinhCity Hotline" (in Vietnamese).
Population and Family Planning Counciland GTZ (1996). Survey on Birth'sHealth 1995, Strengthen Family Healthat 5 Provinces in Vietnam (InVietnamese). Hanoi
Riedel, J and W.S, Turley (1999). "ThePolitics and Economics of Transition toan Open Market Economy in Vietnam".Technical Papers No 152 , OCEDDevelopment Centre. September 1999.
79BIBLIOGRAPHY

Rodrik, D. (1995). “Getting InterventionsRight: How South Korea and TaiwanGrew Rich”, Economic Policy. 20 April,pp. 55-107.
Rodrik, D. (2000). “How Far WillInternational Integration Go?” in TheJournal of Economic Perspectives, Vol.14, No. 1. Winter, pp.177-186.
Royal Swedish Academy of Sciences(1998). Bank of Sweden Prize inEconomic Sciences in Memory ofAlfred Nobel to Prof. Amartya Sen,Trinity College, Cambridge, for HisContributions to Welfare Economics.
Save the Children UK (1997). "FromHousework to Gold Mining: ChildLabor in Rural Vietnam", Hanoi
Save the Children UK (1998). "Child Laborin Ho Chi Minh City". Hanoi
Save the Children UK (1999). "EthnicMinority Education: Problem Analysisand Program Strategy". Hanoi.
Save the Children UK (1999). "Ho ChiMinh City: A Participatory PovertyAssessment", Hanoi
Schumpeter, J. (1934). The Theory ofEconomic Development. Cambridge,MA: Harvard University Press.
Schumpeter, J. (1943). Capitalism,Socialism and Democracy . Allen &Unwin, London.
Shivia Kumar, A.K. "Review of NationalHuman Development Report". ABackground Paper for Discussion at theAsian - Pacific NHDR Workshop inSeoul, 6-8, July, 1998.
SIDA (1999). "A Study on theImplementation of GrassrootsDemocracy Decree in Vietnam". Draftpaper by Dau Hoan Do and SIDA staff;Background paper for the VietnamDevelopment Report 2000
SIDA et. al. (Forthcoming). "Hearth SectorReview", Hanoi.
The Economist. "The Tiger and the Tech".February, 5, 2000.
The Steering Committee on GeneralPopulation and Housing Survey (1999).Preliminary Results of Vietnam's
General Population and Housing Survey1999 (in Vietnamese). Hanoi: The WorldPublishing House.
The Steering Committee on GeneralPopulation and Housing Survey (2000).The Results of Generalize 3% Sample ofGeneral Population and Housing Survey1999, (in Vietnamese). Hanoi.
The Times (1995). Atlas of World History(4th Edition). Lomdarda, Milan.
Tran Dinh Thien,(2000). Doi Moi andHuman Development in Viet Nam.NHDR Background paper, Hanoi.
Tran Han Giang, (2000). Gender issue dur-ing the Reform Process . NHDRBackground paper, Hanoi.
Tran Hong Quan (1999). "On DevelopmentStrategy of Education and Training up to2020", in Vietnam's Southern Educationand Training Entering 21st Century. (inVietnamese), The Youth PublishingHouse.
Tran Tho Dat (1999). "Transaction Costsand Partition of Rural Credit Market.Margarine of Research Economic . No.248, January,1999.
Tran Tho Dat (mimeo). "Social Impact ofthe East Asian Crisis and HouseholdCoping Mechanisms in Vietnam".Hanoi.
Tran Van Ta, "Some Problems on FinancialProvision for Rural Financial Service"(in Vietnamese). Present at InternationalConference on Partition of Financialand Rural Service Provision, Hanoi,April, 1997.
Trinh Cong Khanh, " Partition of Financialand Rural Service Provision: SomeProblems on Mountainous Rural Areas"(in Vietnamese). Present at InternationalConference on Partition of Financialand Rural Service Provision, Hanoi,April, 1997.
Turk, C. (1999). "A Review of RecentLiterature in English on Education andEthnic Minorities in the NorthernUplands of Vietnam" (Draft). Hanoi.
UN (1999). Looking Ahead - A CommonCountry Assessment of Vietnam. Ha
80 NATIONAL HUMAN DEVELOPMENT REPORT 2001
Noi, December, 1999UNDP (1990). Concept and Measurement
of Human Development. HumanDevelopment Report 1990, OxfordUniversity Press.
UNDP (1996). Economic Growth andHuman Development. HumanDevelopment Report 1996, OxfordUniversity Press.
UNDP (1997). Human Development toEradicate Poverty. Human DevelopmentReport 1997, Oxford University Press.
UNDP (1999). Globalization with a HumanFace. Human Development Report 1999,Oxford University Press.
UNDP (2001). Making New TechnologiesWork for Human Development. HumanDevelopment Report, Oxford UniversityPress.
UNDP Viet Nam (1999b). "CapacityAssessment for Vietnam's NationalTarget Program for Hunger Eradicationand Poverty Reduction". Hanoi.
UNDP Viet Nam (1996). Catching Up.Hanoi.
UNDP Viet Nam (1998) "The Dynamics ofInternal Migration in Vietnam". Hanoi.
UNDP Viet Nam, “East Asia: From Miracleto Crisis; Key Lessons for Viet Nam,June 1998, Hanoi.
UNDP Viet Nam (1998). ExpandingChoices for the Rural Poor: HumanDevelopment in Vietnam, Hanoi.
UNDP Viet Nam (1999) Doi moi as aProcess of Expanding Choices: AConceptual Policy Framework. UNDPDiscussion paper.Hanoi, February
UNDP Viet Nam (1999) Governance,Globalisation and Stability: KeyLessons for Viet Nam, CIEM seminarpaper. Hanoi, April.
UNDP Viet Nam (1999a). Basic SocialServices in Vietnam. Hanoi, December.
UNIDO & DSI. The Overview of IndustrialCompetitiveness (in Vietnamese).Hanoi: National Political PublishingHouse.
UNTAD (2000), Trade and DevelopmentReport.
Van de Walle, D. (1998) "Protecting thePoor in Vietnam's Emerging MarketEconomy", Policy Research WorkingPaper 1967, World Bank.
Vietnamese Women Association (1998).Women with People's Council Work.Hanoi: The Women Publishing House.
Vietnam's Council on Save and Take Careof Children (1999) Children Indicators1998. Hanoi.
Vo Tri Thanh, (1999a), "Competitive andCompetition Policy: Nature, Contents,and the Case of Vietnam" (inVietnamese), Paper Present at 2ndRoundtable at Ministry of ForeignAffairs on International Integration,Hanoi.
Vo Tri Thanh, (1999b). "Vietnam'sEconomy: The Weaknesses, PolicyResponses and Obstacles to a SecondWave of Reforms". Paper presented atthe Forum "Socio - Economic Changesand Political Trends in East Asia - Trendand Issues in East Asia 2000". Tokyo,20-22/10/1999.
Vo Tri Thanh, (2000). Doi Moi, EconomicGrowth and Human Development.NHDR Background paper, Hanoi.
Vu Quoc Huy (2001) Growth is good for thepoor? The case of Viet Nam. UNDPWorking Paper.
Whalley, J. (1999). “Developing Countriesin the Global Economy: A ForwardLooking View”. CSGR Working PaperNo. 36/98, University of Warwick, UK.
Williamson, J. (1994). The PoliticalEconomy of Policy reform. Institute forInternational Economics, WashingtonD.C.
Williamson. J.G. (1997) “Globalization andInequality: Past and Present” in TheWorld Bank Research Observer, Vol. 12,No. 2. August.
Winters, L.A. (2000) “Trade Liberalizationand Poverty”. Background paper for TheWorld Development Report on Poverty .World Bank.[http://www.worldbank.org/poverty/wdrpoverty/winters.htm]
81BIBLIOGRAPHY

Winters, L.A. (2000). “Trade, Trade Policyand Poverty” What are the links?”Background paper for The WorldDevelopment Report on Poverty. WorldBank.
Wood, A. (1997). “Openness and WageInequality in Developing Countries: TheLatin American Challenge to East AsianConventional Wisdom” in The WorldBank Economic Review, Vol. 11, No. 1,January.
Wood, A. and J. Mayer (1998). "Africa'sExport Structure in ComparativePerspective" in Economic Developmentand Regional Dynamics in Africa:Lessons from the East Asian Experience,UNTACTAD, and Geneva.
World Bank (1995). "Vietnam: PovertyAssessment and Strategy". Hanoi.
World Bank (1997) "Vietnam: EducationFinancing Sector Study". Vietnam
World Bank (1998a). "Vietnam: AdvancingRural Development from Vision toAction". Vietnam.
World Bank (1998b) "Vietnam: Rising tothe Challenge".
World Bank (1998c). Assessing Aid: WhatWorks, What Doesn't, and Why?. Oxford
University Press, New York.World Bank (1999 f) "Attacking Poverty "
(Draft for Discussion), Joint Report ofthe Government-Donor-NGO WorkingGroup, October 15, 1999.
World Bank (1999a). "Voices of the Poor inVietnam: A Synthesis Report of the FourParticipatory Poverty Assessments"Hanoi.
World Bank (1999b). "Gender BasedViolence: The Case of Vietnam". Paperby Vu Manh Loi, Vu Tuan Huy, NguyenHuu Minh (Institute of Sociology) andJennifer Clement. Hanoi
World Bank (1999c). "China: PovertyAssessment".
World Bank (1999d). "A Tale of Two Cities:Toward a strategy for Growth. PovertyReduction and Environment in the Citiesand Regions of Vietnam" (Draft) .
World Bank (1999e). Vietnam Preparing forTake - off: How Vietnam can ParticipateFully in the East Asian Recovery. Hanoi
World Bank (2000). World DevelopmentReport 1999/2000: Entering the 21stCentury . Oxford University Press, NewYork.
82 NATIONAL HUMAN DEVELOPMENT REPORT 2001

Human DevelopmentIndicators

In this Report, a comprehensive socio-economic data base on human develop-ment has been compiled for 61
provinces and urban authorities, andregrouped in 8 regions according to GSOclassification. Difficulties in data collec-tion, processing and interpretation of dis-aggregated human development indiceshave been widely recognized in mostdeveloping countries and Viet Nam is in noexception. The lack of and/or inconsisten-cy and unreliability of data in Viet Nam hasbeen even more acute, especially at theprovincial level. Even in more advancedcountries with more reliable data sourcesapplying and interpreting human develop-ment indices is not an easy task and often acause for intensive debate. Despite allthese possible shortcomings and controver-sies, establishing a comprehensive set ofhuman development indicators at theprovincial level is an exercise that has beenvery worthwhile, since apart from using itfor monitoring human developmentprogress, the system of indicators can helpto better understand how and why the gapsbetween different provinces and regionsexist, hence facilitating policy direction todeal with these gaps and related socio-eco-nomic consequences.
All statistical data in this Report aregrouped in 14 Tables in the HumanDevelopment Indicator section. Three keyhuman development indices that is HumanDevelopment Index (HDI), HumanPoverty Index (HPI) and GenderDevelopment Index (GDI) have been cal-
culated for all 61 provinces, for the firsttime. Data used in these indices are mainlyfrom Government sources. For example,data on income are taken from GSO'sAnnual Statistical Yearbook, or throughvarious series of Results of theHouseholds' Living Standards andEconomic Condition Survey. Other keydata have been taken from other govern-ment publications such as Results of the3% sample of the Population and HousingCensus, Labour and Employment Survey.
It is necessary to note that in manycases, data used in this Report may differfrom those used in other publications. Thechoice of data source was largely deter-mined by the need to make provincial com-parisons as well as timeliness. For instance,life expectancy at birth used in this NHDRis much higher than that used in UNDP'slatest global Human Development Report,since this NHDR uses an estimation fromthe 3% sample of the 1999 PopulationCensus. Other examples include povertyincidence used in Table 2. In that Table, thenational poverty line was used in all but 11provinces where, for some reasons, a more' localised' poverty line was used. In somecases, due to lack of appropriate data at amore disaggregated provincial level, aproxy has been used, subject to someassumptions. The income gap betweenmale and female labour in non-farmingactivities at the region level based on datafrom Viet Nam Living Standard Survey,for example has been used for allprovinces in the region1.
85NOTE ON STATISTICAL DATA USED IN VIETNAM HUMAN DEVELOPMENT REPORT-2001
Note on Statistical Data Used in Vietnam HumanDevelopment Report-2001
1. A similar approach is used in the Global Report for the same indicator, when the income gap of 755 isused for all developing countries, including Viet Nam where such a detailed data for this indicator are notavailable.

Income data have been transformed intoPPP values to enable comparability andallow for possible international compar-isons. It is worth noting that, although stan-dard international comparable formulahaven been applied to all indices, interpre-tation of results should be handled careful-ly and cautiously especially when they areused at more disaggregated levels, due tothe appropriateness of the formula in useand the reliability of data.
MAIN DATA SOURCES USED IN THE REPORT
LIFE EXPECTANCY AT BIRTH AND THE PROBA-BILITY OF PEOPLE NOT EXPECTING TO SURVIVE
TO AGE OF 40.
These two indicators are needed to calcu-late HDI and HPI ( See Appendix xx)
In general, these data can be extracteddirectly from the Population Census orbased on Results of Population Projections.In this Report, data for these two indicatorshave been estimated from Results of the3% sample of the 1999 Population andHousing Census, and therefore differ fromwhat were used in the Global HumanDevelopment Report.
ADULT LITERACY.
Adult literacy classified by age andprovince are also taken from Results of the3% sample of the 1999 Population andHousing Census. Once again these datamay not necessarily coincide with dataused elsewhere.
ENROLLMENT RATIOS BY EDUCATION LEVEL
Enrollment ratios by education level areused in compiling HDI and GDI and alsodrawn from Results of the 3% sample ofthe 1999 Population and Housing Census.In principle, a more accurate estimate forthese indicators could be taken from amore regular data sources through theMOET statistical network, for example.However, in order to calculate the enroll-ment ratios, data on population by age
cohort are needed. That's why results fromPopulation Census are used to ensure theconsistency of two sets of data. In thefuture, it would be good if these twosources of data could somehow be com-bined in subsequent Reports.
INCOME PER CAPITA ( MEASURED IN PPP)
This indicator is indispensable for manyhuman development indices. In the GlobalReports, income per capita by country ismeasured in purchasing power parity,applying a methodology that was devel-oped by United Nations and the WorldBank. The conversion of income per capitameasure in domestic currencies into $USPPP is necessary for international compar-isons. At the national level, use of incomeper capita in PPP instead of in domesticcurrency, at the first glance, seems to beredundant, because all the regions within acountry have the same unit of account.Nevertheless, if income in domestic cur-rency were used for calculating humandevelopment indices, it would requireappropriate goalpost values which are verydifficult to determine. Therefore usingincome per capita in PPP has a clear advan-tage: using universal formula with well-recognised goalposts. Furthermore, usingincome per capita in PPP also allow forinternational comparison. The final valuesof human development indices seems to bequite robust to reasonably small changes inthe conversion ratio. In this Report thisconversion ratio of 2.745 based on theWorld Bank Development Indicators 1999has been used.
HUMAN POVERTY INDEX.
This index is calculated for the first timefor all 61 provinces. The formula used inthis Report is the extended standard one(See Technical Note). Five basic indicatorsare used, namely the probability of peoplenot expected to survive to age 40, the adultilliteracy rate, the proportion of the popula-tion not having access to clean water andbasic sanitation and under-five malnutri-
86 NATIONAL HUMAN DEVELOPMENT REPORT 2001

tion rate. Except for the latter one, based ondata provided by UNICEF and Ministry ofHealth, all other data have been taken fromResults of the 3% sample of the 1999Population and Housing Census. It is worthwhile to note that the Census uses a specif-ic definition of 'clean water sources' and'sanitation', that may cause the results inthis Report to deviate from those availablefrom other sources. The reason for usingthe Population Census is to ensure dataconsistency across provinces.
GENDER DEVELOPMENT INDEX
Available data from different sources arebasically sufficient to calculate the GenderDevelopment Index, one of most importantand useful indices for all provinces. Theaggregate income data and income gapsbetween male and female labour in non-farming activities remains one of most dif-ficult data problems that needs to be solvedin compiling this index. This lack of data isquite serious. Therefore as a resolution, anumber of assumptions have been made inthe Global Report for countries where offi-cial data are not available. Male-femaleincome gap for Viet Nam in the GlobalReport 2001 is assumed at 4:3 ratio e.g. theaverage earnings by female worker is asmuch as 75 percent of that by male worker.In this Report, an estimation of income
gaps between male and female workers forregions has been obtained using data fromViet Nam Living Standards Survey and thisregional data is then applied to allprovinces that belong to this region. Theincome gap at the national level, using thismethod is 81 percent which is quite closeto the level used in the Global Report.
AGGREGATED INDICES FOR REGIONS AND
HUMAN DEVELOPMENT GROUPS.
As previously mentioned, in this Report,provinces are grouped in eight regionsaccording to the GSO's classification.These provinces are also classified in threegroups according to their HDI perfor-mance. In the High Human Developmentgroup, there are provinces that recordedHDI at least as high as 0.7. The MediumHuman Development group consists of allprovinces whose HDI range from 0.6 to0.7. Provinces in the Low HumanDevelopment group are those whose HDIis below 0.6. Human Development Indicesfor each aggregated group ( by region andby HDI grouping) have been calculated inthis Report. These indices for differentgroups are calculated as weighted-averagefrom that of provinces in the group withappropriate weights applied. Results arerepresented in each Table.
87NOTE ON STATISTICAL DATA USED IN VIETNAM HUMAN DEVELOPMENT REPORT-2001

88NATIONAL HUMAN DEVELOPMENT REPORT 2001
88
HumanDevelopment
Index
High Human Development 77.9 74.4 94.2 9104 3243 0.89 0.78 0.58 0.7491 Ba Ria-Vung Tau * 70.5 74.3 92.6 40620 14470 0.85 0.82 0.83 0.835 02 Ha Noi 91.8 75.7 96.9 10071 3588 0.95 0.85 0.60 0.798 13 Tp. HCMinh 77.1 75.7 94.0 14622 5209 0.88 0.84 0.66 0.796 -14 Da Nang 86.0 75.6 94.7 6219 2215 0.92 0.84 0.52 0.760 15 Hai Phong 78.2 73.4 95.4 5469 1948 0.90 0.81 0.50 0.733 26 Binh Duong 71.6 71.8 92.4 7268 2589 0.85 0.78 0.54 0.726 -27 Dong Nai 71.1 71.5 92.5 6119 2180 0.85 0.77 0.51 0.714 -18 Thai Binh 75.6 76.5 94.6 3084 1099 0.88 0.86 0.40 0.714 189 Hai Duong 78.6 73.7 94.8 3621 1290 0.89 0.81 0.43 0.711 13
10 Khanh Hoa 70.0 72.3 91.4 5250 1870 0.84 0.79 0.49 0.707 -211 Quang Ninh 75.9 71.1 92.8 4626 1648 0.87 0.77 0.47 0.703 -112 Nam Dinh 76.5 75.3 94.3 2734 974 0.88 0.84 0.38 0.700 24Medium Human Development 68.2 70.2 90.3 3195 1138 0.83 0.75 0.41 0.66313 Vinh Long 68.3 73.3 90.1 4228 1506 0.83 0.80 0.45 0.695 214 Hung Yen 75.3 72.0 93.5 3390 1208 0.87 0.78 0.42 0.691 1015 Ha Nam 76.9 74.0 93.4 2685 956 0.88 0.82 0.38 0.691 2316 Long An 61.4 72.2 90.9 4460 1589 0.81 0.79 0.46 0.686 -317 Vinh Phuc 75.0 72.2 94.0 2920 1040 0.88 0.79 0.39 0.685 1118 Tien Giang 62.4 72.5 90.8 4101 1461 0.81 0.79 0.45 0.684 -119 Bac Ninh 73.3 71.4 94.0 3008 1072 0.87 0.77 0.40 0.680 820 Ca Mau 56.4 71.1 92.9 4546 1619 0.81 0.77 0.46 0.680 -921 Kien Giang 57.6 72.1 88.4 4660 1660 0.78 0.78 0.47 0.678 -1222 Ha Tinh 77.4 72.1 94.1 2454 874 0.89 0.78 0.36 0.677 2523 Phu Tho 73.9 71.0 95.0 2694 960 0.88 0.77 0.38 0.675 1424 Can Tho 60.2 70.8 87.9 4427 1577 0.79 0.76 0.46 0.670 -1025 Ha Tay 78.1 69.9 92.2 2825 1006 0.88 0.75 0.39 0.669 1026 Nghe An 76.3 70.6 92.8 2639 940 0.87 0.76 0.37 0.669 1527 Ben Tre 64.2 70.0 89.7 3959 1410 0.81 0.75 0.44 0.668 -828 Tay Ninh 61.9 70.3 90.1 3864 1376 0.81 0.75 0.44 0.666 -829 Quang Nam 76.3 71.0 90.1 2682 955 0.86 0.77 0.38 0.666 1030 Ninh Binh 76.3 71.4 93.4 2138 762 0.88 0.77 0.34 0.663 2631 Lam Dong 68.0 70.8 91.1 2872 1023 0.83 0.76 0.39 0.662 -132 Thai Nguyen 73.4 69.6 95.4 2359 840 0.88 0.74 0.36 0.660 1933 Thanh Hoa 76.0 69.4 91.2 2657 946 0.86 0.74 0.38 0.659 734 Binh Dinh 67.1 70.0 92.2 2854 1017 0.84 0.75 0.39 0.659 -335 Thua Thien-Hue 71.0 71.6 85.6 2901 1033 0.81 0.78 0.39 0.658 -636 Tra Vinh 64.6 70.0 82.5 4210 1500 0.77 0.75 0.45 0.656 -2037 Soc Trang 58.6 69.6 86.7 4050 1443 0.77 0.74 0.45 0.654 -1938 An Giang 54.3 69.8 85.4 4497 1602 0.75 0.75 0.46 0.653 -2639 Bac Lieu 59.0 69.7 86.0 3719 1325 0.77 0.75 0.43 0.649 -1840 Dong Thap 55.3 71.7 85.7 3259 1161 0.76 0.78 0.41 0.648 -1541 Dac Lac 68.9 65.6 92.2 3504 1248 0.84 0.68 0.42 0.647 -1842 Quang Ngai 75.4 69.8 86.2 2450 873 0.83 0.75 0.36 0.645 643 Quang Tri 75.5 68.5 86.5 2638 940 0.83 0.73 0.37 0.643 -144 Quang Binh 69.2 67.9 92.7 2458 876 0.85 0.71 0.36 0.642 245 Binh Thuan 58.3 70.7 89.7 2592 923 0.79 0.76 0.37 0.642 -246 Hoa Binh 74.9 67.3 92.0 2180 777 0.86 0.70 0.34 0.637 947 Binh Phuoc 61.6 69.7 88.2 2416 861 0.79 0.74 0.36 0.632 248 Bac Giang 66.5 67.4 93.5 2204 785 0.85 0.71 0.34 0.632 6
Combined1st, 2ndand 3rd
levelgross
enrolmentratio
(%)1999
Combined1st, 2ndand 3rd
levelgross
enrolmentratio
(%)1999HDI rank Province
Adult literacyrate (%)
1999
GDP percapita in
VND ('000)1999b
GDPpercapita in
PPP($US)
Lifeexpectan-cy index
Educationindex
IncomeIndex HDI
GapbetweenGDP and
HDI ranking

89HUMAN DEVELOPMENT INDEX
HumanDevelopment
Index
49 Phu Yen 67.0 66.1 89.8 2853 1016 0.82 0.68 0.39 0.631 -1750 Lang Son 69.8 65.2 89.4 2846 1014 0.83 0.67 0.39 0.628 -1751 Tuyen Quang 70.8 66.8 87.2 2245 800 0.82 0.70 0.35 0.621 152 Ninh Thuan 55.5 69.1 81.2 2838 1011 0.73 0.74 0.39 0.616 -1853 Yen Bai 66.9 67.2 84.8 2205 785 0.79 0.70 0.34 0.612 0Low Human Development 59.2 63.0 68.9 2073 739 0.66 0.63 0.33 0.541
54 Bac Can 68.3 66.6 85.5 1618 576 0.80 0.69 0.29 0.594 655 Cao Bang 68.6 62.4 76.6 2503 892 0.74 0.62 0.37 0.576 -1056 Lao Cai 58.2 66.0 69.3 2107 751 0.66 0.68 0.34 0.559 157 Son La 56.3 66.1 69.5 1823 649 0.65 0.69 0.31 0.549 258 Gia Lai 57.7 61.8 69.3 2575 917 0.65 0.61 0.37 0.546 -1459 Kon Tum 66.3 57.2 73.2 2372 845 0.71 0.54 0.36 0.534 -960 Ha Giang 63.0 58.8 68.1 1521 542 0.66 0.56 0.28 0.503 161 Lai Chau 46.9 63.7 51.3 1847 658 0.50 0.64 0.31 0.486 -3
- Red River Delta 79.3 73.7 94.5 4536 1,616 0.89 0.81 0.46 0.723North East 70.2 68.2 89.3 2641 941 0.83 0.72 0.37 0.641North West 59.9 65.9 73.3 1951 695 0.69 0.68 0.32 0.564North Central Coast 75.2 70.2 91.3 2635 939 0.86 0.75 0.37 0.662South Central Coast 72.8 70.7 90.6 3476 1,238 0.85 0.76 0.42 0.676Central Highlands 65.2 63.5 83.0 3093 1,102 0.77 0.64 0.40 0.604Southeastern 69.5 72.9 92.1 10692 3,809 0.85 0.80 0.61 0.751Mekong River Delta 59.6 71.1 88.1 4200 1,496 0.79 0.77 0.45 0.669All Viet Nam 69.8 70.9 90.3 5221 1,860 0.83 0.76 0.49 0.696
* The HDI rank for Ba Ria-Vung Tau should be interpreted with care, since most of GDP of this province came from oil and gas revenues that accrue largely to thecentral Government.
Combined1st, 2ndand 3rd
levelgross
enrolmentratio
(%)1999
Combined1st, 2ndand 3rd
levelgross
enrolmentratio
(%)1999HDI rank Province
Adult literacyrate (%)
1999
GDP percapita in
VND ('000)1999b
GDPpercapita in
PPP($US)
Lifeexpectan-cy index
Educationindex
IncomeIndex HDI
GapbetweenGDP and
HDI ranking
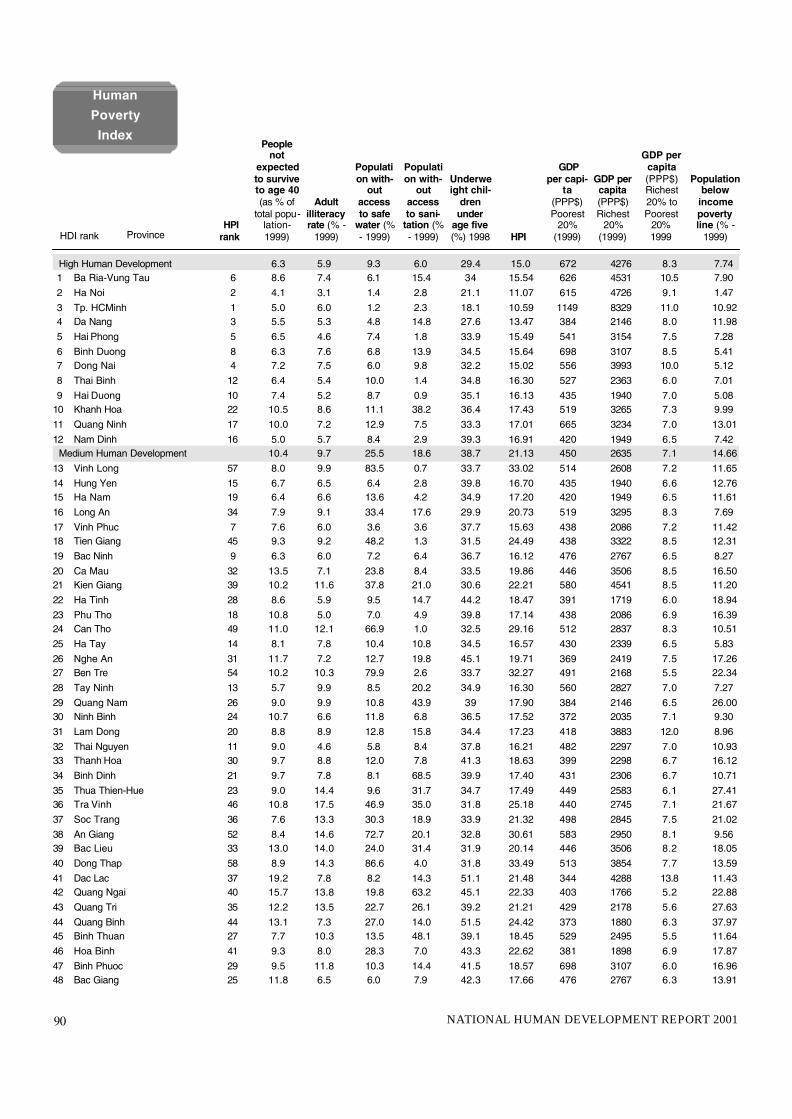
90 NATIONAL HUMAN DEVELOPMENT REPORT 2001
High Human Development 6.3 5.9 9.3 6.0 29.4 15.0 672 4276 8.3 7.741 Ba Ria-Vung Tau 6 8.6 7.4 6.1 15.4 34 15.54 626 4531 10.5 7.902 Ha Noi 2 4.1 3.1 1.4 2.8 21.1 11.07 615 4726 9.1 1.473 Tp. HCMinh 1 5.0 6.0 1.2 2.3 18.1 10.59 1149 8329 11.0 10.924 Da Nang 3 5.5 5.3 4.8 14.8 27.6 13.47 384 2146 8.0 11.985 Hai Phong 5 6.5 4.6 7.4 1.8 33.9 15.49 541 3154 7.5 7.286 Binh Duong 8 6.3 7.6 6.8 13.9 34.5 15.64 698 3107 8.5 5.417 Dong Nai 4 7.2 7.5 6.0 9.8 32.2 15.02 556 3993 10.0 5.128 Thai Binh 12 6.4 5.4 10.0 1.4 34.8 16.30 527 2363 6.0 7.019 Hai Duong 10 7.4 5.2 8.7 0.9 35.1 16.13 435 1940 7.0 5.08
10 Khanh Hoa 22 10.5 8.6 11.1 38.2 36.4 17.43 519 3265 7.3 9.9911 Quang Ninh 17 10.0 7.2 12.9 7.5 33.3 17.01 665 3234 7.0 13.0112 Nam Dinh 16 5.0 5.7 8.4 2.9 39.3 16.91 420 1949 6.5 7.42
Medium Human Development 10.4 9.7 25.5 18.6 38.7 21.13 450 2635 7.1 14.6613 Vinh Long 57 8.0 9.9 83.5 0.7 33.7 33.02 514 2608 7.2 11.6514 Hung Yen 15 6.7 6.5 6.4 2.8 39.8 16.70 435 1940 6.6 12.7615 Ha Nam 19 6.4 6.6 13.6 4.2 34.9 17.20 420 1949 6.5 11.6116 Long An 34 7.9 9.1 33.4 17.6 29.9 20.73 519 3295 8.3 7.6917 Vinh Phuc 7 7.6 6.0 3.6 3.6 37.7 15.63 438 2086 7.2 11.4218 Tien Giang 45 9.3 9.2 48.2 1.3 31.5 24.49 438 3322 8.5 12.3119 Bac Ninh 9 6.3 6.0 7.2 6.4 36.7 16.12 476 2767 6.5 8.2720 Ca Mau 32 13.5 7.1 23.8 8.4 33.5 19.86 446 3506 8.5 16.5021 Kien Giang 39 10.2 11.6 37.8 21.0 30.6 22.21 580 4541 8.5 11.2022 Ha Tinh 28 8.6 5.9 9.5 14.7 44.2 18.47 391 1719 6.0 18.9423 Phu Tho 18 10.8 5.0 7.0 4.9 39.8 17.14 438 2086 6.9 16.3924 Can Tho 49 11.0 12.1 66.9 1.0 32.5 29.16 512 2837 8.3 10.5125 Ha Tay 14 8.1 7.8 10.4 10.8 34.5 16.57 430 2339 6.5 5.8326 Nghe An 31 11.7 7.2 12.7 19.8 45.1 19.71 369 2419 7.5 17.2627 Ben Tre 54 10.2 10.3 79.9 2.6 33.7 32.27 491 2168 5.5 22.3428 Tay Ninh 13 5.7 9.9 8.5 20.2 34.9 16.30 560 2827 7.0 7.2729 Quang Nam 26 9.0 9.9 10.8 43.9 39 17.90 384 2146 6.5 26.0030 Ninh Binh 24 10.7 6.6 11.8 6.8 36.5 17.52 372 2035 7.1 9.3031 Lam Dong 20 8.8 8.9 12.8 15.8 34.4 17.23 418 3883 12.0 8.9632 Thai Nguyen 11 9.0 4.6 5.8 8.4 37.8 16.21 482 2297 7.0 10.9333 Thanh Hoa 30 9.7 8.8 12.0 7.8 41.3 18.63 399 2298 6.7 16.1234 Binh Dinh 21 9.7 7.8 8.1 68.5 39.9 17.40 431 2306 6.7 10.7135 Thua Thien-Hue 23 9.0 14.4 9.6 31.7 34.7 17.49 449 2583 6.1 27.4136 Tra Vinh 46 10.8 17.5 46.9 35.0 31.8 25.18 440 2745 7.1 21.6737 Soc Trang 36 7.6 13.3 30.3 18.9 33.9 21.32 498 2845 7.5 21.0238 An Giang 52 8.4 14.6 72.7 20.1 32.8 30.61 583 2950 8.1 9.5639 Bac Lieu 33 13.0 14.0 24.0 31.4 31.9 20.14 446 3506 8.2 18.0540 Dong Thap 58 8.9 14.3 86.6 4.0 31.8 33.49 513 3854 7.7 13.5941 Dac Lac 37 19.2 7.8 8.2 14.3 51.1 21.48 344 4288 13.8 11.4342 Quang Ngai 40 15.7 13.8 19.8 63.2 45.1 22.33 403 1766 5.2 22.8843 Quang Tri 35 12.2 13.5 22.7 26.1 39.2 21.21 429 2178 5.6 27.6344 Quang Binh 44 13.1 7.3 27.0 14.0 51.5 24.42 373 1880 6.3 37.9745 Binh Thuan 27 7.7 10.3 13.5 48.1 39.1 18.45 529 2495 5.5 11.6446 Hoa Binh 41 9.3 8.0 28.3 7.0 43.3 22.62 381 1898 6.9 17.8747 Binh Phuoc 29 9.5 11.8 10.3 14.4 41.5 18.57 698 3107 6.0 16.9648 Bac Giang 25 11.8 6.5 6.0 7.9 42.3 17.66 476 2767 6.3 13.91
Human PovertyIndex
HPIrank
Peoplenot
expectedto surviveto age 40(as % of
total popu-lation-1999)
Adultilliteracyrate (% -
1999)
Population with-
outaccessto safe
water (%- 1999)
Population with-
outaccessto sani-
tation (%- 1999)
Underweight chil-
drenunder
age five(%) 1998 HPI
GDPper capi-
ta(PPP$)Poorest
20%(1999)
GDP percapita(PPP$)Richest
20%(1999)
GDP percapita(PPP$)Richest20% toPoorest
20%1999
Populationbelow
incomepovertyline (% -
1999)HDI rank Province

91HUMAN DEVELOPMENT INDEX
49 Phu Yen 42 26.4 10.2 12.1 58.7 41.3 23.19 435 2252 5.7 9.3550 Lang Son 48 14.5 10.6 50.6 28.9 42.5 27.91 473 2227 5.4 14.5051 Tuyen Quang 38 8.5 12.8 26.8 19.1 40.9 22.06 303 1661 6.5 6.8952 Ninh Thuan 47 11.2 18.8 42.0 66.7 39.8 26.06 445 2226 6.0 15.0553 Yen Bai 43 12.9 15.2 31.3 19.9 40.6 23.59 436 2040 5.4 17.27Low Human Development 19.0 30.9 58.3 41.6 43.6 33.42 360 2135 6.9 23.50
54 Bac Can 51 10.6 14.5 59.4 27.5 43.2 30.01 482 2298 4.3 26.4655 Cao Bang 56 18.5 23.4 66.0 46.6 41.5 32.73 404 2460 6.9 20.0656 Lao Cai 55 13.9 30.7 54.2 42.6 45.5 32.55 418 2097 6.5 22.2157 Son La 59 16.9 30.5 68.7 21.9 39.4 34.25 367 2033 6.6 23.8258 Gia Lai 53 22.8 30.7 41.7 54.6 46.7 31.62 279 2527 10.4 22.4159 Kon Tum 50 28.6 26.8 30.8 37.3 44.2 29.83 300 1944 6.9 23.8460 Ha Giang 60 20.6 31.9 63.5 37.9 43 34.70 389 1671 6.0 22.0261 Lai Chau 61 19.0 48.7 76.7 57.4 43.2 42.79 287 1876 7.0 28.94
Red River Delta 6.5 5.5 7.9 3.9 33.5 15.5 480 2640 7.0 6.49North East 11.3 10.7 22.3 15.6 40.1 20.9 460 2342 6.3 14.40North West 14.9 26.7 57.1 26.2 41.7 31.4 352 1945 6.9 23.15North Central Coast 10.5 8.7 13.4 16.1 42.9 19.3 394 2244 6.4 20.38South Central Coast 12.3 9.4 11.4 50.8 39.2 18.4 425 2293 6.6 16.00Central Highlands 21.3 17.0 21.2 29.5 48.9 24.9 317 3420 10.4 16.19Southeastern 6.7 7.9 7.2 14.3 30.0 14.8 799 5406 8.6 9.61Mekong River Delta 9.7 11.9 55.6 12.3 32.2 26.5 505 3178 7.8 13.92All Viet Nam 9.7 9.7 22.9 16.4 36.7 20.1 507 3070 7.3 13.21
Human PovertyIndex
HPIrank
Peoplenot
expectedto surviveto age 40(as % of
total popu-lation-1999)
Adultilliteracyrate (% -
1999)
Population with-
outaccessto safe
water (%- 1999)
Population with-
outaccessto sani-
tation (%- 1999)
Underweight chil-
drenunder
age five(%) 1998 HPI
GDPper capi-
ta(PPP$)Poorest
20%(1999)
GDP percapita(PPP$)Richest
20%(1999)
GDP percapita(PPP$)Richest20% toPoorest
20% 1999
Populationbelow
incomepovertyline (% -
1999)HDI rank Province

92 NATIONAL HUMAN DEVELOPMENT REPORT 2001
High Human Development 51.0 3243 81.1 84.7 87.5 71.1 77.2 3.1 8.3 0.7641 Ba Ria-Vung Tau 50.0 14470 85.6 80.0 75.8 69.1 77.7 4.8 9.9 0.837 1 2 Ha Noi 50.0 3588 88.5 102.3 98.1 72.6 78.4 0.9 5.1 0.806 2 3 Tp. HCMinh 51.9 5209 85.6 84.4 86.1 71.5 79.1 3.8 7.9 0.802 3 4 Da Nang 50.9 2215 63.7 96.0 94.2 74.5 76.3 2.1 8.3 0.765 4 5 Hai Phong 50.7 1948 88.5 88.3 85.2 70.5 75.7 1.7 7.2 0.740 5 6 Binh Duong 51.6 2589 85.6 79.9 79.5 67.1 75.9 5.2 9.7 0.733 6 7 Dong Nai 50.1 2180 85.6 80.8 77.3 70.4 73.6 5.0 9.8 0.726 7 8 Thai Binh 52.2 1099 88.5 86.7 82.6 72.8 79.1 2.6 7.9 0.720 8 9 Hai Duong 51.7 1290 88.5 90.1 83.2 69.5 77.9 1.6 8.3 0.719 9
10 Khanh Hoa 50.5 1870 63.7 77.4 76.6 67.9 74.5 5.2 11.8 0.706 12 11 Quang Ninh 49.0 1648 61.8 84.8 81.9 69.5 72.6 4.1 10.4 0.708 11 12 Nam Dinh 51.3 974 88.5 89.2 80.8 72.8 77.9 2.0 9.0 0.710 10
Medium Human Development 50.9 1138 73.4 72.9 78.8 66.6 73.4 6.0 13.0 0.66113 Vinh Long 51.5 1506 81.3 79.3 72.1 69.6 75.9 7.0 12.5 0.699 15 14 Hung Yen 51.7 1208 88.5 89.2 78.8 68.1 77.4 2.0 10.4 0.704 14 15 Ha Nam 51.5 956 88.5 89.2 82.4 71.0 78.8 2.3 10.4 0.705 13 16 Long An 51.0 1589 81.3 69.3 66.9 70.2 74.0 5.7 12.3 0.692 16 17 Vinh Phuc 51.3 1040 61.8 89.7 78.6 68.8 73.8 2.6 8.9 0.686 20 18 Tien Giang 51.6 1461 81.3 72.4 66.6 67.9 76.8 5.6 12.5 0.690 17 19 Bac Ninh 51.4 1072 61.8 87.1 77.2 67.6 75.5 2.3 9.3 0.686 19 20 Ca Mau 50.7 1619 81.3 64.6 59.8 68.1 72.8 5.6 8.5 0.682 2221 Kien Giang 50.7 1660 81.3 64.9 62.3 69.3 75.8 9.1 13.9 0.687 18 22 Ha Tinh 50.9 874 74.7 88.9 83.2 67.2 75.0 2.5 8.9 0.680 23 23 Phu Tho 50.9 960 61.8 85.5 78.0 67.3 74.7 2.3 7.6 0.679 24 24 Can Tho 50.9 1577 81.3 68.7 63.7 68.0 73.7 8.7 15.3 0.676 27 25 Ha Tay 51.3 1006 88.5 91.5 82.0 66.3 75.6 3.3 11.8 0.684 21 26 Nghe An 50.8 940 74.7 87.1 82.9 63.6 74.0 3.8 10.2 0.667 32 27 Ben Tre 51.6 1410 81.3 70.2 70.1 66.0 75.8 6.9 13.3 0.678 26 28 Tay Ninh 50.9 1376 85.6 69.8 68.5 67.9 74.4 7.9 11.7 0.679 25 29 Quang Nam 51.6 955 63.7 88.7 81.3 68.9 72.6 4.7 14.4 0.670 29 30 Ninh Binh 51.1 762 88.5 87.7 83.5 67.3 72.8 2.9 10.0 0.665 34 31 Lam Dong 49.6 1023 85.6 76.1 74.9 68.6 74.8 5.4 12.3 0.675 28 32 Thai Nguyen 50.2 840 61.8 85.2 79.8 65.3 73.7 2.1 7.1 0.666 33 33 Thanh Hoa 51.1 946 74.7 87.5 81.7 66.3 73.8 5.3 12.0 0.670 30 34 Binh Dinh 51.5 1017 63.7 80.0 70.1 65.0 72.3 3.3 11.8 0.656 38 35 Thua Thien-Hue 50.7 1033 74.7 83.2 75.4 69.2 72.3 7.8 20.4 0.660 3736 Tra Vinh 50.1 1500 81.3 76.9 66.7 67.5 74.9 11.6 23.0 0.669 31 37 Soc Trang 51.3 1443 81.3 69.1 61.4 67.0 73.0 9.9 16.3 0.663 36 38 An Giang 50.8 1602 81.3 61.1 58.5 67.9 73.1 11.7 17.3 0.663 35 39 Bac Lieu 51.0 1325 81.3 67.4 61.7 66.6 73.3 11.5 16.2 0.655 39 40 Dong Thap 51.0 1161 81.3 63.9 58.9 67.8 74.5 10.6 17.6 0.650 40 41 Dac Lac 49.2 1248 58.8 80.3 75.1 62.2 66.3 4.8 10.8 0.646 41 42 Quang Ngai 51.3 873 63.7 84.9 80.1 63.0 71.7 8.8 18.2 0.635 49 43 Quang Tri 50.8 940 74.7 87.8 78.8 64.7 71.0 7.4 19.0 0.645 43 44 Quang Binh 50.6 876 74.7 82.1 72.0 62.9 70.5 4.0 10.5 0.642 45 45 Binh Thuan 50.1 923 85.6 67.0 64.3 68.2 71.9 7.6 12.8 0.646 42 46 Hoa Binh 50.4 777 81.2 86.3 81.5 64.3 70.0 4.7 11.2 0.645 44 47 Binh Phuoc 49.0 861 85.6 70.4 66.8 66.4 72.2 7.2 16.3 0.638 47 48 Bac Giang 50.6 785 61.8 81.4 69.6 66.3 69.9 3.3 9.6 0.642 46
GenderDevelopment
Index Femalepopula-
tionshare
(as % oftotal
popula-tion-
1999) GDP/PPPIncome
gap
Combined first-,second-
and third-level
grossenrolment
ratio(%)1999-Female
Combinedfirst-, sec-ond- and
third-levelgross
enrolmentratio
(%)1999-Male
Lifeexpectancy atbirth
(years,1999)Male
Lifeexpectancy atbirth
(years,1999)
Female
Adultilliteracyrate (% -
1999)Male
Adultilliteracyrate (% -
1999)female GDI GDIRANKHDI rank Province
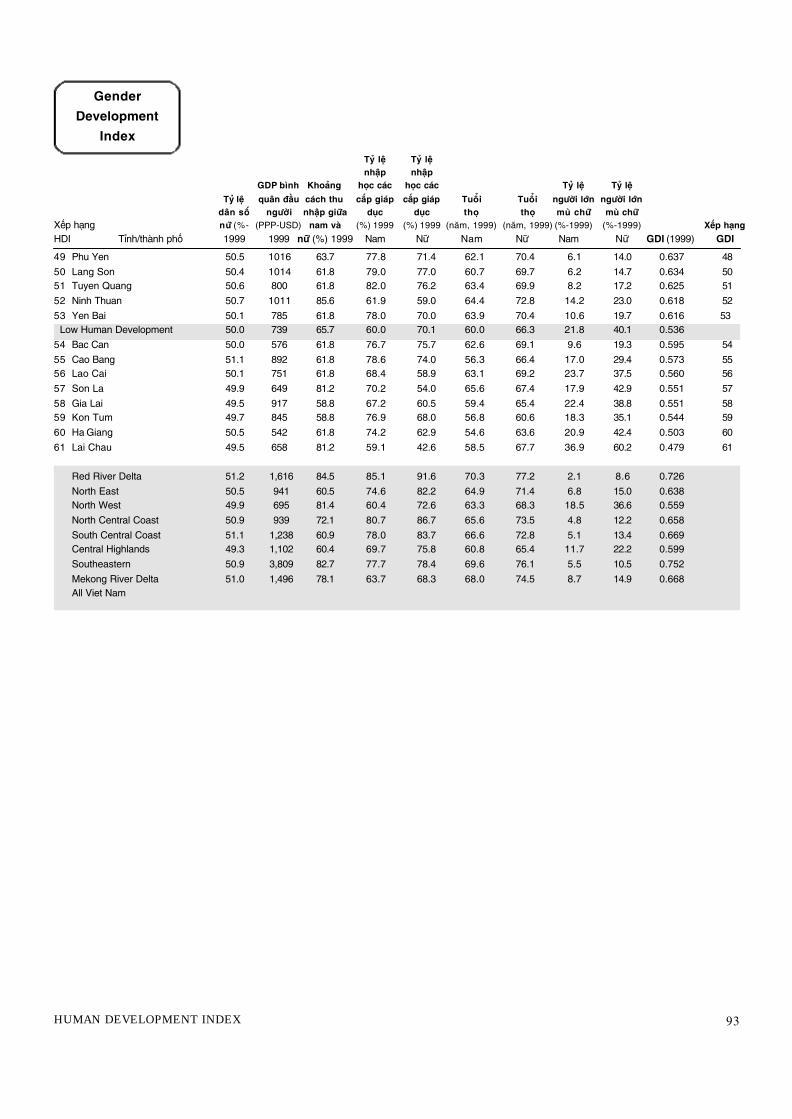
93HUMAN DEVELOPMENT INDEX
49 Phu Yen 50.5 1016 63.7 77.8 71.4 62.1 70.4 6.1 14.0 0.637 48 50 Lang Son 50.4 1014 61.8 79.0 77.0 60.7 69.7 6.2 14.7 0.634 50 51 Tuyen Quang 50.6 800 61.8 82.0 76.2 63.4 69.9 8.2 17.2 0.625 51 52 Ninh Thuan 50.7 1011 85.6 61.9 59.0 64.4 72.8 14.2 23.0 0.618 52 53 Yen Bai 50.1 785 61.8 78.0 70.0 63.9 70.4 10.6 19.7 0.616 53
Low Human Development 50.0 739 65.7 60.0 70.1 60.0 66.3 21.8 40.1 0.53654 Bac Can 50.0 576 61.8 76.7 75.7 62.6 69.1 9.6 19.3 0.595 54 55 Cao Bang 51.1 892 61.8 78.6 74.0 56.3 66.4 17.0 29.4 0.573 55 56 Lao Cai 50.1 751 61.8 68.4 58.9 63.1 69.2 23.7 37.5 0.560 56 57 Son La 49.9 649 81.2 70.2 54.0 65.6 67.4 17.9 42.9 0.551 57 58 Gia Lai 49.5 917 58.8 67.2 60.5 59.4 65.4 22.4 38.8 0.551 58 59 Kon Tum 49.7 845 58.8 76.9 68.0 56.8 60.6 18.3 35.1 0.544 59 60 Ha Giang 50.5 542 61.8 74.2 62.9 54.6 63.6 20.9 42.4 0.503 60 61 Lai Chau 49.5 658 81.2 59.1 42.6 58.5 67.7 36.9 60.2 0.479 61
Red River Delta 51.2 1,616 84.5 85.1 91.6 70.3 77.2 2.1 8.6 0.726North East 50.5 941 60.5 74.6 82.2 64.9 71.4 6.8 15.0 0.638North West 49.9 695 81.4 60.4 72.6 63.3 68.3 18.5 36.6 0.559North Central Coast 50.9 939 72.1 80.7 86.7 65.6 73.5 4.8 12.2 0.658South Central Coast 51.1 1,238 60.9 78.0 83.7 66.6 72.8 5.1 13.4 0.669Central Highlands 49.3 1,102 60.4 69.7 75.8 60.8 65.4 11.7 22.2 0.599Southeastern 50.9 3,809 82.7 77.7 78.4 69.6 76.1 5.5 10.5 0.752Mekong River Delta 51.0 1,496 78.1 63.7 68.3 68.0 74.5 8.7 14.9 0.668All Viet Nam
GenderDevelopment
IndexTyã lïå Tyã lïånhêåp nhêåp
GDP bònh Khoaãng hoåc caác hoåc caác Tyã lïå Tyã lïåTyã lïå quên àêìu caách thu cêëp giaáp cêëp giaáp Tuöíi Tuöíi ngûúâi lúán ngûúâi lúán
dên söë ngûúâi nhêåp giûäa duåc duåc thoå thoå muâ chûä muâ chûäXïëp haång nûä (%- (PPP-USD) nam vaâ (%) 1999 (%) 1999 (nùm, 1999) (nùm, 1999) (%-1999) (%-1999) Xïëp haångHDI Tónh/thaânh phöë 1999 1999 nûä (%) 1999 Nam Nûä Nam Nûä Nam Nûä GDI (1999) GDI

94 NATIONAL HUMAN DEVELOPMENT REPORT 2001
High Human Development 71.0 77.2 3.2 8.4 44.4 49.1 80.5 84.2 6.1 5.4 22.8 21.3 24.6 22.01 Ba Ria-Vung Tau 69.1 77.7 4.8 9.9 0.0 46.6 88.9 90.7 3.1 2.8 11.2 9.4 20.0 24.42 Ha Noi 72.6 78.4 0.9 5.1 43.6 50.2 58.9 63.9 18.3 16.2 13.9 11.5 30.0 24.73 Tp. HCMinh 71.5 79.1 3.8 7.9 39.1 45.9 70.9 75.5 9.3 9.0 9.5 7.8 16.0 24.74 Da Nang 74.5 76.3 2.1 8.3 34.8 49.1 74.6 80.7 10.9 9.4 12.7 10.9 20.0 24.45 Hai Phong 70.5 75.7 1.7 7.2 40.3 50.6 78.7 82.6 4.9 3.6 23.4 18.6 33.3 12.76 Binh Duong 67.1 75.9 5.2 9.7 32.4 47.2 83.7 88.7 3.4 2.8 10.8 9.4 40.0 22.27 Dong Nai 70.4 73.6 5.0 9.8 68.8 47.2 88.7 90.6 3.0 2.5 26.2 22.7 30.0 32.48 Thai Binh 72.8 79.1 2.6 7.9 60.6 52.8 91.7 94.4 1.4 1.1 24.9 22.6 20.0 17.59 Hai Duong 69.5 77.9 1.6 8.3 59.7 53.4 92.8 95.2 1.0 1.1 63.5 61.6 22.2 27.910 Khanh Hoa 67.9 74.5 5.2 11.8 40.7 47.1 87.2 90.3 3.7 3.4 29.8 28.5 16.7 6.511 Quang Ninh 69.5 72.6 4.1 10.4 44.8 49.1 76.4 81.9 4.0 3.1 16.2 14.0 33.3 21.412 Nam Dinh 72.8 77.9 2.0 9.0 45.8 51.9 90.0 91.7 2.4 2.2 33.2 33.0 30.0 23.5
Medium Human Development 66.5 73.4 6.0 13.0 47.5 50.4 91.5 93.4 1.8 1.5 27.3 24.9 27.6 20.213 Vinh Long 69.6 75.9 7.0 12.5 53.3 48.0 92.0 93.0 2.2 2.3 20.5 20.8 16.7 15.614 Hung Yen 68.1 77.4 2.0 10.4 52.8 53.5 93.4 94.6 1.0 0.9 57.4 56.3 16.7 21.315 Ha Nam 71.0 78.8 2.3 10.4 69.4 52.4 89.1 90.9 2.7 2.1 36.2 32.9 20.0 22.216 Long An 70.2 74.0 5.7 12.3 71.8 49.0 88.9 91.2 2.1 1.8 16.5 15.3 57.1 21.217 Vinh Phuc 68.8 73.8 2.6 8.9 68.2 53.9 92.1 95.3 1.2 1.0 14.4 9.4 16.7 12.818 Tien Giang 67.9 76.8 5.6 12.5 64.9 50.8 92.9 94.4 1.4 1.4 34.7 32.5 44.4 23.319 Bac Ninh 67.6 75.5 2.3 9.3 16.1 53.4 90.3 94.1 1.7 1.1 30.6 29.2 16.7 24.420 Ca Mau 68.1 72.8 5.6 8.5 0.0 44.8 94.3 95.3 0.8 0.5 25.5 24.6 33.3 22.421 Kien Giang 69.3 75.8 9.1 13.9 54.6 48.5 94.0 96.1 1.2 0.9 27.1 26.6 25.0 27.622 Ha Tinh 67.2 75.0 2.5 8.9 55.7 52.9 91.9 93.0 1.7 1.2 68.5 66.2 28.6 19.223 Phu Tho 67.3 74.7 2.3 7.6 42.4 53.6 90.4 92.8 1.9 1.8 27.1 21.9 14.3 18.724 Can Tho 68.0 73.7 8.7 15.3 40.9 49.2 92.5 94.2 2.3 2.3 18.4 16.0 20.0 17.225 Ha Tay 66.3 75.6 3.3 11.8 37.0 52.8 85.9 89.9 2.6 2.6 30.7 28.0 38.5 29.326 Nghe An 63.6 74.0 3.8 10.2 66.0 52.9 90.3 92.8 1.3 0.9 27.5 23.7 20.0 20.027 Ben Tre 66.0 75.8 6.9 13.3 62.0 48.2 93.7 93.9 1.3 1.4 31.2 27.0 28.6 24.528 Tay Ninh 67.9 74.4 7.9 11.7 67.4 47.0 90.9 92.5 1.7 1.6 27.7 24.7 16.7 13.329 Quang Nam 68.9 72.6 4.7 14.4 0.0 51.7 90.9 93.2 2.6 2.2 26.2 21.5 42.9 20.030 Ninh Binh 67.3 72.8 2.9 10.0 72.0 52.5 89.7 91.1 2.2 1.8 41.7 40.0 16.7 26.731 Lam Dong 68.6 74.8 5.4 12.3 53.9 48.8 91.7 93.9 1.9 1.6 7.6 6.8 33.3 15.932 Thai Nguyen 65.3 73.7 2.1 7.1 38.9 50.3 84.7 86.4 3.2 2.9 21.6 19.9 33.3 20.833 Thanh Hoa 66.3 73.8 5.3 12.0 50.7 51.7 92.2 93.6 1.5 1.3 22.9 17.2 23.5 16.534 Binh Dinh 65.0 72.3 3.3 11.8 45.1 52.1 91.5 95.1 1.3 0.9 19.7 18.7 25.0 19.635 Thua Thien-Hue 69.2 72.3 7.8 20.4 54.0 50.7 88.6 91.1 4.3 4.0 21.3 19.4 16.7 10.936 Tra Vinh 67.5 74.9 11.6 23.0 0.0 51.3 95.5 97.4 1.0 0.6 22.6 21.6 50.0 6.737 Soc Trang 67.0 73.0 9.9 16.3 0.0 47.4 96.7 98.2 0.7 0.5 31.7 30.6 28.6 20.438 An Giang 67.9 73.1 11.7 17.3 61.6 45.4 92.4 93.9 2.4 2.0 18.6 17.8 30.0 28.239 Bac Lieu 66.6 73.3 11.5 16.2 55.1 48.1 95.0 95.7 0.7 0.5 28.6 25.8 20.0 17.840 Dong Thap 67.8 74.5 10.6 17.6 57.5 47.9 89.9 92.2 2.4 1.7 25.5 23.8 25.0 18.641 Dac Lac 62.2 66.3 4.8 10.8 47.4 47.4 90.3 92.5 2.4 2.0 21.5 20.1 28.6 0.042 Quang Ngai 63.0 71.7 8.8 18.2 60.1 52.7 93.4 96.3 1.4 1.2 38.0 34.8 28.6 18.943 Quang Tri 64.7 71.0 7.4 19.0 68.2 51.4 92.3 95.3 1.6 1.0 51.2 47.4 20.0 17.844 Quang Binh 62.9 70.5 4.0 10.5 62.1 51.2 90.2 93.4 2.6 1.9 23.6 22.3 20.0 20.045 Binh Thuan 68.2 71.9 7.6 12.8 0.0 44.6 87.2 89.9 3.1 2.6 20.8 17.4 33.3 17.446 Hoa Binh 64.3 70.0 4.7 11.2 60.4 51.1 92.2 92.8 2.0 2.1 17.4 15.7 60.0 19.047 Binh Phuoc 66.4 72.2 7.2 16.3 0.0 45.7 89.7 92.4 1.2 0.9 12.9 12.6 20.0 21.248 Bac Giang 66.3 69.9 3.3 9.6 52.8 52.2 95.2 96.3 0.7 0.6 33.8 30.3 25.0 26.7
GenderDevelopment
Lifeexpectancy atbirth
(years,1999)Male
Lifeexpectancy atbirth
(years,1999)
Female
Adultilliteracyrate (% -
1999)Male
Adultilliteracyrate (% -
1999)female
Femaletertiary
stu-dents
(as % oftotal
students- 1998)a
Femalelabors
as % oftotal
labors(% -
1998)
Unskilledlabors
(% -1998)
Unskilledlabors(% -
1998)Female
Laborswith
highergrade
of edu-cation
andabove(%- 98)
Laborswith
highergrade
of edu-cationand
above(%- 98)Female
Underemploy-ment
rate (%- 1998)
Underemploy-ment
rate (%- 1998)Female
Womenin theTenth
NationalAssembly (% ,1997-2002)
Women ingovern-ment at
provincialpeople'scouncil(1999-2004)HDI rank Province

95HUMAN DEVELOPMENT INDEX
49 Phu Yen 62.1 70.4 6.1 14.0 68.4 49.3 91.1 93.3 1.9 1.3 32.9 29.6 20.0 13.350 Lang Son 60.7 69.7 6.2 14.7 67.7 50.6 92.7 93.0 1.2 1.2 7.1 6.4 20.0 26.851 Tuyen Quang 63.4 69.9 8.2 17.2 0.0 51.0 90.1 89.2 2.6 2.5 22.7 21.5 40.0 33.352 Ninh Thuan 64.4 72.8 14.2 23.0 0.0 47.2 91.8 94.1 1.7 1.4 14.6 13.4 20.0 20.053 Yen Bai 63.9 70.4 10.6 19.7 61.3 51.1 93.5 94.4 1.5 1.3 34.3 33.2 20.0 29.6Low Human Development 60.0 66.3 21.6 39.8 28.7 50.5 89.1 90.8 1.9 1.5 13.9 12.6 22.0 24.2
54 Bac Can 62.6 69.1 9.6 19.3 0.0 50.7 92.8 92.1 1.0 0.8 20.0 19.0 20.0 22.255 Cao Bang 56.3 66.4 17.0 29.4 0.0 51.5 90.4 90.4 2.0 2.0 7.4 7.2 20.0 26.756 Lao Cai 63.1 69.2 23.7 37.5 0.0 50.6 88.5 90.1 2.5 1.3 14.6 13.2 20.0 30.057 Son La 65.6 67.4 17.9 42.9 54.9 50.4 83.4 85.5 2.6 2.4 8.4 7.2 33.3 31.358 Gia Lai 59.4 65.4 22.4 38.8 68.8 50.1 87.1 91.8 1.9 1.3 15.0 12.5 20.0 30.459 Kon Tum 56.8 60.6 18.3 35.1 0.0 50.4 86.8 89.0 3.9 2.7 12.2 11.5 20.0 20.060 Ha Giang 54.6 63.6 20.9 42.4 0.0 50.2 93.4 93.6 0.9 0.8 17.0 15.9 20.0 27.561 Lai Chau 58.5 67.7 36.9 60.2 0.0 50.4 94.4 95.5 1.0 0.7 21.0 19.5 20.0 0.0
Red River Delta 70.3 77.2 2.0 8.5 48.5 52.1 84.0 87.2 4.8 4.1 33.6 31.7 27.3 23.0North East 64.9 71.4 6.6 14.6 38.8 51.7 89.9 91.8 1.9 1.6 22.0 19.6 23.0 24.5North West 63.3 68.3 17.8 35.3 45.0 50.7 89.4 90.7 2.0 1.9 14.9 13.4 37.5 18.1North Central Coast 65.6 73.5 4.8 12.3 58.2 52.0 91.1 93.1 1.9 1.5 31.1 27.3 21.8 17.6South Central Coast 66.6 72.8 5.1 13.4 37.8 50.7 89.5 92.8 2.9 2.4 27.1 24.5 26.3 17.3Central Highlands 60.8 65.4 11.8 22.2 49.2 48.8 88.7 91.8 2.4 1.8 18.1 16.2 23.5 15.9Southeastern 69.6 76.1 5.3 10.2 39.7 46.5 81.6 85.0 5.3 4.9 15.0 12.9 23.3 21.9Mekong River Delta 68.0 74.5 8.7 14.9 50.5 48.2 92.9 94.4 1.7 1.4 24.9 23.3 31.5 20.8All Viet Nam 67.4 74.0 6.0 13.1 45.6 50.0 88.2 90.6 3.1 2.6 25.2 23.2 26.2 21.1
GenderDevelopment
Lifeexpectancy atbirth
(years,1999)Male
Lifeexpectancy atbirth
(years,1999)
Female
Adultilliteracyrate (% -
1999)Male
Adultilliteracyrate (% -
1999)female
Femaletertiary
stu-dents
(as % oftotal
students- 1998)a
Femalelabors
as % oftotal
labors(% -
1998)
Unskilledlabors(% -
1998)
Unskilledlabors(% -
1998)Female
Laborswith
highergrade
of edu-cationand
above(%- 98)
Laborswith
highergrade
of edu-cationand
above(%- 98)Female
Underemploy-ment
rate (%- 1998)
Underemploy-ment
rate (%- 1998)Female
Womenin theTenth
NationalAssembly (% ,1997-2002)
Women ingovern-ment at
provincialpeople'scouncil(1999-2004)HDI rank Province

96 NATIONAL HUMAN DEVELOPMENT REPORT 2001
High Human Development 17,846,682 20,932,439 1.5 74.3 51.0 43.53 140,403 482,230 1 Ba Ria-Vung Tau 618,689 800,572 2.6 74.3 50.0 41.56 16728 237402 Ha Noi 2,086,954 2,672,125 2.5 75.7 50.0 57.59 6404 1146173 Tp. HCMinh 4,095,818 5,037,151 2.1 75.7 51.9 83.47 82388 4105534 Da Nang 591,317 684,131 1.5 75.6 50.9 78.63 32036 246925 Hai Phong 1,510,867 1,672,992 1.0 73.4 50.7 33.96 -3504 -142076 Binh Duong 547,928 716,424 2.7 71.8 51.6 32.57 25139 413277 Dong Nai 1,683,328 1,989,540 1.7 71.5 50.1 30.52 116080 452218 Thai Binh 1,686,681 1,785,601 0.6 76.5 52.2 5.78 -46288 -414289 Hai Duong 1,551,753 1,649,780 0.6 73.7 51.7 13.80 -41733 -6322110 Khanh Hoa 855,198 1,031,261 1.9 72.3 50.5 36.36 1468 -56111 Quang Ninh 850,032 1,004,453 1.7 71.1 49.0 44.14 -2329 -443312 Nam Dinh 1,768,117 1,888,409 0.7 75.3 51.3 12.40 -45986 -54070
Medium Human Development 44,477,636 50,676,245 1.3 70.1 50.8 15.29 (146,072) (558,004)13 Vinh Long 993,545 1,010,493 0.2 73.3 51.5 14.37 -2858 -2180114 Hung Yen 990,184 1,068,704 0.8 72.0 51.7 8.66 -9826 -1488615 Ha Nam 749,708 791,619 0.5 74.0 51.5 6.09 -20904 -2457816 Long An 1,161,800 1,306,205 1.2 72.2 51.0 16.46 -12176 689517 Vinh Phuc 970,098 1,091,981 1.2 72.2 51.3 10.17 -1427 -1549118 Tien Giang 1,539,628 1,605,147 0.4 72.5 51.6 13.29 -11444 -3074319 Bac Ninh 846,478 941,393 1.1 71.4 51.4 9.37 -10219 -2928220 Ca Mau 942,003 1,119,258 1.7 71.1 50.7 18.69 -1608 -415521 Kien Giang 1,242,399 1,494,425 1.9 72.1 50.7 22.09 7529 831422 Ha Tinh 1,214,290 1,269,017 0.4 72.1 50.9 8.89 -23766 -5199323 Phu Tho 1,147,857 1,261,505 0.9 71.0 50.9 14.18 -1445 -1567924 Can Tho 1,674,791 1,811,139 0.8 70.8 50.9 21.28 -2458 -95825 Ha Tay 2,115,999 2,386,772 1.2 69.9 51.3 7.99 -8803 -2708726 Nghe An 2,518,510 2,858,263 1.3 70.6 50.8 10.21 -49144 -6182327 Ben Tre 1,260,769 1,296,914 0.3 70.0 51.6 8.47 -15558 -3481628 Tay Ninh 819,724 965,236 1.6 70.3 50.9 12.92 156 -1016129 Quang Nam 1,216,849 1,372,425 1.2 71.0 51.6 14.27 -46667 -3596930 Ninh Binh 792,437 884,074 1.1 71.4 51.1 12.83 -21347 -2407331 Lam Dong 693,714 996,221 3.7 70.7 49.6 38.67 87936 5606132 Thai Nguyen 854,268 1,046,159 2.0 69.6 50.2 20.93 -1794 -1784533 Thanh Hoa 3,127,235 3,467,610 1.0 69.4 51.1 9.18 -45247 -9448734 Binh Dinh 1,286,915 1,461,046 1.3 70.0 51.5 24.00 -29586 -2580435 Thua Thien-Hue 921,220 1,045,130 1.3 71.6 50.7 27.58 -19790 -1932936 Tra Vinh 883,817 965,708 0.9 70.0 50.1 12.94 -2858 -961537 Soc Trang 1,107,815 1,173,821 0.6 69.6 51.3 17.89 -1628 -1430438 An Giang 1,842,123 2,049,024 1.1 69.8 50.8 19.68 -6254 -1752339 Bac Lieu 681,040 736,327 0.8 69.7 51.0 24.53 -6252 -1614940 Dong Thap 1,378,457 1,564,973 1.3 71.7 51.0 14.50 -4639 -4523241 Dac Lac 1,085,880 1,776,333 5.0 65.6 49.2 20.01 177300 12817142 Quang Ngai 1,077,199 1,190,006 1.0 69.8 51.3 10.97 -24772 -3505243 Quang Tri 473,221 573,332 1.9 68.5 50.8 23.49 -10189 -1461144 Quang Binh 664,877 793,864 1.8 67.9 50.6 10.83 -14348 -2764245 Binh Thuan 816,943 1,047,041 2.5 70.7 50.1 23.45 2483 -1215546 Hoa Binh 693,309 757,645 0.9 67.3 50.4 13.84 -2786 -1154147 Binh Phuoc 450,639 653,640 3.8 69.7 49.0 15.17 32081 5274148 Bac Giang 1,322,702 1,492,191 1.2 67.4 50.6 7.43 -6076 -1740949 Phu Yen 669,903 786,969 1.6 66.1 50.5 18.93 1153 -3659
Demography
TotalPopulation
(1989) a
TotalPopulation
(1999)
Annual pop-ulation
growth rate(%, 1989-
1999) b
Lifeexpectancy
at birth(years) 1999
Female pop-ulation share(as % of totalpopulation-
1999)
Urban popu-lation (as %
of total -1999)
Migration 84-89
Migration 94-99 HDI rank Province
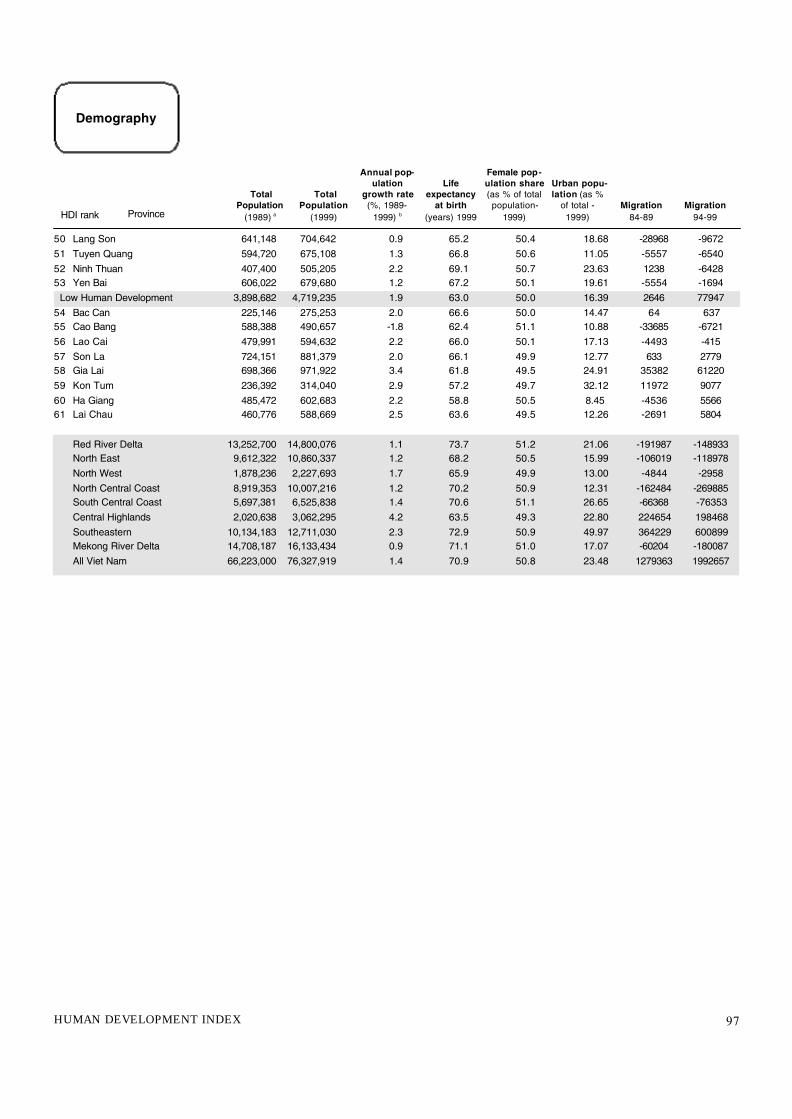
97HUMAN DEVELOPMENT INDEX
50 Lang Son 641,148 704,642 0.9 65.2 50.4 18.68 -28968 -967251 Tuyen Quang 594,720 675,108 1.3 66.8 50.6 11.05 -5557 -654052 Ninh Thuan 407,400 505,205 2.2 69.1 50.7 23.63 1238 -642853 Yen Bai 606,022 679,680 1.2 67.2 50.1 19.61 -5554 -1694
Low Human Development 3,898,682 4,719,235 1.9 63.0 50.0 16.39 2646 7794754 Bac Can 225,146 275,253 2.0 66.6 50.0 14.47 64 63755 Cao Bang 588,388 490,657 -1.8 62.4 51.1 10.88 -33685 -672156 Lao Cai 479,991 594,632 2.2 66.0 50.1 17.13 -4493 -41557 Son La 724,151 881,379 2.0 66.1 49.9 12.77 633 277958 Gia Lai 698,366 971,922 3.4 61.8 49.5 24.91 35382 6122059 Kon Tum 236,392 314,040 2.9 57.2 49.7 32.12 11972 907760 Ha Giang 485,472 602,683 2.2 58.8 50.5 8.45 -4536 556661 Lai Chau 460,776 588,669 2.5 63.6 49.5 12.26 -2691 5804
Red River Delta 13,252,700 14,800,076 1.1 73.7 51.2 21.06 -191987 -148933North East 9,612,322 10,860,337 1.2 68.2 50.5 15.99 -106019 -118978North West 1,878,236 2,227,693 1.7 65.9 49.9 13.00 -4844 -2958North Central Coast 8,919,353 10,007,216 1.2 70.2 50.9 12.31 -162484 -269885South Central Coast 5,697,381 6,525,838 1.4 70.6 51.1 26.65 -66368 -76353Central Highlands 2,020,638 3,062,295 4.2 63.5 49.3 22.80 224654 198468Southeastern 10,134,183 12,711,030 2.3 72.9 50.9 49.97 364229 600899Mekong River Delta 14,708,187 16,133,434 0.9 71.1 51.0 17.07 -60204 -180087All Viet Nam 66,223,000 76,327,919 1.4 70.9 50.8 23.48 1279363 1992657
Demography
TotalPopulation
(1989) a
TotalPopulation
(1999)
Annual pop-ulation
growth rate(%, 1989-
1999) b
Lifeexpectancy
at birth(years) 1999
Female pop-ulation share(as % of totalpopulation-
1999)
Urban popu-lation (as %
of total -1999)
Migration 84-89
Migration 94-99 HDI rank Province

98 NATIONAL HUMAN DEVELOPMENT REPORT 2001
High Human Development 50.1 49.2 127.6 127.5 82.3 52.0 79.6 64.5 1.9 22.5 1 Ba Ria-Vung Tau 44.5 44.4 0.86 0.88 86.4 88.9 35 31 1.04 11.22 Ha Noi 50.1 47.8 3.13 3.11 64.2 58.9 138 183 3.37 13.93 Ho Chi Minh City 48.6 46.7 6.50 6.36 79.3 70.9 68 93 3.18 9.54 Da Nang 44.5 43.3 0.81 0.79 76.8 74.6 92 109 4.15 12.75 Hai Phong 49.9 50.9 2.29 2.34 78.2 78.7 44 49 1.14 23.46 Binh Duong 49.8 47.6 0.88 0.85 88.6 83.7 27 34 1.55 10.87 Dong Nai 50.0 49.4 2.63 2.69 88.5 88.7 30 30 1.29 26.28 Thai Binh 54.0 54.5 2.73 2.72 91.4 91.6 21 14 0.34 24.99 Hai Duong 52.0 52.1 2.42 2.42 92.2 92.8 15 10 0.24 63.5
10 Khanh Hoa 49.8 49.3 1.34 1.33 86.5 87.2 38 37 1.80 29.811 Quang Ninh 52.0 51.9 1.33 1.33 78.2 76.4 37 40 2.64 16.212 Nam Dinh 51.6 51.7 2.71 2.70 87.5 90 24 24 1.11 33.2
Medium Human Development 48.3 48.2 66.3 66.4 91.8 15.8 91.4 18.2 0.9 27.013 Vinh Long 46.7 47.8 1.41 1.44 91.5 92 23 22 0.96 20.514 Hung Yen 51.7 49.6 1.54 1.47 92.3 93.4 10 10 0.09 57.415 Ha Nam 51.9 51.1 1.16 1.14 92.7 89.1 15 27 0.37 36.216 Long An 52.2 49.9 1.85 1.77 90.6 88.9 14 20 0.73 16.517 Vinh Phuc 50.0 49.1 1.47 1.45 92.3 92.1 14 12 0.26 14.418 Tien Giang 50.1 52.8 2.35 2.49 91.9 92.9 19 14 0.30 34.719 Bac Ninh 52.2 50.5 1.33 1.28 93.2 90.3 15 17 0.41 30.620 Ca Mau 46.4 44.9 1.36 1.32 94.1 94.3 7 8 2.11 25.521 Kien Giang 46.0 48.4 1.80 1.91 95.3 94 5 12 1.31 27.122 Ha Tinh 44.0 42.9 1.63 1.57 94.2 91.9 11 17 0.89 68.523 Phu Tho 49.8 51.1 1.73 1.78 89.1 90.4 17 19 0.77 27.124 Can Tho 46.2 50 2.39 2.60 90.3 92.5 21 23 1.59 18.425 Ha Tay 51.1 50.6 3.28 3.23 90.0 85.9 21 26 0.23 30.726 Nghe An 45.4 43.8 3.54 3.40 91.0 90.3 17 13 0.56 27.527 Ben Tre 49.5 48.6 1.87 1.85 93.2 93.7 12 13 1.59 31.228 Tay Ninh 46.9 48.1 1.19 1.21 91.5 90.9 12 17 0.74 27.729 Quang Nam 48.5 47.7 1.81 1.80 90.6 90.9 18 26 0.63 26.230 Ninh Binh 49.4 48.7 1.21 1.19 91.5 89.6 14 22 0.26 41.731 Lam Dong 48.8 46.7 1.11 1.09 90.0 91.7 22 19 0.41 7.632 Thai Nguyen 48.8 50.7 1.32 1.38 82.9 84.7 34 32 1.11 21.633 Thanh Hoa 49.1 48.4 4.73 4.67 92.1 92.2 14 15 0.55 22.934 Binh Dinh 50.8 50.3 2.04 2.03 90.2 91.5 13 13 1.55 19.735 Thua Thien-Hue 46.6 45.9 1.32 1.30 88.5 88.5 42 43 0.92 21.336 Tra Vinh 49.1 47.5 1.34 1.30 93.2 95.5 15 10 0.42 22.637 Soc Trang 49.0 48.3 1.67 1.65 96.1 96.7 6 7 2.02 31.738 An Giang 47.8 47 2.67 2.64 93.9 92.4 10 24 0.78 18.639 Bac Lieu 48.0 47 1.02 1.00 95.0 95 9 7 1.97 28.640 Dong Thap 46.7 50 1.98 2.12 93.3 89.9 12 23 1.06 25.541 Dac Lac 41.5 40.7 1.49 1.53 91.3 90.3 22 24 0.99 21.542 Quang Ngai 48.5 50.2 1.62 1.69 92.6 93.4 17 14 0.97 38.043 Quang Tri 45.4 41.7 0.69 0.63 92.6 92.3 15 16 1.42 51.244 Quang Binh 45.6 46.1 0.99 1.00 90.9 90.2 20 26 1.08 23.645 Binh Thuan 43.9 43.2 1.12 1.11 90.4 87.2 22 31 2.02 20.846 Hoa Binh 52.4 52.1 1.09 1.08 91.8 92.2 19 20 0.84 17.447 Binh Phuoc 43.7 46.5 0.65 0.70 87.5 89.7 16 12 1.93 12.948 Bac Giang 53.0 53.5 2.12 2.14 94.7 95.2 7 7 0.42 33.8
Labour
Labor (as% of total
population)96
Labor (as% of total
population)98
Locallabor (as% of total
labor force)96
Locallabor (as% of total
labor force)98
Unskilledlabor (% -
1996)
Unskilledlabor (% -
1998)
Laborswith high-er grade
of educa-tion andabove
(per1000labors) 96
Laborswith high-
er grade ofeducationand above(per1000labors) 98
Long-termUnemployment rate
(from 6months
and above)% - 1998
Underemploymentrate (% -
98)HDI rank Province

99HUMAN DEVELOPMENT INDEX
49 Phu Yen 50.5 49.7 1.05 1.04 92.5 91.1 19 19 0.47 32.950 Lang Son 51.5 51.7 1.02 1.03 92.5 92.7 14 12 0.51 7.151 Tuyen Quang 47.5 47.4 0.87 0.87 89.0 90.1 18 26 1.31 22.752 Ninh Thuan 46.6 47.4 0.61 0.62 87.8 91.8 17 17 1.32 14.653 Yen Bai 47.6 47.5 0.89 0.89 94.2 93.5 11 15 0.72 34.3
Low Human Development 49.0 48.6 6.0 6.1 92.8 11.5 89.0 19.3 0.6 14.054 Bac Can 43.0 52.3 0.37 0.45 92.4 92.8 12 9 0.77 20.055 Cao Bang 59.3 51.6 0.91 0.78 88.9 90.4 19 20 0.58 7.456 Lao Cai 48.1 49.1 0.76 0.79 94.1 88.5 12 25 0.32 14.657 Son La 47.8 47.9 1.10 1.11 93.6 83.4 10 26 0.20 8.458 Gia Lai 47.8 46.4 1.07 1.09 91.4 87.1 9 19 0.54 15.059 Kon Tum 45.1 44.4 0.33 0.33 92.4 86.8 18 39 0.98 12.260 Ha Giang 51.5 51.9 0.79 0.80 95.3 93.4 8 9 0.18 17.061 Lai Chau 45.8 47.5 0.69 0.72 94.8 94.4 8 10 1.55 21.0
Red River Delta 51.3 50.8 20.48 20.31 85.3 84 40 48 0.95 33.6North East 50.7 50.8 14.91 14.96 90.2 89.9 17 19 0.78 22.0North West 49.0 49.2 2.88 2.91 93.2 89.4 13 20 0.77 14.9North Central Coast 46.7 45.6 12.91 12.59 91.6 91.1 18 19 0.72 31.1South Central Coast 49.0 48.8 8.67 8.68 89.2 89.5 27 29 1.39 27.1Central Highlands 44.0 43.1 2.89 2.95 91.5 88.7 17 24 0.82 18.1Southeastern 47.8 46.9 15.55 15.52 84.9 81.6 42 53 2.04 15.0Mekong River Delta 48.1 48.8 21.71 22.08 93.0 92.9 13 16 1.18 24.9All Viet Nam 48.8 48.6 100.00 100.00 89.2 88.2 26 30 1.14 25.2
Labour
Labor (as% of total
population)96
Labor (as% of total
population)98
Locallabor (as% of total
labor force)96
Locallabor (as% of total
labor force)98
Unskilledlabor (% -
1996)
Unskilledlabor (% -
1998)
Laborswith
highergrade of
educationand above(per1000labors) 96
Laborswith
highergrade of
educationand above(per1000
labors) 98
Long-termUnemployment rate
(from 6months
and above)% - 1998
Underemploymentrate (% -
98)HDI rank Province

100 NATIONAL HUMAN DEVELOPMENT REPORT 2001
High Human Development 19.7 23.1 21.0 17.0 7067 19256 27212 0.3 5.41 Ba Ria-Vung Tau 18.8 4.6 25.4 25.3 21.0 2777 18323 26398 0.1 3.12 Ha Noi 11.0 6.5 20.0 18.6 15.0 10230 24641 39247 0.4 4.43 Tp. HCMinh 10.5 5.1 21.0 19.5 15.3 24773 41715 41479 0.3 6.04 Da Nang 19.0 6.1 19.9 19.2 16.0 8805 20565 33306 0.6 5.55 Hai Phong 20.8 7.1 23.5 21.4 15.5 12810 22835 25442 0.5 6.36 Binh Duong 15.7 5.0 29.1 27.9 16.5 5178 14761 19440 0.3 3.37 Dong Nai 21.1 4.6 26.2 24.5 19.3 6677 16981 22748 0.4 5.68 Thai Binh 25.4 8.5 20.5 17.7 15.5 3782 7601 18559 0.6 8.19 Hai Duong 26.1 6.3 24.0 20.3 18.7 4572 9301 17541 0.5 7.3
10 Khanh Hoa 38.3 5.4 29.0 27.0 20.9 11452 14258 24755 0.6 4.511 Quang Ninh 31.1 4.8 24.1 21.7 18.6 15499 18486 24885 0.6 3.812 Nam Dinh 26.1 7.8 25.3 20.5 18.5 3254 8347 18878 0.8 8.7
Medium Human Development 35.8 28.3 26.0 21.2 4812 12353 23138 0.8 6.313 Vinh Long 26.2 5.7 25.8 24.5 18.0 3279 10204 21746 0.6 5.914 Hung Yen 25.9 7.7 24.1 20.9 19.8 5106 10387 19565 0.7 6.715 Ha Nam 26.0 8.8 25.7 20.4 18.2 3772 9675 21792 1.0 7.116 Long An 24.6 5.6 29.2 27.5 20.5 5080 13561 20225 0.5 5.117 Vinh Phuc 22.1 6.4 25.8 24.9 17.4 3836 9771 22235 0.9 7.018 Tien Giang 24.9 5.9 26.9 25.3 18.9 4382 9890 18363 0.5 5.519 Bac Ninh 31.0 5.5 22.7 20.5 19.0 5870 6874 19909 0.8 7.020 Ca Mau 41.0 3.7 28.6 27.2 21.4 4747 10150 24739 0.6 6.921 Kien Giang 37.4 4.1 27.1 26.0 23.0 4206 10164 22158 0.5 5.522 Ha Tinh 30.5 8.4 29.1 23.0 23.2 3773 8982 22961 1.1 7.423 Phu Tho 34.0 7.0 26.3 24.7 16.1 3878 9878 22470 0.9 7.224 Can Tho 39.2 4.9 25.5 24.1 18.6 4391 13235 22059 0.5 6.225 Ha Tay 41.7 7.7 24.9 22.3 17.4 2701 8532 18226 0.8 6.726 Nghe An 30.7 6.5 31.5 29.0 22.5 3864 13856 22499 0.9 7.627 Ben Tre 40.8 6.2 26.0 26.4 17.1 3763 9764 19368 0.6 7.228 Tay Ninh 17.9 5.0 23.5 23.0 19.4 4997 13736 20768 0.6 4.429 Quang Nam 34.2 7.2 24.8 23.5 22.2 6121 14297 23029 1.0 6.230 Ninh Binh 26.3 7.5 26.5 22.7 16.8 4504 11362 22072 1.1 6.831 Lam Dong 23.8 3.7 24.3 23.0 25.3 6570 16365 31425 1.0 5.432 Thai Nguyen 30.9 4.8 28.1 25.9 17.2 4702 12198 25924 1.1 7.933 Thanh Hoa 41.7 7.0 29.9 25.4 21.3 3659 10054 21240 0.9 8.234 Binh Dinh 39.6 6.9 32.1 30.0 21.5 5209 11828 22233 0.9 7.535 Thua Thien-Hue 30.3 7.1 32.2 29.2 26.0 3360 13794 22389 0.8 5.836 Tra Vinh 37.0 4.9 27.0 26.1 21.9 3057 9514 21836 0.6 6.537 Soc Trang 37.8 4.7 24.6 23.3 23.6 4448 8953 20992 0.6 6.538 An Giang 32.2 5.3 26.8 25.4 20.6 6452 14461 19556 0.5 5.339 Bac Lieu 38.5 4.4 27.5 26.6 21.1 4555 9739 23707 0.8 5.940 Dong Thap 45.7 5.2 24.9 23.4 21.2 4711 9306 19928 0.7 6.041 Dac Lac 57.3 3.3 40.1 39.0 31.6 5685 13341 31622 0.8 6.942 Quang Ngai 53.2 7.3 31.1 28.2 20.9 4242 10171 21899 1.0 6.843 Quang Tri 50.6 6.6 36.4 28.0 26.3 4736 11185 26687 1.1 4.844 Quang Binh 45.5 5.8 33.5 29.2 24.6 3847 8115 23150 1.1 5.845 Binh Thuan 24.0 4.7 32.1 29.7 23.4 5967 10740 24778 1.0 6.446 Hoa Binh 57.6 4.7 30.0 28.0 22.8 4271 10761 27840 1.3 6.147 Binh Phuoc 23.7 2.9 29.5 28.1 29.1 6837 19490 25729 1.0 5.348 Bac Giang 30.0 5.3 27.5 20.9 21.1 6274 7347 21136 1.0 8.2
Health I
Infantmortalityrate (IMR)((%o 1999)
Peopleage over65 (% -1999)
Crudebirth (%o)
1993
Crudebirth (%o)
1995
Crudebirth (%o)
1998
Publichealth
expendi-ture 1991(VND/percapita)
Publichealth
expendi-ture 1993(VND/percapita)
Publichealth
expendi-ture 1998(VND/percapita)
Publichealth
expendi-ture as %of GDP
(% -1998)
Publichealth
expendi-ture as %of total
local gov-ernmentexpendi-
ture (% - 1998)HDI rank Province

101HUMAN DEVELOPMENT INDEX
49 Phu Yen 43.0 5.6 33.4 31.4 24.8 5356 11835 22201 0.8 6.750 Lang Son 65.1 5.2 31.5 29.0 19.8 5299 16398 30369 1.2 4.951 Tuyen Quang 31.6 4.5 30.8 27.8 22.1 5416 16398 30304 1.5 6.052 Ninh Thuan 30.8 4.4 33.3 32.0 25.5 5609 19644 24964 0.9 6.253 Yen Bai 41.7 4.7 32.5 31.7 21.8 5635 13535 30496 1.6 6.4
Low Human Development 61.8 37.4 34.6 30.7 5936 16389 37976 2.1 6.654 Bac Can 40.1 4.6 30.7 26.9 23.2 6416 16645 35645 2.8 5.555 Cao Bang 62.1 6.1 36.0 33.1 24.2 5054 16654 37931 2.0 6.356 Lao Cai 53.6 3.6 41.3 38.7 31.8 5429 17623 34908 1.8 6.057 Son La 53.3 4.4 37.0 32.4 28.7 5148 4005 36099 2.1 8.358 Gia Lai 73.5 4.0 37.0 35.6 33.8 5945 14203 33088 1.3 7.059 Kon Tum 82.6 3.4 31.1 36.2 36.3 5884 21932 47992 1.9 5.160 Ha Giang 65.8 3.8 37.4 32.4 29.4 5388 21057 39788 2.9 6.061 Lai Chau 64.5 3.7 43.0 39.5 37.3 7590 16589 40523 2.1 6.7
Red River Delta 25.2 7.4 23.4 20.4 17.0 5810 13015 23055 0.6 6.1North East 38.0 5.3 29.2 26.3 20.6 6074 12862 26867 1.1 6.2North West 57.7 4.3 36.0 32.7 28.8 5439 9595 34335 1.8 7.1North Central Coast 36.7 6.9 31.1 26.9 22.9 3775 11276 22390 0.9 7.1South Central Coast 39.0 6.6 28.8 26.9 21.3 6554 13308 23850 0.8 6.1Central Highlands 65.0 3.5 38.0 37.5 32.9 5798 14625 33913 1.0 6.6Southeastern 17.2 4.7 24.8 23.4 19.1 13386 26302 31345 0.4 5.4Mekong River Delta 35.3 5.1 26.6 25.4 20.4 4542 11027 20942 0.6 6.0All Viet Nam 33.1 5.8 27.5 25.1 20.6 6495 14336 25132 0.6 6.1
Health I
Infantmortalityrate (IMR)((%o 1999)
Peopleage over65 (% -1999)
Crudebirth (%o)
1993
Crudebirth (%o)
1995
Crudebirth (%o)
1998
Publichealth
expendi-ture 1991(VND/percapita)
Publichealth
expendi-ture 1993(VND/percapita)
Publichealth
expendi-ture 1998(VND/percapita)
Publichealth
expendi-ture as %of GDP
(% -1998)
Publichealth
expendi-ture as %
of totallocal gov-ernmentexpendi-
ture (% - 1998)HDI rank Province

102 NATIONAL HUMAN DEVELOPMENT REPORT 2001
High Human Development 91.6 95.3 136 122 34 44 50 64 601 Ba Ria-Vung Tau 91.2 100.0 115 127 15 33 38 40 392 Ha Noi 100.0 100.0 7 71 21 34 58 76 693 Tp. HCMinh 74.6 84.7 23 169 53 58 66 94 894 Da Nang 79.0 97.3 45 183 26 81 81 62 715 Hai Phong 98.8 100.0 82 83 33 58 56 79 836 Binh Duong 91.7 94.3 268 134 9 30 36 39 407 Dong Nai 98.9 100.0 240 142 20 26 27 44 358 Thai Binh 100.0 99.5 63 102 3 48 48 39 309 Hai Duong 97.1 100.0 73 103 10 30 33 45 3810 Khanh Hoa 98.7 98.1 935 127 58 33 34 41 4211 Quang Ninh 90.7 93.5 135 110 166 40 42 42 5912 Nam Dinh 99.4 96.4 236 89 2 42 41 65 53
Medium Human Development 93.9 96.9 506 109 9 28 31 41 4113 Vinh Long 86.3 96.8 93 145 11 23 25 30 2614 Hung Yen 99.4 100.0 503 83 3 26 28 26 2815 Ha Nam 100.0 98.7 335 111 2 29 32 87 7816 Long An 88.1 98.2 43 140 6 22 28 42 4017 Vinh Phuc 99.9 100.0 196 58 3 23 24 37 3018 Tien Giang 87.9 100.0 46 144 7 25 25 30 3719 Bac Ninh 98.5 99.1 140 90 20 32 39 36 4020 Ca Mau 98.9 95.5 2263 81 11 26 29 26 3221 Kien Giang 98.6 100.0 189 138 13 29 29 30 2822 Ha Tinh 99.7 99.5 703 97 1 25 26 39 4523 Phu Tho 98.8 96.6 684 117 2 34 35 42 4124 Can Tho 98.3 99.6 33 167 18 28 30 52 5125 Ha Tay 99.2 99.1 39 62 2 27 28 41 3426 Nghe An 93.8 94.4 479 74 8 25 26 68 6627 Ben Tre 80.2 91.2 96 104 5 25 24 43 3928 Tay Ninh 92.0 100.0 40 205 9 37 40 53 5029 Quang Nam 91.4 94.8 1759 113 2 35 37 52 5430 Ninh Binh 98.1 98.1 324 69 1 40 43 44 4031 Lam Dong 85.5 98.4 1007 45 20 43 45 48 4132 Thai Nguyen 88.1 91.1 235 98 12 44 46 30 4133 Thanh Hoa 95.6 95.4 397 88 1 24 29 25 2834 Binh Dinh 96.7 99.9 217 143 11 23 28 40 3935 Thua Thien-Hue 99.4 98.3 359 101 5 35 40 33 2736 Tra Vinh 81.3 90.2 240 125 8 16 22 32 3737 Soc Trang 100.0 98.9 305 156 3 19 20 36 3038 An Giang 87.1 95.6 17 189 36 28 31 39 3839 Bac Lieu 88.2 93.8 1350 103 8 23 30 22 2840 Dong Thap 82.3 100.0 38 189 11 26 29 27 3341 Dac Lac 98.0 93.7 1817 35 12 39 44 39 3542 Quang Ngai 88.6 96.0 454 97 1 21 24 47 4643 Quang Tri 95.6 98.2 1014 99 1 42 45 68 6844 Quang Binh 93.9 99.2 1392 115 1 19 19 42 3945 Binh Thuan 98.5 97.3 621 142 16 26 33 38 3646 Hoa Binh 99.3 96.0 718 65 4 28 38 55 7247 Binh Phuoc 94.3 100.0 2053 97 21 18 24 38 4348 Bac Giang 97.5 97.5 188 89 10 27 30 32 37
Health II
Under one-year-old
fully immu-nized (%)
1998 againstBCG
One-year-old fully
immunized(%) 1998againstmeasles
Malariacases (per
100 000 peo-ple) 1998
Tuberculosis cases (per100 000 peo-
ple) 1998
HIV cases(per100 000
people)1998a
Doctors (per 100 000people) 1995
Doctors(per 100 000people) 1998
Nurses(per 100 000people) 1995
Nurses(per 100 000people) 1998HDI rank Province
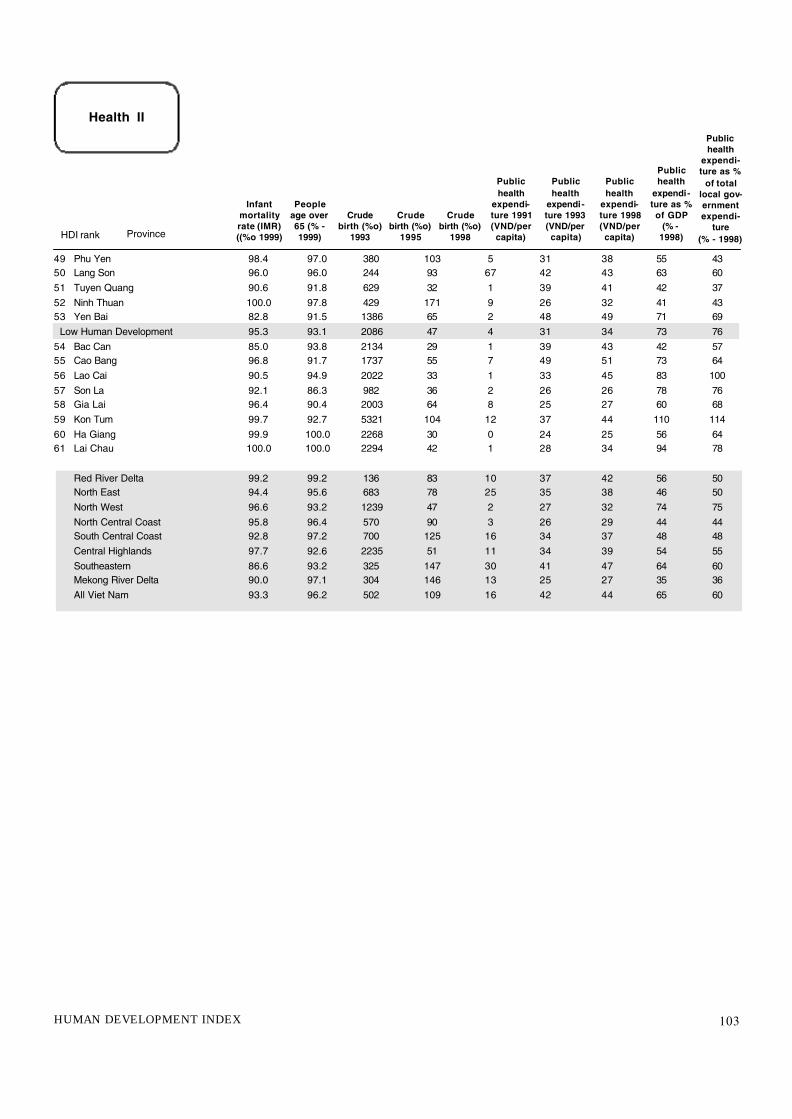
103HUMAN DEVELOPMENT INDEX
49 Phu Yen 98.4 97.0 380 103 5 31 38 55 4350 Lang Son 96.0 96.0 244 93 67 42 43 63 6051 Tuyen Quang 90.6 91.8 629 32 1 39 41 42 3752 Ninh Thuan 100.0 97.8 429 171 9 26 32 41 4353 Yen Bai 82.8 91.5 1386 65 2 48 49 71 69
Low Human Development 95.3 93.1 2086 47 4 31 34 73 7654 Bac Can 85.0 93.8 2134 29 1 39 43 42 5755 Cao Bang 96.8 91.7 1737 55 7 49 51 73 6456 Lao Cai 90.5 94.9 2022 33 1 33 45 83 10057 Son La 92.1 86.3 982 36 2 26 26 78 7658 Gia Lai 96.4 90.4 2003 64 8 25 27 60 6859 Kon Tum 99.7 92.7 5321 104 12 37 44 110 11460 Ha Giang 99.9 100.0 2268 30 0 24 25 56 6461 Lai Chau 100.0 100.0 2294 42 1 28 34 94 78
Red River Delta 99.2 99.2 136 83 10 37 42 56 50North East 94.4 95.6 683 78 25 35 38 46 50North West 96.6 93.2 1239 47 2 27 32 74 75North Central Coast 95.8 96.4 570 90 3 26 29 44 44South Central Coast 92.8 97.2 700 125 16 34 37 48 48Central Highlands 97.7 92.6 2235 51 11 34 39 54 55Southeastern 86.6 93.2 325 147 30 41 47 64 60Mekong River Delta 90.0 97.1 304 146 13 25 27 35 36All Viet Nam 93.3 96.2 502 109 16 42 44 65 60
Health II
Infantmortalityrate (IMR)((%o 1999)
Peopleage over65 (% -1999)
Crudebirth (%o)
1993
Crudebirth (%o)
1995
Crudebirth (%o)
1998
Publichealth
expendi-ture 1991(VND/percapita)
Publichealth
expendi-ture 1993(VND/percapita)
Publichealth
expendi-ture 1998(VND/percapita)
Publichealth
expendi-ture as %of GDP
(% -1998)
Publichealth
expendi-ture as %
of totallocal gov-ernmentexpendi-
ture (% - 1998)HDI rank Province

104 NATIONAL HUMAN DEVELOPMENT REPORT 2001
High Human Development 94.2 92.3 61.3 40.5 2851 6.0 177 5.0 2351 Ba Ria-Vung Tau 92.6 90.1 48.2 28.7 1310 1.47 151 1.39 2202 Ha Noi 96.9 95.1 72.6 60.9 8965 12.12 385 8.32 4033 Tp. HCMinh 94.0 91.7 56.6 41.1 3531 11.87 181 10.09 2334 Da Nang 94.7 93.1 67.2 50.5 3566 4.77 522 1.99 3455 Hai Phong 95.4 94.1 69.1 45.1 2286 2.89 124 3.50 2406 Binh Duong 92.4 91.9 50.5 28.1 1174 1.23 141 1.38 2447 Dong Nai 92.5 88.9 46.9 28.9 961 2.80 107 3.50 2028 Thai Binh 94.6 93.5 71.3 38.9 892 2.47 97 2.99 1899 Hai Duong 94.8 93.7 68.7 39.2 828 2.92 123 2.18 148
10 Khanh Hoa 91.4 89.1 51.3 31.3 1664 1.74 128 1.87 21811 Quang Ninh 92.8 89.2 55.0 38.3 1800 1.22 94 1.41 17312 Nam Dinh 94.3 93.6 67.0 32.6 732 3.30 124 2.54 154Medium Human Development 90.3 89.6 44.7 23.9 667 1.5 70 1.7 12813 Vinh Long 90.1 89.9 44.0 23.2 556 1.04 68 1.06 11014 Hung Yen 93.5 95.2 61.0 32.3 638 0.00 0 1.35 14315 Ha Nam 93.4 93.5 71.0 37.3 896 0.00 0 0.97 13716 Long An 90.9 88.6 41.4 19.3 488 1.31 73 1.27 11317 Vinh Phuc 94.0 92.8 59.0 33.7 670 0.00 0 1.19 12718 Tien Giang 90.8 89.5 44.1 21.3 439 1.80 76 1.67 11219 Bac Ninh 94.0 93.5 64.5 36.4 641 2.57 200 1.38 17220 Ca Mau 92.9 78.9 21.2 8.0 386 0.00 0 0.56 6021 Kien Giang 88.4 82.3 27.0 12.0 391 0.91 46 0.97 7822 Ha Tinh 94.1 90.0 47.1 29.7 653 1.23 66 1.55 13423 Phu Tho 95.0 92.3 56.4 36.7 1161 2.55 145 1.70 15324 Can Tho 87.9 84.9 30.7 13.7 884 1.48 57 1.50 9125 Ha Tay 92.2 94.7 62.8 39.3 709 3.59 111 3.32 16326 Nghe An 92.8 91.2 48.1 27.7 797 3.06 78 3.16 12827 Ben Tre 89.7 89.7 39.7 20.7 449 1.33 70 1.32 10928 Tay Ninh 90.1 89.1 39.0 21.3 728 1.08 84 1.09 13729 Quang Nam 90.1 90.4 58.2 32.3 507 0.00 0 2.48 20730 Ninh Binh 93.4 93.2 61.1 32.2 850 1.08 87 1.15 14831 Lam Dong 91.1 89.2 44.0 25.6 1028 1.67 148 2.30 31032 Thai Nguyen 95.4 93.7 53.8 27.6 1642 1.22 89 1.32 15233 Thanh Hoa 91.2 93.9 48.6 25.1 710 3.86 79 3.61 11834 Binh Dinh 92.2 90.8 51.0 23.0 586 2.25 111 2.34 18335 Thua Thien-Hue 85.6 85.9 47.2 29.1 1540 1.99 139 1.60 17736 Tra Vinh 82.5 86.3 30.2 12.2 322 0.40 29 0.58 6737 Soc Trang 86.7 81.1 23.4 10.4 205 0.49 29 0.51 4738 An Giang 85.4 78.7 26.7 13.3 552 1.12 40 1.18 6639 Bac Lieu 86.0 81.9 24.7 10.8 456 1.10 104 0.53 7840 Dong Thap 85.7 82.6 30.3 13.4 363 1.36 64 1.25 9241 Dac Lac 92.2 90.8 41.7 22.5 563 1.67 94 1.92 16142 Quang Ngai 86.2 86.9 47.7 28.2 555 2.11 125 1.93 18143 Quang Tri 86.5 87.8 54.3 36.2 944 0.67 87 0.96 19944 Quang Binh 92.7 88.0 43.8 23.8 731 0.82 74 0.94 13645 Binh Thuan 89.7 145.5 59.5 31.1 414 1.02 80 1.06 13046 Hoa Binh 92.0 92.6 46.4 26.5 793 0.84 80 0.69 10547 Binh Phuoc 88.2 50.6 22.3 8.1 332 0.00 0 0.72 15148 Bac Giang 93.5 93.3 51.7 22.8 608 0.00 0 1.45 114
Education I
Adult litera-cy rate (% -
1999)
Net primaryenrolmentrate (% -
1999)
Net sec-ondary
enrolmentrate (% -
1999)
Net highschool
enrolmentrate (% -
1999)
people hav-ing a univer-sity gradu-
ate andpostgradu-ate (per100000 people)
1999
Tertiaryenrolmentrate (as %
total students- 1995)
Tertiaryenrolment
(as % of totaltertiary) (per
100 000 peo-ple) 1995
Tertiaryenrolmentrate (as %
total students- 1998)
Tertiaryenrolment
(as % of totaltertiary) (per100 000 peo-
ple) 1998HDI rank Province

105HUMAN DEVELOPMENT INDEX
49 Phu Yen 89.8 89.7 48.8 27.7 572 1.14 108 1.14 17150 Lang Son 89.4 90.9 32.2 16.3 826 0.32 32 0.39 6151 Tuyen Quang 87.2 90.1 40.7 19.4 584 0.36 39 0.44 7652 Ninh Thuan 81.2 77.7 34.4 19.6 605 0.58 88 0.58 13853 Yen Bai 84.8 85.0 42.3 27.3 941 0.47 50 0.50 83
Low Human Development 68.9 73.5 24.8 13.7 646 0.4 44 0.5 8354 Bac Can 85.5 86.6 38.1 21.9 867 0.00 0 0.17 6155 Cao Bang 76.6 82.4 27.4 17.9 956 0.19 25 0.20 4056 Lao Cai 69.3 73.7 26.9 17.5 770 0.20 25 0.50 9957 Son La 69.5 70.6 19.6 11.4 505 0.39 33 0.35 4758 Gia Lai 69.3 74.2 27.7 13.7 722 1.08 97 1.06 14259 Kon Tum 73.2 75.9 28.5 15.4 693 0.49 132 0.35 14860 Ha Giang 68.1 78.3 21.2 10.1 519 0.09 12 0.27 5561 Lai Chau 51.3 56.5 18.7 8.7 353 0.28 37 0.31 65
Red River Delta 94.5 94.1 67.4 41.3 2430 28.37 141 26.32 207North East 89.3 89.1 47.4 27.3 951 9.19 62 10.90 116North West 73.3 73.6 28.4 15.9 563 1.51 51 1.35 72North Central Coast 91.3 91.0 48.1 27.3 830 11.62 83 11.82 135South Central Coast 90.6 89.8 53.2 30.5 1045 12.01 134 11.76 208Central Highlands 83.0 84.3 35.9 18.9 627 3.24 99 3.33 153Southeastern 92.1 89.0 47.2 30.3 1910 21.72 135 22.12 210Mekong River Delta 88.1 84.1 31.7 14.9 477 12.34 54 12.40 86All Viet Nam 90.3 88.5 46.9 27.3 1265 100.00 97 100.00 153
Education I
Adult litera-cy rate (% -
1999)
Net primaryenrolmentrate (% -
1999)
Net sec-ondary
enrolmentrate (% -
1999)
Net highschool
enrolmentrate (% -
1999)
people hav-ing a univer-sity gradu-
ate andpostgradu-ate (per100000 people)
1999
Tertiaryenrolmentrate (as %
total students- 1995)
Tertiaryenrolment
(as % of totaltertiary) (per100 000 peo-
ple) 1995
Tertiaryenrolmentrate (as %
total students- 1998)
Tertiaryenrolment
(as % of totaltertiary) (per100 000 peo-
ple) 1998HDI rank Province

106 NATIONAL HUMAN DEVELOPMENT REPORT 2001
High Human Development 12486 34502 125685 1.6 22.91 Ba Ria-Vung Tau 6533 30437 160988 0.8 19.22 Ha Noi 15977 49275 197120 2.1 22.33 Tp. HCMinh 17204 46622 139121 1.1 20.24 Da Nang 10858 33103 125332 2.3 20.65 Hai Phong 9687 31120 107557 2.2 26.76 Binh Duong 11518 31512 136921 2.1 23.27 Dong Nai 12748 28888 118531 2.2 29.38 Thai Binh 9658 24236 89057 3.0 38.99 Hai Duong 8346 22324 80174 2.4 33.3
10 Khanh Hoa 14935 31530 123943 2.8 22.411 Quang Ninh 13415 34290 121910 2.8 18.512 Nam Dinh 7209 20914 70618 2.8 32.4
Medium Human Development 9394 25592 98436 3.5 27.213 Vinh Long 7403 24266 77695 2.2 20.914 Hung Yen 8347 22325 79686 2.8 27.415 Ha Nam 7210 20913 74777 3.3 24.416 Long An 11712 30408 91872 2.2 23.217 Vinh Phuc 10982 31711 96590 3.7 30.418 Tien Giang 10900 23967 89228 2.5 26.919 Bac Ninh 8551 25992 86273 3.4 30.120 Ca Mau 7862 19909 96768 2.3 27.021 Kien Giang 10173 24232 107717 2.4 26.822 Ha Tinh 9386 25104 90436 4.3 29.123 Phu Tho 7850 22668 101791 4.2 32.424 Can Tho 6990 20555 76091 1.8 21.525 Ha Tay 6819 25446 83682 3.6 30.826 Nghe An 9614 24341 95637 4.0 32.327 Ben Tre 7505 26395 87180 2.5 32.428 Tay Ninh 9782 26738 106956 2.8 22.629 Quang Nam 10859 33103 112571 4.7 30.130 Ninh Binh 9138 25155 97831 4.7 30.331 Lam Dong 13349 32512 133785 4.2 22.832 Thai Nguyen 10033 33511 130882 5.5 39.733 Thanh Hoa 9828 26928 98597 4.2 38.234 Binh Dinh 8958 24196 91363 3.6 30.835 Thua Thien-Hue 10000 25186 98648 3.5 25.736 Tra Vinh 6511 19686 72221 2.0 21.537 Soc Trang 7080 20114 79128 2.2 24.438 An Giang 8843 20634 88355 2.1 24.139 Bac Lieu 7863 19909 89095 2.9 22.440 Dong Thap 15052 23466 88609 3.0 26.641 Dac Lac 12199 32983 147879 3.7 32.542 Quang Ngai 8593 22050 87466 4.1 27.243 Quang Tri 9654 27514 108006 4.4 19.544 Quang Binh 9302 24777 113739 5.4 28.545 Binh Thuan 9216 25969 92918 3.6 24.046 Hoa Binh 9197 39973 154559 7.4 33.847 Binh Phuoc 11520 31511 92916 3.7 19.348 Bac Giang 8551 25992 87523 4.2 34.0
Education II
Public Educationexpenditure per capi-
ta (VND - 1991)
Public Educationexpenditure per capi-
ta (VND- 1993)
Public Educationexpenditure per capi -
ta (VND- 1998)
Public educationexpenditure as % of
GDP (% - 1998)a
Public educationexpenditure as % oftotal local govern-
ment expenditure (%- 1998)bHDI rank Province

107HUMAN DEVELOPMENT INDEX
49 Phu Yen 11120 25659 91676 3.4 27.750 Lang Son 10255 36364 134161 5.3 21.751 Tuyen Quang 11189 16398 160290 7.8 31.852 Ninh Thuan 8674 23218 94161 3.4 23.653 Yen Bai 10915 34254 134127 7.1 28.2
Low Human Development 9394 25592 98436 3.5 27.254 Bac Can 10031 33511 135373 10.6 21.055 Cao Bang 9170 30397 121394 6.4 20.356 Lao Cai 10519 31068 132990 6.9 22.757 Son La 11302 57405 136324 8.0 31.458 Gia Lai 10780 35360 130659 5.0 27.759 Kon Tum 10672 38657 188376 7.5 19.960 Ha Giang 11129 34456 146010 10.5 22.061 Lai Chau 13431 33604 127720 6.6 21.1
Red River Delta 9449 28199 103502 2.6 27.5North East 10005 29332 116322 4.9 26.7North West 11070 45166 140516 7.4 28.9North Central Coast 9675 25640 98402 4.1 31.1South Central Coast 10647 27885 103595 3.4 26.4Central Highlands 11529 34451 146395 4.3 28.5Southeastern 13384 35981 126623 1.5 21.9Mekong River Delta 9178 22870 87129 2.3 24.8All Viet Nam 10311 28679 107263 2.6 26.0
Education II
Public Educationexpenditure per capi-
ta (VND - 1991)
Public Educationexpenditure per capi-
ta (VND- 1993)
Public Educationexpenditure per capi -
ta (VND- 1998)
Public educationexpenditure as % of
GDP (% - 1998)a
Public educationexpenditure as % oftotal local govern-
ment expenditure (%- 1998)bHDI rank Province
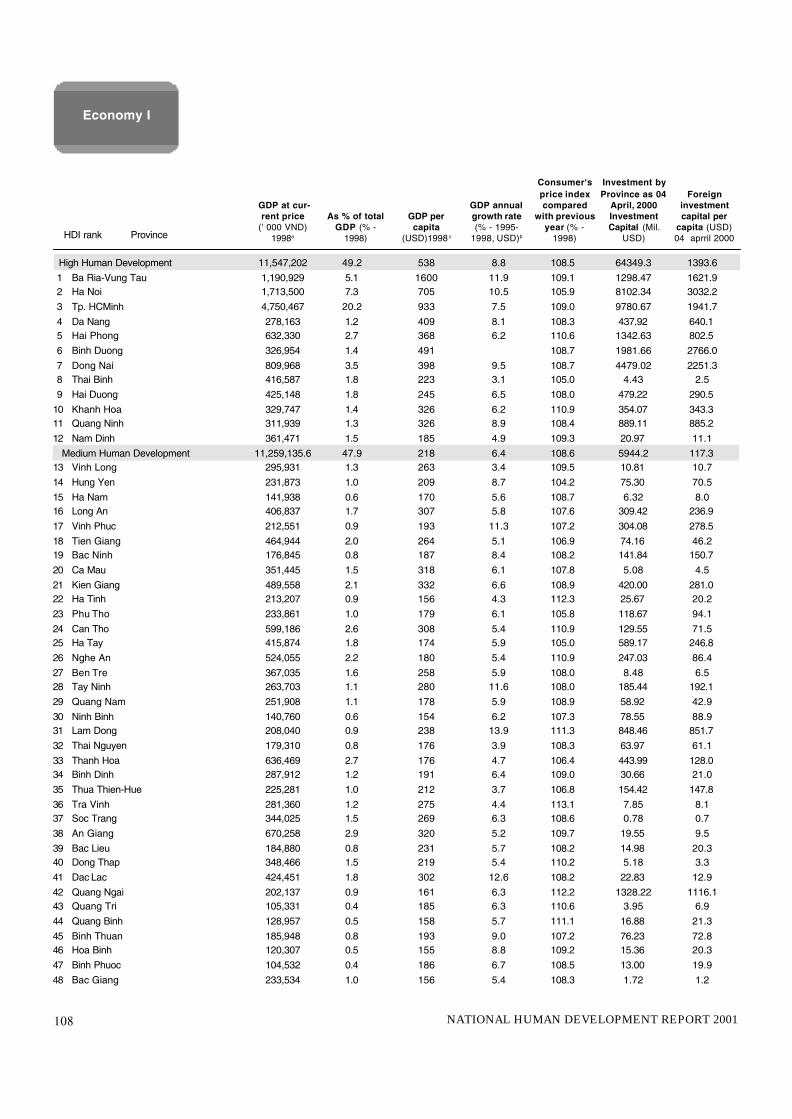
108 NATIONAL HUMAN DEVELOPMENT REPORT 2001
High Human Development 11,547,202 49.2 538 8.8 108.5 64349.3 1393.61 Ba Ria-Vung Tau 1,190,929 5.1 1600 11.9 109.1 1298.47 1621.92 Ha Noi 1,713,500 7.3 705 10.5 105.9 8102.34 3032.23 Tp. HCMinh 4,750,467 20.2 933 7.5 109.0 9780.67 1941.74 Da Nang 278,163 1.2 409 8.1 108.3 437.92 640.15 Hai Phong 632,330 2.7 368 6.2 110.6 1342.63 802.56 Binh Duong 326,954 1.4 491 108.7 1981.66 2766.07 Dong Nai 809,968 3.5 398 9.5 108.7 4479.02 2251.38 Thai Binh 416,587 1.8 223 3.1 105.0 4.43 2.59 Hai Duong 425,148 1.8 245 6.5 108.0 479.22 290.5
10 Khanh Hoa 329,747 1.4 326 6.2 110.9 354.07 343.311 Quang Ninh 311,939 1.3 326 8.9 108.4 889.11 885.212 Nam Dinh 361,471 1.5 185 4.9 109.3 20.97 11.1
Medium Human Development 11,259,135.6 47.9 218 6.4 108.6 5944.2 117.313 Vinh Long 295,931 1.3 263 3.4 109.5 10.81 10.714 Hung Yen 231,873 1.0 209 8.7 104.2 75.30 70.515 Ha Nam 141,938 0.6 170 5.6 108.7 6.32 8.016 Long An 406,837 1.7 307 5.8 107.6 309.42 236.917 Vinh Phuc 212,551 0.9 193 11.3 107.2 304.08 278.518 Tien Giang 464,944 2.0 264 5.1 106.9 74.16 46.219 Bac Ninh 176,845 0.8 187 8.4 108.2 141.84 150.720 Ca Mau 351,445 1.5 318 6.1 107.8 5.08 4.521 Kien Giang 489,558 2.1 332 6.6 108.9 420.00 281.022 Ha Tinh 213,207 0.9 156 4.3 112.3 25.67 20.223 Phu Tho 233,861 1.0 179 6.1 105.8 118.67 94.124 Can Tho 599,186 2.6 308 5.4 110.9 129.55 71.525 Ha Tay 415,874 1.8 174 5.9 105.0 589.17 246.826 Nghe An 524,055 2.2 180 5.4 110.9 247.03 86.427 Ben Tre 367,035 1.6 258 5.9 108.0 8.48 6.528 Tay Ninh 263,703 1.1 280 11.6 108.0 185.44 192.129 Quang Nam 251,908 1.1 178 5.9 108.9 58.92 42.930 Ninh Binh 140,760 0.6 154 6.2 107.3 78.55 88.931 Lam Dong 208,040 0.9 238 13.9 111.3 848.46 851.732 Thai Nguyen 179,310 0.8 176 3.9 108.3 63.97 61.133 Thanh Hoa 636,469 2.7 176 4.7 106.4 443.99 128.034 Binh Dinh 287,912 1.2 191 6.4 109.0 30.66 21.035 Thua Thien-Hue 225,281 1.0 212 3.7 106.8 154.42 147.836 Tra Vinh 281,360 1.2 275 4.4 113.1 7.85 8.137 Soc Trang 344,025 1.5 269 6.3 108.6 0.78 0.738 An Giang 670,258 2.9 320 5.2 109.7 19.55 9.539 Bac Lieu 184,880 0.8 231 5.7 108.2 14.98 20.340 Dong Thap 348,466 1.5 219 5.4 110.2 5.18 3.341 Dac Lac 424,451 1.8 302 12.6 108.2 22.83 12.942 Quang Ngai 202,137 0.9 161 6.3 112.2 1328.22 1116.143 Quang Tri 105,331 0.4 185 6.3 110.6 3.95 6.944 Quang Binh 128,957 0.5 158 5.7 111.1 16.88 21.345 Binh Thuan 185,948 0.8 193 9.0 107.2 76.23 72.846 Hoa Binh 120,307 0.5 155 8.8 109.2 15.36 20.347 Binh Phuoc 104,532 0.4 186 6.7 108.5 13.00 19.948 Bac Giang 233,534 1.0 156 5.4 108.3 1.72 1.2
Economy I
GDP at cur-rent price
(' 000 VND)1998a
As % of totalGDP (% -
1998)
GDP per capita
(USD)1998 c
GDP annualgrowth rate(% - 1995-
1998, USD)b
Consumer'sprice indexcompared
with previousyear (% -
1998)
Investment byProvince as 04
April, 2000InvestmentCapital (Mil.
USD)
Foreigninvestmentcapital per
capita (USD)04 aprril 2000HDI rank Province

109HUMAN DEVELOPMENT INDEX
49 Phu Yen 158,420 0.7 202 7.2 112.1 16.12 20.550 Lang Son 139,122 0.6 187 6.8 104.6 9.36 13.351 Tuyen Quang 106,368 0.5 154 5.9 111.9 12.20 18.152 Ninh Thuan 103,066 0.4 209 4.7 107.2 41.53 82.253 Yen Bai 99,455 0.4 142 6.1 107.4 8.46 12.4
Low Human Development 671,433 2.9 144 7.0 109.6 64.1 13.654 Bac Can 30,379 0.1 95 3.0 104.9 0.00 0.055 Cao Bang 80,276 0.3 141 6.3 103.2 0.00 0.056 Lao Cai 86,186 0.4 144 2.9 105.5 14.70 24.757 Son La 110,275 0.5 127 9.3 109.3 19.57 22.258 Gia Lai 170,380 0.7 194 10.1 110.3 27.85 28.759 Kon Tum 52,453 0.2 187 9.0 113.0 0.00 0.060 Ha Giang 59,613 0.3 103 8.2 108.8 0.50 0.861 Lai Chau 81,871 0.3 145 3.8 119.0 1.50 2.5
Red River Delta 4,479,479 19.1 299.58 6.94 ... 10698.93 722.9North East 1,949,439 8.3 176.82 6.7 ... 1564.61 144.1North West 312,453 1.3 141.43 7.5 ... 36.43 16.4North Central Coast 1,833,299 7.8 177.26 4.9 ... 891.94 89.1South Central Coast 1,508,286 6.4 226.68 6.6 ... 2225.91 341.1Central Highlands 647,284 2.8 252.39 11.5 ... 50.68 16.5Southeastern 7,943,606 33.8 642.15 9.9 ... 18704.48 1471.5Mekong River Delta 4,803,924 20.5 283.48 5.5 ... 1005.84 62.3All Viet Nam 23,477,771 100.0 304.69 7.6 109.2 35178.82 460.9
Economy I
GDP at cur-rent price
(' 000 VND)1998a
As % of totalGDP (% -
1998)
GDP per capita
(USD)1998c
GDP annualgrowth rate(% - 1995-
1998, USD) b
Consumer'sprice indexcompared
with previousyear (% -
1998)
Investment byProvince as 04
April, 2000InvestmentCapital (Mil.
USD)
Foreigninvestmentcapital per
capita (USD)04 aprril 2000HDI rank Province

110 NATIONAL HUMAN DEVELOPMENT REPORT 2001
High Human Development 8.8 12.8 39.6 47.6 10.5 46.7 42.9 33.6 20.4 34.6 7.2 27.41 Ba Ria-Vung Tau 11.9 4.2 77.2 18.6 3.4 84.6 12.1 12.9 9.1 69.0 3.9 65.1
2 Ha Noi 10.5 5.3 30.8 63.8 4.0 35.2 60.8 58.5 27.0 45.8 9.4 36.43 Ho Chi Minh City 7.5 3.0 34.8 62.2 2.2 39.9 58.0 37.6 24.7 35.9 5.5 30.44 Da Nang 8.1 11.2 33.0 55.8 8.7 39.4 51.9 21.8 16.9 37.1 11.1 26.05 Hai Phong 6.2 18.0 28.7 53.2 16.4 35.5 48.1 45.3 31.6 25.3 8.2 17.16 Binh Duong (*) 13.7 26.7 44.8 28.5 20.1 55.3 24.5 8.3 8.1 18.4 9.0 9.47 Dong Nai 9.5 33.3 39.0 27.7 24.1 51.7 24.2 34.2 12.1 16.6 7.6 9.08 Thai Binh 3.1 63.9 12.8 23.3 59.6 11.8 28.6 3.9 3.9 7.1 7.6 -0.59 Hai Duong 6.5 37.9 37.9 241.9 33.4 37.7 28.8 27.1 23.6 11.9 7.3 4.610 Khanh Hoa 6.2 29.6 31.4 39.0 29.4 33.7 36.9 31.1 12.7 18.5 12.7 5.811 Quang Ninh 8.9 11.4 38.4 50.2 9.7 46.3 44.0 8.5 8.5 46.4 15.1 31.312 Nam Dinh 4.9 44.6 19.8 35.6 42.3 21.1 36.6 12.2 12.2 3.9 8.8 -4.9
Medium Human Development 6.4 55.7 16.2 28.1 50.8 19.3 29.9 18.8 15.9 8.1 12.0 -3.913 Vinh Long 3.4 61.1 11.3 27.6 56.0 12.6 31.4 25.7 25.5 9.7 10.5 -0.814 Hung Yen 8.7 65.1 11.4 23.4 51.5 23.5 25.0 24.2 20.3 5.2 10.4 -5.215 Ha Nam 5.6 51.8 16.5 31.7 45.0 25.7 29.3 38.3 38.3 5.2 13.5 -8.316 Long An 5.8 55.4 15.6 29.0 51.7 20.2 28.1 17.7 12.4 9.7 9.6 0.117 Vinh Phuc 11.3 53.9 12.5 33.6 36.5 29.7 33.8 13.8 11.0 5.5 12.3 -6.818 Tien Giang 5.1 63.5 11.8 24.7 53.5 12.8 33.8 23.6 23.0 9.9 9.4 0.519 Bac Ninh 8.4 47.3 24.2 28.5 40.6 31.4 28.0 55.3 27.4 7.4 11.4 -4.020 Ca Mau 6.1 64.6 19.7 15.6 57.9 21.3 20.8 6.0 6.0 5.2 8.4 -3.221 Kien Giang 6.6 60.8 20.6 18.6 54.2 23.9 22.0 29.6 20.3 11.1 9.0 2.122 Ha Tinh 4.3 56.6 10.1 33.3 50.2 12.4 37.4 10.2 8.5 13.4 14.9 -1.523 Phu Tho 6.1 35.9 30.9 33.3 30.1 36.8 33.1 22.1 21.7 8.6 13.1 -4.524 Can Tho 5.4 47.4 19.4 33.1 39.9 25.8 34.3 22.9 22.9 9.2 8.6 0.625 Ha Tay 5.9 49.0 25.5 25.5 43.7 28.9 27.4 4.4 4.4 6.9 11.6 -4.726 Nghe An 5.4 48.5 14.5 37.0 43.9 17.1 38.9 12.6 10.0 7.8 12.3 -4.527 Ben Tre 5.9 65.2 13.2 21.7 66.6 13.1 20.3 14.4 14.4 5.8 7.8 -2.028 Tay Ninh 11.6 51.5 16.6 31.9 47.5 20.7 31.8 20.2 5.9 11.4 12.6 -1.229 Quang Nam 5.9 53.4 16.0 30.6 44.0 21.2 34.8 12.0 10.7 5.9 15.7 -9.830 Ninh Binh 6.2 54.0 19.0 27.0 51.4 22.0 26.6 9.3 9.3 5.4 15.7 -10.331 Lam Dong 13.9 57.7 16.0 26.3 67.9 13.1 19.0 19.6 18.4 12.8 18.4 -5.632 Thai Nguyen 3.9 38.5 33.3 28.2 39.2 31.9 28.9 17.9 17.9 7.8 14.0 -6.233 Thanh Hoa 4.7 45.1 21.9 33.0 40.7 24.9 34.4 38.5 23.2 6.6 10.9 -4.334 Binh Dinh 6.4 51.6 14.8 33.6 49.6 17.3 33.1 10.8 10.4 7.4 11.6 -4.235 Thua Thien-Hue 3.7 30.5 25.7 43.8 21.2 30.0 48.8 29.2 17.8 13.1 13.5 -0.436 Tra Vinh 4.4 75.7 7.2 17.0 72.4 6.7 20.9 4.9 4.9 4.5 9.1 -4.637 Soc Trang 6.3 70.1 11.8 18.0 64.2 15.7 20.1 18.8 18.8 5.3 9.0 -3.738 An Giang 5.2 53.2 11.5 35.3 44.1 13.8 42.1 6.5 6.5 7.0 8.6 -1.639 Bac Lieu 5.7 65.0 16.7 18.2 59.3 19.9 20.8 17.5 17.5 6.4 12.9 -6.540 Dong Thap 5.4 75.0 7.5 17.5 68.2 9.9 21.9 6.4 6.4 9.8 11.3 -1.541 Dac Lac 12.6 72.7 9.0 18.3 76.2 8.1 15.7 14.7 14.7 6.8 11.3 -4.542 Quang Ngai 6.3 51.2 15.4 33.4 45.6 19.6 34.8 36.3 36.3 6.6 14.9 -8.343 Quang Tri 6.3 44.8 10.0 45.2 45.3 12.8 41.9 18.0 16.8 31.7 22.4 9.344 Quang Binh 5.7 41.0 18.6 40.3 35.9 24.5 39.6 42.6 42.6 7.0 18.8 -11.845 Binh Thuan 9.0 51.5 19.8 28.7 47.2 21.4 31.4 12.0 12.0 10.2 15.0 -4.846 Hoa Binh 8.8 60.3 6.4 33.3 50.9 16.8 32.3 25.5 25.5 6.6 22.0 -15.447 Binh Phuoc 6.7 74.9 3.4 21.7 66.8 8.5 24.7 8.3 8.3 9.8 19.3 -9.548 Bac Giang 5.4 53.5 17.3 29.2 54.5 12.9 32.6 5.2 5.2 3.9 12.3 -8.4
Economy II
GDPannualgrowth
rate (% -1995-1999)a
Agriculture (as %of GDP)
1995
Industry(as % of
GDP)1995
Services(as % of
GDP)1995
Agriculture (as %of GDP)1998pre.
Industry(as % of
GDP)1998pre.
Services(as % ofGDP)199
8pre.
TotalInvestment (as %of GDP)(1998)
Domesticinvest-
ment (as% ofGDP)(1998)
Budgetrevenues
(% ofGDP-1998)
Government bud-
getexpendi-ture inlocal
areas (as% ofGDP)(1998)
Budgetsurplus /deficit in
localareas (as
% ofGDP)(1998)HDI rank Province

111HUMAN DEVELOPMENT INDEX
49 Phu Yen 7.2 46.9 14.0 39.1 39.6 23.0 37.5 45.9 45.1 7.3 12.2 -4.950 Lang Son 6.8 62.2 8.0 29.8 53.9 11.6 34.4 21.6 21.5 8.3 24.6 -16.351 Tuyen Quang 5.9 55.9 15.8 28.2 53.7 17.3 29.0 25.7 25.7 15.4 24.3 -8.952 Ninh Thuan 4.7 55.6 12.0 32.4 54.4 13.8 31.8 15.8 15.8 7.0 14.3 -7.353 Yen Bai 6.1 51.7 26.4 21.9 46.3 26.5 27.2 14.2 14.2 6.2 25.0 -18.8
Low Human Development 7.0 59.8 13.9 26.3 56.1 15.8 28.1 40.0 40.0 7.6 29.8 -22.254 Bac Can 3.0 74.9 5.5 19.6 64.5 8.8 26.7 41.1 41.1 2.8 50.6 -47.855 Cao Bang 6.3 67.9 6.8 25.3 58.1 13.0 28.9 14.2 14.2 5.7 31.7 -26.056 Lao Cai 2.9 50.8 22.1 27.1 49.6 17.9 32.6 23.0 23.0 7.7 30.4 -22.757 Son La 9.3 73.0 9.7 17.3 63.6 10.1 26.2 11.3 11.3 6.4 25.5 -19.158 Gia Lai 10.1 54.2 18.5 27.3 55.9 21.2 22.9 87.9 87.9 11.0 18.2 -7.259 Kon Tum 9.0 56.1 9.6 34.3 57.4 11.3 31.3 21.9 21.9 14.0 37.8 -23.860 Ha Giang 8.2 69.3 14.6 16.2 56.5 18.6 24.9 33.2 33.2 5.5 47.9 -42.461 Lai Chau 3.8 48.6 14.1 37.3 46.4 17.8 35.8 38.0 38.0 3.3 31.2 -27.9
Red River Delta 6.9 30.8 25.9 43.5 26.2 30.2 43.6 35.8 21.3 24.4 9.4 15.0North East 6.7 50.9 20.1 29.0 45.2 23.5 31.2 19.7 16.8 13.4 18.4 -5.0North West 7.5 60.3 9.9 29.8 53.8 14.9 31.3 23.8 23.8 5.7 25.6 -19.9North Central Coast 4.9 41.1 20.6 38.1 36.2 24.5 39.1 25.8 18.1 10.0 13.3 -3.3South Central Coast 6.6 37.7 22.8 39.5 33.7 27.5 38.9 24.6 19.3 14.9 12.9 2.0Central Highlands 11.5 66.2 11.5 22.3 69.4 11.6 19.0 34.6 34.6 8.5 15.2 -6.7Southeastern 9.9 11.7 42.9 45.3 10.7 50.4 39.2 30.0 19.0 35.4 6.7 28.7Mekong River Delta 5.5 61.5 14.3 24.2 55.3 17.0 27.6 16.5 15.0 8.1 9.3 -1.2All Viet Nam 7.6 34.8 27.6 37.6 30.2 33.3 36.5 26.9 18.9 21.5 10.1 11.4
Note:(*) Data for Binh Duong is of 1996
Economy II
GDPannualgrowth
rate (% -1995-1999)a
Agriculture (as %of GDP)
1995
Industry(as % of
GDP)1995
Services(as % of
GDP)1995
Agriculture (as %of GDP)1998pre.
Industry(as % of
GDP)1998pre.
Services(as % ofGDP)199
8pre.
TotalInvestment (as %of GDP)(1998)
Domesticinvest-
ment (as% ofGDP)(1998)
Budgetrevenues
(% ofGDP-1998)
Government bud-
getexpendi-ture inlocal
areas (as% ofGDP)(1998)
Budgetsurplus /deficit in
localareas (as
% ofGDP)(1998)HDI rank Province

112 NATIONAL HUMAN DEVELOPMENT REPORT 2001
High Human Development 10.5 3.1 66.0 61.5 54.9 52.6 41.73 45.58 261 2651 Ba Ria-Vung Tau 3.4 3.5 68.2 64.1 32.6 30.2 26.83 31.20 182 2032 Ha Noi 4.0 3.6 32.7 29.1 25.2 22.3 31.57 37.01 96 993 Ho Chi Minh City 2.2 2.9 17.5 14.8 17.2 14.5 29.91 30.69 52 454 Da Nang 8.7 2.8 29.5 22.8 20.7 18.1 40.15 41.95 98 855 Hai Phong 16.4 3.4 61.5 58.0 57.0 55.1 42.26 46.35 254 2636 Binh Duong 20.1 5.1 63.6 46.7 48.7 38.8 24.62 26.20 154 1137 Dong Nai 24.1 2.9 77.1 69.6 36.3 36.2 32.28 31.99 238 2188 Thai Binh 59.6 1.9 107.5 100.5 93.6 92.0 55.46 56.43 561 5469 Hai Duong 33.4 3.4 102.0 93.7 88.8 85.1 44.75 52.78 438 47610 Khanh Hoa 29.4 3.4 46.4 50.1 39.4 40.6 37.37 41.02 173 18511 Quang Ninh 9.7 4.1 63.8 63.2 49.3 49.3 25.88 32.29 158 18912 Nam Dinh 42.3 2.7 96.7 91.8 87.0 84.9 48.15 57.50 447 506
Medium Human Development 50.8 3.6 128.2 133.2 112.8 117.4 36.04 39.14 441 49213 Vinh Long 56.0 3.2 193.7 206.1 190.6 203.2 41.83 42.43 814 86914 Hung Yen 51.5 3.3 99.0 91.9 83.5 80.6 44.16 52.96 412 46215 Ha Nam 45.0 3.5 105.7 104.2 90.9 89.0 41.07 48.37 408 47316 Long An 51.7 4.2 260.2 304.3 256.5 301.7 31.19 35.00 807 105817 Vinh Phuc 36.5 2.8 95.1 94.0 68.7 67.1 30.12 35.45 263 30118 Tien Giang 53.5 3.0 163.0 162.6 160.3 159.9 44.25 46.89 714 75519 Bac Ninh 40.6 4.9 100.4 98.1 86.7 87.0 31.74 42.75 304 39320 Ca Mau 57.9 2.5 181.2 213.4 179.7 212.1 28.42 30.67 513 65221 Kien Giang 54.2 3.5 273.0 344.0 273.6 343.0 38.45 37.56 1052 129122 Ha Tinh 50.2 4.1 99.8 92.6 80.8 75.1 28.78 29.79 267 25423 Phu Tho 30.1 3.1 75.5 74.2 56.5 54.0 26.15 30.65 196 21324 Can Tho 39.9 2.6 219.5 224.2 217.7 218.6 42.58 44.56 930 97725 Ha Tay 43.7 2.6 89.7 84.9 73.3 70.2 38.48 46.96 326 37026 Nghe An 43.9 3.2 93.1 88.2 67.5 63.3 30.41 33.01 239 25927 Ben Tre 66.6 4.2 71.2 72.4 68.6 71.0 34.44 33.57 243 24228 Tay Ninh 47.5 5.1 158.2 166.2 140.6 150.4 24.19 27.89 428 45529 Quang Nam 44.0 2.6 107.2 94.9 79.6 72.5 28.98 32.39 282 28530 Ninh Binh 51.4 2.8 104.9 101.5 91.6 89.2 39.45 49.67 385 47431 Lam Dong 67.9 7.8 61.1 59.5 37.7 35.9 26.84 30.22 174 19432 Thai Nguyen 39.2 2.7 79.8 88.9 60.9 64.4 30.30 34.36 211 27433 Thanh Hoa 40.7 3.8 96.3 92.8 72.8 70.2 33.88 38.33 292 31934 Binh Dinh 49.6 3.6 92.7 89.4 82.7 79.8 33.95 36.38 299 31635 Thua Thien-Hue 21.2 3.3 62.3 58.5 47.9 46.9 34.35 37.67 192 19836 Tra Vinh 72.4 3.1 179.2 211.9 222.7 197.7 29.75 36.81 680 74537 Soc Trang 64.2 3.0 231.2 272.3 226.6 268.7 39.48 40.21 904 108938 An Giang 44.1 2.6 201.2 207.7 196.1 204.8 48.30 47.64 978 98639 Bac Lieu 59.3 3.0 250.3 294.3 172.7 213.3 30.31 39.68 659 84940 Dong Thap 68.2 2.7 240.4 267.9 238.2 266.0 44.78 45.67 1073 122241 Dac Lac 76.2 5.6 78.4 72.0 55.0 41.9 27.81 30.46 216 22242 Quang Ngai 45.6 2.0 93.0 86.6 73.1 69.7 28.79 34.92 247 27043 Quang Tri 45.3 5.0 100.2 93.7 77.7 75.1 28.61 28.27 259 24144 Quang Binh 35.9 3.0 80.3 71.4 58.6 54.5 27.17 27.39 187 17645 Binh Thuan 47.2 3.9 94.0 101.9 72.3 81.2 32.04 35.08 276 33846 Hoa Binh 50.9 2.7 100.7 98.2 58.5 51.0 29.59 31.57 230 22247 Binh Phuoc 66.8 5.3 68.8 48.8 47.9 34.4 15.28 16.17 113 84
Agricultureand FoodSecurity
Agriculture(as % of
GDP)1998pre.
Annualagriculture
growthrate at fix
price 1994)(% - 1995-
1997)
Plantedarea of
food crops(ha per
1000 peo-ple) 1995
Plantedarea of
food crops(ha per
1000 peo-ple) 1998
Plantedarea of
paddy (haper 1000people)1995
Plantedarea of
paddy (haper 1000people)1998
Yield ofpaddy
(quintal/ha)1995
Yield ofpaddy
(quintal/ha)1998
Food percapita(kg)
1995
Food percapita (kg)
1998HDI rank Province
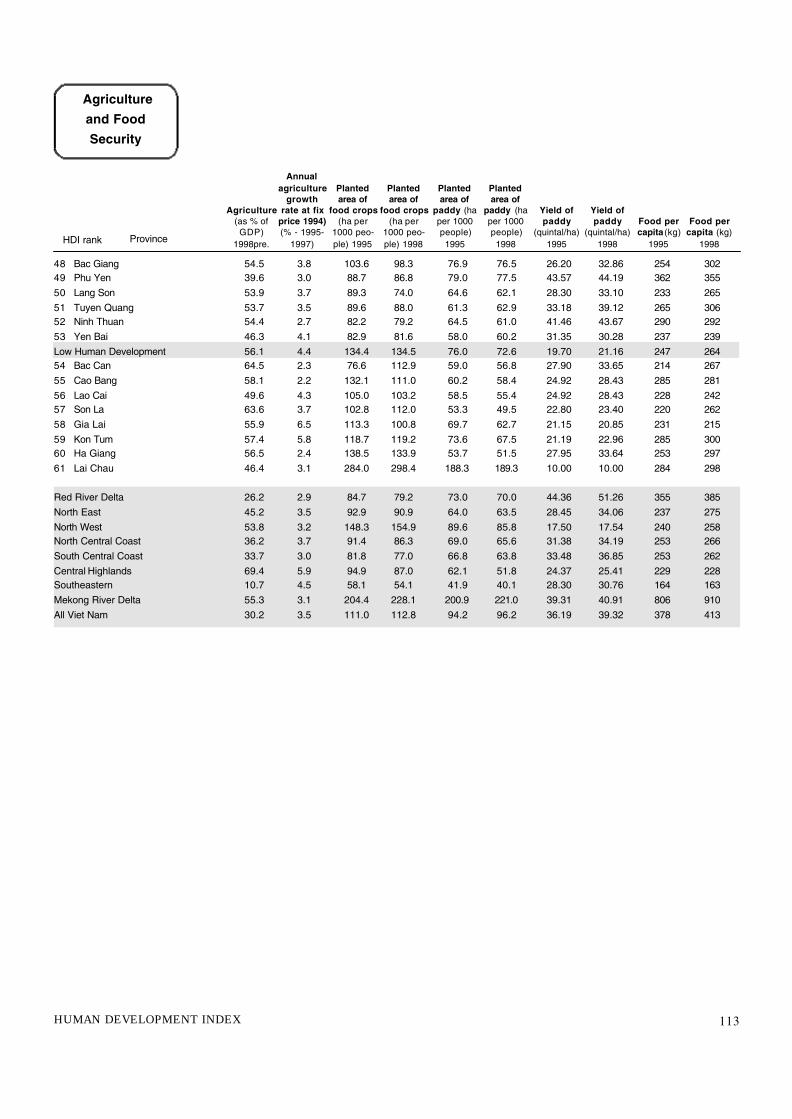
113HUMAN DEVELOPMENT INDEX
48 Bac Giang 54.5 3.8 103.6 98.3 76.9 76.5 26.20 32.86 254 30249 Phu Yen 39.6 3.0 88.7 86.8 79.0 77.5 43.57 44.19 362 35550 Lang Son 53.9 3.7 89.3 74.0 64.6 62.1 28.30 33.10 233 26551 Tuyen Quang 53.7 3.5 89.6 88.0 61.3 62.9 33.18 39.12 265 30652 Ninh Thuan 54.4 2.7 82.2 79.2 64.5 61.0 41.46 43.67 290 29253 Yen Bai 46.3 4.1 82.9 81.6 58.0 60.2 31.35 30.28 237 239Low Human Development 56.1 4.4 134.4 134.5 76.0 72.6 19.70 21.16 247 26454 Bac Can 64.5 2.3 76.6 112.9 59.0 56.8 27.90 33.65 214 26755 Cao Bang 58.1 2.2 132.1 111.0 60.2 58.4 24.92 28.43 285 28156 Lao Cai 49.6 4.3 105.0 103.2 58.5 55.4 24.92 28.43 228 24257 Son La 63.6 3.7 102.8 112.0 53.3 49.5 22.80 23.40 220 26258 Gia Lai 55.9 6.5 113.3 100.8 69.7 62.7 21.15 20.85 231 21559 Kon Tum 57.4 5.8 118.7 119.2 73.6 67.5 21.19 22.96 285 30060 Ha Giang 56.5 2.4 138.5 133.9 53.7 51.5 27.95 33.64 253 29761 Lai Chau 46.4 3.1 284.0 298.4 188.3 189.3 10.00 10.00 284 298
Red River Delta 26.2 2.9 84.7 79.2 73.0 70.0 44.36 51.26 355 385North East 45.2 3.5 92.9 90.9 64.0 63.5 28.45 34.06 237 275North West 53.8 3.2 148.3 154.9 89.6 85.8 17.50 17.54 240 258North Central Coast 36.2 3.7 91.4 86.3 69.0 65.6 31.38 34.19 253 266South Central Coast 33.7 3.0 81.8 77.0 66.8 63.8 33.48 36.85 253 262Central Highlands 69.4 5.9 94.9 87.0 62.1 51.8 24.37 25.41 229 228Southeastern 10.7 4.5 58.1 54.1 41.9 40.1 28.30 30.76 164 163Mekong River Delta 55.3 3.1 204.4 228.1 200.9 221.0 39.31 40.91 806 910All Viet Nam 30.2 3.5 111.0 112.8 94.2 96.2 36.19 39.32 378 413
Agricultureand FoodSecurity
Agriculture(as % ofGDP)
1998pre.
Annualagriculture
growthrate at fix
price 1994)(% - 1995-
1997)
Plantedarea of
food crops(ha per
1000 peo-ple) 1995
Plantedarea of
food crops(ha per
1000 peo-ple) 1998
Plantedarea of
paddy (haper 1000people)1995
Plantedarea of
paddy (haper 1000people)1998
Yield ofpaddy
(quintal/ha)1995
Yield ofpaddy
(quintal/ha)1998
Food percapita (kg)
1995
Food percapita (kg)
1998HDI rank Province

114 NATIONAL HUMAN DEVELOPMENT REPORT 2001
High Human Development 9.3 6.0 7.7 60.50 51.7 74.53 2.5 96.13 0.817 59.36 525.51 Ba Ria-Vung Tau 6.1 15.4 15.3 1.75 44.1 1.57 1.5 1.01 0.253 1.47 384.32 Ha Noi 1.4 2.8 0.1 17.86 138.1 23.23 7.0 31.56 2.429 11.60 930.43 Ho Chi Minh City 1.2 2.3 1.5 23.96 88.4 34.11 4.9 58.12 2.134 23.93 915.64 Da Nang 4.8 14.8 2.9 2.09 57.7 1.89 2.0 1.79 0.491 1.28 367.45 Hai Phong 7.4 1.8 0.7 2.94 32.1 3.43 1.5 1.10 0.120 3.46 392.16 Binh Duong 6.8 13.9 15.6 1.25 35.4 1.37 1.5 0.43 0.120 1.89 553.57 Dong Nai 6.0 9.8 26.4 3.13 28.9 2.85 1.0 1.04 0.096 5.70 545.38 Thai Binh 10.0 1.4 2.2 0.83 8.3 0.45 0.2 0.00 0.000 1.51 158.09 Hai Duong 8.7 0.9 0.8 1.21 13.1 0.59 0.3 0.00 0.000 2.19 246.210 Khanh Hoa 11.1 38.2 7.8 1.97 36.6 1.26 0.9 0.95 0.175 2.03 391.311 Quang Ninh 12.9 7.5 14.8 1.72 33.7 2.55 1.9 0.14 0.028 1.82 370.812 Nam Dinh 8.4 2.9 0.7 1.03 10 0.60 0.2 0.01 0.001 1.87 187.2
Medium Human Development 25.5 18.6 26.9 36.92 13.8 23.99 0.3 3.79 0.014 38.92 150.613 Vinh Long 83.5 0.7 51.9 0.77 12.8 0.63 0.4 0.00 0.000 0.60 103.714 Hung Yen 6.4 2.8 2.6 0.48 8.1 0.24 0.2 0.00 0.000 0.89 155.615 Ha Nam 13.6 4.2 0.7 0.34 7.5 0.28 0.2 0.03 0.006 1.11 259.416 Long An 33.4 17.6 25.3 1.12 15.9 0.44 0.2 0.06 0.008 1.34 197.417 Vinh Phuc 3.6 3.6 2.4 0.57 9.7 0.48 0.3 0.01 0.002 0.97 170.418 Tien Giang 48.2 1.3 15.0 1.27 13.5 0.77 0.3 0.12 0.012 1.34 148.119 Bac Ninh 7.2 6.4 0.2 0.74 14.7 0.67 0.5 0.02 0.003 1.57 323.220 Ca Mau 23.8 8.4 70.4 0.86 14.6 1.31 0.9 0.03 0.005 0.49 86.721 Kien Giang 37.8 21.0 57.3 1.54 19.7 0.73 0.4 0.24 0.030 1.26 167.122 Ha Tinh 9.5 14.7 7.6 0.46 6.3 0.22 0.1 0.01 0.001 0.63 90.223 Phu Tho 7.0 4.9 24.0 0.67 9.7 0.51 0.3 0.01 0.002 1.68 251.024 Can Tho 66.9 1.0 38.0 2.01 19.5 2.12 0.8 0.67 0.064 1.82 182.125 Ha Tay 10.4 10.8 2.6 1.54 12.2 0.36 0.1 0.07 0.006 2.71 221.626 Nghe An 12.7 19.8 9.1 2.27 14.7 1.22 0.3 0.13 0.008 2.04 136.927 Ben Tre 79.9 2.6 47.3 1.02 13.6 0.39 0.2 0.02 0.003 0.57 78.228 Tay Ninh 8.5 20.2 21.8 1.06 21.2 0.94 0.7 0.09 0.017 0.87 181.329 Quang Nam 10.8 43.9 22.0 0.80 10.6 0.29 0.1 0.16 0.021 0.78 107.430 Ninh Binh 11.8 6.8 3.2 0.38 7.8 0.30 0.2 0.01 0.001 0.87 185.131 Lam Dong 12.8 15.8 31.5 1.57 33.7 0.78 0.7 0.52 0.112 0.80 177.232 Thai Nguyen 5.8 8.4 18.0 0.71 13.1 0.34 0.2 0.05 0.009 1.70 325.133 Thanh Hoa 12.0 7.8 16.9 1.23 6.4 0.48 0.1 0.00 0.000 2.77 149.534 Binh Dinh 8.1 68.5 14.7 1.35 16.9 0.45 0.2 0.09 0.011 1.25 161.235 Thua Thien-Hue 9.6 31.7 25.5 1.25 22.1 0.39 0.3 0.80 0.140 1.19 217.736 Tra Vinh 46.9 35.0 71.1 0.67 12.3 0.47 0.3 0.01 0.001 0.34 65.637 Soc Trang 30.3 18.9 62.3 0.81 11.9 0.69 0.4 0.02 0.002 0.59 90.338 An Giang 72.7 20.1 33.3 1.85 16.6 2.05 0.7 0.03 0.002 1.26 117.139 Bac Lieu 24.0 31.4 71.3 0.62 14.6 0.88 0.8 0.00 0.000 0.32 77.040 Dong Thap 86.6 4.0 39.8 1.04 12.3 0.85 0.4 0.05 0.006 0.94 115.641 Dac Lac 8.2 14.3 48.0 1.39 18.6 1.24 0.6 0.27 0.036 0.73 101.042 Quang Ngai 19.8 63.2 24.9 1.00 14.9 0.46 0.3 0.01 0.001 0.73 113.843 Quang Tri 22.7 26.1 21.5 0.60 19.8 0.13 0.2 0.05 0.018 0.41 141.244 Quang Binh 27.0 14.0 18.0 0.54 12.6 0.15 0.1 0.02 0.004 0.62 148.545 Binh Thuan 13.5 48.1 28.6 1.25 24.5 0.52 0.4 0.11 0.022 0.63 127.846 Hoa Binh 28.3 7.0 37.4 0.38 9.3 0.07 0.1 0.01 0.001 0.36 89.547 Binh Phuoc 10.3 14.4 70.6 0.39 13.2 0.31 0.4 0.00 0.000 0.28 98.048 Bac Giang 6.0 7.9 8.9 0.76 9.5 0.40 0.2 0.02 0.003 0.97 125.7
Infrastructure
Populationwithout
access tosafe water(% - 1999)
Populationwithout
access tosanitation(% - 1999)
Population withoutaccess toelectricity(% - 1999)
Share oftele-
phonesin total
(%,1998)
Numberof tele-phones
(per 1000people)
1998
Share ofmobile
phone intotal (%)
1998
Mobiles(per 1000people)
1998
Internetuse ( % )
1998
Internetconnec-
tion(per1000people)
1998
Energyconsump-tion (as %
of tota)1998
Energy useper capita
(kWh) 1998HDI rank Province

115HUMAN DEVELOPMENT INDEX
49 Phu Yen 12.1 58.7 30.0 0.57 13.7 0.33 0.3 0.06 0.014 0.53 131.950 Lang Son 50.6 28.9 39.8 0.60 15.2 1.12 1.1 0.00 0.000 0.38 99.251 Tuyen Quang 26.8 19.1 46.2 0.27 7.4 0.11 0.1 0.00 0.000 0.37 103.852 Ninh Thuan 42.0 66.7 14.4 0.56 21.4 0.37 0.6 0.04 0.014 0.43 172.153 Yen Bai 31.3 19.9 32.2 0.35 9.4 0.13 0.1 0.00 0.000 0.38 105.1
Low Human Development 58.3 41.6 51.6 2.58 10.4 1.48 0.2 0.07 0.003 1.72 71.854 Bac Can 59.4 27.5 41.7 0.11 6.3 0.11 0.2 0.00 0.000 0.06 38.055 Cao Bang 66.0 46.6 52.8 0.24 8 0.20 0.3 0.00 0.000 0.14 46.456 Lao Cai 54.2 42.6 41.3 0.41 13 0.29 0.4 0.00 0.000 0.41 133.957 Son La 68.7 21.9 52.3 0.35 7.5 0.14 0.1 0.00 0.000 0.21 48.258 Gia Lai 41.7 54.6 46.0 0.77 16.4 0.42 0.3 0.04 0.008 0.49 107.559 Kon Tum 30.8 37.3 44.8 0.26 17.2 0.06 0.2 0.01 0.004 0.15 102.160 Ha Giang 63.5 37.9 60.0 0.22 7 0.14 0.2 0.03 0.010 0.15 51.561 Lai Chau 76.7 57.4 69.1 0.23 7.7 0.13 0.2 0.00 0.000 0.11 37.0
Red River Delta 7.9 3.9 1.4 26.60 33.5 29.48 1.4 32.78 0.410 26.22 341.9North East 22.3 15.6 23.9 7.37 12.6 7.06 0.5 0.28 0.005 10.59 187.2North West 57.1 26.2 51.6 0.96 8.2 0.33 0.1 0.01 0.000 0.68 59.8North Central Coast 13.4 16.1 14.8 6.36 11.6 2.59 0.2 1.00 0.018 7.66 144.6South Central Coast 11.4 50.8 17.6 7.78 22 4.68 0.5 3.04 0.086 6.60 193.4Central Highlands 21.2 29.5 47.1 2.42 17.7 1.72 0.5 0.32 0.023 1.36 103.3Southeastern 7.2 14.3 17.2 34.93 53.1 42.81 2.5 61.35 0.927 36.01 567.2Mekong River Delta 55.6 12.3 45.2 13.59 15.1 11.32 0.5 1.23 0.014 10.88 125.1All Viet Nam 22.9 16.4 22.9 100.00 24.4 100.00 0.9 100.00 0.243 100.00 253.0
Infrastructure
Populationwithout
access tosafe water(% - 1999)
Populationwithout
access tosanitation(% - 1999)
Population withoutaccess toelectricity(% - 1999)
Share oftele -
phonesin total
(%,1998)
Numberof tele-phones
(per 1000people)
1998
Share ofmobile
phone intotal (%)
1998
Mobiles(per 1000people)
1998
Internetuse ( % )
1998
Internetconnec-
tion(per1000people)
1998
Energyconsump-tion (as %
of tota)1998
Energy useper capita(kWh) 1998HDI rank Province