Embed Size (px)
Citation preview
Does Trade Liberalization Lead to Environmental Burden Shifting in the Global Economy?
Dennis Kolcava*
Quynh Nguyen’
Thomas Bernauer*
* ETH Zürich, Switzerland
’ Princeton University, USA
Corresponding author: Dennis Kolcava, [email protected],
Postal address: Haldeneggsteig 4, 8092 Zürich
Please find the published version of the article here: https://doi.org/10.1016/j.ecolecon.2019.05.006
CC BY-NC-ND 3.0 CH
Abstract Does trade liberalization lead to the outsourcing of pollution from industrialized countries to developing countries? According to the pollution-haven hypothesis, international trade is a key channel through which richer countries can geographically dissociate consumption from production of goods. We examine whether and how trade liberalization via preferential trade agreements (PTAs) facilitates the shifting of consumption-based environmental burdens from developed countries (via imports) to poorer countries (via exports). Based on panel data analysis of 183 countries from 1987 to 2013 we find partial evidence for trade-induced environmental burden shifting. While we observe an increase in footprint exports from low-income countries when these countries liberalize trade, this is not matched by an increase in footprint imports of high-income countries. Our results also show that environmental clauses in PTAs and participation in international environmental agreements do not influence the relationship between trade liberalization and ecological footprint movements. However, domestic institutions have a significant effect on the trade-induced distribution of environmental burdens. These findings suggest that PTAs as a policy tool for trade liberalization are, per se, unlikely to induce exploitation of low-income countries' natural capital by wealthier nations. However, they suggest that political incentives inherent to democratic institutions encourage environmental burden shifting.

1. Introduction Although particular distributional economic effects of international trade remain controversial, large parts of society, in countries both at high and low levels of income, tend to welcome the aggregate welfare-enhancing effects of trade liberalization (Pew, 2014). Yet, many scholars and policymakers also point to adverse implications of free trade for the natural environment (e.g., Antweiler et al., 2001; Copeland and Taylor, 2007; Kleemann and Abdulai, 2013; Managi et al., 2009). The trade-environment agenda in the World Trade Organization (WTO), the main institution governing the global trading system, has remained quite weak in terms of promoting “greener trade”, not least because trade diplomacy within the WTO as a whole has lost its dynamic since the collapse of the Doha round. Instead, both academic and policy debates on the trade-environment nexus have shifted to bilateral and regional trade liberalization efforts focusing on preferential trade agreements (PTAs) (Jara, 2017; Limão, 2016; Rodrik, 2018). Debates over the environmental implications of PTAs have in recent years received added stimulus from discussions over “green economy” or “circular economy” initiatives at various political levels (e.g., European Commission, 2015; World Economic Forum, 2018; Green Growth Knowledge Platform, 2018). Thus, it appears that many countries are moving towards joint consideration of trade and environmental policy in an attempt to address increasing imbalances between consumption- and production-related environmental impacts (footprints).
However, this trend towards joint consideration of consumption and production-related environmental implications of international trade in the context of green economy policies is only partly reflected in academic research on the subject. Traditionally, political economy and environmental politics scholars have examined the trade-environment relationship primarily by factoring trade openness into the Environmental Kuznets Curve (EKC) model. According to the EKC, during the early stages of economic growth, environmental conditions deteriorate as per capita income increases, but start to improve when economic growth reaches a threshold level of income. The turnaround in the relationship between economic growth and environmental degradation, sometimes referred to as ecological modernization, is presumably caused by changes in economic structure and societal preferences (postmaterial values). To what extent this environmental turnaround is achieved endogenously (domestically), or via relocating polluting production to other, usually less regulated and poorer countries (pollution havens), remains disputed (e.g., Aklin, 2016; Cole, 2004; Copeland and Taylor, 2007; de Soysa and Neumayer, 2005; Gamso, 2017; He, 2006; Kellenberg, 2009). One important limitation of the EKC research with respect to the latter issue is that it relies primarily on territorial measures of environmental behaviour (e.g., emissions) or quality (e.g., air or water quality) (Martinez-Zarzoso and Oueslati, 2016). At the most elementary level, regression coefficients on trade openness variables serve as indications of whether pollution and waste increase or decrease with economic openness. A negative effect of trade openness on pollution and waste could provide some, albeit very indirect, evidence for the pollution-haven problem. However, such a finding is also compatible with different arguments; one of them is that trade openness is welfare-increasing and facilitates the international diffusion of environmental standards and green technology, all of which are conducive to endogenous (domestic) environmental improvement.
Research based on life cycle assessment (LCA) approaches and ecological economics, which has developed independently from research on the pollution-haven hypothesis, as based on the EKC, offers a new entry point for revisiting the pollution-haven hypothesis (e.g., Weinzettel and Wood, 2018). Specifically, LCA approaches account for environmental impacts all the way from the “cradle” (extraction and processing) to the “grave” (final consumption and waste). This allows us to capture the effects of trade on the environment with measures of

environmental impacts embodied in trade flows, rather than just examining whether variation in trade levels and openness is correlated with territorial measures of pollution and waste. With data on environmental impacts embodied in trade flows, we can examine two closely related and policy-relevant questions. First, to what extent does trade liberalization via PTAs facilitate environmental burden shifting in the form of stimulating exports of production-related environmental footprints in developing countries and encourage imports of consumption-related environmental footprints in advanced industrialized countries? Second, to what extent does variation in PTA design characteristics and domestic and international political institutions affect the relationship between trade liberalization and flows of environmental footprints?
Our analysis generates novel insights and contributes to a better understanding of the complex relationship between trade and the environment. While previous studies have primarily relied on territorial measures of environmental impacts, which only account for production-based environmental consequences, we employ a measure of environmental impact that considers environmental burdens generated through both production and consumption. By including environmental impacts of consumption, we allow for the possibility that changes in environmental indicators (e.g., emissions) at the national level can occur due to the relocation of production abroad and import substitution. Thus, conceptually and empirically, our study provides a more nuanced picture than existing research.
In addition, we examine the influence of PTA design characteristics with original data that we collected through systematic text analysis of environmental provisions included in preferential trade agreement texts. Whereas existing studies have accounted for the impact of PTA design characteristics through a simple recording of whether such agreements contain environmental provisions or not, we collected information on strength and content of such environmental provisions. This allows us to test the impact of the design characteristics of PTAs on environmental burden shifting dynamics at a higher level of granularity.
Finally, while existing studies on the relationship between environmental quality and economic growth provide useful starting points for studying drivers of environmental burden shifting, such analyses remain incomplete without the consideration of political and institutional factors. We address this gap by taking into account the role of political institutions both at the domestic and international level.
In sum, by asking whether trade liberalization via PTAs may lead to environmental burden shifting and, by investigating how trade policy design and political institutions might condition this relationship, our study generates novel insights relevant to the academic as well as to the policy debate on the trade-environment nexus.
In the remainder of this paper, we first develop our theoretical arguments. We hypothesize that trade liberalization through participation in preferential trade agreements leads to more exports of environmental footprints by countries at lower levels of income. Conversely, we expect an increase of imports of environmentally burdensome goods by wealthier countries. However, we also argue that environmental provisions in PTAs and embeddedness in international environmental institutions could mitigate these effects, while democracy is likely to create incentives to engage in environmental burden shifting. We then test these arguments based on panel data for 183 countries from 1987 to 2013.

2. What drives and mitigates international environmental burden shifting? In our context, international environmental burden shifting means that goods that are consumed within a given country are increasingly produced outside its borders. Thus, in a process of geographical dissociation between consumption and production, the production of goods impacts the natural environment outside of the country where consumption ultimately takes place. Consequently, in this section, we present arguments on how trade liberalization is likely to impact particular types of countries in this manner, as well as what factors might mitigate environmental burden shifting.
2.1. Environmental effects of participation in preferential trade agreements
The continued relevance of the WTO framework in governing international trade notwithstanding, PTAs have proliferated in the past two to three decades (e.g., Baccini, 2019; Baccini and Dür, 2012; Baccini and Urpelainen, 2012; Dür et al., 2014; Mansfield and Milner, 2012; Spilker et al., 2016). It seems, moreover, that regional trading blocs and PTAs are here to stay as important policy tools for trade liberalization (Baldwin, 2011; Jara, 2017; Rodrik, 2018). There are several reasons for this development (for a comprehensive review, see Baccini, 2019).
First of all, PTAs are easier to negotiate than new rules in the WTO because countries are free to pick their preferred PTA partners and define the contents of a PTA according to their preferences (Dür et al., 2014; Mansfield and Milner, 2012). In the WTO, in contrast, new trade rules must be adopted by consensus among the 164 member countries and trade concessions cannot be restricted to subsets of WTO members since this would violate the most favored nation and non-discrimination principles.
Another reason why PTAs have gained in relevance relates to incentives and structures inherent in the world trading system, as governed by the WTO and formerly the General Agreement on Tariffs and Trade (GATT) (Grossman, 2016; Mansfield and Reinhardt, 2003; Mansfield and Milner, 1999). Several scholars argue that as some countries seek to increase their bargaining power for WTO negotiations by setting up PTAs, this, in turn, motivates other countries perceiving trade-diverting and competitiveness-reducing effects of such PTAs to follow suit and set up PTAs as well (Baldwin, 2011, 29).1 Moreover, they also note that countries might be hedging against a decrease in trade should multilateral negotiations stall and should the WTO system erode. The latter argument seems particularly relevant now that confidence in US commitment to the WTO is at an all-time low.2
Finally, the ‘unbundling’ of value chains and the increased complexity of production networks across the globe have increased demand for government regulation in areas that extend beyond traditional tariff reductions and removals of other, conventional trade barriers (Horn et al., 2010; Rodrik, 2018). Adding such regulation to trade agreements, for instance, environmental (Morin and Rochette, 2017; Morin et al., 2018) or labor standards (Kim, 2012; Mosley, 2017) is much easier in PTAs, relative to the WTO, for the reasons noted above.
While there is also a literature on how PTAs influence trade levels among countries (Baier and Bergstrand, 2007; Dai et al., 2014; Egger and Larch, 2008, Egger and Larch, 2011; Freund and Ornelas, 2010; Fugazza and Nicita, 2013; Spilker et al., 2018), our focus is not on explaining trade levels per se, but on environmental impacts embodied in trade flows, as facilitated by

trade liberalization efforts through PTAs. Research on the Environmental Kuznets Curve (EKC) provides an obvious starting point for this, although the EKC remains contested both from a theoretical and empirical viewpoint (Beladi and Oladi, 2011; Ekins, 1997; Harbaugh et al., 2002; Neumayer, 2017; Rothman, 1998; Stern, 2004) – we will return to this issue in the Discussion section.
The EKC model holds that the effects of economic wellbeing (usually measured by GDP per capita) on the environment operate through “scale”, “composition”, and “technology” mechanisms. Scale effects arise from increased economic activity associated with economic growth and are likely to increase pollution and waste. Changing techniques of production and their effect on the environment are captured by the technique effect. As a country develops economically, technological innovation presumably leads to increased efficiency in terms of using less polluting inputs per unit of output. Consequently, ceteris paribus, the technique effect is likely to reduce pollution. While the technique effect is likely to influence the slope of the scale effect from some level of economic wellbeing onward, the composition effect also plays a crucial role in influencing the shape of the EKC. The composition effect refers to changes in a country's economic structure as it moves through different stages of economic development. As a country develops, its economy usually transitions from primary production (mostly agriculture) to pollution-intensive, heavy industry, and then towards cleaner light manufacturing and services.
Several studies suggest, however, that the EKC's inverted-U shape – to the extent it is observed empirically – could result not only from cleaner economic activity domestically, but also from changing trade patterns that appear to accompany economic development (e.g., Grossman and Kruger, 1995; Heil and Selden, 2001; Kanemoto et al., 2014; Suri and Chapman, 1998; Wiedmann et al., 2015). That is, as countries grow wealthier, they may increasingly specialize in producing goods for domestic consumption or export that burden the environment less, while importing more pollution- and waste-intensive goods from other countries that are willing to specialize in producing such goods. In this paper, we focus on the latter mechanism.
International trade, as facilitated by trade liberalization policy, and notably PTAs, provides the main mechanism through which national patterns of production and consumption can become disassociated, particularly with regards to concomitant environmental impacts (Andersson and Lindroth, 2001; Chew, 2001; Ekins, 1997; Jorgenson and Rice, 2005; Rothman, 1998). As Pearce and Warford (1993, 25) put it: “It is perfectly possible for a single nation to secure sustainable development – in the sense of not depleting its own stock of capital assets – at the cost of procuring unsustainable development in another country”. One trade-related explanation of how national patterns of production and consumption can become dissociated is that less developed countries extract and process natural resources and export them to more developed ones. This implies that the latter group of countries externalizes pollution and other environmental costs by means of importing resource-intensive goods, energy, or raw materials. For example, Peters et al. (2011) show that Annex B3 countries under the Kyoto Protocol (countries with emission reduction obligations) have dislocated an increasing share of their CO2 emissions to countries without Kyoto obligations. This finding relates to earlier research by Rothman (1998), who points out that to the extent differences in environmental impact of production processes between domestic and imported commodities can be accounted for, what is important is the changing ratio between domestic production and domestic consumption. Specifically, even if domestic production remains the same or increases, if domestic consumption rises faster, then some of the increase in consumption must be met by importing goods. This mechanism may, for instance, explain reductions in local air pollution in developed countries (Cole and Neumayer, 2005). Thus, when considered in isolation, the composition

effect for a rich economy is likely to reduce pollution, while it could lead to increases in pollution in poorer countries. This means that positive conclusions about trade effects on the environment become questionable. The reason is that such positive effects are usually observed for domestic territorial environmental outcomes. Cole and Neumayer (2005) refer to this phenomenon as “weak sustainability”, which describes the circumstance in which environmental improvements in a given country result from offloading environmental impacts onto other countries.
In view of the above arguments, and based on the idea of an “unequal ecological exchange” among countries (e.g., Andersson and Lindroth, 2001; Peters et al., 2011), we hypothesize that increased participation in PTAs is likely to result, all else equal, in increased environmental footprint imports in wealthy countries, that is, increased offloading of consumption-related environmental burdens onto other countries. Conversely, all else equal, increased participation in PTAs is likely to lead to increased environmental footprint exports in countries at lower levels of income (Hypothesis 1).
Empirically, we therefore expect heterogenous effects of trade liberalization on the flows of environmental footprint imports and exports across different income groups. In particular, we should observe that as countries at lower levels of income open up their economy to international trade by joining PTAs, they experience an increase in production-related exports of environmental footprints. In contrast, countries at higher levels of income should not, to the extent the hypothesis is supported, experience a growth in their footprint exports under trade liberalization. With regards to the flows of footprint imports, environmental burden shifting implies that countries at higher levels of income see a rise in their consumption-related footprint imports as they further liberalize their economy, while in countries at lower levels of income, participation in PTAs should have no significant effect or even a negative effect on the these countries' level of footprint imports.
In the following sections, we develop theoretical arguments regarding potential moderating effects of PTA design characteristics, as well as domestic and international political institutions on the relationship between PTA-based trade liberalization and the flows of environmental footprints in the global economy.
2.2. Environmental provisions in PTAs
While most environmental groups and green political parties request strong environmental clauses in PTAs to reduce the pollution-haven problem, labour unions and parts of industry sometimes demand such clauses to avoid presumed job losses due to “offshoring” of production to less regulated economies. Yet, political leaders of poorer countries tend to reject such demands, sometimes pointing to “green imperialism” and to lower environmental standards simply being part of developing countries' comparative advantage (Bernauer and Nguyen, 2015). The proliferation of environmental clauses in PTAs is an expression of this debate (e.g., Bechtel et al., 2012; Lechner, 2016; Morin et al., 2018). While environmental provisions were rarely included in trade agreements before the 1980s, they began to feature prominently in such agreements from the 1990s onwards, especially in agreements between industrialized and developing countries (Morin et al., 2018). Surprisingly, however, we know very little about the effects of such clauses, i.e., whether they do – as intended – affect offshoring of polluting production and trade in pollution-intensive goods.
To begin with, environmental clauses in PTAs are intended to mitigate the potential negative environmental impacts of trade that could emerge as a consequence of differences in

environmental regulation across countries. The main differences between environmental provisions in PTAs pertain to the basis for their enforcement.4 While environmental provisions are legally binding in some PTAs, they are nonbinding in other PTAs. However, independently of their basis for enforcement, environmental provisions in PTAs seek to prevent processes of competitive lowering of environmental regulation between member countries.
According to the pollution-haven hypothesis, once trade barriers are reduced or eliminated, poorer countries might be tempted to exploit laxer environmental standards to gain in competitiveness by attracting foreign direct investment and encouraging the relocation of economic activity and pollution-intensive production from wealthier countries. Thus, in the absence of environmental provisions in PTAs, trade liberalization could have a direct effect on countries' exports and imports of environmental footprints, as noted in Hypothesis 1. Conversely, environmental provisions in PTAs could help mitigate such effects by setting environmental floor standards, establishing reciprocal commitments by governments not to engage in competitive environmental deregulation, and creating standards of good environmental behaviour and associated reputational stakes. We thus expect that countries engaged in more PTAs with strong environmental clauses tend to offload less of their environmental footprint on other countries, that is, they import less environmental footprints. At the same time, countries engaged in more PTAs with strong environmental clauses should export less environmental footprints and hence receive less of the environmental burdens from consumption in other countries (Hypothesis 2).
2.3. Domestic political institutions
The relationship between environmental performance and economic development does not evolve in isolation from political institutions that govern processes of policymaking. Nevertheless, with a few exceptions, existing studies have largely ignored the role of political and institutional factors (e.g., Binder and Neumayer, 2005; Esty and Porter, 2005; Holzinger et al., 2008). In addition to a country's level of economic development, we also expect a country's domestic political institutions, in particular its level of democracy, to have an effect on how trade liberalization impacts environmental footprint exports and imports. Empirically, various studies report a positive relationship between democracy and environmental indicators of atmospheric and water pollution (Barrett and Graddy, 2000; Congleton, 1992; Li and Reuveny, 2006; Murdoch et al., 1997; Torras and Boyce, 1998), conservation (Neumayer, 2002), deforestation (Buitenzorgy and Mol, 2011; Ehrhardt-Martinez et al., 2002; Li and Reuveny, 2006), and soil degradation (Li and Reuveny, 2006).
One reason for why democracy is likely to improve environmental performance is that well-functioning democratic institutions facilitate the mobilization and expression of societal demands (Bättig and Bernauer, 2009). The free flow of information that characterizes a well-functioning democracy (vis-à-vis autocracy) is also likely to facilitate policy learning (Barrett and Graddy, 2000; Midlarsky, 1998). Another reason is that democracies are likely to provide more public goods than autocracies (Congleton, 1992; Deacon, 2009). While governments of all types provide (varying levels of) public goods, governments tend to do so via balancing costs and benefits that are politically relevant. In democracies, the group controlling the political system includes the entire citizenry, and political balancing seeks to equate marginal costs and benefits to the median citizen (voter). Since most contemporary environmental problems emerge as a negative by-product of increased demands placed on the natural environment by a growing population and increasing affluence, democracy may be viewed as constituting an effective social feedback mechanism. Because control of economic resources is more concentrated in an autocracy, the elite is likely to incur a disproportionately large ratio of

public goods provision costs relative to benefits. Thus, autocracies, on average, are less likely to implement effective environmental protection policies. Even if environmental protection benefits are normal or superior goods, meaning that demand for them increases with income, an elite group is likely to enjoy only a small fraction of economy-wide benefits from increased provision (Deacon, 2003, 12).
However, we argue that, for the reasons outlined above, democratic governments are keen to provide environmental quality at home, but also have incentives to offload environmental footprints onto countries with weaker environmental regulations. The reason is that such behaviour allows the respective country's government and electorate to “have the cake and eat it too”. That is, it allows the government to achieve or maintain political support by blessing the electorate with economic/consumption benefits from free trade and only incurring modest opportunity costs associated with proving forms of environmental quality that voters can see and feel. Trade liberalization thus provides an important channel through which democratic governments can dissociate consumption and production of goods, which allows voters to consume environmentally burdensome goods without having to make compromises on domestic environmental quality. In contrast, we expect that autocratic countries tend to be at the receiving end of the environmental burden shifting process as the political elite can expect to profit from international trade but faces little public pressure to offer high levels of environmental quality. We therefore expect that, all else equal, when signing more PTAs, democratic countries are more likely to offload environmental footprints onto other countries by importing more environmental footprints, and that less democratic countries tend to be at the receiving end of this process by exporting more environmental footprints (Hypothesis 3).
2.4. Embeddedness in international environmental institutions
At the international level, another political factor that could have an impact on environmental burden shifting is countries' embeddedness in international environmental institutions (see also Yoo and Kim, 2016). As Ward notes: “The network of IGOs facilitates deterrence of bad behaviour, mediation and problem-solving, sharing of information and the generation of norms and trust. This raises the possibility that nations' environmental records may relate to their general position in the international system, just as recent work suggests that joint membership of non-trade related IGOs increases trade between pairs of nations.” (2006, 154). Spilker (2012) argues that there are two main mechanisms through which membership in intergovernmental institutions (IGO) can have a positive impact on environmental quality, especially in developing countries. On the one hand, integration into the international system can enhance the willingness of developing countries to improve their environmental performance through issue linkage and the diffusion of environmental interest, irrespective of their political system type. On the other hand, it can augment the capability of countries to foster environmental quality through improved access to resources, knowledge and greener technologies. Using time-series cross-section data for developing countries from 1970 to 2000, Spilker (2012) demonstrates that IGO membership is associated with a reduction in both air pollution and greenhouse gas emissions.
While membership in any type of IGO might be relevant to some extent in our context as well, we presume that participation in international environmental agreements will be more important in terms of moderating the impact of PTAs on environmental footprint exports and imports. The reason is that, somewhat similar to environmental provisions in preferential trade agreements, such agreements provide platforms and mechanisms for information exchange, establish environmental floor standards, and create reputational stakes. We thus hypothesize that, when joining PTAs, countries that participate in more international environmental

agreements are less likely to shift environmental footprints onto other countries, hence importing less environmental footprints, and are less likely to be at the receiving end of such environmental burden shifting by exporting less environmental footprints (Hypothesis 4).
3. Methods Our empirical testing of the hypotheses set forth above focuses on explaining variation in environmental burdens (footprints) as exported in traded goods and thus absorbed by the exporting countries. Conversely, we also focus on explaining imports of environmentally burdensome goods, which implicates offloading of environmental burdens from consumption onto other countries from whom goods are imported. Our sample consists of 183 countries spanning 26 years (1987–2013).
3.1. Dependent variable: ecological footprint
Various measures for environmental burdens (footprints) embodied in trade, our dependent variable, have been proposed (e.g., Lutter et al., 2016; Weinzettel et al., 2013; Peters et al., 2011; Wiedmann et al., 2006).5 We use the ecological footprint measure developed by Rees and Wackernagel (1994). Ecological footprint data is managed and maintained by Global Footprint Network (GFN), a non-profit organization.6 It is to date the most encompassing measure in terms of its spatial and temporal coverage. That is, the ecological footprint measure is available for most countries in the global economy and covers the past few decades.7
The ecological footprint (EF) is an indicator of environmental impact that “represents the critical natural capital requirements of a defined economy or population in terms of the corresponding biologically productive areas” (Wackernagel et al., 1999, 377). By quantifying how much biologically productive land and sea area is necessary to maintain a given consumption pattern (or, for instance, sequester the carbon emissions thereof), the ecological footprint measure captures the human demand on nature (Wiedmann et al., 2006). There are two key measures of ecological footprint: 1) the ecological footprint of consumption and 2) the ecological footprint of a specific product. Thus, unlike many other indicators of environmental impact, this measure takes into account the environmental consequences of both production and consumption.
A country's ecological footprint of consumption is measured in terms of the total area of ‘globally-averaged productive land’ that is required to produce the resources consumed in a country and to absorb the waste generated in the process, using prevailing technology. A country's ecological footprint of consumption is then calculated as the sum of the ecological footprint resulting from production within the country and its imported ecological footprint but minus its exported ecological footprint.8 In this paper, we focus on that last component of this equation, that is, on imports and exports of ecological footprints.
The ecological footprint of a specific item or product is calculated by multiplying the quantity of a product with the amount of land required to produce one unit of the product. In a next step, this land area is then multiplied with factors,9 which account for differences in bioproductivity of land in different parts of the world on the one hand, and for differences in bioproductivity between different land types on the other. The resulting unit of this type of footprint accounting are “global hectares”, which indicate a quantity of land of world average biological productivity.

Based on this methodology, Global Footprint Network provides data on trade-embodied flows of footprint into (imports) and out (exports) of countries. The GFN's source of trade data is the United Nation's Comtrade Database (United Nations Statistics Division, 2018). Accordingly, this data captures differences between the ecological footprint of consumption and the ecological footprint of production and thus speaks to the dissociation of countries' production and consumption patterns. GFN provides annual data for most countries of the world since 1961. We use GFN data on the exports and imports of footprints, transformed as natural logs, for the time period 1987 to 2013. We employ a logarithmic transformation of the dependent variable to facilitate a more intuitive interpretation of the regression coefficients. The analyzed time period starts in 1987 because World Bank lending group records (see below) are not available for earlier years. Ecological footprint data is available up to 2013.
3.2. Independent variables
The first of our key explanatory variables is preferential trade agreements (PTAs). Trade policy choices of countries can be measured in various ways (e.g., Milewicz et al., 2016; Ward, 2006; Simmons and Elkins, 2004). We focus on PTAs since they are the most dynamic form of trade liberalization in the current global economy and also subject to much debate over their environmental implications (Bastiaens and Postnikov, 2017). We use the cumulated number of PTA partner countries of a given country per year, based on an original dataset that includes 500 PTA agreement texts and records key design characteristics of PTAs. This variable is a year-by-year rolling sum, increasing as new PTAs are signed and decreasing when a PTA is ended. In the case of PTAs with more than two countries, when a country enters such an agreement, the rolling sum increases by the number of (other) partner countries in the agreement. Accordingly, when a PTA expires, the rolling sum decreases by that number. Economic actors may not fully anticipate trade policy choices and it may thus take some time for new PTAs to have an effect on a country's economy and environmental conditions. Hence we lag this independent variable by five years (Baier and Bergstrand, 2007). Moreover, using a lagged independent variable helps avoid issues of reverse causality.
To test for differential effects of PTAs on ecological footprint exports and imports by countries at different stages of economic development, we use the World Bank's lending group record as a categorical variable to approximate a country's income level. The records of lending group membership are available from 1987 onwards. The World Bank distinguishes four income groups based on the countries' gross national income (GNI) using the Atlas method at current US-$: a) low-income, b) lower-middle-income, c) upper-middle-income, and d) high-income countries.10 Our categorical variable thus takes on values from 1 (low income) to 4 (high income). Note that a country's income category may change from one year to the next, depending on changes in the countries' gross national income. See Appendix 1 for the current categorization of all countries.11
PTAs differ significantly, as Hypothesis 2 suggests, in their design features, for instance in their level of commitment to environmental protection. Depending on the latter, participation in PTAs may have varying effects on changes in patterns of environmental burden shifting. Our dataset thus also includes information on environmental provisions in PTAs. The variable of interest here is strength of environmental provisions, which measures how elaborate or stringent environmental provisions in a PTA are. The stringency score ranges from 1 (no mention of environment) to 6 (environmental agreement attached to PTA) (see Appendix 2 for further details about the coding of the stringency of environmental provisions). To measure the strength of environmental provisions in PTAs for each country and year, we use the ‘sum of the strength’ of all environmental provisions. We include the number of PTAs as a control variable in our

regression models to make sure that the coefficient of interest only captures the effect of environmental provisions.
To examine the effects of democracy (Hypothesis 3), we use the Polity IV score (Marshall et al., 2014). The Polity IV scale ranges from −10 (full autocracy) to 10 (full democracy) (Munck and Verkuilen, 2002).
To measure countries' embeddedness in international environmental institutions (Hypothesis 4) we include a variable counting countries' memberships in international environmental agreements taken from the International Environmental Agreements Database project (Mitchell, 2018).12 The variable is operationalized as a rolling sum.
Furthermore, we control for the effects of several additional variables. First, we control for the composition of a country's economy using the United Nations Conference and Trade Development (UNCTAD)'s13 records documenting the contribution of the services sector to the country's economic value added. A higher share of the services sector is assumed to be associated with lower footprint exports, as countries shift away from manufacturing, resource extraction, and agriculture. Similarly, with regards to footprint imports, we expect to observe a decrease as technological innovation may substitute for imports. Second, we include the population of a country transformed to natural logs. Countries with larger populations should be more likely to export and import larger quantities of ecological footprints. The World Bank provides population data from 1960 to 2016.14 Third, we include GDP growth. World Bank data on GDP growth is available for the industrialized countries from 1960 to 2016. However, for less developed countries, data availability is not evenly distributed in terms of years. Higher GDP growth should correlate with higher footprint exports and imports, because a faster growing economy is likely to consume and process more natural resources. Finally, also based on World Bank data, we include an inflation dummy variable, which takes on the value 1 if inflation rates exceed 20% in a given year. This variable controls for economic crises. Crises should have a negative effect on footprint exports and imports as countries' economies contract. In particular, footprint imports should be affected by large inflation rates. Availability of data on inflation rates mirrors the availability of other World Bank data (see above). Table 1 shows summary statistics for all variables included in the main analysis.
Table 1. Summary statistics.
Variable N Mean St. Dev. Min Max Footprint exports (log) 4771 14.7 2.6 0.0 20.1 Footprint imports (log) 4771 15.0 2.4 0.0 20.4 PTAs 5 year-lag 3856 13.3 15.9 0.0 98.0 Environmental provisions 5 year-lag 3856 33.7 40.3 0.0 188.0 Democracy (Polity IV) 3913 2.7 7.0 −10.0 10.0 Embeddedness (MEAs) 4659 139.4 104.9 0.0 596.0 Services 4661 55.3 14.3 10.7 88.0 Population (log) 4766 15.5 2.1 9.1 21.0 GDP growth 4528 3.7 6.7 −64.0 150.0 Crisis (binary based on inflation) 4106 0.13 0.34 0 1

3.3. Model specification
To examine the drivers of footprint exports to the rest of the world and footprint imports from the rest of the world, we use a panel consisting of 183 countries from 1987 to 2013. Accordingly, our unit of analysis is ‘country-year’. Because our sample of countries is very heterogeneous and hence likely to include large unobservable differences between countries, we use country-fixed effects in our regression analyses (Bell and Jones, 2015; Clark and Linzer, 2015; Wooldridge, 2002).15 The fixed-effects transformation eliminates any country-specific (time invariant) effects that are not observable. As we have sufficient observations per country, the fixed effects model turns out to be stable. The model, thus, takes the form:
Yi, t presents each country i's level of ecological footprint exports and ecological footprint imports, respectively, in year t. β1 is the coefficient predicting the average effect of our PTA rolling sum variable. The main effect of interest for our study is captured by β2, which is the coefficient of the interaction between additional PTA signatures and countries' income category. It can be interpreted as the effect of PTA signatures for countries of a certain income category relative to the effect of PTA signatures for countries in the reference category (in our case low-income countries). β3 represents the effect of the income category at an average number of PTAs signed. Xi, t is a matrix of all other independent variables for country i at time t, and Ui, t represents the corresponding error term.
The most sophisticated and nuanced testing of our hypotheses would, ideally, be based on dyadic footprint data. However, given data limitations we investigate whether such pollution outsourcing exists using a monadic data structure. As noted above, in our research setting, such an outsourcing of pollution from wealthy industrialized countries to lower-income nations implies that we observe heterogeneous effects of trade liberalization on the flows of exports and imports of ecological footprints across different income groups. In particular, as countries liberalize their trade, we should observe an increase in ecological footprint exports of lower income countries and, conversely, an increase in footprint imports of higher income countries.
4. Results To begin with, we first plot trends in footprint exports and footprint imports by the four income country groups over time. Fig. 1a depicts the average logged footprint exports for high, upper-middle, lower-middle, and low-income countries in the time period from 1987 to 2013. Fig. 1b presents the average logged footprint imports. Average footprint export and footprint import levels are higher in total for countries at higher levels of income. However, their dispersion over time is interesting. In particular, we observe that lower-income countries' averages have increased consistently with respect to footprint imports (Fig. 1b). At the same time, average footprint exports (Fig. 1a) show an upwards trend as well, but the slope of that trend appears to be less steep. The impact of the global financial crisis of 2008 is clearly visible in both panels. Especially footprint exports of low-income countries have not ‘recovered’.

Fig. 1. a: Average footprint exports. b: Average footprint imports.
According to Hypothesis 1, trade liberalization via a higher number of PTAs should increase environmental footprint imports in wealthy countries, which would imply increased offloading of consumption-related environmental burdens onto other countries. Simultaneously, trade liberalization via a higher number of PTAs should lead to increased environmental footprint exports in low-income countries.
To test Hypothesis 1, we estimate the model specified above and report the results in Table 2. In particular, in models 1 and 2, we report the effect of PTAs on ecological footprint exports. In models 3 and 4, we present the effect of trade liberalization on ecological footprint imports. As discussed in the section on our model specification, the main coefficient of interest is the interaction term between the PTA variable and the income category. The purpose of this estimation strategy is to grasp potential heterogeneous effects of PTA signatures on the ecological footprint exports and ecological footprint imports conditional on countries' income group classification. In other words, these interaction terms should allow us to observe if trade liberalization through PTAs has a different effect on ecological footprint exports and imports of lower-middle, upper-middle and high-income countries when compared to low-income countries.
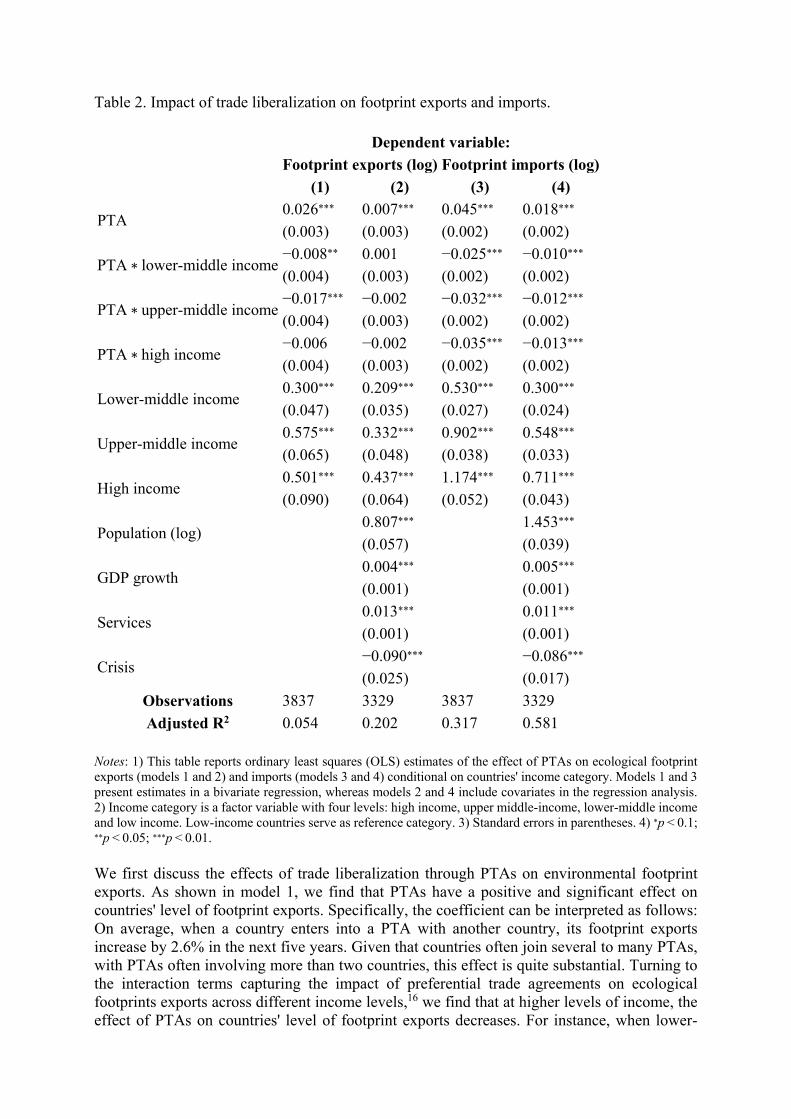
Table 2. Impact of trade liberalization on footprint exports and imports.
Dependent variable:
Footprint exports (log) Footprint imports (log) (1) (2) (3) (4)
PTA 0.026⁎⁎⁎ 0.007⁎⁎⁎ 0.045⁎⁎⁎ 0.018⁎⁎⁎ (0.003) (0.003) (0.002) (0.002)
PTA ∗ lower-middle income −0.008⁎⁎ 0.001 −0.025⁎⁎⁎ −0.010⁎⁎⁎ (0.004) (0.003) (0.002) (0.002)
PTA ∗ upper-middle income −0.017⁎⁎⁎ −0.002 −0.032⁎⁎⁎ −0.012⁎⁎⁎ (0.004) (0.003) (0.002) (0.002)
PTA ∗ high income −0.006 −0.002 −0.035⁎⁎⁎ −0.013⁎⁎⁎ (0.004) (0.003) (0.002) (0.002)
Lower-middle income 0.300⁎⁎⁎ 0.209⁎⁎⁎ 0.530⁎⁎⁎ 0.300⁎⁎⁎ (0.047) (0.035) (0.027) (0.024)
Upper-middle income 0.575⁎⁎⁎ 0.332⁎⁎⁎ 0.902⁎⁎⁎ 0.548⁎⁎⁎ (0.065) (0.048) (0.038) (0.033)
High income 0.501⁎⁎⁎ 0.437⁎⁎⁎ 1.174⁎⁎⁎ 0.711⁎⁎⁎ (0.090) (0.064) (0.052) (0.043)
Population (log) 0.807⁎⁎⁎ 1.453⁎⁎⁎ (0.057) (0.039)
GDP growth 0.004⁎⁎⁎ 0.005⁎⁎⁎ (0.001) (0.001)
Services 0.013⁎⁎⁎ 0.011⁎⁎⁎ (0.001) (0.001)
Crisis −0.090⁎⁎⁎ −0.086⁎⁎⁎ (0.025) (0.017)
Observations 3837 3329 3837 3329 Adjusted R2 0.054 0.202 0.317 0.581
Notes: 1) This table reports ordinary least squares (OLS) estimates of the effect of PTAs on ecological footprint exports (models 1 and 2) and imports (models 3 and 4) conditional on countries' income category. Models 1 and 3 present estimates in a bivariate regression, whereas models 2 and 4 include covariates in the regression analysis. 2) Income category is a factor variable with four levels: high income, upper middle-income, lower-middle income and low income. Low-income countries serve as reference category. 3) Standard errors in parentheses. 4) ⁎p < 0.1; ⁎⁎p < 0.05; ⁎⁎⁎p < 0.01.
We first discuss the effects of trade liberalization through PTAs on environmental footprint exports. As shown in model 1, we find that PTAs have a positive and significant effect on countries' level of footprint exports. Specifically, the coefficient can be interpreted as follows: On average, when a country enters into a PTA with another country, its footprint exports increase by 2.6% in the next five years. Given that countries often join several to many PTAs, with PTAs often involving more than two countries, this effect is quite substantial. Turning to the interaction terms capturing the impact of preferential trade agreements on ecological footprints exports across different income levels,16 we find that at higher levels of income, the effect of PTAs on countries' level of footprint exports decreases. For instance, when lower-

middle income countries sign on a new PTA, this decreases their footprint exports by 0.8% compared to when low-income countries enter a new PTA. This difference increases in size and statistical significance when comparing low-income countries with countries in the upper-middle income group. However, when making the same comparison for low- and high-income countries, we observe that even if high-income countries are relatively less likely to export ecological footprints when signing further PTAs, the coefficient of the interaction term does not reach statistical significance.
Including our set of control variables in the regression (model 2), we observe that the coefficients for both the lower-, and upper-middle-income country groups do not reach conventional statistical significance levels. Overall, however, these findings suggest that compared to ‘wealthier’ countries, less affluent countries tend to engage more in production-related ecological footprint exports as they engage in trade liberalization through PTAs.
In model 3, we estimate the effect of PTAs on ecological footprint imports. We find that trade liberalization through PTAs also has a positive and statistically significant effect on countries' level of footprint imports. In particular, on average, when countries sign on a new PTA with a partner country, this increases their footprint imports by 4.5%. Similar to the pattern observed for countries' footprint imports, we find that at higher levels of income, joining PTAs decreases the likelihood of footprint imports. Specifically, we observe that the effect of a PTA with an additional country on footprint imports is lower for lower-middle income countries than for low-income countries by 2.5%. This difference in the effects of PTAs significantly widens for upper-middle-income and high-income countries. As we add control variables in model 4, the effect sizes on the interaction terms decrease. Nevertheless, the coefficients maintain their statistical significance. Overall, the results for footprint imports do not lend support to Hypothesis 1, since we do not observe an increase in footprint imports for richer countries relative to poorer countries when trade liberalization through PTAs increases.
Looking at the coefficients reported for the control variables in Table 2, larger countries, in terms of their population size, are more likely to export ecological footprints. Furthermore, wealthier countries and faster growing economies are more likely to export ecological footprints. Moreover, footprint exports and imports decrease significantly (by about 9%) as countries face economic crises (defined by inflation rate).17 This pattern is robust with regards to both footprint exports and footprint imports.
The results reported in Table 2 imply the following overall conclusion with respect to Hypothesis 1: First, PTAs correlate with both increased footprint exports and footprint imports. We find partial support for Hypothesis 1 with regard to footprint exports, as wealthier countries appear less likely to export ecological footprints. However, the differences in effects of PTAs for low-income countries versus the other income categories of PTAs are also negative. This finding does not support Hypothesis 1. This result is encouraging insofar as trade liberalization by PTAs does not seem to be a straightforward tool for rich countries to offload environmental burdens unto poor countries. We discuss potential explanations for this finding below. The following sections present the results of our data analysis testing Hypothesis 2, 3 and 4. These arguments focus on factors that should moderate the relationship between PTAs and footprint export and imports.
What is the effect of PTA design characteristics on environmental footprint exports and imports? Hypothesis 2 holds that environmental provisions in PTAs reduce environmental footprint exports and footprint imports of all countries. The analysis resembles the basic model outlined in the Model specification section, apart from the PTA variable being replaced by the

strength of environmental provisions in PTAs. However, we include the number of PTAs as a control variable in our estimations. Table 3 summarizes the results. In model 1, we estimate the effect of environmental provisions on footprint exports, while model 2 estimates the effect of environmental provisions on footprint imports. Similar to the previous analysis, the key variables are the interaction terms between country income groups and the strength of environmental provisions in PTAs. Thus, we aim to investigate if the effects of environmental provisions in PTAs on ecological footprint exports and imports differ by countries' income group.
Table 3. Impact of environmental provisions in PTAs.
Dependent variable:
Footprint exports (log)
Footprint imports (log)
(1) (2)
Environmental provisions 0.003⁎ 0.009⁎⁎⁎ (0.002) (0.001)
Environmental provisions ∗ lower-middle income
0.001 −0.005⁎⁎⁎ (0.001) (0.001)
Environmental provisions ∗ upper-middle income
−0.001 −0.006⁎⁎⁎ (0.001) (0.001)
Environmental provisions ∗ high income −0.001 −0.007⁎⁎⁎ (0.001) (0.001)
PTA 0.002 −0.002 (0.003) (0.002)
Lower-middle income 0.203⁎⁎⁎ 0.322⁎⁎⁎ (0.036) (0.024)
Upper-middle income 0.333⁎⁎⁎ 0.563⁎⁎⁎ (0.049) (0.033)
High income 0.434⁎⁎⁎ 0.746⁎⁎⁎ (0.064) (0.043)
Population (log) 0.762⁎⁎⁎ 1.333⁎⁎⁎ (0.063) (0.043)
GDP growth 0.004⁎⁎⁎ 0.005⁎⁎⁎ (0.001) (0.001)
Services 0.012⁎⁎⁎ 0.010⁎⁎⁎ (0.001) (0.001)
Crisis −0.090⁎⁎⁎ −0.083⁎⁎⁎ (0.025) (0.017)
Observations 3329 3329 Adjusted R2 0.203 0.587
Notes: 1) This table reports ordinary least squares (OLS) estimates of the effect of environmental provisions in PTAs on ecological footprint exports (models 1 and 2) and imports (models 3 and 4) conditional on countries' income category. Models 1 and 3 show estimates in a bivariate regression, whereas models 2 and 4 include

covariates in the regression analysis. 2) Income category is a factor variable with four levels: high income, upper middle-income, lower-middle income and low income. Low-income countries serve as reference category. 3) Standard errors in parentheses. 4) ⁎p < 0.1; ⁎⁎p < 0.05; ⁎⁎⁎p < 0.01.
As shown in model 1, environmental provision strength in PTAs have a small positive effect on ecological footprint exports, which is significant at the 10% level. The coefficients for the interaction term suggest that there are no significant differences in the effect of the strength of environmental provisions on countries' level of footprint exports across different levels of income. These findings, hence, do not lend support to Hypothesis 2. Turning our attention to model 2, we observe that environmental provision strength has a significant and positive impact on footprint imports.
At the same time, the coefficients on the interaction terms between environmental provisions and income suggest that environmental provision strength has a negative effect on footprint imports of lower-middle, upper-middle, and high-income countries when compared to low-income countries. This may be interpreted as partial evidence in support of Hypothesis 2. However, we remain cautious, because both models in Table 3 replicate the basic pattern18 in terms of coefficient signs and coefficient strength from our analysis of Hypothesis 1. Thus, we conclude that the overall evidence does not lend support to Hypothesis 2. We will discuss possible reasons for this unexpected result further below.
How do domestic political institutions condition the relationship between trade liberalization via PTAs and countries' environmental footprint exports and environmental footprint imports? Hypothesis 3 posits that, all else equal, when signing more PTAs, democratic countries are more likely to import environmental footprints from other countries, whereas less democratic countries are more likely to export environmental footprints. To test this argument, we estimate the model outlined in the Model specification section for subgroups of democratic and non-democratic countries. Hence, we can examine if the effect of trade liberalization via PTAs on ecological footprint exports and ecological footprint imports differs by countries' income category and by their political institutions. We use the Polity IV threshold of 6 for ‘democratic’ countries to determine our subgroups. This means that countries with a score equal to or higher than 6 are in the subgroup of democratic countries, whereas countries with a score below 6 are in the subgroup of non-democratic countries.
The results of our analysis are illustrated in Fig. 2.19 Fig. 2a and c refer to the subgroup of democratic countries. In particular, Fig. 2a summarizes the effects of PTAs on ecological footprint exports, whereas Fig. 2c shows the results for ecological footprint imports. Accordingly, Fig. 2b and d summarize the effect of trade liberalization via PTAs on ecological footprint exports (Fig. 2b) and ecological footprint imports (Fig. 2d) for the subgroup of non-democratic countries. As in previous tables, the estimated coefficients for the interaction terms are relative to the reference category of low-income countries.

Fig. 2. Notes: 1) Panels a to d report ordinary least squares (OLS) estimates of the effect of PTAs on ecological footprint exports (Panels a and b) and imports (Panels c and d) conditional on countries' income category. Panels a and c show results for democratic countries, whereas Panels b and d show results for non-democratic countries. 2) Low-income countries serve as reference category. 3) The whiskers around the coefficient estimates report 95% confidence intervals.
We first consider the effects on democratic countries. As shown in Fig. 2a, PTAs have no significant effect on ecological footprint exports. On the contrary, Fig. 2c indicates that PTAs

are associated with significantly larger footprint imports. This observation supports Hypothesis 3 according to which democratic leaders focus on providing environmental public goods domestically and, hence, have an incentive to shift environmental burdens elsewhere. At the same time, we observe in Fig. 2c that the interaction terms between PTAs and income category are not significantly different from zero. This means that in the subgroup of democratic countries, the effect of PTAs on ecological footprint imports does not change as we compare low-income countries to lower-middle, upper-middle, and high-income countries. Hence, the processes at work in democracies seem to be similar regardless of income group.
Turning to the effects on non-democratic countries, we observe some substantial differences between the two groups. First, Fig. 2b illustrates that the effect of trade liberalization via PTAs on ecological footprint exports is positive and statistically significant in non-democracies. Second, we find that the effect differs depending on the income category. Fig. 2b shows that the effect of PTAs on ecological footprint exports is significantly lower for lower-middle, upper-middle and high-income countries than for low-income countries. The results suggest that non-democratic low-income countries are more likely to be at the receiving end of environmental burden shifting through trade liberalization via PTAs than richer non-democratic nations. This finding also relates to the argument underlying Hypothesis 1. Furthermore, we observe a significant and positive effect of PTAs on ecological footprint imports in the subgroup of non-democratic countries (Fig. 2d). This effect is different for low-income countries and the three other income categories. In particular, countries at higher levels of income seem less likely to import ecological footprints, since the coefficients of the interaction between PTAs and the income category are negative and significantly different from 0.
To sum up, the evidence presented in Fig. 2 lends support to Hypothesis 3 insofar as among democracies, trade liberalization via PTAs is associated with larger ecological footprint imports but not with larger ecological footprint exports. Furthermore, we observe both increased ecological footprint exports and ecological footprint imports when non-democratic countries sign PTAs.
Hypothesis 4 shifts our attention to the international level. We expect that countries which participate in more international environmental agreements are less likely to export or import environmental footprints as they liberalize their economies via PTAs. Similar to our strategy for Hypothesis 3, we estimate our main model for two subgroups of countries: a) countries that are strongly embedded in international environmental institutions and b) countries that are weakly embedded in international environmental institutions.20 Our aim is to assess if, besides the income group, embeddedness in international environmental governance moderates the effect of trade liberalization via PTAs on ecological footprint exports and ecological footprint imports.
The results of our analysis are summarized by Fig. 3.21 Fig. 3a and c show the results for the subgroup of strongly embedded countries. For that particular subgroup, Fig. 3a illustrates the effects of PTAs on ecological footprint exports, whereas Fig. 3c depicts the results for ecological footprint imports. Correspondingly for the subgroup of weakly embedded countries, Fig. 3b displays the effect of trade liberalization via PTAs on ecological footprint exports while Fig. 3d shows the effects of PTAs on ecological footprint imports.
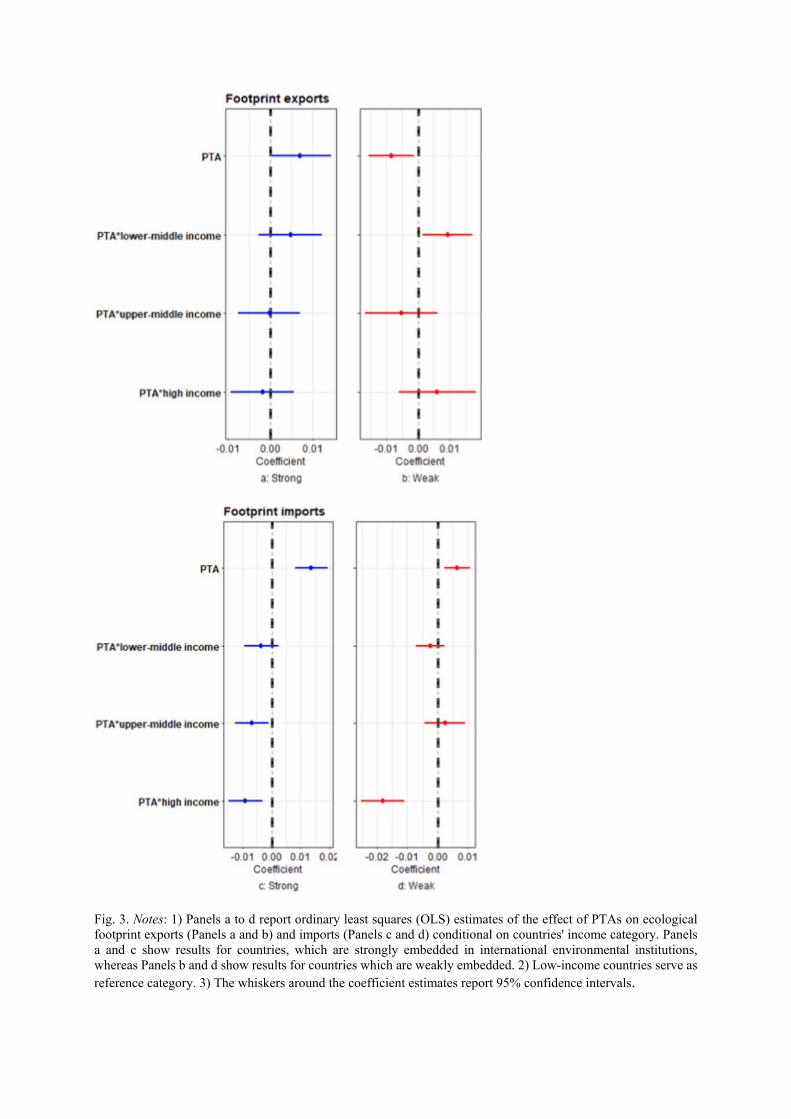
Fig. 3. Notes: 1) Panels a to d report ordinary least squares (OLS) estimates of the effect of PTAs on ecological footprint exports (Panels a and b) and imports (Panels c and d) conditional on countries' income category. Panels a and c show results for countries, which are strongly embedded in international environmental institutions, whereas Panels b and d show results for countries which are weakly embedded. 2) Low-income countries serve as reference category. 3) The whiskers around the coefficient estimates report 95% confidence intervals.

Fig. 3a indicates that for strongly embedded countries trade liberalization via PTAs has no significant effect on ecological footprint exports. In addition, we do not find statistically significant differences between the effects of PTAs on ecological footprint exports across different income categories. With regards to the impact on countries' footprint imports, the results in Fig. 3c show that additional PTA memberships increases footprint imports among strongly embedded countries. Furthermore, we also observe significant differences across different income groups. In particular, at higher levels of income, PTAs decrease the likelihood of footprint imports among countries that are highly embedded in international environmental institutions. Turning to the subgroup of weakly embedded countries, Fig. 3b shows that PTAs are associated with lower ecological footprint exports. The results for the interaction term further suggest that there are virtually no statistically significant differences across different income groups. With regards to the impact on footprint imports, Fig. 3d indicates that PTAs increases the likelihood of footprint imports with additional PTAs among weakly embedded countries. Moreover, we observe that among this group of countries, high-income countries are less likely to increase their footprint imports when they liberalize their economies via PTAs as compared to low-income countries. Overall, even though we do not observe a significant positive relationship between trade liberalization via PTAs and ecological footprint exports among strongly embedded countries, we also do not find clear signs of environmental burden shifting among countries that are only weakly embedded in international environmental institutions. Hence, the evidence by and large does not lend empirical support to Hypothesis 4.
5. Discussion This paper examines whether trade liberalization leads to environmental burden shifting in the global economy. In particular, we focus on whether trade liberalization via PTAs has an effect on exports and imports of ecological footprints. Furthermore, we investigate to what degree PTA design characteristics and domestic and international political institutions interact with the dynamics inherent to the relationship between trade liberalization and flows of ecological footprints.
According to the pollution-haven hypothesis, trade is the main mechanism of dissociation between the production and consumption of goods, and high-income countries consume beyond their ecological boundaries and import natural capital from middle- and low-income countries. As a consequence, trading partner countries at lower levels of income experience trade-induced environmental degradation. We empirically test this argument using data on ecological footprints, which measure the natural capital embodied in trade flows. The environmental burden shifting process as suggested by the pollution-haven hypothesis implies an increase in ecological footprint exports by low-and middle-income countries, as well as an increase in ecological footprint imports by high-income countries with growing trade liberalization.
Using panel data for 183 countries from 1987 to 2013, we find that PTAs increase ecological footprint exports from low-income countries. At the same time, however, we do not find the expected counterpart, which implies a positive effect of PTAs on ecological footprint imports of high-income countries. Hence, the empirical findings only lend partial support to the presumed shifting of environmental burdens from richer to poorer countries as a result of trade-liberalization via PTAs.
The notion that trade liberalization serves as a channel for wealthy countries to shift their environmental impacts to developing countries rests on a zero-sum game perspective of the trade-environment nexus. It assumes an automatism according to which as one country group consumes more natural resources to allow for increasing domestic consumption, this happens

at the expense of the natural resources of another country group. This view may be questionable as it ignores factors such as technological innovation, diffusion of environmental policies, and voluntary commitments to environmental protection measures by companies engaged in cross-border trading that may mitigate such an ‘automatic’ pollution outsourcing process (e.g., Perkins and Neumayer, 2012; Prakash and Potoski, 2006; Prakash and Potoski, 2014; Prakash and Potoski, 2017; Vogel, 1995). In particular, a number of studies show that economic openness facilitates the international diffusion of environmental standards (Birdsall and Wheeler, 1993; Prakash and Potoski, 2006). One mechanism through which this diffusion may occur is the so-called “California effect” (Vogel, 1995). As Vogel argues, “…when rich nations with large domestic markets enact stricter product standards, their trading partners are forced to meet those standards in order to maintain their export markets.” (Vogel, 1995: 6). Since industrialized countries with higher environmental standards import the bulk of developing-country exports, free trade may contribute to increasing environmental standards in developing countries as well.
Examining the impact of PTA design characteristics, our results indicate that the strength of environmental provisions therein does not matter for countries' exports and imports of environmental footprint. One reason for this finding may be that these clauses lack sufficient diplomatic weight to establish reciprocal commitments towards the environment between countries. Alternatively, this finding suggests that these clauses are not comprehensive enough to serve as environmental floor standards (e.g., Morin and Jinnah, 2018; Morin et al., 2018).
In addition to the level of economic development we also investigate how political institutions, both domestic and international, affect the relationship between trade liberalization and environmental footprint flows. We argue that political leaders in both democratic and non-democratic countries seek to reap the economic benefits of free trade. However, in addition to the material trade profits, political elites in democratic countries are also under pressure to provide environmental quality to their electorate. As a consequence, democratic countries should be more likely to shift environmental burdens by importing environmental footprints, while non-democratic countries should be more likely to ‘receive’ environmental burdens and, thus, exporting environmental footprints. Our results support this argument. For democracies, trade liberalization via PTAs correlates with larger footprint imports, but not with footprint exports. On the flip side of the coin, we observe both increased footprint exports and footprint imports when non-democratic countries sign PTAs.
At the international level, our theory argues that international environmental governance efforts provide opportunities for information exchange and effective environmental commitment to countries. Hence, we expect countries that are well-embedded in international environmental governance systems to be less likely to export or import environmental footprints after trade liberalization via PTAs. However, our results do not show clear differences in the effects of trade liberalization via PTAs on ecological footprint flows for different country groups defined by their degree of embeddedness. One explanation for this finding relates to the design of international environmental governance in terms of floor standards. On the one hand, these institutions may not include powerful enough enforcement mechanisms to generate an actual change in participating countries' trade policy and, hence, ‘burden shifting behavior’. On the other hand, it might be that international environmental governance was, and by and large still is, centered on the paradigm of territorial accounting of environmental impacts (e.g., Peters et al., 2011), which in turn would not affect the movements of ecological footprints between countries.

Our study offers new insights that are relevant both from an academic and policy perspective. From an academic perspective, the study takes existing EKC research, which relies mostly on production-based/territorial environmental measures and pays little attention to policy variables, a major step forward by focusing on ecological footprint flows and by examining potential mitigating effects of environmental clauses in trade agreements and embeddedness in international environmental governance efforts. From a policy viewpoint, such results are important because they can contribute to evidence-based policymaking under conditions where decision makers face pressure from various stakeholders and are trying to find policy designs, particularly when setting up PTAs that are both welfare enhancing and environmentally acceptable. The examples of the Transatlantic Trade and Investment Partnership (TIIP) and the EU-Canada Comprehensive Economic and Trade Agreement (CETA) show that this is far from easy and that we urgently need more scientific evidence on these issues (e.g., Bartels, 2017; Gerstetter and Meyer-Ohlendorf, 2013; Karlsson, 2015).
In conclusion, our study provides new insights into the trade-environment nexus from a consumption-based perspective. It also sheds light on the role environmental clauses in PTAs, international environmental agreements, and democratic institutions are playing in this area. The obvious next step in further research should be to move from a monadic to a dyadic dataset structure. This will allow for more nuanced analysis of what types of countries are more likely to export or import environmental footprints to/from which type of other countries under particular boundary conditions set by the provisions of trade agreements and international environmental governance systems. Furthermore, future footprint-based investigations of the trade-environment nexus should pay attention to the growing number of consumption-related data sources of environmental (trade) impacts fit to use for empirical economic research. Although the ecological footprint as calculated by Global Footprint Network is an established measure, other consumption-based empirical approaches to the trade-environment nexus might yield important complementary findings. Finally, it would be very interesting to examine the relationship between trade liberalization and the flow of environmental impacts on a less aggregated level. This could be achieved by studying progressively liberalizing trade agreements such as the North American Free Trade Agreement (NAFTA), identifying the ‘liberalization history’ of particular sectors or industries, and tracing the corresponding development in environmental footprint flows for those sectors.
Acknowledgements We are grateful to three anonymous reviewers and the editors, whose comments have greatly improved this manuscript. We also thank Peter Egger, Dominik Hangartner, Vally Koubi and Stefanie Walter for their suggestions regarding the research design. We thank Michael Hudecheck and Alexia Sotelo Beyza for their research assistance and Global Footprint Network for their cooperation throughout the data collection. The research for this article was funded by the Swiss National Science Foundation's National Research Programme ‘Sustainable Economy’ (NRP73, Grant: 407340_172363/1) and supported by ETH Zürich. We further thank seminar audiences at ETH Zürich for useful comments.

Endnotes 1 Feedback mechanisms (juggernaut effects) ensure that once trade is being liberalized the process continues. “As tariffs come down reciprocally – either multilaterally or regionally – import competing sectors get smaller and typically less influential in trade policy formulation. Similarly, as trade partners lower their tariffs, exporters grow in size and political strength with the improved access to foreign markets” (Baldwin, 2011, 29). 2 E.g., besides harsh verbal criticism, the U.S. government has blocked replacements in the WTO's appellate body. The body currently (March 2018) has only four members and is close to its minimum quorum of three. 3 Annex B of the Kyoto protocol lists countries which have committed to reduce CO2 emissions. These countries generally have high levels of economic development (Peters et al., 2011). 4 As noted by Baghdadi et al. (2013), this is also a key distinguishing characteristic between environmental provisions included in Regional Trade Agreements (RTAs). 5 These footprint measures have focused on different types of ecological impacts. Lutter et al. (2016) use a multi-regional-input-output analysis database to track water footprints (EXIOBASE) which allows attributing water footprint embodied in products consumed in Europe to watersheds worldwide. Similarly, Weinzettel et al. (2013) trace land footprints embodied in trade. Weinzettel et al.'s footprint measure is based on Global Trade Analysis Project (GTAP) data. Peters et al. (2011) focus on the transfer of carbon emissions from 1990 to 2008, demonstrating the disconnect of territorial and consumption-based carbon footprints. Finally, Wiedmann et al. (2006) allocate Wackernagel's footprint account to detailed categories of household consumption in the United Kingdom. 6 For further details, see: https://www.footprintnetwork.org. 7 Although ecological footprints provide valuable insights into countries' demand on nature, there are drawbacks too. First and foremost, ecological footprints quantify environmental impacts at a very high level of aggregation (see Wackernagel, 2009). Hence, it is not possible to differentiate between intermediate products (goods that flow in and out of countries between processing steps) and final consumption (goods that flow into countries to be consumed). 8 EF(Consumption) = EF(Production) + (EF(Import) − EF(Export)). 9 See Ewing et al. (2010, 3) for detailed explanations of this particular footprint accounting methodology. 10 See https://datahelpdesk.worldbank.org/knowledgebase/articles/906519-world-bank-country-and-lending-groups for further details on the classification procedure. 11 The current distribution among the World Bank includes 31 low-income, 53 lower-middle-income, 56 upper-middle-income, and 78 high-income countries. 12 Mitchell (2018) defines international environmental agreements as treaties between at least two governments in a written form, in which states express a ‘consent to be bound’. ‘International’, thus, is used as a synonym to ‘intergovernmental’. The ‘environmental’ condition is fulfilled if the treaty, as its primary purpose, “manages or prevents human impacts on natural resources; plant and animal species, the atmosphere; oceans; rivers; lakes; terrestrial habitats; and other elements of the natural world that provide ecosystem services.” Note that trade agreements cannot fulfil this condition. See: https://iea.uoregon.edu/international-environmental-agreements-ieas-defined, accessed: June 26th 2018. 13 The data source is the UNCTADstat database. See ‘United Nations Conference on Trade and Development’ in the references section. 14 The data source is the World Bank's Development Indicators Database. See ‘World Bank’ in the references section. 15 A Hausman test based on basic fixed- and random-effects models indicates that a random-effects estimator would be biased. 16 The coefficients for the interaction terms between PTAs and income groups are to be understood relative to the effect of PTAs on the dependent variable for the reference category, which in our case are low-income countries. 17 This last result is hardly surprising as the footprint's underlying data is UN Comtrade data for traded goods and trade tends to decrease with high inflation. 18 This also applies to the coefficients of the control variables. 19 See Appendix 3 for detailed regression results. 20 We use the average number of memberships in international environmental institutions to define countries' level of embeddedness. Strongly embedded countries have memberships above the average number of 140 memberships. Weakly embedded countries have an average number of memberships below 140. 21 See Appendix 3 for detailed regression results.

Appendix 1. Current World Bank lending group Low income Lower-middle income Afghanistan Guinea Rwanda Angola Indonesia Philippines Benin Guinea-Bissau Senegal Armenia Jordan São Tomé and Principe Burkina Faso Haiti Sierra Leone Bangladesh Kenya Solomon Islands Burundi North Korea Somalia Bhutan Kiribati Sri Lanka Central African Republic Liberia South Sudan Bolivia Kosovo Sudan Chad Madagascar Tanzania Cabo Verde Kyrgyz Republic Swaziland Comoros Malawi Togo Cambodia Lao PDR Syrian Arab Republic Congo, Dem. Rep Mali Uganda Cameroon Lesotho Tajikistan Eritrea Mozambique Zimbabwe Congo, Rep. Mauritania Timor-Leste Ethiopia Nepal Côte d'Ivoire Micronesia Tunisia Gambia Niger Djibouti Moldova Ukraine Egypt Mongolia Uzbekistan El Salvador Morocco Vanuatu Georgia Myanmar Vietnam Ghana Nicaragua West Bank and Gaza Guatemala Nigeria Yemen, Rep. Honduras Pakistan Zambia India Papua New Guinea Upper-middle income High income Albania Ecuador Nauru Andorra Greece Poland Algeria Fiji Panama Antigua and Barbuda Greenland Portugal American Samoa Gabon Paraguay Aruba Guam Puerto Rico Argentina Grenada Peru Australia Hong Kong Qatar Azerbaijan Guyana Romania Austria Hungary San Marino Belarus Iran, Islamic Rep. Russia Bahamas Iceland Saudi Arabia Belize Iraq Samoa Bahrain Ireland Seychelles Bosnia and Herzegovina Jamaica Serbia Barbados Isle of Man Singapore Botswana Kazakhstan South Africa Belgium Israel Sint Maarten Brazil Lebanon St. Lucia Bermuda Italy Slovak Republic Bulgaria Libya St. Vincent British Virgin Islands Japan Slovenia China Macedonia, FYR Suriname Brunei Darussalam Korea, Rep. Spain Colombia Malaysia Thailand Canada Kuwait St. Kitts and Nevis Costa Rica Maldives Tonga Cayman Islands Latvia St. Martin (French part) Croatia Marshall Islands Turkey Channel Islands Liechtenstein Sweden Cuba Mauritius Turkmenistan Chile Lithuania Switzerland Dominica Mexico Tuvalu Curaçao Luxembourg Taiwan Dominican Republic Montenegro Venezuela, RB Cyprus Macao Trinidad and Tobago Equatorial Guinea Namibia Czech Republic Malta Turks and Caicos Islands Denmark Monaco United Arab Emirates Estonia Netherlands United Kingdom Faroe Islands New Caledonia United States Finland New Zealand Uruguay France Northern Mariana Virgin Islands (U.S.) French Polynesia Norway Germany Oman Gibraltar Palau
Country income groups (World Bank: Data Help Desk).
Access: https://datahelpdesk.worldbank.org/knowledgebase/articles/906519-world-bank-country-and-lending-groups.
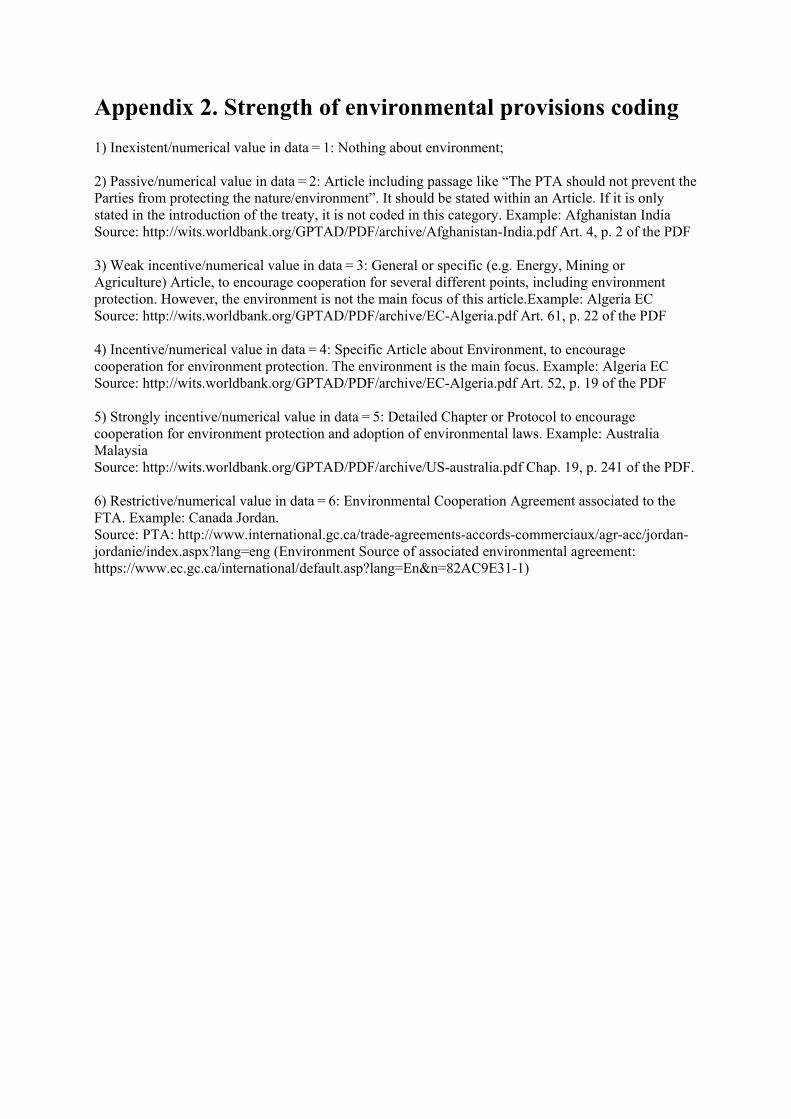
Appendix 2. Strength of environmental provisions coding 1) Inexistent/numerical value in data = 1: Nothing about environment; 2) Passive/numerical value in data = 2: Article including passage like “The PTA should not prevent the Parties from protecting the nature/environment”. It should be stated within an Article. If it is only stated in the introduction of the treaty, it is not coded in this category. Example: Afghanistan India Source: http://wits.worldbank.org/GPTAD/PDF/archive/Afghanistan-India.pdf Art. 4, p. 2 of the PDF 3) Weak incentive/numerical value in data = 3: General or specific (e.g. Energy, Mining or Agriculture) Article, to encourage cooperation for several different points, including environment protection. However, the environment is not the main focus of this article.Example: Algeria EC Source: http://wits.worldbank.org/GPTAD/PDF/archive/EC-Algeria.pdf Art. 61, p. 22 of the PDF 4) Incentive/numerical value in data = 4: Specific Article about Environment, to encourage cooperation for environment protection. The environment is the main focus. Example: Algeria EC Source: http://wits.worldbank.org/GPTAD/PDF/archive/EC-Algeria.pdf Art. 52, p. 19 of the PDF 5) Strongly incentive/numerical value in data = 5: Detailed Chapter or Protocol to encourage cooperation for environment protection and adoption of environmental laws. Example: Australia Malaysia Source: http://wits.worldbank.org/GPTAD/PDF/archive/US-australia.pdf Chap. 19, p. 241 of the PDF. 6) Restrictive/numerical value in data = 6: Environmental Cooperation Agreement associated to the FTA. Example: Canada Jordan. Source: PTA: http://www.international.gc.ca/trade-agreements-accords-commerciaux/agr-acc/jordan-jordanie/index.aspx?lang=eng (Environment Source of associated environmental agreement: https://www.ec.gc.ca/international/default.asp?lang=En&n=82AC9E31-1)

Appendix 3. Regression results H3 and H4
Dependent variable: Footprint exports (log) Footprint imports (log)
Democracy Non-democracy Democracy Non-democracy (1) (2) (3) (4)
PTA −0.005 0.013⁎⁎⁎ 0.009⁎⁎⁎ 0.021⁎⁎⁎ (0.003) (0.003) (0.003) (0.002)
PTA ∗ lower-middle income
0.018⁎⁎⁎ −0.024⁎⁎⁎ −0.002 −0.014⁎⁎⁎ (0.003) (0.004) (0.003) (0.003)
PTA ∗ upper-middle income
0.014⁎⁎⁎ −0.027⁎⁎⁎ −0.004 −0.018⁎⁎⁎ (0.003) (0.005) (0.003) (0.003)
PTA ∗ high income 0.013⁎⁎⁎ −0.021⁎⁎⁎ −0.002 −0.027⁎⁎⁎ (0.004) (0.005) (0.003) (0.003)
Lower-middle income −0.032 0.373⁎⁎⁎ 0.231⁎⁎⁎ 0.273⁎⁎⁎ (0.046) (0.048) (0.037) (0.032)
Upper-middle income 0.147⁎⁎ 0.540⁎⁎⁎ 0.526⁎⁎⁎ 0.540⁎⁎⁎ (0.060) (0.077) (0.048) (0.051)
High income 0.370⁎⁎⁎ 0.371⁎⁎⁎ 0.805⁎⁎⁎ 0.591⁎⁎⁎ (0.073) (0.109) (0.059) (0.072)
Population (log) 0.984⁎⁎⁎ 1.016⁎⁎⁎ 1.452⁎⁎⁎ 1.627⁎⁎⁎ (0.085) (0.087) (0.068) (0.058)
GDP growth 0.007⁎⁎⁎ 0.005⁎⁎⁎ 0.015⁎⁎⁎ 0.002⁎⁎ (0.002) (0.002) (0.001) (0.001)
Services 0.011⁎⁎⁎ 0.013⁎⁎⁎ 0.013⁎⁎⁎ 0.010⁎⁎⁎ (0.002) (0.002) (0.002) (0.001)
Crisis −0.112⁎⁎⁎ 0.029 −0.156⁎⁎⁎ 0.002 (0.029) (0.038) (0.023) (0.025)
Observations 1688 1230 1688 1230 Adjusted R2 0.384 0.190 0.608 0.632
Notes: 1) This table reports ordinary least squares (OLS) estimates of the effect of PTAs on ecological footprint exports (models 1 and 2) and imports (models 3 and 4) conditional on countries' income category. Models 1 and 3 show results for democratic countries, whereas models 2 and 4 show results for non-democratic countries. 2) Income category is a factor variable with four levels: high income, upper middle-income, lower-middle income and low income. Low-income countries serve as reference category. 3) Standard errors in parentheses. 4) ⁎p < 0.1; ⁎⁎p < 0.05; ⁎⁎⁎p < 0.01.

Dependent variable: Footprint exports (log) Footprint imports (log) High
embeddedness Low
embeddedness High
embeddedness Low
embeddedness (1) (2) (3) (4)
PTA 0.007⁎ −0.008⁎⁎ 0.014⁎⁎⁎ 0.007⁎⁎⁎ (0.004) (0.004) (0.003) (0.002)
PTA ∗ lower-middle income
0.005 0.009⁎⁎ −0.003 −0.002 (0.004) (0.004) (0.003) (0.002)
PTA ∗ upper-middle income
−0.0002 −0.005 −0.007⁎⁎ 0.002 (0.004) (0.006) (0.003) (0.003)
PTA ∗ high income
−0.002 0.006 −0.009⁎⁎⁎ −0.018⁎⁎⁎ (0.004) (0.006) (0.003) (0.004)
Lower-middle income
0.205⁎⁎⁎ 0.093⁎ 0.183⁎⁎⁎ 0.210⁎⁎⁎ (0.044) (0.055) (0.034) (0.033)
Upper-middle income
0.429⁎⁎⁎ 0.272⁎⁎⁎ 0.492⁎⁎⁎ 0.218⁎⁎⁎ (0.055) (0.104) (0.042) (0.063)
High income 0.653⁎⁎⁎ −0.092 0.703⁎⁎⁎ 0.056 (0.067) (0.164) (0.052) (0.099)
Population (log) 1.013⁎⁎⁎ 1.157⁎⁎⁎ 1.318⁎⁎⁎ 1.891⁎⁎⁎ (0.096) (0.104) (0.074) (0.062)
GDP growth 0.007⁎⁎⁎ 0.002 0.010⁎⁎⁎ 0.002⁎ (0.002) (0.002) (0.001) (0.001)
Services 0.007⁎⁎⁎ 0.010⁎⁎⁎ 0.013⁎⁎⁎ 0.010⁎⁎⁎ (0.002) (0.002) (0.002) (0.001)
Crisis −0.076⁎⁎ −0.064⁎ −0.100⁎⁎⁎ 0.004 (0.035) (0.035) (0.027) (0.021)
Observations 1792 1488 1792 1488 Adjusted R2 0.220 0.059 0.435 0.539
Notes: 1) This table reports ordinary least squares (OLS) estimates of the effect of PTAs on ecological footprint exports (models 1 and 2) and imports (models 3 and 4) conditional on countries' income category. Models 1 and 3 show results for countries, which are strongly embedded in international environmental institutions, whereas models 2 and 4 show results for weakly embedded countries. 2) Income category is a factor variable with four levels: high income, upper middle-income, lower-middle income and low income. Low-income countries serve as reference category. 3) Standard errors in parentheses. 4) ⁎p < 0.1; ⁎⁎p < 0.05; ⁎⁎⁎p < 0.01.

References Aklin, Michaël, 2016. Re-exploring the trade and environment nexus through the diffusion of pollution. Environ.
Resour. Econ. 64 (4), 663–682. https://doi.org/10.1007/ s10640-015-9893-1. Andersson, J.O., Lindroth, M., 2001. Ecologically unsustainable trade. Ecol. Econ. 37 (1), 113–122.
https://doi.org/10.1016/S0921-8009(00)00272-X. Antweiler, Werner, Copeland, Brian R., Taylor, Scott, 2001. Is free trade good for the environment. Am. Econ.
Rev. 91 (4), 807–908. https://doi.org/10.1257/aer.91.4. 877. Baccini, Leonardo, 2019. The economics and politics of preferential trade agreements. Annu. Rev. Polit. Sci. 22
(1). https://doi.org/10.1146/annurev-polisci-050317070708. Baccini, Leonardo, Dür, Andreas, 2012. The new regionalism and policy interdependence.
Br. J. Polit. Sci. 42 (01), 57–79. https://doi.org/10.1017/S0007123411000238. Baccini, Leonardo, Urpelainen, Johannes, 2012. Strategic side payments: preferential trading agreements,
economic reform, and foreign aid. J. Polit. 74 (4), 932–949. https://doi.org/10.1017/S0022381612000485. Baghdadi, Leila, Martinez-Zarzoso, Inmaculada, Zitouna, Habib, 2013. Are RTA agreements with environmental
provisions reducing emissions? J. Int. Econ. 90 (2), 378–390. https://doi.org/10.1016/j.jinteco.2013.04.001. Baier, Scott L., Bergstrand, Jeffrey H., 2007. Do free trade agreements actually increase members' international
trade? J. Int. Econ. 71 (1), 72–95. https://doi.org/10.1016/j. jinteco.2006.02.005. Baldwin, Richard, 2011. ‘21st Century Regionalism: Filling the Gap between 21st Century Trade and 20th Century
Trade Rules’. Staff Working Paper ERSD No. 2011-0 (May), pp. 1–38. https://doi.org/10.2139/ssrn.1869845. Barrett, Scott, Graddy, Kathryn, 2000. ‘Freedom, Growth, and the Environment’. Environ. Dev. Econ. 5, 433–
456. Bartels, Lorand, 2017. Human Rights, Labour Standards, and Environmental Standards in CETA. vol. 1 Oxford
University Presshttps://doi.org/10.1093/oso/9780198808893. 003.0009. Bastiaens, Ida, Postnikov, Evgeny, 2017. Greening up: the effects of environmental standards in EU and US
trade agreements. Environmental Politics 26 (5), 847–869. https://doi.org/10.1080/09644016.2017.1338213. Bättig, Michèle B., Bernauer, Thomas, 2009. National Institutions and global public goods: are democracies
more cooperative in climate change policy? Int. Organ. 63 (02), 281–308. https://doi.org/10.1017/S0020818309090092.
Bechtel, Michael M., Bernauer, Thomas, Meyer, Reto, 2012. The green side of protectionism: environmental concerns and three facets of trade policy preferences. Rev. Int. Polit. Econ. 19 (5), 837–866. https://doi.org/10.1080/09692290.2011.611054. Beladi, Hamid, Oladi, Reza,
2011. Does trade liberalization increase global pollution? Resour. Energy Econ. 33 (1), 172–178. https://doi.org/10.1016/j.reseneeco.2010.04. 009.
Bell, Andrew, Jones, Kelvyn, 2015. Explaining fixed effects: random effects modeling of time-series cross-sectional and panel data. Polit. Sci. Res. Methods 3 (01), 133–153. https://doi.org/10.1017/psrm.2014.7.
Bernauer, Thomas, Nguyen, Quynh, 2015. Free trade and/or environmental protection? Global Environmental Politics 15 (4), 105–129. https://doi.org/10.1162/GLEP.
Binder, Seth, Neumayer, Eric, 2005. Environmental pressure group strength and air pollution: an empirical analysis. Ecol. Econ. 55 (4), 527–538. https://doi.org/10. 1016/j.ecolecon.2004.12.009.
Birdsall, Nancy, Wheeler, David, 1993. Trade policy and industrial pollution in Latin America: where are the pollution havens? J. Environ. Dev. 2 (1), 137–149. https:// doi.org/10.1177/107049659300200107.
Buitenzorgy, Meilanie, Mol, Arthur P.J., 2011. Does democracy lead to a better environment? Deforestation and the democratic transition peak. Environ. Resour. Econ. 48 (1), 59–70. https://doi.org/10.1007/s10640-010-9397-y.
Chew, Sing, 2001. Accumulation, Urbanization, and Deforestation 3000 B.C.–A.D. 2000. AltaMira Press, Walnut Creek, CA.
Clark, Tom S., Linzer, Drew A., 2015. Should I use fixed or random effects? Polit. Sci. Res. Methods 3 (02), 399–408. https://doi.org/10.1017/psrm.2014.32.
Cole, Matthew, 2004. Trade, the pollution haven hypothesis and environmental Kuznets curve: examining the linkages. Ecol. Econ. 48 (1), 71–81.
Cole, Matthew, Neumayer, Eric, 2005. Environmental policy and the environmental Kuznets curve. In: Dauvergne, Peter (Ed.), Handbook of Global Environmental Policy. Edward Elgar Publishing, pp. 300–318. https://doi.org/10.4337/9781849809412.
Congleton, Roger, 1992. Political institutions and pollution control. Rev. Econ. Stat. 74 (3), 412–421.

Copeland, Brian R., Taylor, M. Scott, 2007. Trade, growth, and the environment. J. Econ. Lit. 42 (1), 7–71. Dai, Mian, Yotov, Yoto V., Zylkin, Thomas, 2014. On the trade-diversion effects of free trade agreements. Econ. Lett. 122 (2), 321–325. https://doi.org/10.1016/j.econlet. 2013.12.024. de Soysa, Indra, Neumayer, Eric, 2005. False Prophet, or Genuine Savior? Assessing the Effects of Economic Openness on Sustainable Development, 1980–99. vol. 59https:// doi.org/10.1017/S0020818305050253. Deacon, Robert, 2003. Dictatorship, Democracy and the Provision of Public Goods’.
Departmental Working Papers. University of California. Deacon, Robert T., 2009. Public good provision under dictatorship and democracy. Public Choice 139 (1–2), 241–
262. https://doi.org/10.1007/s11127-008-9391-x. Dür, Andreas, Baccini, Leonardo, Elsig, Manfred, 2014. The design of international trade agreements:
introducing a new dataset. Rev. Int. Organ. 9 (3), 353–375. https://doi. org/10.1007/s11558-013-9179-8. Egger, Peter, Larch, Mario, 2008. Interdependent preferential trade agreement memberships: an empirical analysis.
J. Int. Econ. 76 (2), 384–399. https://doi.org/10.1016/j. jinteco.2008.08.003. Egger, Peter, Larch, Mario, 2011. An Assessment of the Europe Agreements’ Effects on Bilateral Trade, GDP,
and Welfare’. Eur. Econ. Rev. 55 (2), 263–279. https://doi.org/ 10.1016/j.euroecorev.2010.05.002. Ehrhardt-Martinez, Karen, Crenshaw, Edward M., Jenkins, J. Craig, 2002. Deforestation and the environmental
Kuznets curve: a cross-national investigation of intervening mechanisms. Soc. Sci. Q. 83 (1), 226–243. https://doi.org/10.1111/1540-6237. 00080.
Ekins, P., 1997. The Kuznets curve for the environment and economic growth - examining the evidence. Environ. Plan. 29, 805–830. https://doi.org/10.1068/a290805.
Esty, Daniel C., Porter, Michael E., 2005. National environmental performance: an empirical analysis of policy results and determinants. Environ. Dev. Econ. 10 (4), 391–434. https://doi.org/10.1017/S1355770X05002275.
European Commission, 2015. ‘Closing the Loop - An EU Action Plan for the Circular Economy’. Ewing, Brad, Reed, Anders, Galli, Alessandro, Kitzes, Justin, Wackernagel, Mathis, 2010. Calculation
Methodology for the National Footprint Accounts. Global Footprint Network, Oakland. Freund, Caroline, Ornelas, Emanuel, 2010. Regional Trade Agreements. Annual Review of Economics 2 (1), 139–
166. https://doi.org/10.1146/annurev.economics.102308. 124455. Fugazza, Marco, Nicita, Alessandro, 2013. The direct and relative effects of preferential market access. J. Int.
Econ. 89 (2), 357–368. https://doi.org/10.1016/j.jinteco.2012. 09.001.
Gamso, Jonas, 2017. Trade partnerships and environmental performance in developing countries. J. Environ. Dev. 26 (4), 375–399. https://doi.org/10.1177/ 1070496517729727.
Gerstetter, Christiane, Meyer-Ohlendorf, Nils, 2013. Investor-state dispute settlement under TTIP – a risk for environmental regulation? In: Heinrich Böll Stiftung TTIP Series. Ecologic Institute, Berlin.
Green Growth Knowledge Platform, 2018. Apri. ‘Changing Behaviours, Changing PolicyEvidence on Behavioural Insights for Green Growth’. Geneva.
Grossman, G.M., 2016. The purpose of trade agreements. In: Handbook of Commercial Policy. vol. 1. Elsevier, pp. 379–434. https://doi.org/10.1016/bs.hescop.2016.04. 016.
Grossman, Gene, Kruger, Alan, 1995. Economic growth and the environment. Q. J. Econ. 110 (2), 353–377.
Harbaugh, William T., Levinson, Arik, Wilson, David Molloy, 2002. Reexamining the empirical evidence for an environmental Kuznets curve. Rev. Econ. Stat. 84 (3), 541–551.
He, Jie, 2006. Pollution haven hypothesis and environmental impacts of foreign direct investment: the case of industrial emission of sulfur dioxide (SO2) in Chinese provinces. Ecol. Econ. 60, 228–245. https://doi.org/10.1016/j.eco.
Heil, Mark T., Selden, Thomas M., 2001. Carbon emissions and economic development: future trajectories based on historical experience. Environ. Dev. Econ. 6, 63–83.
Holzinger, Katharina, Knill, Christoph, Sommerer, Thomas, 2008. Environmental policy convergence: the impact of international harmonization, transnational communication, and regulatory competition. Int. Organ. 62 (04), 553. https://doi. org/10.1017/S002081830808020X.
Horn, Henrik, Mavroidis, Petros C., Sapir, André, 2010. Beyond the WTO? An anatomy of EU and US preferential trade agreements. World Econ. 33 (11), 1565–1588. https:// doi.org/10.1111/j.1467-9701.2010.01273.x.
Jara, Alejandro, 2017. The future of globalization under new political realities. Glob. J. Emerg. Mark. Econ. 9 (1–3), 75–85. https://doi.org/10.1177/0974910117747759.
Jorgenson, Andrew A., Rice, James, 2005. Structural dynamics of international trade and material consumption: a cross-national study of the ecological footprints of less-developed countries. Journal of World-Systems Research 11 (1), 57. https://doi.org/10. 5195/jwsr.2005.393.

Kanemoto, K., Moran, D., Lenzen, M., Geschke, A., 2014. International trade undermines national emission reduction targets: new evidence from air pollution. Glob. Environ. Chang. 24 (January), 52–59. https://doi.org/10.1016/j.gloenvcha.2013.09.008.
Karlsson, Mikael, 2015. TTIP and the environment: the case of chemicals policy. Global Affairs 1 (1), 21–31. https://doi.org/10.1080/23340460.2015.977637.
Kellenberg, Derek K., 2009. An empirical investigation of the pollution haven effect with strategic environment and trade policy. J. Int. Econ. 78 (2), 242–255. https://doi. org/10.1016/j.jinteco.2009.04.004.
Kim, Moonhawk, 2012. Ex ante due diligence: formation of PTAs and protection of labor rights. Int. Stud. Q. 56 (4), 704–719. https://doi.org/10.1111/j.1468-2478.2012. 00758.x.
Kleemann, Linda, Abdulai, Awudu, 2013. The impact of trade and economic growth on the environment: revisiting the cross-country evidence. J. Int. Dev. 25 (2), 180–205. https://doi.org/10.1002/jid.1789.
Lechner, Lisa, 2016. The domestic battle over the design of non-trade issues in preferential trade agreements. Rev. Int. Polit. Econ. 23 (5), 840–871. https://doi.org/10. 1080/09692290.2016.1231130.
Li, Quan, Reuveny, Rafael, 2006. Democracy and environmental degradation. Int. Stud. Q. 5, 935–956. Limão, N., 2016. Preferential trade agreements. In: Handbook of Commercial Policy. vol.
1. Elsevier, pp. 279–367. https://doi.org/10.1016/bs.hescop.2016.04.013. Lutter, S., Pfister, S., Giljum, S., Wieland, H., Mutel, C., 2016. Spatially explicit assessment of water embodied
in European trade: a product-level multi-regional inputoutput analysis. Glob. Environ. Chang. 38, 171–182. https://doi.org/10.1016/j. gloenvcha.2016.03.001.
Managi, Shunsuke, Hibiki, Akira, Tsurumi, Tetsuya, 2009. Does trade openness improve environmental quality? J. Environ. Econ. Manag. 58 (3), 346–363. https://doi.org/ 10.1016/j.jeem.2009.04.008.
Mansfield, Edward D., Milner, Helen, 1999. The new wave of regionalism. Int. Organ. 53 (3), 589–627. Mansfield, Edward D., Milner, Helen V., 2012. Votes, Vetoes, and the Political Economy of International Trade
Agreements. Princeton University Press, Princeton [N.J.]. Mansfield, Edward D., Reinhardt, Eric, 2003. Multilateral determinants of regionalism: the effects of GATT/WTO
on the formation of preferential trading arrangements. Int. Organ. 57 (04), 829–862. https://doi.org/10.1017/S0020818303574069.
Marshall, Monty, Ted Gurr, and Keith Jaggers. 2014. ‘Polity IV Project: Political Regime Characteristics and Transitions 1800–2013’. 2014.
Martinez-Zarzoso, Inmaculada, Oueslati, Walid, 2016. Are deep and comprehensive regional trade agreements helping to reduce air pollution? Center for European Governance and Economic Development. https://doi.org/10.2139/ssrn.2864281.
Midlarsky, Manus, 1998. Democracy and the environment: an empirical assessment A. J. Peace Res. 35 (3), 341–361.
Milewicz, Karolina, Hollway, James, Peacock, Claire, Snidal, Duncan, 2016. Beyond trade: the expanding scope of the nontrade agenda in trade agreements. J. Confl. Resolut. 1–31. https://doi.org/10.1177/0022002716662687.
Mitchell, Ronald, 2018. Data From Ronald B. Mitchell. 2002–2018. International Environmental Agreements Database Project (Version 2018.1). http://iea.uoregon. edu/.
Morin, Jean-Frédéric, Jinnah, Sikina, 2018. The untapped potential of preferential trade agreements for climate governance. Environmental Politics 27 (3), 541–565. https:// doi.org/10.1080/09644016.2017.1421399.
Morin, Jean-Frédéric, Rochette, Myriam, 2017. Transatlantic convergence of preferential trade agreements environmental clauses. Business and Politics 19 (04), 621–658. https://doi.org/10.1017/bap.2017.23.
Morin, Jean-Frédéric, Dür, Andreas, Lechner, Lisa, 2018. Mapping the trade and environment nexus: insights from a new data set. Global Environmental Politics 18 (1), 122–139. https://doi.org/10.1162/GLEP_a_00447.
Mosley, Layna, 2017. Labor and the Global Political Economy. vol. 1 Oxford University Presshttps://doi.org/10.1093/acrefore/9780190228637.013.189.
Munck, Gerardo L., Verkuilen, Jay, 2002. Conceptualizing and measuring democracy: evaluating alternative indices. Comparative Political Studies 35 (1), 5–34. https:// doi.org/10.1177/001041400203500101.
Murdoch, James C., Sandler, Todd, Sargent, Keith, 1997. A tale of two collectives: sulphur versus nitrogen oxides emission reduction in Europe. Economica 64 (254), 281. https://doi.org/10.1111/1468-0335.00078.
Neumayer, Eric, 2002. Does trade openness promote multilateral environmental cooperation? World Econ. 25 (6).
Neumayer, Eric, 2017. Environment and trade. In: Richardson, Douglas, Castree, Noel, Goodchild, Michael F., Kobayashi, Audrey, Liu, Weidong, Marston, Richard A. (Eds.), International Encyclopedia of Geography: People, the Earth, Environment and Technology. John Wiley & Sons, Ltd., Oxford, UK, pp. 1–7. https://doi.org/10.1002/ 9781118786352.wbieg0037.

Pearce, David, Warford, Jeremy, 1993. World Without End: Economics, Environment and Sustainable Development. World Bank, Washington D.C.
Perkins, Richard, Neumayer, Eric, 2012. Does the “California effect” operate across borders? Trading- and investing-up in automobile emission standards. Journal of European Public Policy 19 (2), 217–237. https://doi.org/10.1080/13501763.2011. 609725.
Peters, G.P., Minx, J.C., Weber, C.L., Edenhofer, O., 2011. Growth in emission transfers via international trade from 1990 to 2008. Proc. Natl. Acad. Sci. 108 (21), 8903–8908. https://doi.org/10.1073/pnas.1006388108.
Pew Research Center, 2014. Sept. ‘Faith and Skepticism About Trade, Foreign Investment’. www.pewresearch.org.
Prakash, Aseem, Potoski, Matthew, 2006. Racing to the bottom? Trade, environmental governance, and ISO 14001. Am. J. Polit. Sci. 50 (2), 350–364. https://doi.org/10. 1111/j.1540-5907.2006.00188.x.
Prakash, Aseem, Potoski, Matthew, 2014. Global private regimes, domestic public law: ISO 14001 and pollution reduction. Comparative Political Studies 47 (3), 369–394. https://doi.org/10.1177/0010414013509573.
Prakash, Aseem, Potoski, Matthew, 2017. The EU effect: does trade with the EU reduce CO2 emissions in the developing world? Environmental Politics 26 (1), 27–48. https://doi.org/10.1080/09644016.2016.1218630.
Rees, William, Wackernagel, Mathis, Jansson, AnnMari, Hammer, Monica, Folke, Carl, Costanza, Robert, 1994. Ecological footprints and appropriated carrying capacity: measuring the natural capacity requirements of the human economy. In: Investing in Natural Capital. Island Press, Washington D.C..
Rodrik, Dani, 2018. What do trade agreements really do? J. Econ. Perspect. 32 (2), 73–90. https://doi.org/10.1257/jep.32.2.73.
Rothman, Dale S., 1998. Environmental Kuznets curves—real progress or passing the buck? Ecol. Econ. 25 (2), 177–194. https://doi.org/10.1016/S0921-8009(97) 00179-1.
Simmons, Beth, Elkins, Zachary, 2004. The globalization of liberalization: policy diffusion in the international political economy. Am. Polit. Sci. Rev. 98 (1), 171–189.
Spilker, Gabriele, 2012. Helpful organizations: membership in inter-governmental organizations and environmental quality in developing countries. Br. J. Polit. Sci. 42 (02), 345–370. https://doi.org/10.1017/S0007123411000329.
Spilker, Gabriele, Bernauer, Thomas, Umaña, Víctor, 2016. Selecting partner countries for preferential trade agreements: experimental evidence from Costa Rica, Nicaragua, and Vietnam. Int. Stud. Q. 60 (4), 706–718. https://doi.org/10.1093/isq/sqv024.
Spilker, Gabriele, Bernauer, Thomas, Kim, In Song, Milner, Helen, Osgood, Iain, Tingley, Dustin, 2018. Trade at the margin: estimating the economic implications of preferential trade agreements. Rev. Int. Organ. 13 (2), 189–242. https://doi.org/10. 1007/s11558-018-9306-7.
Stern, David I., 2004. The rise and fall of the environmental Kuznets curve. World Dev. 32 (8), 1419–1439. https://doi.org/10.1016/j.worlddev.2004.03.004.
Suri, V., Chapman, D., 1998. Economic growth, trade and the energy: implications for the environmental Kuznets curve. Ecol. Econ. 25, 195–208.
Torras, Mariano, Boyce, James K., 1998. Income, inequality, and pollution: a reassessment of the environmental Kuznets curve. Ecol. Econ. 25 (2), 147–160. https://doi. org/10.1016/S0921-8009(97)00177-8.
United Nations Conference on Trade and Development. n.d. ‘UNCTADstat’. United Nations Statistics Division, 2018. UN Comtrade. Vogel, David. 1995. Trading up: Consumer and Environmental Regulation in a Global Economy. Cambridge,
Mass.: Harvard Univ. Press. Wackernagel, Mathis, 2009. Methodological advancements in footprint analysis. Ecol.
Econ. 68 (7), 1925–1927. https://doi.org/10.1016/j.ecolecon.2009.03.012. Wackernagel, Mathis, Onisto, L., Bello, P., Linares, C., Falfan, I.S.L., Garcia, J.M., Guerrero, I.S., Guerrero,
M.G.S., 1999. National natural capital accounting with the ecological footrpint concept. Ecol. Econ. 29, 375–390.
Ward, Hugh, 2006. International linkages and environmental sustainability: the effectiveness of the regime network. J. Peace Res. 43 (2), 149–166. https://doi.org/10. 1177/0022343306061545.
Weinzettel, Jan, Wood, Richard, 2018. Environmental footprints of agriculture embodied in international trade: sensitivity of harvested area footprint of Chinese exports. Ecol. Econ. 145 (March), 323–330. https://doi.org/10.1016/j.ecolecon.2017.11.013.
Weinzettel, Jan, Hertwich, Edgar G., Peters, Glen P., Steen-Olsen, Kjartan, Galli, Alessandro, 2013. Affluence drives the global displacement of land use. Glob. Environ. Chang. 23 (2), 433–438. https://doi.org/10.1016/j.gloenvcha.2012.12.010.

Wiedmann, Thomas, Minx, Jan, Barrett, John, Wackernagel, Mathis, 2006. Allocating ecological footprints to final consumption categories with input-output analysis. Ecol. Econ. 56 (1), 28–48. https://doi.org/10.1016/j.ecolecon.2005.05.012.
Wiedmann, Thomas O., Schandl, Heinz, Lenzen, Manfred, Moran, Daniel, Suh, Sangwon, West, James, Kanemoto, Keiichiro, 2015. The material footprint of nations. Proc. Natl. Acad. Sci. 112 (20), 6271–6276. https://doi.org/10.1073/pnas.1220362110.
Wooldridge, Jeffrey, 2002. Econometric Analysis of Cross Section and Panel Data. MIT Press, Cambridge, Massachusetts.
World Bank. n.d. ‘World Development Indicators’. World Economic Forum, 2018. ‘Platform for Accelerating the Circular Economy. A Global Public-Private
Collaboration Platform and Project Accelerator.’. Yoo, In Tae, Kim, Inkyoung, 2016. Free trade agreements for the environment? Regional economic integration
and environmental cooperation in East Asia. International Environmental Agreements: Politics, Law and Economics 16 (5), 721–738. https:// doi.org/10.1007/s10784-015-9291-8.