Embed Size (px)
Citation preview

NBER WORKING PAPER SERIES
DID TRADE LIBERALIZATION HELP WOMEN? THE CASE OF MEXICO INTHE 1990S
Ernesto Aguayo-TellezJim Airola
Chinhui Juhn
Working Paper 16195http://www.nber.org/papers/w16195
NATIONAL BUREAU OF ECONOMIC RESEARCH1050 Massachusetts Avenue
Cambridge, MA 02138July 2010
We would like to thank Carolina Villegas-Sanchez for helping us with the programs and we wouldalso like to thank INEGI officials for granting on-site access to the establishment level data used inthis study under the commitment of complying with the confidentiality requirements set by the MexicanLaws and in particular, to Maria Luisa Meza Leon, Lizi Ivette Gonzalez Jimenez and Gabriel RomeroVelasco. The views expressed herein are those of the authors and do not necessarily reflect the viewsof the National Bureau of Economic Research.
NBER working papers are circulated for discussion and comment purposes. They have not been peer-reviewed or been subject to the review by the NBER Board of Directors that accompanies officialNBER publications.
© 2010 by Ernesto Aguayo-Tellez, Jim Airola, and Chinhui Juhn. All rights reserved. Short sectionsof text, not to exceed two paragraphs, may be quoted without explicit permission provided that fullcredit, including © notice, is given to the source.
Did Trade Liberalization Help Women? The Case of Mexico in the 1990sErnesto Aguayo-Tellez, Jim Airola, and Chinhui JuhnNBER Working Paper No. 16195July 2010JEL No. J16,J21,J31,O19,O24,O54
ABSTRACT
With the signing of the North American Free Trade Agreement (NAFTA) in 1994, Mexico entereda bilateral free trade agreement which not only lowered its own tariffs on imports but also loweredtariffs on its exports to the U.S. We find that women’s relative wage increased, particularly duringthe period of liberalization. Both between and within-industry shifts also favored female workers.With regards to between-industry shifts, tariff reductions expanded sectors which were initially femaleintensive. With regards to within-industry shifts, we find a positive association between reductionsin export tariffs (U.S. tariffs on Mexican goods) and hiring of women in skilled blue-collar occupations. Finally, we find suggestive evidence that household bargaining power shifted in favor of women. Expenditures shifted from goods associated with male preference, such as men’s clothing and tobaccoand alcohol, to those associated with female preference such as women’s clothing and education.
Ernesto Aguayo-TellezFacultad de EconomiaUniversidad Autonoma de Nuevo LeonMonterrey, Nuevo Leon C.P. 64930 [email protected]
Jim AirolaDRMINaval Postgraduate SchoolMonterey, CA [email protected]
Chinhui JuhnDepartment of EconomicsUniversity of HoustonHouston, TX 77204-5882and [email protected]
2
I. Introduction
Gender equality, along with ending hunger and poverty, is one of the eight stated goals in
the U.N. Millennium Development Goals Report (UN, 2009). Given that many developing
countries have adopted trade reforms, an important question is whether trade liberalization
policies will further or hinder the goal of gender equality. Furthermore, equity concerns aside,
the effect of liberalization policies on gender outcomes may be of interest from the point of view
of economic growth since there is now growing evidence that empowering women promotes
education and better children’s outcomes (Thomas (1990), Duflo (2000), Qian (2008)). Quoting
from a recent paper by Duflo (2011), “empowerment [of women] can, in other words, accelerate
development.”
In this paper we examine the impact of tariff reductions associated with the signing of the
North American Free Trade Agreement (NAFTA) on gender outcomes in Mexico. Relative to
the existing literature, our paper makes the following contributions. While most papers focus on
the gender wage gap, our paper also examines employment as well as wage changes.2 Using the
labor demand approach taken to study U.S. wage inequality (Katz and Murphy (1992), Berman,
Bound, and Griliches (1994)), we decompose the overall increase in female employment and
wage bill shares into “between” and “within” industry components, and link these changes to
2 Papers which examine the gender wage gap include Brown, Pagan, and Rodriguez-Oreggia (1999) which
decomposes the gap into the component due to differences in characteristics between men and women and the
component due to discrimination. Pagan and Ullibarri (2000) find that the gender gap is larger for older workers,
larger in smaller firms, large in the informal sector, and larger at the border. Sanchez and Pagan (2001) find a large
earnings gap between female and male-owned micro-enterprises which is partly explained by lower levels of
education and experience of female owners although surprisingly, not much is explained by differences in sectoral
composition of female and male-owned businesses. Oostendorp (2004) presents cross-country analysis relating the
gender gap to measures of trade and FDI. The paper finds that trade and FDI inflows reduce the gender gap among
low skilled occupations while results are mixed for high skilled occupations. A recent volume, Bussolo and De
Hoyos (2009) also examine the link between trade liberalization and poverty through the channel of women’s labor
market outcomes.
3
tariff changes across sectors. Finally, ours is the first paper we are aware of that examines
household expenditure patterns to assess changes in women’s well-being as well as income.
What are some possible theoretical links between trade liberalization policies and gender
outcomes? If men and women are imperfect substitutes in production, the labor demand
framework that has been used for skill demand can be applied to discuss and quantify relative
demand for female workers.3 In this framework, industries utilize male and female workers in
different intensities, and trade liberalization, by affecting the relative size of industries, will
generate demand shifts by gender. For this to be an important channel, we should observe
substantial labor re-allocation towards those sectors which are female-intensive.4
Another channel through which trade liberalization policies can affect gender outcomes is
through technology. In an effort to explain rising wag inequality within industries as result of
trade liberalization, recent theoretical papers in trade have built models with product
differentiation, increasing returns, and heterogeneity across firms (Melitz (2003), Yeaple
(2005)). In these models, tariff reductions encourage the more productive firms to enter the
export sector. Verhoogen (2008) and Bustos (2011) show that these exporting firms also
upgrade quality and technology, thereby increasing the demand for skilled workers. While most
of the focus in the literature has been on the impact of technology on skill demand, technology
upgrading may also complement female workers by being complementary with cognitive skills
and reducing the demand for physical skills.5 Juhn, Ujhelyi and Villegas-Sanchez (2012)
3 See for example, Katz and Murphy (1992), Bound and Johnson (1992), Berman, Bound, and Griliches (1994).
This framework is adopted by Acemoglu, Autor, and Lyle (2004) who examine the impact of WWII mobilization
rates on female labor supply and consequently on their relative wage. Their estimates of the elasticity of substitution
between men and women suggest that “men and women are close but far from perfect substitutes.” 4 Alternatively, one may assume that men and women are perfect substitutes in production but women have lower
levels of skill. This is the assumption, for example, in Bussolo and De Hoyos (2009) ). There is little evidence,
however, that trade liberalization raised relative wages and employment of less skilled workers. 5 Galor and Weil (1996) and Welch (2000) explore the notion that women have advantage in cognitive vs. physical
skills and that advances in technology increase the relative demand for women over time. Using U.S. data,
4
consider a model where men and women differ in terms of their capacity to perform physically
demanding tasks. In their model, the introduction of new technology lowers the need for
physical skills thereby benefitting women. They find that firms which upgraded technology also
shifted towards hiring more female workers in blue-collar jobs, but not white-collar jobs. To the
extent that exports and technology upgrading is an important channel, we should observe shifts
towards female labor within sectors, and this type of activity should be concentrated in sectors
with larger export tariff reductions.
A third channel is through the reduction of discrimination brought about by foreign
competition. Building on the insight of Becker (1957), Black and Brainerd (2002) report that
U.S. industries which were subject to more competition through trade experienced greater
reductions in the gender wage gap.6 A recent paper by Ederington, Minier, and Troske (2010)
find that trade liberalization in Colombia increased employment of women relative to men in
blue-collar occupations—a change the authors attribute to increased product market competition
and reductions in employer discrimination. This channel suggests that we should observe a
systematic relationship between reductions in import tariffs and female wages and hiring. We
examine each of these channels in our empirical work.
To summarize our findings, we find that trade liberalization policies improved women’s
labor market outcomes in Mexico. First, relative wages of women increased even as employment
rates increased, and this pattern is particularly pronounced during the trade liberalization period,
1990 to 2000. In contrast to studies conducted in the U.S. (Berman, Bound and Griliches (1994))
and Mexico in an earlier period (Revenga (1997), Hanson and Harrison (1999)), we find
Weinberg (2000) shows that female employment growth is positively related to computer-use across industries and
occupations. Also using U.S. data and Dictionary of Occupation Titles (DOT) Rendall (2010) shows that
occupations which are more “brain” intensive have expanded over time, favoring female workers. 6Artecona and Cunningham (2002) employ the same methods for Mexico but do not find a significant relationship
between tariff changes and reductions in the gender wage gap across industries.
5
evidence of substantial labor reallocation across industries, shifting employment towards initially
female-intensive sectors. Between-industry shifts, usually thought to be consistent with trade-
based explanations, account for up to 40 percent of the increase in wage bill share of women
from 1990 to 2000. Comparing across industries, we find that tariff reductions were positively
related to industry growth and concentrated in initially female-intensive industries. We also find
evidence that within-industry shifts favored women. Using establishment-level data for the
manufacturing sector we find that larger declines in export tariffs (U.S. tariffs on Mexican
goods) are associated with larger increases in wage bill shares of women in skilled blue-collar
occupations. This result suggests that the exports and technology channel emphasized in the
recent trade literature may be important for explaining gender outcomes as well as skill
premiums. We find a much weaker relationship between reductions in import tariffs and female
wage bill shares, however, suggesting that reductions in discrimination brought about by trade
liberalization played a relatively minor role in the Mexican case.
Women’s relative earnings increased but are they necessarily better off? We end with
suggestive evidence that women’s bargaining power within the household improved along with
their relative earnings. Household expenditures shifted from goods associated with male
preference, such as men’s clothing and tobacco and alcohol, to those associated with female
preference such as education and women’s clothing.
This paper is organized as follows. Section II briefly describes the trade liberalization
policies behind the signing of NAFTA. Section III examines aggregate changes in relative
wages and employment of women. Section IV examines between and within industry shifts and
their associations with tariff changes. Section V reports the results on household expenditure
patterns. Section VI concludes.
6
II. Mexico’s Trade Liberalization under NAFTA
Mexico implemented unilateral tariff reductions in the 1980s to join the GATT in 1986.
By 1987, the highest tariff was reduced to 20% and the tariff structure was simplified to include
only 5 different rates: 0%, 5%, 10%, 15%, 20%. Starting in 1990, Mexico’s opening strategy
switched to pursuing bilateral free trade agreements, with the most important being the North
American Free Trade Agreement (NAFTA) with U.S. and Canada which took effect in 1994.
NAFTA reduced tariff rates with the U.S. from a maximum of 20% to zero in 15 years and many
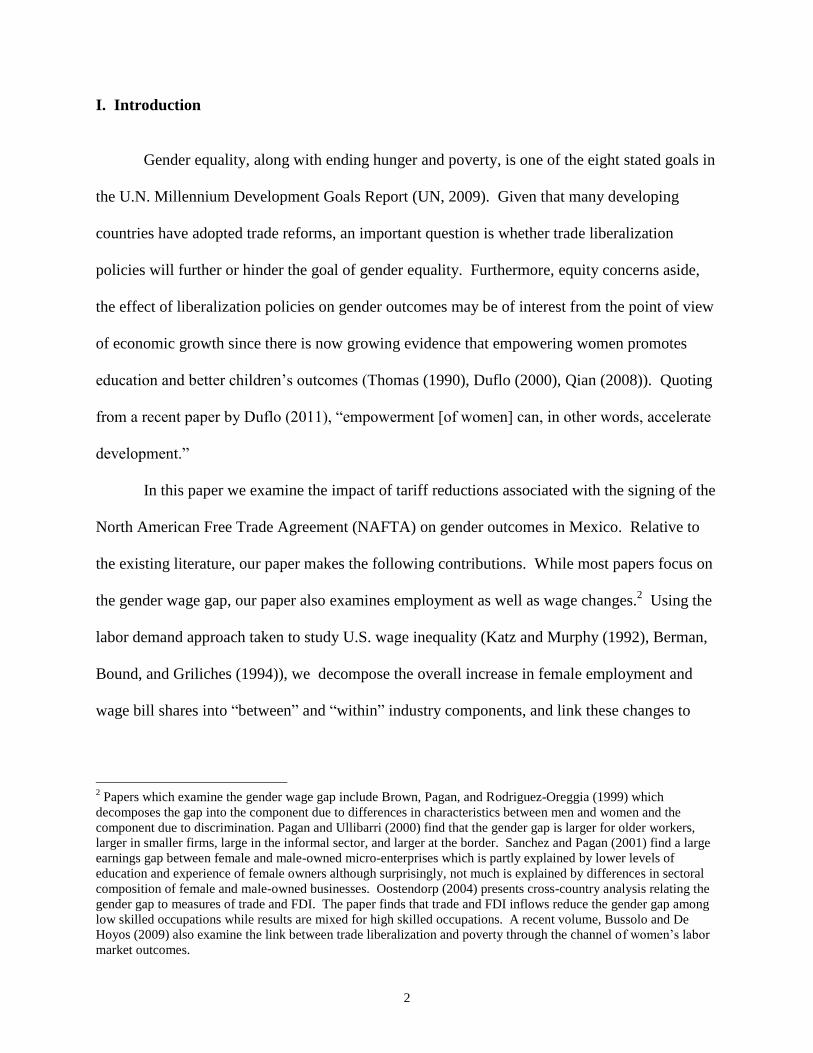
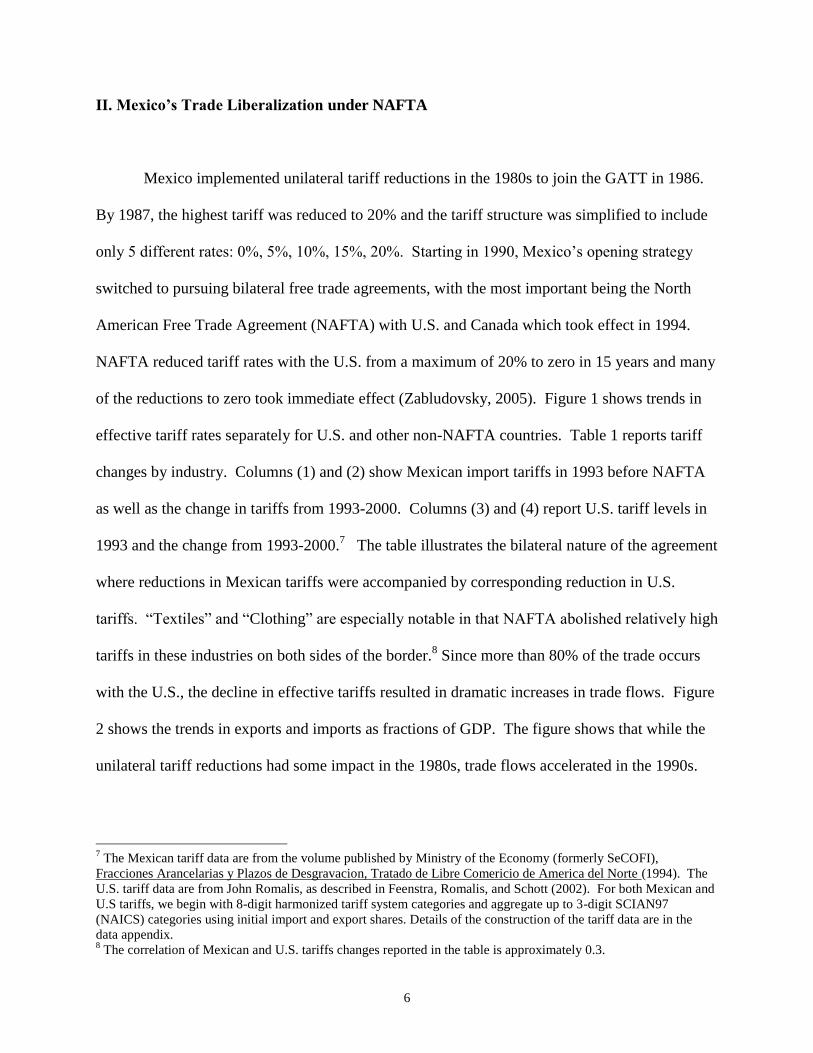
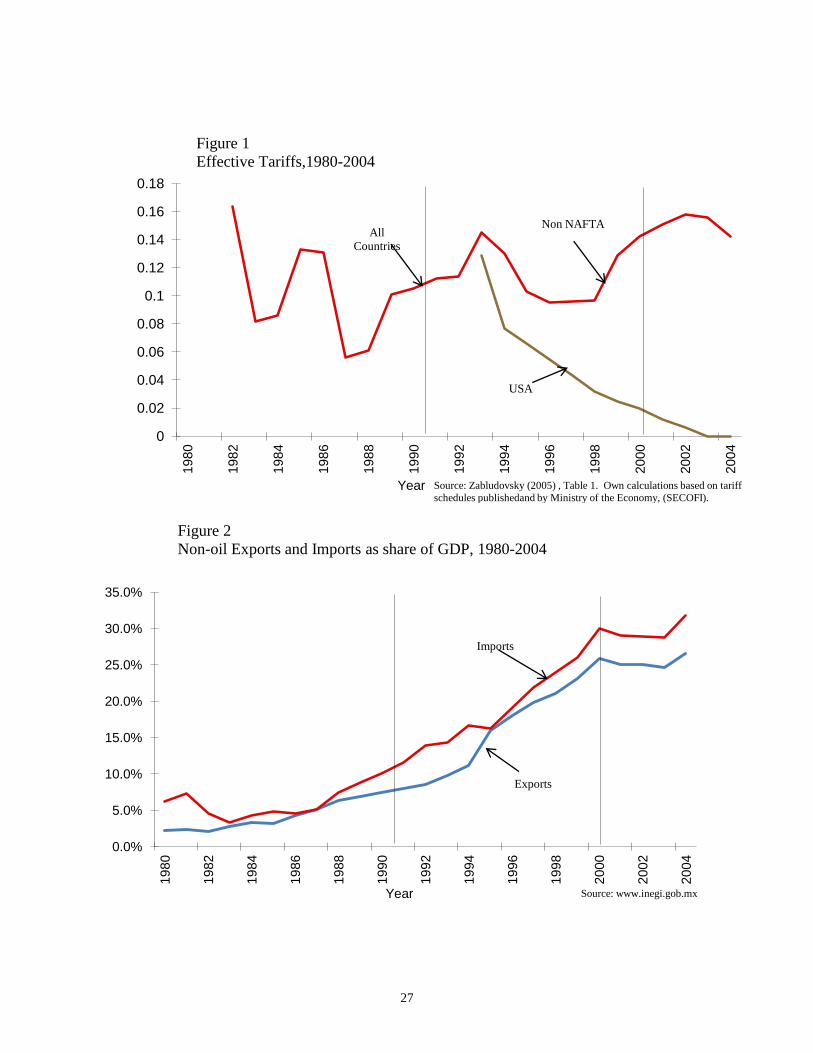
of the reductions to zero took immediate effect (Zabludovsky, 2005). Figure 1 shows trends in
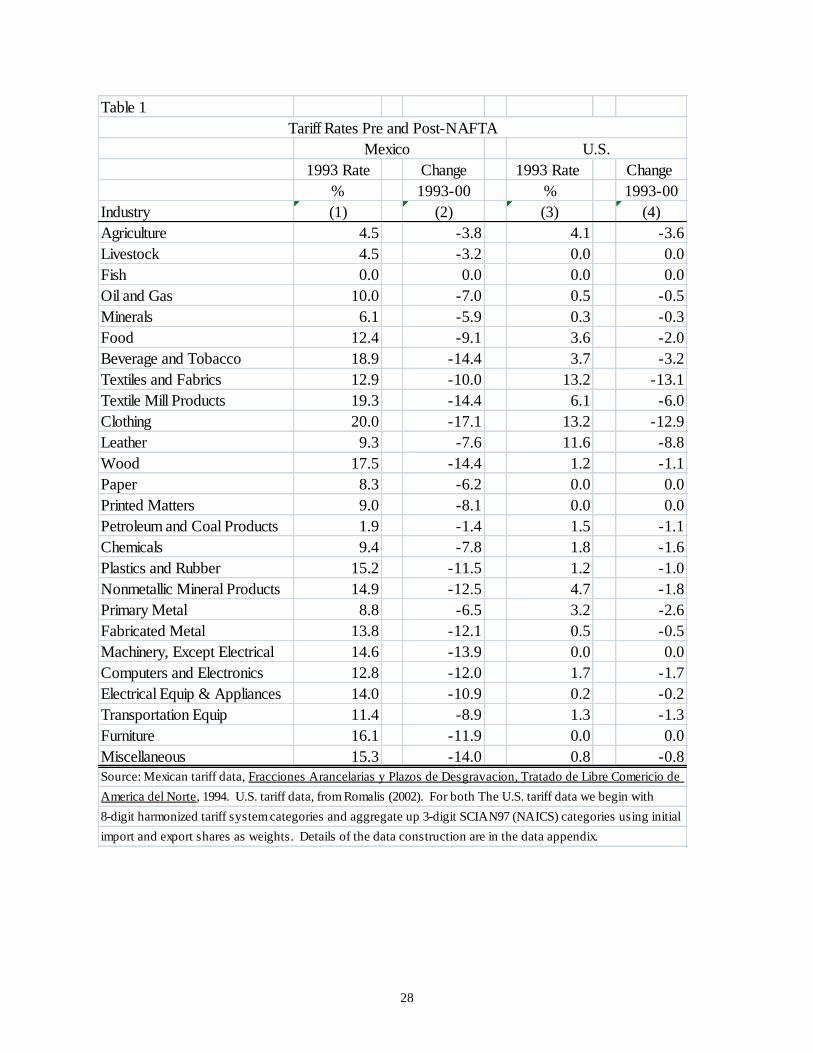
effective tariff rates separately for U.S. and other non-NAFTA countries. Table 1 reports tariff
changes by industry. Columns (1) and (2) show Mexican import tariffs in 1993 before NAFTA
as well as the change in tariffs from 1993-2000. Columns (3) and (4) report U.S. tariff levels in
1993 and the change from 1993-2000.7 The table illustrates the bilateral nature of the agreement
where reductions in Mexican tariffs were accompanied by corresponding reduction in U.S.
tariffs. “Textiles” and “Clothing” are especially notable in that NAFTA abolished relatively high
tariffs in these industries on both sides of the border.8 Since more than 80% of the trade occurs
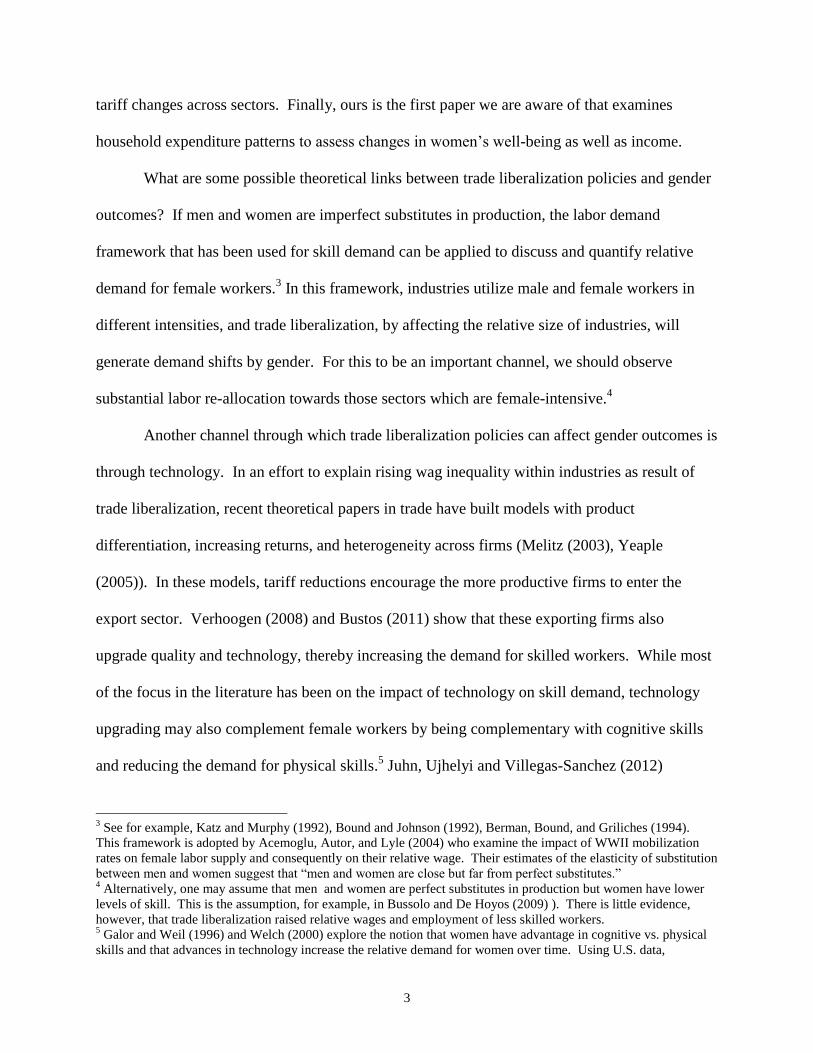
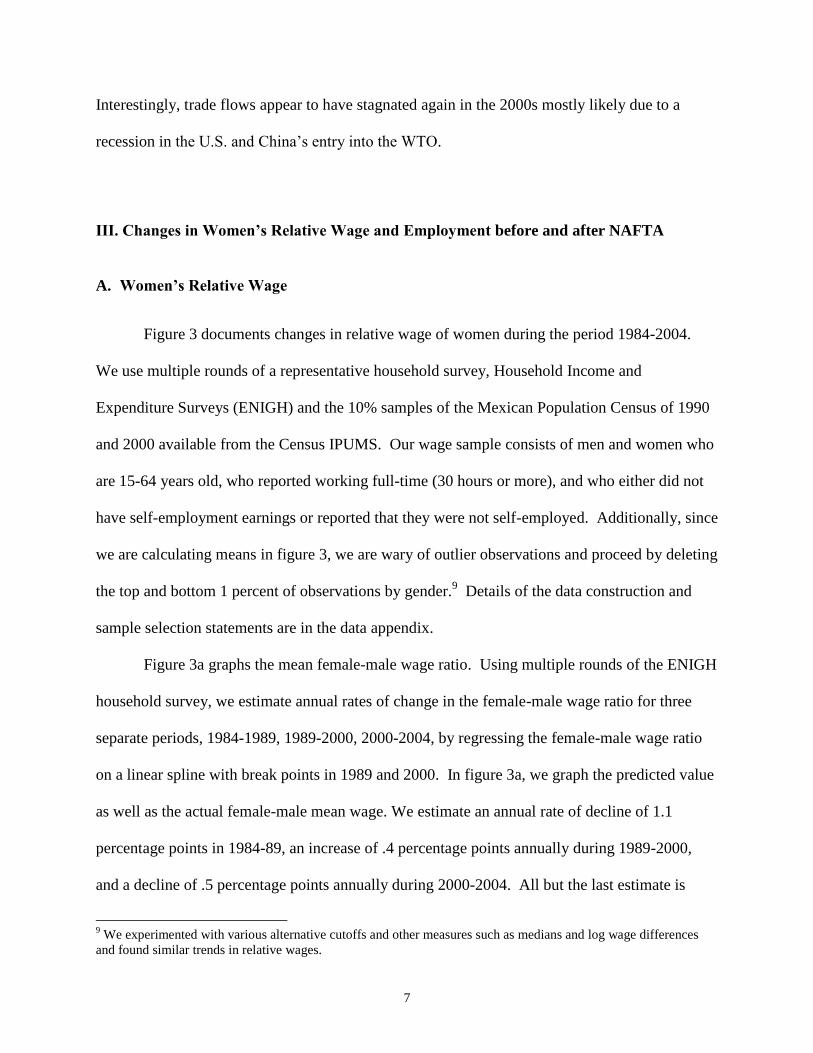
with the U.S., the decline in effective tariffs resulted in dramatic increases in trade flows. Figure
2 shows the trends in exports and imports as fractions of GDP. The figure shows that while the
unilateral tariff reductions had some impact in the 1980s, trade flows accelerated in the 1990s.
7 The Mexican tariff data are from the volume published by Ministry of the Economy (formerly SeCOFI),
Fracciones Arancelarias y Plazos de Desgravacion, Tratado de Libre Comericio de America del Norte (1994). The
U.S. tariff data are from John Romalis, as described in Feenstra, Romalis, and Schott (2002). For both Mexican and
U.S tariffs, we begin with 8-digit harmonized tariff system categories and aggregate up to 3-digit SCIAN97
(NAICS) categories using initial import and export shares. Details of the construction of the tariff data are in the
data appendix. 8 The correlation of Mexican and U.S. tariffs changes reported in the table is approximately 0.3.
7
Interestingly, trade flows appear to have stagnated again in the 2000s mostly likely due to a
recession in the U.S. and China’s entry into the WTO.
III. Changes in Women’s Relative Wage and Employment before and after NAFTA
A. Women’s Relative Wage
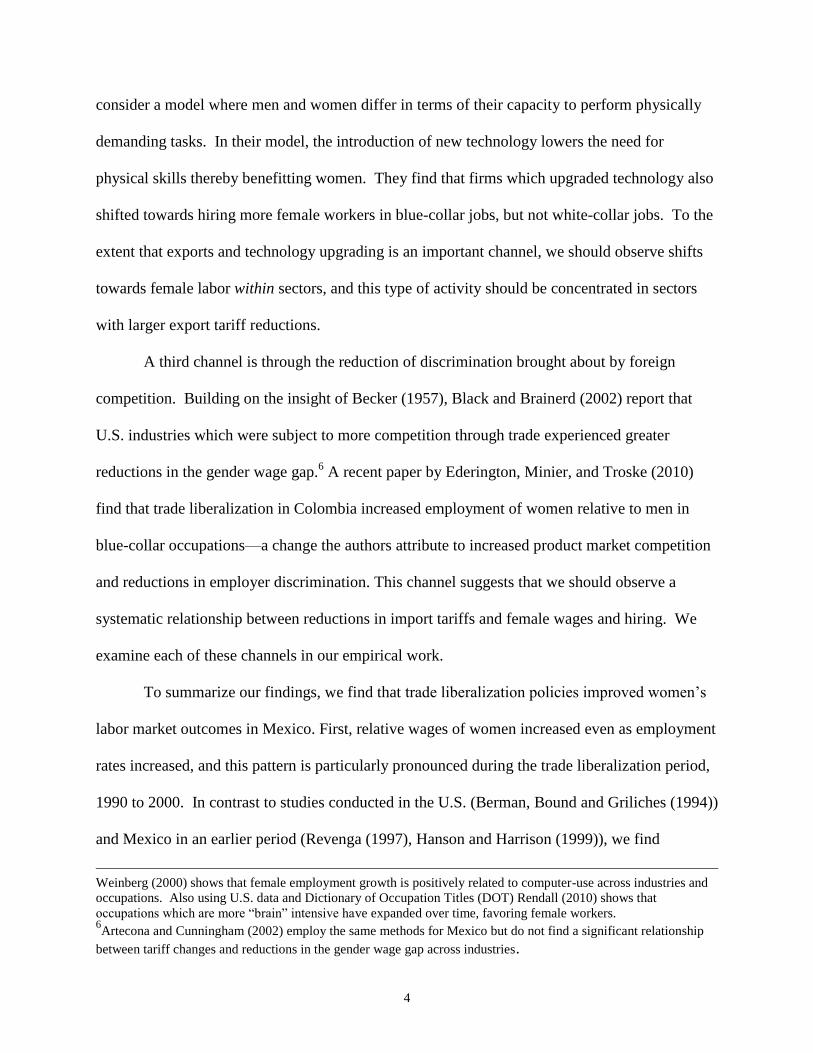
Figure 3 documents changes in relative wage of women during the period 1984-2004.
We use multiple rounds of a representative household survey, Household Income and
Expenditure Surveys (ENIGH) and the 10% samples of the Mexican Population Census of 1990
and 2000 available from the Census IPUMS. Our wage sample consists of men and women who
are 15-64 years old, who reported working full-time (30 hours or more), and who either did not
have self-employment earnings or reported that they were not self-employed. Additionally, since
we are calculating means in figure 3, we are wary of outlier observations and proceed by deleting
the top and bottom 1 percent of observations by gender.9 Details of the data construction and
sample selection statements are in the data appendix.
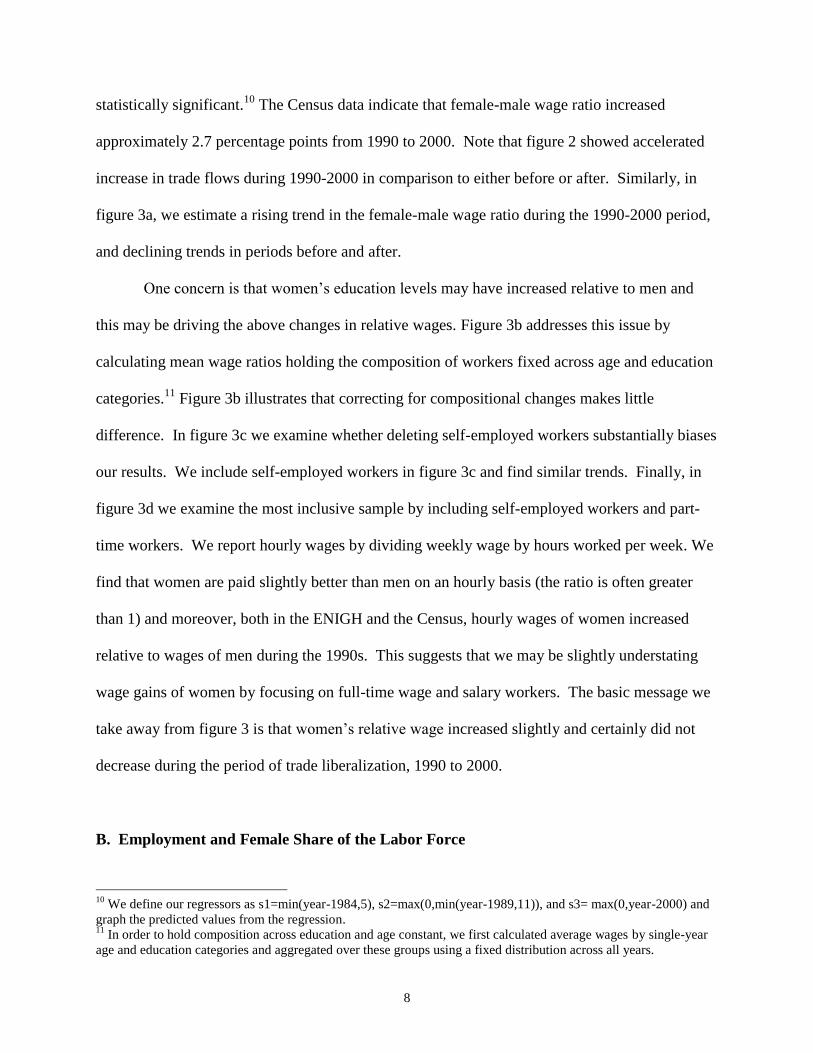
Figure 3a graphs the mean female-male wage ratio. Using multiple rounds of the ENIGH
household survey, we estimate annual rates of change in the female-male wage ratio for three
separate periods, 1984-1989, 1989-2000, 2000-2004, by regressing the female-male wage ratio
on a linear spline with break points in 1989 and 2000. In figure 3a, we graph the predicted value
as well as the actual female-male mean wage. We estimate an annual rate of decline of 1.1
percentage points in 1984-89, an increase of .4 percentage points annually during 1989-2000,
and a decline of .5 percentage points annually during 2000-2004. All but the last estimate is
9 We experimented with various alternative cutoffs and other measures such as medians and log wage differences
and found similar trends in relative wages.
8
statistically significant.10
The Census data indicate that female-male wage ratio increased
approximately 2.7 percentage points from 1990 to 2000. Note that figure 2 showed accelerated
increase in trade flows during 1990-2000 in comparison to either before or after. Similarly, in
figure 3a, we estimate a rising trend in the female-male wage ratio during the 1990-2000 period,
and declining trends in periods before and after.
One concern is that women’s education levels may have increased relative to men and
this may be driving the above changes in relative wages. Figure 3b addresses this issue by
calculating mean wage ratios holding the composition of workers fixed across age and education
categories.11
Figure 3b illustrates that correcting for compositional changes makes little
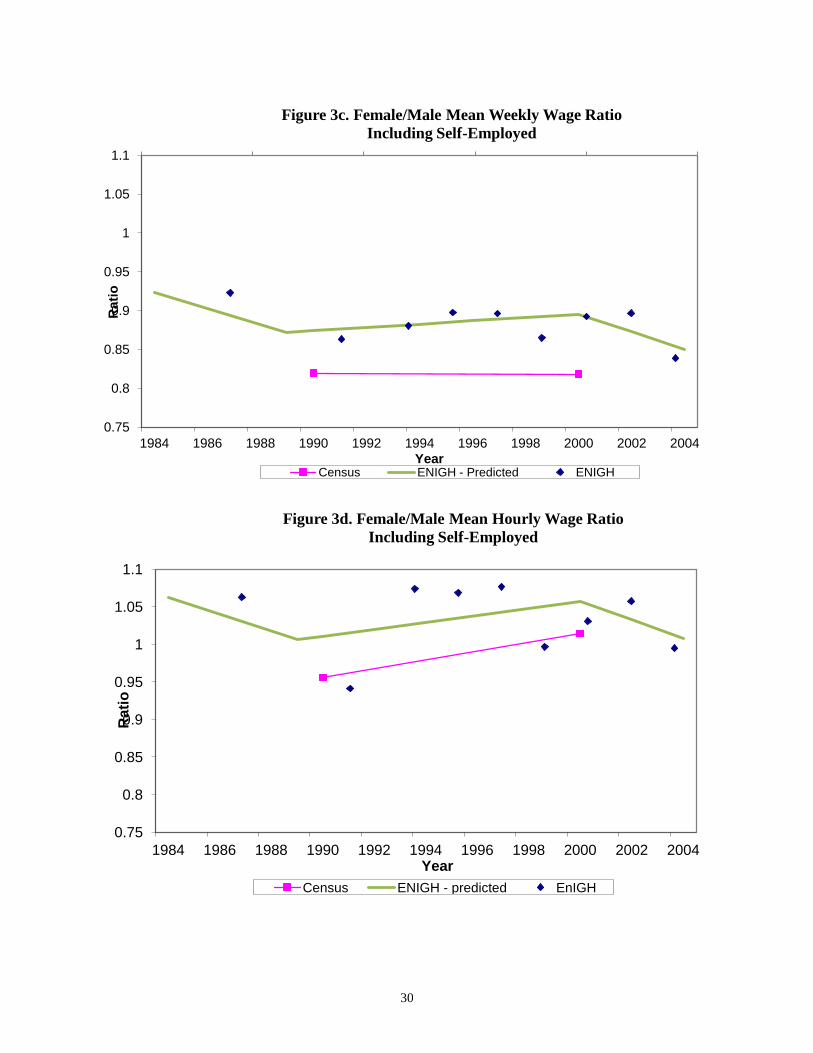
difference. In figure 3c we examine whether deleting self-employed workers substantially biases
our results. We include self-employed workers in figure 3c and find similar trends. Finally, in
figure 3d we examine the most inclusive sample by including self-employed workers and part-
time workers. We report hourly wages by dividing weekly wage by hours worked per week. We
find that women are paid slightly better than men on an hourly basis (the ratio is often greater
than 1) and moreover, both in the ENIGH and the Census, hourly wages of women increased
relative to wages of men during the 1990s. This suggests that we may be slightly understating
wage gains of women by focusing on full-time wage and salary workers. The basic message we
take away from figure 3 is that women’s relative wage increased slightly and certainly did not
decrease during the period of trade liberalization, 1990 to 2000.
B. Employment and Female Share of the Labor Force
10
We define our regressors as s1=min(year-1984,5), s2=max(0,min(year-1989,11)), and s3= max(0,year-2000) and
graph the predicted values from the regression. 11
In order to hold composition across education and age constant, we first calculated average wages by single-year
age and education categories and aggregated over these groups using a fixed distribution across all years.
9
We next examine changes in employment to population ratios of women and men as well
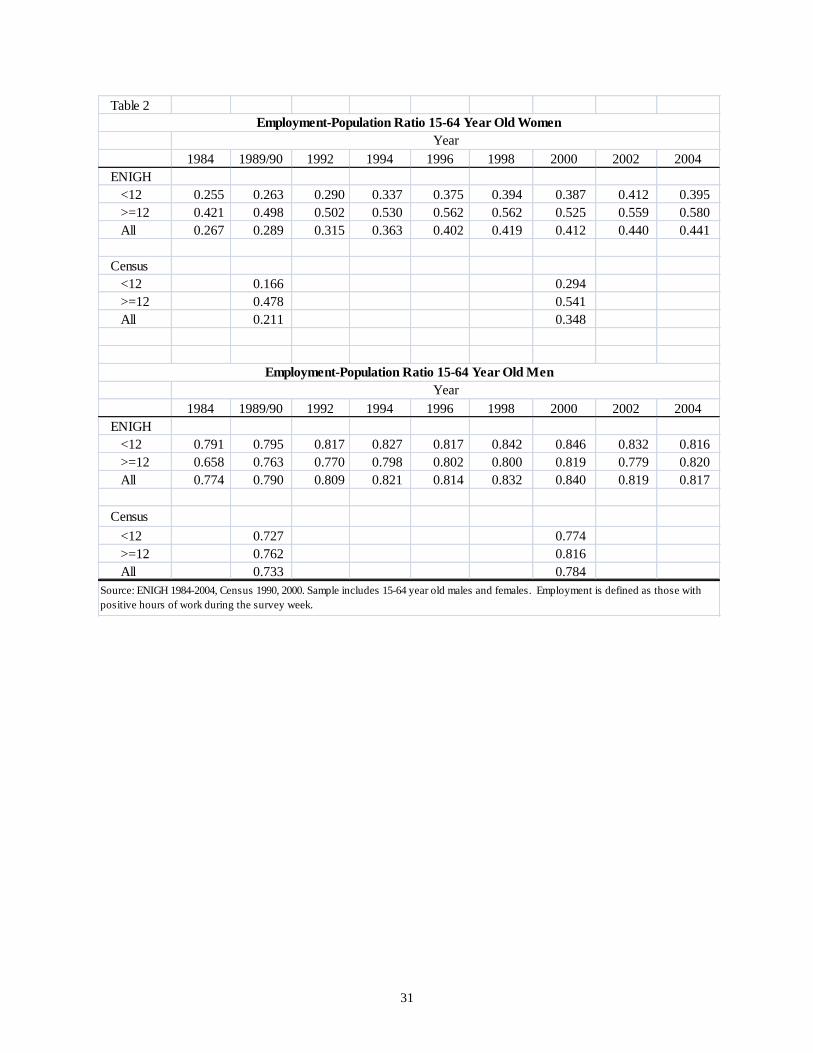
as changes in the female share of the labor force. Table 2 reports the employment to population
ratios of women (top panel) and men (bottom panel) who are 15-64 years old. Employment rates
(especially of women) are much lower in Mexico than the rates observed in developed countries.
For example, the ratio for comparable women in the U.S. during this period would be .60 and
higher, while in Mexico the rate is still only .44 in 2004. Employment rates did rise rapidly for
women, however, over the entire period, while employment of men increased much more
modestly. Over the 1990s, the employment-population ratio of women increased 12.3
percentage points (ENIGH) and 13.4 percentage points (Census) in the two surveys.
Table 3 describes the changes in female share of the labor force. Top panel reports
shares based on the ENIGH while the bottom panel refers to data from the Census. Panel A
reports female share of total hours worked. Panel B reports labor shares in efficiency units.12
Focusing on the Census-based results in the bottom panel, the table shows that both measures of
female labor share increased by approximately 5 percentage points with the change in hours
shares being slightly larger.
The decline in the female/male wage ratio from 1984 to 1989 is consistent with the
increase in the relative supply of women where rapid entry of women led to a decline in own
wage. Over the period, 1989-2000, relative wage of women increased even as their labor share
increased. Taken together, the evidence on the gender wage gap and relative supplies suggest
that relative demand for women must have increased. In the special case of Cobb-Douglas
production where the elasticity of substitution between male and female labor equals one, we
can interpret changes in female wage bill share as an increase in relative demand for female labor
12
To calculate shares in efficiency units, we weight hours by the group specific average wage which is fixed over
years. In addition to men and women, we define 10 five-year age groups and 5 education groups.

10
(see Autor and Katz (1999)). Wage bill shares are reported in Panel C and the table shows that
wage bill shares of women also increased by approximately 5 percentage points.13
The evidence
on the last period, 2000-2004, is mixed. On the one hand, relative wage declined. Table 3
shows, however, that women’s labor share increased most rapidly over this period and taken
together, wage bill share also increased. Interestingly, the increase in wage bill share since the
year 2000 was entirely due to educated women, those with at least 12 years of schooling. Wage
bill shares of women with less than 12 years of schooling actually declined 2000-2004.
IV. Women’s Labor Market Outcomes and Trade Liberalization
A. Between-Industry Shifts in Female Wage Bill Share
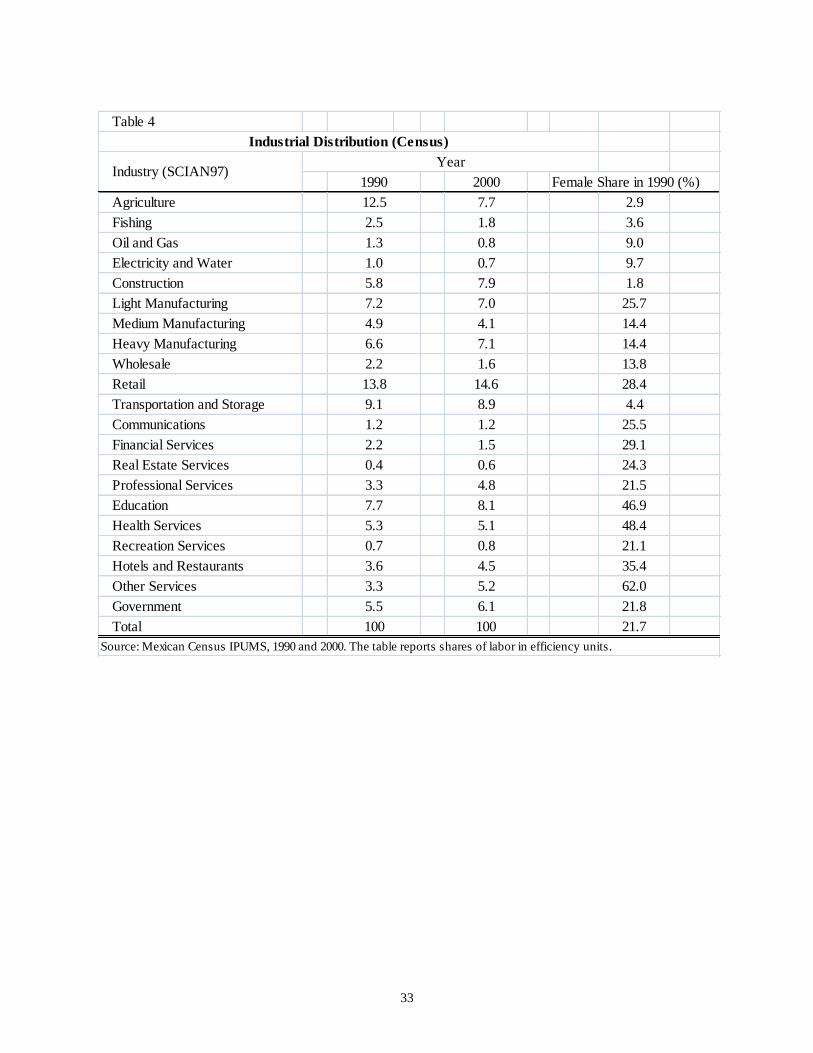
Table 4 reports labor shares across broad industry classes using Census data. The most
significant change reported in the table is the declining share of agricultural employment
throughout the period. Agriculture’s share fell from 12.5 percent in 1990 to 7.7 percent in 2000.
As indicated in column (3) female labor share in agriculture in 1990 was only 2.9 percent. Since
predominantly men work in agriculture in Mexico, we would expect this to negatively impact
men relative to women. Somewhat surprisingly, the manufacturing sector also decreased
modestly. Instead, several services sectors registered large growth, such as professional services,
education, hotel and restaurants, and other services.
13 In calculating wage bill shares, we also allow group specific wages to vary by year. More specifically, we define
10 five-year age groups and 5 education groups. We use our wage sample to calculate average wage of group j in
year t in the following manner: it
i j
jt
it
i j
Wageinc
WHours
and use our quantity sample to sum total hours by group j in year
t as jt it
i j
H Hours
. Wage bill share of women in year t is calculated as follows:
*
*
f f
jt jt
jf
t
jt jt
j
W H
WBW H
.
11
Table 5 disaggregates the manufacturing sector further and shows that while
manufacturing employment was flat overall, there have been winners and losers within
manufacturing. Female-intensive sectors (based on initial female share in 1990) such as
“clothing” and “computers and electronics” grew while predominantly male-intensive sectors
such as “petroleum and coal products,” “chemicals” and “primary metal” declined.
“Transportation equipment” which includes car assembly, on the other hand, grew over this
period.
One method of summarizing these changes is to calculate within and between-industry
changes in employment and wage bill shares of female workers. Between-industry changes in
women’s wage bill share would be consistent with trade based explanations. For example, tariff
reductions associated with NAFTA may have increased the relative size of textiles and clothing
sectors which more intensively utilizes female labor. These types of changes would be captured
by between-industry shifts and we view gauging the importance of between-industry shifts as the
first step towards assessing the role of trade liberalization policies.
We decompose the change in the female share into two components according to the
following formula:
1
1
_ * *f f
it it it it
t
i iit t it t
E E E EFemale share
E E E E
(1)
The term 1
1
f
it
it
E
E
is the share of women in industry i and it
t
E
E is total employment growth of
industry i. The first term corresponds to the “between” component and captures the extent to
which growth in female share was due to differential growth across industries. The second term
reflects within-industry changes in female share. We use 69 industry classifications which we
can consistently match across the 1990 and 2000 Census.
12
The top panel of table 6 reports changes in employment shares (in efficiency units) as
well as changes in wage bill shares for all sectors. We distinguish 4 different groups, less
educated (<12 years of schooling) males and females, and more educated (>=12 years of
schooling) males and females. We also report all women’s wage bill share in the last row. The
table shows that the wage bill share of women increased 5.3 percentage points overall between
1990 and 2000. Between-industry shifts account for 40 percent (2.1/5.25) of the total change.
Between-industry shifts account for a smaller (32 percent) but still substantial share of the
change in employment share suggesting that employment shifts across industries were important.
The middle and bottom panels of table 3 show similar results for the 29 industries in the
tradeables sector (including agriculture) and for 21 industries in the manufacturing sector. Taken
together, approximately between one-third and up to 40 percent of the rise in female wage bill
share can be attributed to between-industry shifts. These results stand in sharp contrast to
Attanasio, Goldberg, and Pavcnik (2004) who find stable employment patterns across industries
in Colombia and also Revenga (1997) and Hanson and Harrison (1999) who examine an earlier
period in Mexico. These authors conclude that trade liberalization impacted industry wage
premiums rather than reallocated labor across sectors. Our finding here is that labor reallocation
is an important part of the story in Mexico during the 1990s. It is also important to keep in mind
that the lack of detail in our industry categories is likely to under-estimate the true shift in
employment across industries thus giving us a lower bound of the importance of between-
industry shifts.
Can these between-industry shifts be linked to trade liberalization policies? Note that the
“between industry” shift consists of the following expression from equation (1):
1
1
*f
it it
i it t
E EBetween
E E
.
The first term, 1
1
f
it
it
E
E
, refers to female share in the industry in
13
the initial period, while the second term, it
t
E
E
, refers to industry growth. We show below
that trade liberalization (tariff reductions) is positively related to increase in industry share
it
t
E
E
and also initial female share 1
1
f
it
it
E
E
.
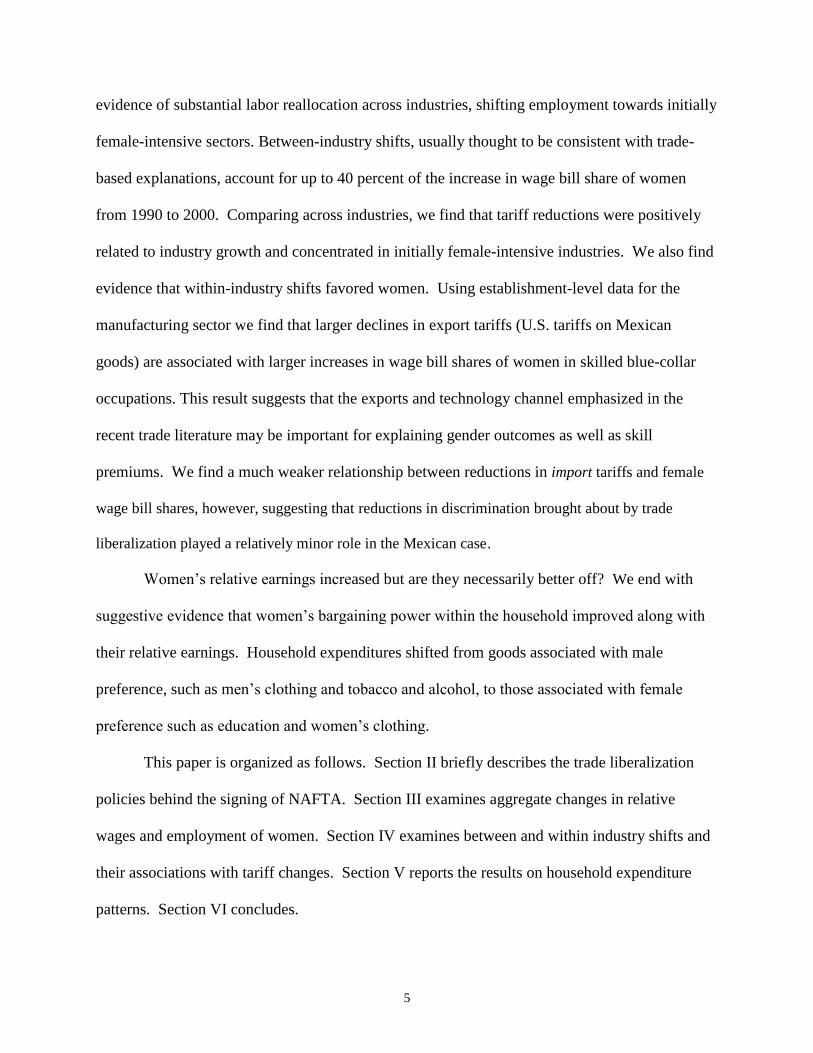
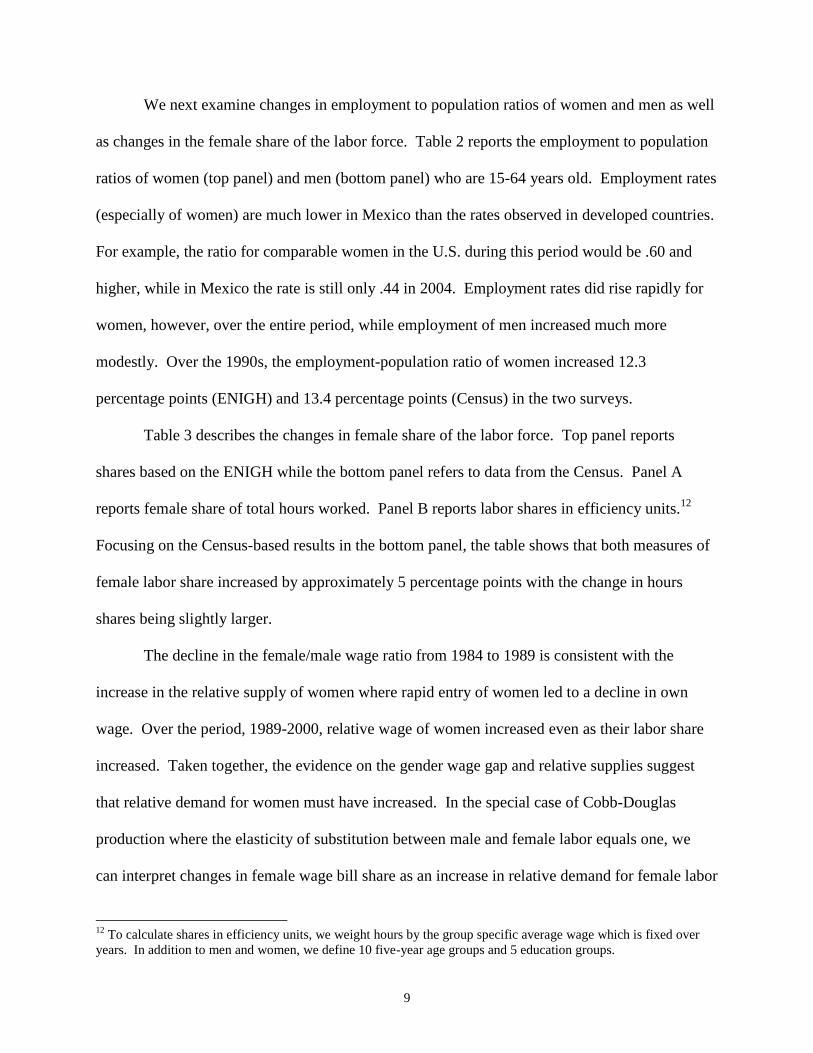
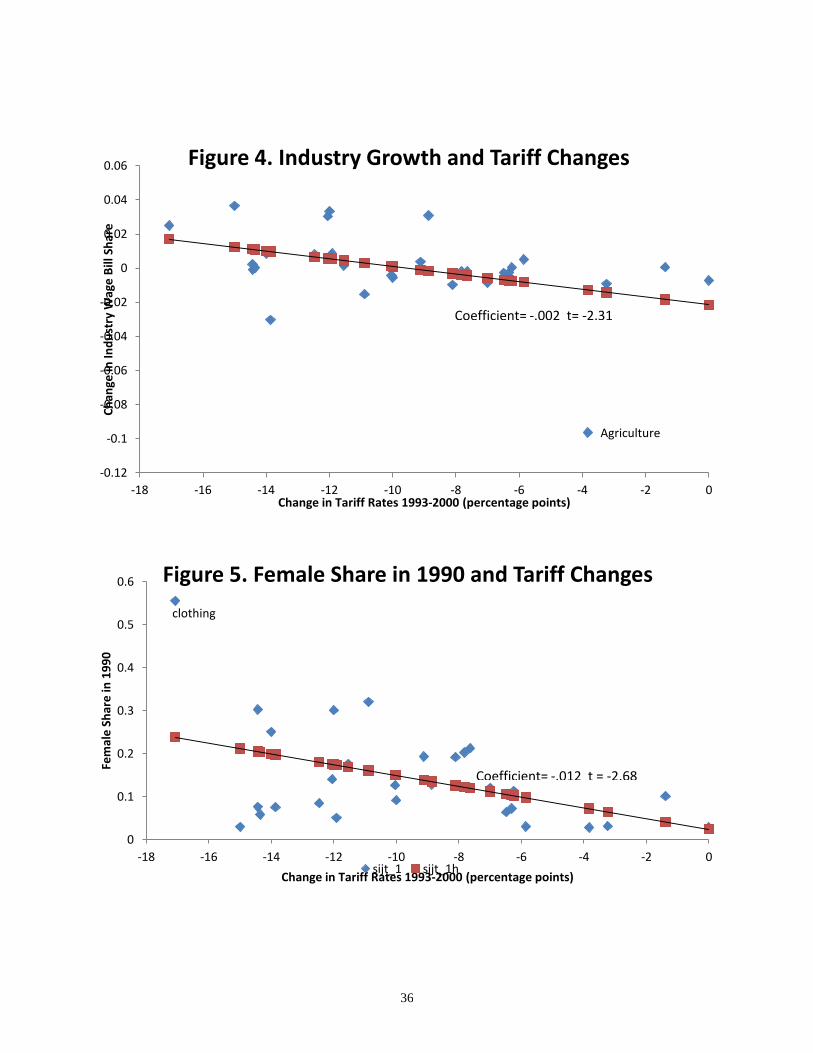
Figure 4 relates the change in total industry wage bill share, it
t
E
E
from 1990 to 2000
to the change in industry level tariff rates from 1993-2000 for the 29 industries in the tradeables
sector.14
As illustrated in figure 4, larger tariff reductions are positively related to industry
growth.15
It is interesting to note that this is contrary to the predictions of the standard
Heckscher-Ohlin (HO) trade model, which would predict contraction among sectors that
experienced a decline in their output price (due to tariff reductions). We find that tariff
reductions from 1993-2000 are positively related to industry growth. Although it is not clear
why Mexico would have protected industries in which it has a comparative advantage, the
coincident reduction in tariffs by the U.S. likely had a large effect especially in the most
impacted industries such as textiles and clothing. In addition, recent papers have pointed out
that trade liberalization not only reduces output prices but also the prices of imported
intermediate products. Tariff reductions could lead to the expansion of domestic firms by
reducing cost of existing imports as well as by allowing firms to increase scope and expand to
14
These are the industries for which we are able to match both across Census years and also to the tariff data using
the Sistema de Clasificacion Industrial de America del Norte 1997 (SCIAN97). We do not utilize establishment
level data from the ENESTyC in this section for two reasons. First, the ENESTyC includes only manufacturing
firms and we would lose the agricultural sector. Second, the ENESTyC oversampled small firms in 2000 but we do
not have clear details of the oversampling. Since our objective in this section is to get a representative overview of
the tradeables sector, we rely on household data instead. 15
Figure 4 also shows that the agricultural sector is an outlier which may be due to the fact that tariff changes in
agriculture were slowly implemented with the last of the reductions scheduled to go into effect in 2008. In
preparation, however, the government implemented land reforms and began to dismantle price supports and
subsidies which resulted in a steep decline in agricultural employment well before the tariff reductions. Running the
regression without agriculture results in a coefficient equal to -.001 with t-stat of -1.86.

14
new product varieties (Amiti and Konings (2007) and Goldberg, Khandelwal, Pavcnik, and
Topalova (2010)).
The next question is whether tariff changes were concentrated in initially female-
intensive industries. In figure 5, we graph initial female share in the industry in 1990 against
tariff changes. The figure shows that the largest declines in tariffs were concentrated in initially
female-intensive industries, with “clothing” playing an important role in terms of both female
share and tariff declines.16
B. Within-Industry Shifts in Female Wage Bill Share
While table 6 showed that up to 40 percent of the increase in female wage bill share was
due to between-industry shifts, the table also showed that majority of the increase occurred
within industries. In this section we examine what may account for the rise in female wage bill
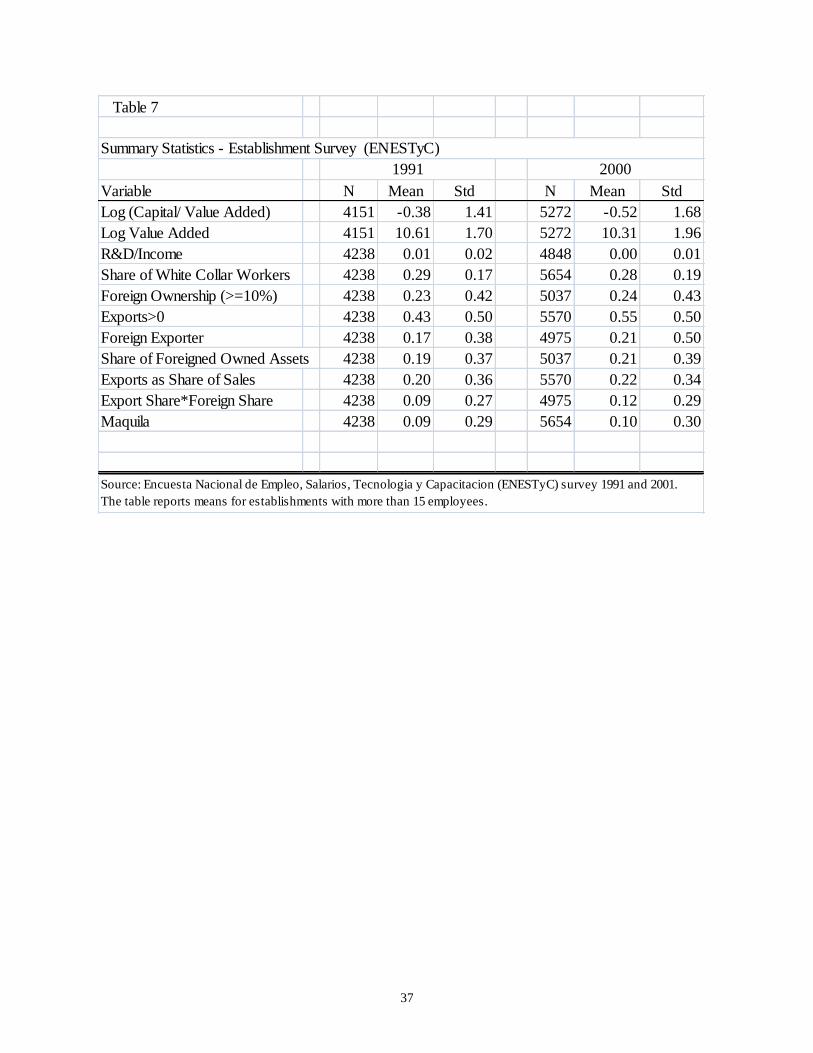
share within industries. To examine this question, we use establishment level data, Encuesta
Nacional de Empleo, Salarios, Tecnologia y Capacion (ENESTyC). ENESTyC is a survey of
establishments in the manufacturing sector and was carried out in 1992, 1998, and 2001. We use
the 1992 and 2001 samples in our analysis which refer to the years 1991 and 2000.17
Table 7
provides a summary of the main variables. Particularly notable is the increase in the number of
exporting firms from 43 percent in 1991 to 55 percent 2000.
To investigate the link between within-industry shifts in female wage bill share and trade
liberalization policies, we consider the following regression at the establishment level:
16
The relationship is still negative although somewhat weaker without the “clothing” industry. If we exclude
“clothing,” the regression coefficient is reduced to -.007 with t-stat of -1.79. 17
We drop micro establishments (those with 15 employees or less) from the analysis since micro establishments
were oversampled in 2001 but we do not have clear details of the oversampling. We would like to thank INEGI
officials for granting on-site access to the establishment level data used in this study under the commitment of
complying with the confidentiality requirements set by the Mexican Laws and in particular, to Maria Luisa Meza
Leon, Lizi Ivette Gonzalez Jimenez and Gabriel Romero Velasco.
15
(2)
where _ jitFemale Share represents the female wage bill share in establishment j in industry i in
year t, itTariff refers to industry tariff levels in 1991 and 2000, Xjit refer to various establishment-
level controls, and ηt and λi refer to year and industry fixed effects. While all tariffs are
expected to be eventually reduced to zero under NAFTA, not all industry tariffs had been
reduced to zero by 2000, and one concern is that the actual timing of the changes may be
endogenous and subject to more political pressures and contemporaneous industry performance.
We therefore use initial tariff levels in 1991 interacted with 2000 year dummy as our main
regressor. We estimate the following equation:
(3)
In the above specification the coefficient βT1 compares female wage bill shares in 2000 across
industries with different initial tariff levels, controlling for industry fixed effects, λi. Since
industries with higher initial tariff levels experienced larger declines, we expect the sign of βT1 to
be positive. Unlike the previous sections where we were limited to 3-digit industry
classifications, we have more detailed industry information, 6-digit level of the Mexican
Classification of Activities and Products system (CMAP), available in the establishment level
1_ jit T it X jit t i jitFemale Share Tariff X
1_ _ *2000_jit T i X jit t i jitFemale Share Init Tariff Dummy X
16
data. Tariff data, both Mexican tariffs on imports (import tariffs), as well U.S. tariffs on
Mexican exports (export tariffs), were merged at the CMAP level.18
Table 8 reports the results from estimating equation (3). The top panel refers to export
tariffs while the bottom panel refers to import tariffs. Column (1) reports the results for overall
female wage bill share, while columns (2)-(5) examine various subcategories such as white-
collar (column 2), blue-collar (column 3), “specialized blue-collar” (column 4), and “general
blue-collar” (column 5). While the coefficients are generally positive, indicating that larger
declines in export tariffs lead to greater increase in female wage bill share, most of the
coefficients are not significant at the 5 percent level. The one exception is female wage bill
share in “specialized blue-collar” category, the skilled blue-collar occupations.19
What is the channel which links reductions in export tariffs to increases in female wage
bill share? Recent papers have emphasized productivity differences between exporting and non-
exporting firms (Bernard and Jensen (1999), Verhoogen (2008), and Bustos (2011)). In
particular, Bustos (2011) shows that in the aftermath of the regional free trade agreement
between Argentina and Brazil, the MERCOSUR, the number of exporting firms increased. In a
paper that builds on a model of firm heterogeneity and worker heterogeneity along gender and
skill dimensions, Juhn, Ujhelyi and Villegas-Sanchez (2012) find that reductions in export tariffs
increased the number of exporting firms and these firms adopted technology which appears to be
18
We thank Leonardo Iacovone for providing us with the tariff data. Tariff data were available originally at the 8-
digit Harmonized System (HS) classification and was matched to the Mexican CMAP class classification as
explained in Iacovone and Javorcik (2010). 19
Since maquiladoras were not subject to import duties or tariffs even before the trade liberalization, it is not clear
how tariff reductions would impact this type of activity. For this reason, we exclude maquiladoras and firms who
earned more than 50% of their income from maquiladora activity from our analysis. Additionally we include in our
sample those firms who are in size categories 1 and 2 (greater or equal to 100 employees) and hire at least one
female employee. The size restriction is due to the fact that the ENESTyC oversampled small firms in 2000 but we
were unable to obtain clear details regarding sampling weights. Restricting the sample to larger firms ensures
comparability across the two years. Our results are qualitatively similar although slightly weaker without these
restrictions. Additional controls in the regression include age of firm, age squared, log(Capital/Value Added),
log(Value Added), R&D expenditures as share of total income, share of white-collar workers, and foreign dummy
which is equal to one if at least 10 percent of assets is foreign-owned.
17
more complementary with female blue-collar workers. While we show only the reduced
relationship between tariffs and female wage bill share in table 8, our results are broadly
consistent with this technology based explanation.
Finally, another channel is the role of competition and discrimination. The bottom panel
of table 8 addresses this issue by using the same specification as (3) but using Mexican tariffs
(import tariffs) as the independent variable. While the coefficients are positive, table 8 shows
that the relationship between import tariffs and female share is much weaker. These results
suggest that increased competition and reductions in discriminatory hiring practices were most
likely of secondary importance in Mexico.
V. Household Expenditures and Shifts in Household Bargaining
We have shown that during the period of trade liberalization women’s wage remained
stable while they worked more (at least in the non-household sector). This brings us to the
question of whether women’s well-being improved as a result. Recent papers on household
bargaining have rejected the common preference model of the household. Using a policy change
in Britain where child allowance was transferred from the husband to the wife as a natural
experiment, Lundberg, Pollack and Wales (1996) show that an exogenous shock to wife’s
income altered household expenditures towards “women’s clothing” and “children’s clothing” at
the expense of “men’s clothing” and “tobacco and alcohol.” The exogenous shift in relative
incomes altered the bargaining position of the wife and shifted household expenditures towards
goods reflecting her preferences. Bobonis (2009) also finds that cash transfers to the wife in the
Mexican Progressa program shifted expenditures towards children’s goods. In this section, we
18
examine changes in household expenditure patterns to see if bargaining position of married
women increased to reflect the increase in their relative earnings.
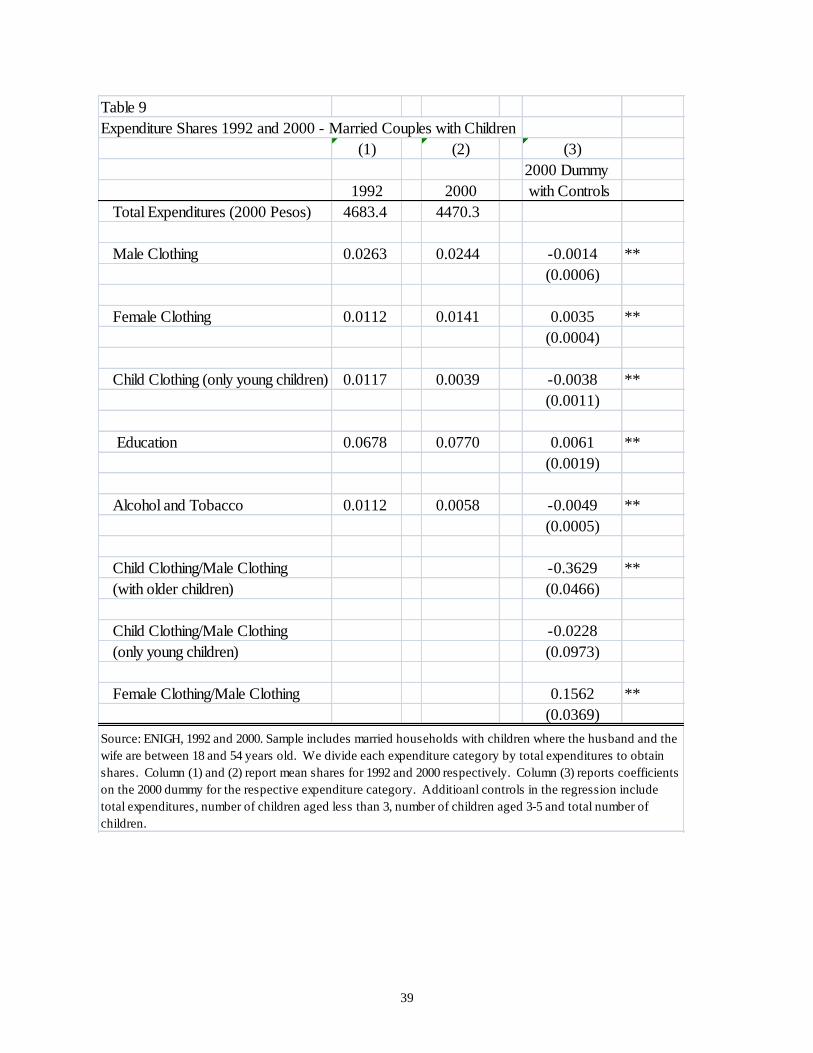
We use two rounds of the Mexican Household Income and Expenditure Survey
(ENIGH), 1992 and 2000. Our sample consists of married households with children where the
husband and the wife are between 18 and 54 years old. Different households are interviewed in
each round, thus we are unable to follow the same household over time. Households report total
expenditures as well as expenditures in various categories covering the third quarter of the year
previous to the survey. We deflate expenditures by the national consumer price index published
by the Bank of Mexico with 2000 as the base year. We divide by total expenditures to obtain
shares and run the following OLS regression:
(4)
where k
itShare refers to expenditure share of good k in total expenditures for household i in year t.
We also control for total expenditures, number of children younger than 3, number of children
aged 3-5 and total number of children. The year dummies in the above regression indicate
whether expenditure share of good k increased in 2000 relative to 1992.
Results are reported in table 9. The coefficients on the 2000 year dummy indicate that
expenditures on male clothing fell over time while expenditures on female clothing increased.
The survey only reports expenditures on “infant and toddler clothing.” Expenditures in this
category fell over time. “Education” expenditures which are typically associated with female
preference increased while “alcohol and tobacco,” associated with male preference, fell over
time. The bottom three rows investigate the change in the ratio of expenditures. Children’s
1 2 3 4_ _ expk
it it it it it t itShare Kids Young Kids Old Kids Tot u

19
clothing fell relative to male clothing if we include families with older children where clothing
may be handed down from older siblings. When we look at families with young children only,
we find no significant change in the ratio of children’s to male clothing. The ratio of female to
male clothing, however, increased from 1992 to 2000. The table offers suggestive evidence that
women’s bargaining power within the household improved along with their relative earnings
over the 1990s. Household expenditures shifted from goods associated with male preference,
such as men’s clothing and tobacco and alcohol, to those associated with female preference such
as education and women’s clothing.
VI. Conclusion
Some view rising wage and income inequality in Latin America as an unacceptable
consequence of following more efficient market-oriented policies. The impact of trade
liberalization and foreign direct investment on domestic wage structure, therefore, is of central
policy concern. The evidence in this paper suggests that rather than immiserizing women, trade
liberalization improved women’s labor market outcomes. Particularly during the reform period,
1990 to 2000, the gender wage ratio increased while employment of women increased. This
suggests that the relative demand for women must have increased over this period. We find that
both between and within-industry shifts favored female workers. With regards to between-
industry shifts, we find that tariff reductions expanded industries which were initially female
intensive. With regards to within-industry shifts, we find that declines in export tariffs are
positively associated with increased hiring of women in skilled blue-collar occupations. This
suggests that the exports and technology channel emphasized by recent papers to explain skill
premiums (Yeaple (2005), Verhoogen (2008), and Bustos (2011)) may be as important for
20
explaining gender outcomes. Finally, the increased earnings power of women appears to have
translated into increased bargaining power within the household. Examining household
expenditure data, we find that expenditures shifted from male-oriented goods such as male
clothing and tobacco and alcohol to female-oriented goods such as women’s clothing and
children’s education.
21
References
Acemoglu, D. Autor, D. and D. Lyle (2004) “Women, War, and Wages: The Effect of Female
Labor Supply on the Wage Structure at Midcentury,” Journal of Political Economy,
112(3): 495-551.
Amiti, Mary and Jozef Konings (2007), “Trade Liberalization, Intermediate Inputs, and
Productivity: Evidence from Indonesia,” American Economic Review, 97(5): 1611-1638.
Artecona, Raquel, and Wendy Cunningham (2002), “Effects of Trade Liberalization on the
Gender Wage Gap in Mexico,” Working Paper, The World Bank.
Attanasio, O., Pinelopi Goldberg, and Nina Pavcnik (2004), “Trade Reforms and Wage
Inequality in Colombia,” Journal of Development Economics, 74:331-366.
Autor, D., and Larry Katz (1999), “Changes in the Wage Structure and Earnings Inequality,”
Ashenfelter, Orley; Card,David, eds. Handbook of Labor Economics, Volume 3A New
York: North-Holland.
Becker, Gary (1957), The Economics of Discrimination. Chicago: The University of Chicago
Press.
Berman, E., Bound, J., and Z.Griliches (1994) “Changes in the Demand for Skilled Labor Within
U.S. Manufacturing: Evidence from the Annual Survey of Manufacturers,” Quarterly
Journal of Economics, 109: 367-398.
Bernard, A. and J. Bradford Jensen (1999), “Exceptional Exporter Performance: Cause, Effect,
or Both?” Journal of International Economics, 47(1): 1-25.
Black, Sandra, and Elizabeth Brainerd (2002), “Importing Equality? The Impact of
Globalization on Gender Discrimination,” NBER Working Paper 9110.
Bobonis, Gustavo (2009), “Is Allocation of Resources within the Household Efficient? New
Evidence from a Randomized Experiment,” Journal of Political Economy, 117: 453-503.
Bound, J. and G. Johnson (1992), “Changes in the Structure of Wages in the 1980s: An
Evaluation of Alternative Explanations,” American Economic Review, 82: 271-392.
Brown, C., Pagan, Jose, and E. Rodriguez-Oreggia (1999), “Occupational Attainment and
Gender Earnings Differentials in Mexico,” Industrial and Labor Relations Review,
53(1):123-135.
Bussolo, Maurizio, R. De Hoyos. (2009), “Introduction and Overview.” Bussolo, M. and R. De
Hoyoy, ed. Gender Aspects of the trade and Poverty Nexus. Washington, DC: World
Bank Press.
22
Bustos, Paula (2011), “The Impact of Trade on Technology and Skill Upgrading: Evidence from
Argentina,” Working paper.
Duflo, Esther (2000), “Grandmothers and Granddaughters: Old Age Pension and Intra-
Household Allocation in South Africa,” NBER Working Paper, No. 8061.
Duflo, Esther (forthcoming), “Women’s Empowerment and Economic Development,” Journal of
Economic Literature.
Ederington, J., J. Minier, and K. Troske (2010), “Where the Girls Are: Trade and Labor Market
Segregation in Colombia,” Working Paper.
Feenstra, Robert, John Romalis, and Peter Schott (2002), “U.S. Imports, Exports, and Tariff
Data, 1989-2001,” NBER Working Paper, No. 9387.
Galor, Oded and David N. Weil (1996). “The Gender Gap, Fertility, and Growth.” American
Economic Review, 86 (3): 374-387.
Goldberg, P., A. Khandelwal, N. Pavcnik, and P. Topalova (2010), “Imported Intermediate
Inputs and Domestic Product Growth: Evidence from India,” Quarterly Journal of
Economics, 125(4): 1727-1767.
Hanson, Gordon, and Ann Harrison (1999), “Trade and Wage Inequality in Mexico,” Industrial
Labor Relations Review, 52(2): 271-288.
Iacovone, Leonardo, and Beata Javorcik (2010), “Multi-Product Exporters: Product churning,
Uncertainty and Export Discoveries,” The Economic Journal, 120: 481-499.
Juhn, Chinhui, Gergely Ujhelyi, and Carolina Villegas-Sanchez (2012), “Men, Women, and
Machines: How Trade Impacts Gender Inequality,” NBER Working Paper 18106.
Katz, Lawrence, and Kevin M. Murphy (1992), “Changes in Relative Wages, 1963-1987: Supply
and Demand Factors,” Quarterly Journal of Economics, 107(1): 35-78.
Lundberg, Shelly, R. Pollak and T. Wales (1997). “Do Husbands and Wives Pool Resources?
Evidence from the UK Child Beneft,” Journal of Human Resources, 32: 463-479.
Melendez, Jorge. (2001) “The Structure of Wages under Trade Liberalization: Mexico from
1984 to 1998,” Ph..D. Dissertation, University of Chicago.
Melitz, Marc (2003), “The Impact of Trade on Intra-Industry Reallocations and Aggregate
Industry Productivity,” Econometrica, 71(6): 1695-1725.
Oostendorp, Remco (2004), “Globalization and the Gender Wage Gap,” Working Paper, Free
University, Amsterdam.
23
Pagan, Jose A. and Miren Ullibarri (2000), “Group Heterogeneity and the Gender Earnings Gap
in Mexico”, Economia Mexicana. Nueva Epoca. Vol. IX, No. 1
Qian, Nancy (2008) “Missing Women and the Price of Tea in China: The Effect of Sex-Specific
Earnings on Sex Imbalance,” Quarterly Journal of Economics, 123(3): 1251-1285.
Rendall, Michelle (2010), “Brain versus Brawn: The Realization of Women’s Comparative
Advantage,” working paper, University of Zurich.
Revenga, Ana L. (1997), “Employment and Wage Effects of Trade Liberalization: The Case of
Mexican Manufacturing,” Journal of Labor Economics; 15(3): S20-43.
Sanchez, Susana M. and Jose A. Pagan (2001), “Explaining Gender Differences in Earnings in
the Microenterprise Sector”, in Maria Correia and Elizabeth Katz (eds.) The Economics
of Gender in Mexico: Work, Family, State and Market.
Thomas, Duncan (1990) “Intra-Household Resource Allocation: An Inferential Approach,”
Journal of Human Resources, 35: 635-654.
United Nations (2009), UN Millennium Development Goals Report 2009, New York: United
Nations.
Verhoogen, Eric (2008), “Trade, Quality Upgrading, and Wage Inequality in the Mexican
Manufacturing Sector,” Quarterly Journal of Economics, 123 (2): 489-530.
Weinberg, Bruce (2000), “Computer Use and the Demand for Female Workers,” Industrial and
Labor Relations Review,Vol. 53, No.2, pp.290-307.
Welch, Finis (2000), “Growth in Women’s Relative Wages and in Inequality Among Men: One
Phenomenon or Two?” American Economic Review, 90(2): 444-449.
Yeaple, Stephen (2005), “A Simple Model of Firm Heterogeneity, International Trade, and
Wages,” Journal of International Economics, 65(1): 1-20.
Zabludovsky, J. (2005), “El Tlcan y La Politica de Comercio Exterior en Mexico: Una Agenda
Inconclusa,” Informacion Comercial Espanola (821): 59-70.

24
Data Appendix
A. Household Surveys (Census, ENIGH)
We use data from 9 rounds of the Household Income and Expenditure Surveys (ENIGH),
a nationally representative survey which spans the period 1984-2004. We also use data from the
10% samples of the Mexican Population Census of 1990 and 2000 available from the Census
IPUMS. Unlike the ENIGH, statistical inferences using the larger Census samples are
significant at the two-digit industry level (92 categories) and at the state level (32 states).
Appendix Table 1 provides summary statistics of the data.
For calculating wages we construct a wage sample consisting of men and women who are
15-64 years old, who worked at least 30 hours during the survey week and reported no self-
employment income. Wages are reported wage and salary earnings last month converted to a
weekly wage by dividing by 4.33. Earnings were deflated by the national consumer price index
published by the Bank of Mexico with 2000 as the base year.
For reporting quantities of labor by education and by industry, we construct a sample of
15-64 year olds who report positive hours during the survey week, including the self-employed.
We report hours-weighted employment shares and employment shares in efficiency units of
labor. To calculate efficiency units of labor, we first calculate average wages (fixed across all
years) by 2 gender, 10 age and 6 education categories. We weight hours by these average wages
to calculate efficiency units of labor. All our calculations are weighted by the household
weights to make the sample nationally representative.
25
B. Data on Tariffs, Exports, and Imports
We match industry classifications available in the 1990 and 2000 Census samples to the
Sistema de Clasificacion Industrial de America del Norte 1997 (SCIAN97 and also called the
NAICS in the U.S.). Tariff, export, and import data for 1993-2000 were obtained from the
Ministry of the Economy (formerly SECOFI), international trade statistics
(www.economia.gob.mx). Tariffs, exports and imports are reported in “facciones arancelarias”
which is a classification system for products. There are more than 34,000 products. For tariff
schedules we used the book Fracciones Arancelarias y Plazos de Desgravación, Tratado de Libre
Comercio de América del Norte (1994), published by the Ministry of Economy. The book
publishes each product with the 1993 tariff rates (0,5,10,15,20%) along with a code, A, B, C, D
or B6 which describes the rate at which the tariff is reduced to zero. For example, Code A
corresponds to a tariff which is reduced to zero in 1994. We aggregated products and tariff
schedules up to the SCIAN97 industry codes using the 1993 import shares as weights. U.S tariff
data come from John Romalis (http://faculty.chicagobooth.edu/john.romalis/more/) with the
description and documentation available in the NBER Working paper 9387. We aggregate the 6
digit harmonized tariff schedules available in the Romalis data up to the 3-digit SCIAN97
categories using the 1993 shares of Mexican exports to the U.S. These matched tariff data are
available from the authors upon request.
C. Establishment Surveys (ENESTyC)
The establishment-level data come from Encuesta Nacional de Empleo, Salarios, Tecnologia
y Capacion (ENESTyC). The samples in ENESTyC are representative cross sections of
26
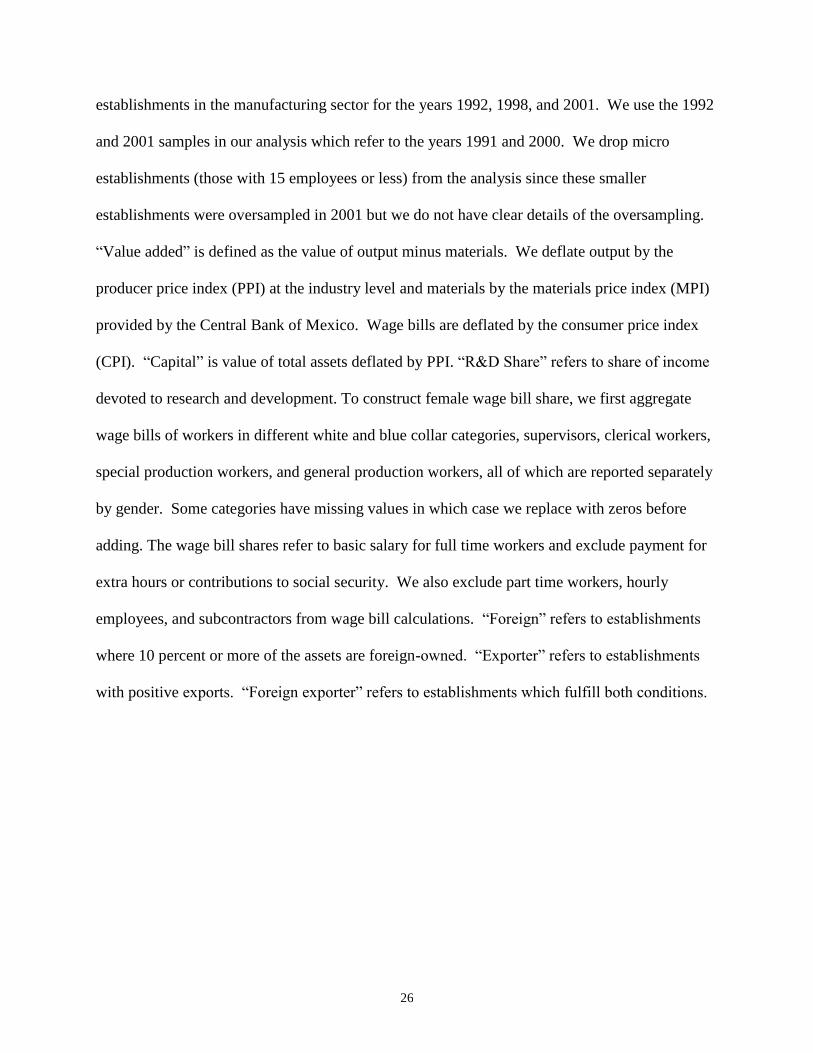
establishments in the manufacturing sector for the years 1992, 1998, and 2001. We use the 1992
and 2001 samples in our analysis which refer to the years 1991 and 2000. We drop micro
establishments (those with 15 employees or less) from the analysis since these smaller
establishments were oversampled in 2001 but we do not have clear details of the oversampling.
“Value added” is defined as the value of output minus materials. We deflate output by the
producer price index (PPI) at the industry level and materials by the materials price index (MPI)
provided by the Central Bank of Mexico. Wage bills are deflated by the consumer price index
(CPI). “Capital” is value of total assets deflated by PPI. “R&D Share” refers to share of income
devoted to research and development. To construct female wage bill share, we first aggregate
wage bills of workers in different white and blue collar categories, supervisors, clerical workers,
special production workers, and general production workers, all of which are reported separately
by gender. Some categories have missing values in which case we replace with zeros before
adding. The wage bill shares refer to basic salary for full time workers and exclude payment for
extra hours or contributions to social security. We also exclude part time workers, hourly
employees, and subcontractors from wage bill calculations. “Foreign” refers to establishments
where 10 percent or more of the assets are foreign-owned. “Exporter” refers to establishments
with positive exports. “Foreign exporter” refers to establishments which fulfill both conditions.
27
0
0.02
0.04
0.06
0.08
0.1
0.12
0.14
0.16
0.18 1980
1982
1984
1986
1988
1990
1992
1994
1996
1998
2000
2002
2004
Year
Figure 1
Effective Tariffs,1980-2004
Source: Zabludovsky (2005) , Table 1. Own calculations based on tariff
schedules publishedand by Ministry of the Economy, (SECOFI).
Non NAFTA
USA
All
Countries
0.0%
5.0%
10.0%
15.0%
20.0%
25.0%
30.0%
35.0%
1980
1982
1984
1986
1988
1990
1992
1994
1996
1998
2000
2002
2004
Year
Figure 2
Non-oil Exports and Imports as share of GDP, 1980-2004
Source: www.inegi.gob.mx
Imports
Exports
28
Table 1
1993 Rate Change 1993 Rate Change
% 1993-00 % 1993-00
Industry (1) (2) (3) (4)
Agriculture 4.5 -3.8 4.1 -3.6
Livestock 4.5 -3.2 0.0 0.0
Fish 0.0 0.0 0.0 0.0
Oil and Gas 10.0 -7.0 0.5 -0.5
Minerals 6.1 -5.9 0.3 -0.3
Food 12.4 -9.1 3.6 -2.0
Beverage and Tobacco 18.9 -14.4 3.7 -3.2
Textiles and Fabrics 12.9 -10.0 13.2 -13.1
Textile Mill Products 19.3 -14.4 6.1 -6.0
Clothing 20.0 -17.1 13.2 -12.9
Leather 9.3 -7.6 11.6 -8.8
Wood 17.5 -14.4 1.2 -1.1
Paper 8.3 -6.2 0.0 0.0
Printed Matters 9.0 -8.1 0.0 0.0
Petroleum and Coal Products 1.9 -1.4 1.5 -1.1
Chemicals 9.4 -7.8 1.8 -1.6
Plastics and Rubber 15.2 -11.5 1.2 -1.0
Nonmetallic Mineral Products 14.9 -12.5 4.7 -1.8
Primary Metal 8.8 -6.5 3.2 -2.6
Fabricated Metal 13.8 -12.1 0.5 -0.5
Machinery, Except Electrical 14.6 -13.9 0.0 0.0
Computers and Electronics 12.8 -12.0 1.7 -1.7
Electrical Equip & Appliances 14.0 -10.9 0.2 -0.2
Transportation Equip 11.4 -8.9 1.3 -1.3
Furniture 16.1 -11.9 0.0 0.0
Miscellaneous 15.3 -14.0 0.8 -0.8
Source: Mexican tariff data, Fracciones Arancelarias y Plazos de Desgravacion, Tratado de Libre Comericio de
America del Norte, 1994. U.S. tariff data, from Romalis (2002). For both The U.S. tariff data we begin with
8-digit harmonized tariff system categories and aggregate up 3-digit SCIAN97 (NAICS) categories using initial
import and export shares as weights. Details of the data construction are in the data appendix.
Tariff Rates Pre and Post-NAFTA
Mexico U.S.

29
0.75
0.8
0.85
0.9
0.95
1
1.05
1.1
1984 1986 1988 1990 1992 1994 1996 1998 2000 2002 2004
Ra
tio
Year
Figure 3a. Female/Male Mean Weekly Wage Ratio
Census ENIGH - predicted ENIGH
0.75
0.8
0.85
0.9
0.95
1
1.05
1.1
1984 1986 1988 1990 1992 1994 1996 1998 2000 2002 2004
Ra
tio
Year
Figure 3b. Female/Male Mean Weekly Wage Ratio
Composition Fixed
ENIGH - predicted Census ENIGH
30
0.75
0.8
0.85
0.9
0.95
1
1.05
1.1
1984 1986 1988 1990 1992 1994 1996 1998 2000 2002 2004
Rati
o
Year
Figure 3c. Female/Male Mean Weekly Wage Ratio
Including Self-Employed
Census ENIGH - Predicted ENIGH
0.75
0.8
0.85
0.9
0.95
1
1.05
1.1
1984 1986 1988 1990 1992 1994 1996 1998 2000 2002 2004
Ra
tio
Year
Figure 3d. Female/Male Mean Hourly Wage Ratio
Including Self-Employed
Census ENIGH - predicted EnIGH
31
Table 2
1984 1989/90 1992 1994 1996 1998 2000 2002 2004
ENIGH
<12 0.255 0.263 0.290 0.337 0.375 0.394 0.387 0.412 0.395
>=12 0.421 0.498 0.502 0.530 0.562 0.562 0.525 0.559 0.580
All 0.267 0.289 0.315 0.363 0.402 0.419 0.412 0.440 0.441
Census
<12 0.166 0.294
>=12 0.478 0.541
All 0.211 0.348
1984 1989/90 1992 1994 1996 1998 2000 2002 2004
ENIGH
<12 0.791 0.795 0.817 0.827 0.817 0.842 0.846 0.832 0.816
>=12 0.658 0.763 0.770 0.798 0.802 0.800 0.819 0.779 0.820
All 0.774 0.790 0.809 0.821 0.814 0.832 0.840 0.819 0.817
Census
<12 0.727 0.774
>=12 0.762 0.816
All 0.733 0.784
Employment-Population Ratio 15-64 Year Old Men
Year
Employment-Population Ratio 15-64 Year Old Women
Year
Source: ENIGH 1984-2004, Census 1990, 2000. Sample includes 15-64 year old males and females. Employment is defined as those with
positive hours of work during the survey week.

32
Table 3
1984 1989 1992 1994 1996 1998 2000 2002 2004
A. Hours
<12 Years 0.215 0.238 0.247 0.269 0.293 0.300 0.303 0.310 0.312
>=12 Years 0.232 0.273 0.275 0.301 0.316 0.321 0.316 0.349 0.387
All 0.217 0.244 0.252 0.274 0.298 0.304 0.306 0.319 0.333
B. Efficiency Units
<12 Years 0.195 0.223 0.229 0.251 0.270 0.278 0.289 0.295 0.291
>=12 Years 0.177 0.211 0.219 0.240 0.262 0.261 0.247 0.285 0.321
All 0.190 0.219 0.225 0.246 0.266 0.271 0.270 0.290 0.306
C.Wage Bill Shares
<12 Years 0.209 0.221 0.230 0.249 0.266 0.282 0.285 0.292 0.279
>=12 Years 0.174 0.211 0.223 0.233 0.267 0.254 0.241 0.311 0.327
All 0.201 0.218 0.227 0.242 0.266 0.270 0.265 0.301 0.303
1990 2000 1990 2000 1990 2000
<12 Years 0.215 0.254 0.207 0.238 0.212 0.232
>=12 Years 0.280 0.356 0.230 0.301 0.228 0.309
All 0.226 0.281 0.215 0.267 0.217 0.270
ENIGH - Female Labor as a Share of Total Labor
Year
Sample includes 15-64 year old males and females. The table reports the female shares of total labor measured in hours, in
efficiency units of labor, and in wage bill shares. To calculate shares in efficiency units, we weight hours by the group specific
average wage, fixed over years. With wage bill shares, average wages by group vary by year.
Census - Female Labor as a Share of Total Labor
A. Hours B. Efficiency Units C. Wage Bill Shares
Sample includes 15-64 year old males and females. The table reports the female shares of total labor measured in hours, in efficiency units of
labor, and in wage bill shares. To calculate shares in efficiency units, we weight hours by the group specific average wage, fixed over years.
With wage bill shares, average wages by group vary by year.
33
Table 4
2000 Female Share in 1990 (%)
Agriculture 7.7 2.9
Fishing 1.8 3.6
Oil and Gas 0.8 9.0
Electricity and Water 0.7 9.7
Construction 7.9 1.8
Light Manufacturing 7.0 25.7
Medium Manufacturing 4.1 14.4
Heavy Manufacturing 7.1 14.4
Wholesale 1.6 13.8
Retail 14.6 28.4
Transportation and Storage 8.9 4.4
Communications 1.2 25.5
Financial Services 1.5 29.1
Real Estate Services 0.6 24.3
Professional Services 4.8 21.5
Education 8.1 46.9
Health Services 5.1 48.4
Recreation Services 0.8 21.1
Hotels and Restaurants 4.5 35.4
Other Services 5.2 62.0
Government 6.1 21.8
Total 100 21.7
1.3
1.0
Industrial Distribution (Census)
Industry (SCIAN97)Year
1990
12.5
2.5
4.9
6.6
5.8
7.2
0.7
2.2
13.8
Source: Mexican Census IPUMS, 1990 and 2000. The table reports shares of labor in efficiency units.
3.3
7.7
9.1
1.2
2.2
0.4
3.6
5.5
100
5.3
3.3

34
Table 5
1990 2000 Female Share in 1990 (%)
Food 16.4 15.3 19.3
Beverages and Tobacco 4.8 3.8 7.7
Textiles and Fabrics 3.5 2.5 12.7
Textile Mill Products 0.9 1.4 30.3
Clothing 8.2 11.9 55.6
Leather 5.1 3.8 21.3
Wood 1.4 1.6 5.9
Paper 1.8 1.9 11.3
Printing 4.7 2.6 19.2
Petroleum and Coal Products 2.8 1.7 10.2
Chemicals 5.7 4.6 20.3
Plastic and Rubber 2.6 2.5 17.7
Nonmetallic Mineral Products 6.8 7.4 8.5
Primary Metal 3.7 2.6 6.4
Fabricated Metal 7.0 7.1 14.1
Machinery, Except Electrical 2.7 2.1 7.6
Computers and Electronics 2.7 4.5 30.2
Electrical Equip & Appliances 4.1 3.4 32.0
Transportation Equipment 5.9 8.4 12.9
Furniture 6.3 6.9 5.1
Miscellaneous 2.7 4.0 25.1
Total 100 100 18.7
Source: Mexican Census IPUMS, 1990 and 2000. The table reports shares of labor in efficiency units.
Industrial Distribution: Manufacturing (Census)
IndustryYear

35
Table 6
Between Within Total Between Within Total
Men <12 -2.39 -8.59 -10.98 -4.15 -10.38 -14.53
Women <12 1.42 -2.22 -0.80 1.05 -3.68 -2.63
Men >=12 0.73 5.04 5.77 2.04 7.23 9.28
Women >=12 0.24 5.78 6.01 1.05 6.83 7.88
Women 1.66 3.55 5.21 2.10 3.15 5.25
Between Within Total Between Within Total
Men <12 -4.02 -7.07 -11.09 -4.85 -8.44 -13.29
Women <12 2.18 0.92 3.10 1.63 0.27 1.90
Men >=12 1.53 3.85 5.38 2.76 5.44 8.20
Women >=12 0.31 2.31 2.62 0.46 2.73 3.19
Women 2.49 3.22 5.71 2.09 2.60 5.09
Between Within Total Between Within Total
Men <12 -2.00 -7.83 -9.83 -2.57 -8.94 -11.51
Women <12 1.99 0.07 2.06 1.08 -0.71 0.37
Men >=12 -0.12 4.42 4.30 1.17 6.13 7.30
Women >=12 0.12 3.34 3.46 0.33 3.52 3.84
Women 2.11 3.41 5.53 1.40 2.10 4.21
Change in Share of Workers by Education and Gender, 1990-2000, Manufacturing Only
GroupEmployment Share Wage Bill Share
Source: Mexican Census IPUMS 1990 abd 2000. The panel is based on 69 industries, the middle panel is based on 28 industries, and the
bottom panel is based on 21 industries. Employment shares are reported in efficiency units.
Change in Share of Workers by Education and Gender, 1990-2000, Tradeables Only
GroupEmployment Share Wage Bill Share
Change in Share of Workers by Education and Gender, 1990-2000, All Sectors
GroupEmployment Share Wage Bill Share
36
Agriculture
-0.12
-0.1
-0.08
-0.06
-0.04
-0.02
0
0.02
0.04
0.06
-18 -16 -14 -12 -10 -8 -6 -4 -2 0
Ch
ange
in In
du
stry
Wag
e B
ill S
har
e
Change in Tariff Rates 1993-2000 (percentage points)
Figure 4. Industry Growth and Tariff Changes
Coefficient= -.002 t= -2.31
clothing
0
0.1
0.2
0.3
0.4
0.5
0.6
-18 -16 -14 -12 -10 -8 -6 -4 -2 0
Fem
ale
Sh
are
in 1
99
0
Change in Tariff Rates 1993-2000 (percentage points)
Figure 5. Female Share in 1990 and Tariff Changes
sijt_1 sijt_1h
Coefficient= -.012 t = -2.68
37
Table 7
Variable N Mean Std N Mean Std
Log (Capital/ Value Added) 4151 -0.38 1.41 5272 -0.52 1.68
Log Value Added 4151 10.61 1.70 5272 10.31 1.96
R&D/Income 4238 0.01 0.02 4848 0.00 0.01
Share of White Collar Workers 4238 0.29 0.17 5654 0.28 0.19
Foreign Ownership (>=10%) 4238 0.23 0.42 5037 0.24 0.43
Exports>0 4238 0.43 0.50 5570 0.55 0.50
Foreign Exporter 4238 0.17 0.38 4975 0.21 0.50
Share of Foreigned Owned Assets 4238 0.19 0.37 5037 0.21 0.39
Exports as Share of Sales 4238 0.20 0.36 5570 0.22 0.34
Export Share*Foreign Share 4238 0.09 0.27 4975 0.12 0.29
Maquila 4238 0.09 0.29 5654 0.10 0.30
1991 2000
Summary Statistics - Establishment Survey (ENESTyC)
Source: Encuesta Nacional de Empleo, Salarios, Tecnologia y Capacitacion (ENESTyC) survey 1991 and 2001.
The table reports means for establishments with more than 15 employees.

38
Specialized General
All White-Collar Blue-Collar Blue-Collar Blue-Collar
(1) (2) (3) (4) (5)
1991 U.S. Tariff 0.208 0.229 0.172 0.377 ** -0.063
X 2000 (0.130) (0.140) (0.160) (0.180) (0.190)
Industry FE Yes Yes Yes Yes Yes
Year FE Yes Yes Yes Yes Yes
Number of Obs. 5049 5034 5017 4157 4751
R Squared 0.575 0.339 0.582 0.428 0.529
Specialized General
All White-Collar Blue-Collar Blue-Collar Blue-Collar
(1) (2) (3) (4) (5)
1991 Mexican Tariff 0.085 0.106 0.105 0.081 0.039
X 2000 (0.060) (0.060) (0.070) (0.100) (0.090)
Industry FE Yes Yes Yes Yes Yes
Year FE Yes Yes Yes Yes Yes
Number of Obs. 4636 4623 4605 3805 4362
R Squared 0.553 0.332 0.564 0.393 0.511
A. Export Tariffs and Female Wage Bill Share
B. Import Tariffs and Female Wage Bill Share
Table 8 - Female Wage Bill Share and Tariffs - Establishment Data
Source: ENESTyC. Standard errors in parentheses; ***significant at 1 percent level; ** significant 5 percent level; * significant
at 10 percent level. The dependent variable for column (1) is female wage bill share, for column (2) female wage bill share in
white-collar jobs, for column (3) female wage bill share in blue-collar jobs, for column (4) female wage bill share in specialized
blue-collar jobs, and for column (5) female wage bill share in general blue collar jobs. The sample includes firms with at least
one female employee. Small firms with less than 100 employees, maquiladoras, and firms with more than 50% of income earned
from maquiladoras are excluded. Additional controls in the regression include age of firm, age squared, log(Capital/Value
Added), log(Value Added), R&D expenditures as share of total income, share of white-collar workers, dummy for at least 10
percent of capital that is foreign.
39
Table 9
Expenditure Shares 1992 and 2000 - Married Couples with Children
(1) (2) (3)
2000 Dummy
1992 2000 with Controls
Total Expenditures (2000 Pesos) 4683.4 4470.3
Male Clothing 0.0263 0.0244 -0.0014 **
(0.0006)
Female Clothing 0.0112 0.0141 0.0035 **
(0.0004)
Child Clothing (only young children) 0.0117 0.0039 -0.0038 **
(0.0011)
Education 0.0678 0.0770 0.0061 **
(0.0019)
Alcohol and Tobacco 0.0112 0.0058 -0.0049 **
(0.0005)
Child Clothing/Male Clothing -0.3629 **
(with older children) (0.0466)
Child Clothing/Male Clothing -0.0228
(only young children) (0.0973)
Female Clothing/Male Clothing 0.1562 **
(0.0369)
Source: ENIGH, 1992 and 2000. Sample includes married households with children where the husband and the
wife are between 18 and 54 years old. We divide each expenditure category by total expenditures to obtain
shares. Column (1) and (2) report mean shares for 1992 and 2000 respectively. Column (3) reports coefficients
on the 2000 dummy for the respective expenditure category. Additioanl controls in the regression include
total expenditures, number of children aged less than 3, number of children aged 3-5 and total number of
children.