Embed Size (px)
Citation preview
OCCASIONAL PAPER 180
Revenue Implications ofTrade Liberalization
Liam Ebrill, Janet Stotsky, and Reint Gropp
INTERNATIONAL MONETARY FUNDWashington DC
1999
©International Monetary Fund. Not for Redistribution
© 1999 International Monetary Fund
Production: IMF Graphics SectionTypesetting: Choon Lee
Figures: In-Ok Yoon
Library of Congress Cataloging-in-Publication Data
Ebrill, Liam P.Revenue implications of trade liberalization / Liam Ebrill, Janet
Stotsky, and Reint Gropp.p. cm.— (Occasional paper, ISSN 0251-6365 ; no. 180)
Includes bibliographical references.ISBN 1-55775-813-1 (alk. paper)
1. Revenue—Econometric models. 2. Free trade—Econometric models.3. International trade—Econometric models. I. Stotsky, Janet Gale.II. Gropp, Reint. III. Series: Occasional paper (International MonetaryFund) ; no. 180.HJ2305.E24 1999336.02—dc21 99-30339
CIP
Price: US$18.00(US$15.00 to full-time faculty members and
students at universities and colleges)
Please send orders to:International Monetary Fund, Publication Services
700 19th Street, N.W., Washington, D.C. 20431, U.S.A.Tel: (202) 623-7430 Telefax: (202) 623-7201
E-mail: [email protected]: http://www.imf.org
recycled paper
©International Monetary Fund. Not for Redistribution
Contents
Page
Prfeface v
I Introduction I
II Potential Revenue Implications of Trade Reform 3Reform of Quantitative Restrictions 3Tariff Reform 4Reduction of Export Taxes 6Development of Regional Trade Arrangements 6Revenue Implications of the Indirect and Interactive Effects
of Liberalization 6Conclusions 7
III Analysis of Trade Liberalization and Revenue Developments 9
Trade Liberalization Strategies and Revenue Implications:A Comparative Analysis 9
Trade Liberalization and Revenue Trends 13Econometric Analysis 15
IV Conclusions 26
Appendices
I Summary Measures for the Countries in theComparative Analysis 27
II Collected Tariff Rates and Tariff Revenue for Selected Countries 34
References 39
BoxesII 1. Efficiency Gains from Trade Liberalization and
the Budget Constraint 42. Best Practices 8
III 3. Trade Liberalization in Small, Open Economies 15
Tables
Section
III 1. Collected Tariff Rates by World Region 142. Taxes on International Trade by World Region 163. Selected African Countries: Tax Revenue and Taxes
on International Trade 18
iii
©International Monetary Fund. Not for Redistribution
CONTENTS
4. Tariff Revenue and Collected Tariff Rates for the SampleUsed to Estimate Model A 20
5. Determinants of Import and Trade Tax Revenue, Model A 206. Results of the Instrumental Variable Approach, Model B 237. Results of the Regional Instrumental Variable Approach, Model B 24
Appendix
I 8. Argentina: Summary Measures of Economic Performanceand Revenue Trends 28
9. Malawi: Summary Measures of Economic Performanceand Revenue Trends 29
10. Morocco: Summary Measures of Economic Performanceand Revenue Trends 30
11. Philippines: Summary Measures of Economic Performanceand Revenue Trends 31
12. Poland: Summary Measures of Economic Performance andRevenue Trends 32
13. Senegal: Summary Measures of Economic Performance andRevenue Trends 33
II 14. Selected Countries: Collected Tariff Rates 3415. Selected Countries: Tariff Revenue 3616. Countries Included in the Sample for Model A 38
Figures
I 1. Taxes on International Trade by World Region 2III 2. Selected African Countries: Trends in Collected Tariff Rates
and Tariff Revenue-GDP Ratios 17
The following symbols have been used throughout this paper:
. . . to indicate that data are not available;
n.a. to indicate not applicable;— to indicate that the figure is zero or less than half the final digit shown, or that the item
does not exist;- between years or months (e.g., 1994-95 or January-June) to indicate the years or months
covered, including the beginning and ending years or months;/ between years (e.g., 1994/95) to indicate a crop or fiscal (financial) year."Billion" means a thousand million.Minor discrepancies between constituent figures and totals are due to rounding.The term "country," as used in this paper, does not in all cases refer to a territorial entity thatis a state as understood by international law and practice; the term also covers some territo-rial entities that are not states, but for which statistical data are maintained and providedinternationally on a separate and independent basis.
iv
©International Monetary Fund. Not for Redistribution
Preface
A recent Occasional Paper by the staff of the Fiscal Affairs Department of the IMFtitled Fiscal Reforms in Low-Income Countries: Experience Under IMF-SupportedPrograms observed that some countries with Structural Adjustment Facility (SAF)and Enhanced Structural Adjustment Facility (ESAF) programs with the IMF had tar-geted an increased reliance on revenue from international trade taxes or, in any event,had attained higher ratios of international trade taxes to GDP at the end of theSAF/ESAF-supported adjustment period. This had occurred despite the countries' ap-parent commitment to trade liberalization. More generally, for many developingcountries, taxes on international trade are still a significant source of revenue.Whereas export tax revenue has declined sharply since the mid-1970s, the same can-not be said of import tariff revenue. The taxation of imports, even as these countriespursued tariff reform, continued to account for a high proportion of total tax receiptsin the mid-1990s and were only marginally below the corresponding level in the mid-1970s.
The apparent contradiction between trade liberalization and continuing high tradetax revenue raises the important question of how, precisely, the one affects the other.Although policymakers generally recognize the long-term benefits of trade liberal-ization, some have argued for at least a slower pace, in part because of revenue con-cerns. This paper seeks to address these issues in three complementary ways: throughan overview of the factors that may have a bearing on the question, through a reviewof trends in trade tax revenue both globally and in selected countries, and througheconometric analysis.
The authors are especially indebted to George T. Abed for his overall guidance andhelpful suggestions on the various drafts. The authors also thank the IMF'sExecutive Board members for comments and suggestions and would like to recog-nize the comments received from numerous colleagues, notably Stanley Fischer,Jesus Seade, Robert Sharer, Michael Keen, Julio Escolano, Angelo Faria, VictoriaSummers, and Judy Dean. The comparative analysis of selected countries owesmuch to input received from Dominique Simard and Zuhtu Yucelik. AsegedechWoldeMariam worked tirelessly and with great precision at compiling the data un-derlying the tables and the econometric analysis. Administrative support was ablyprovided by Lyndsey Livingstone and Agnes Basilio. Michael Treadway and JuanitaRoushdy of the External Relations Department edited the paper and coordinated pro-duction of the publication.
The opinions expressed in the paper are those of the authors and do not necessarilyreflect the views of the IMF or its Executive Directors.
An IMF News Brief containing highlights of this paper and a summary of discus-sion at an IMF Executive Board seminar on the topic was released on February 25,1999, and is available at www.imf.org/external/np/sec/nb/1999/NB9908.HTM.
V
©International Monetary Fund. Not for Redistribution

This page intentionally left blank
©International Monetary Fund. Not for Redistribution
I Introduction
n recent decades many countries have dismantledtrade barriers and opened their economies to inter-
national competition. Trade liberalization is seen topromote economic efficiency, international competi-tiveness, and an expansion of trade, perhaps espe-cially in imperfectly competitive markets.1 Yet de-spite this progress in trade liberalization, asevidenced by the conclusion of the Uruguay Roundin 1994 and the establishment of the World TradeOrganization (WTO) in 1995,2 trade barriers are stillwidespread. Some economies and some sectors (e.g.,agriculture in many industrial countries) remain rel-atively insulated from the global economy by a vari-ety of nontariff and tariff barriers, even as importsubstitution continues to lose ground as a strategy foreconomic development.
The argument that trade liberalization enhanceseconomic efficiency and accelerates growth is nownearly universally accepted. However, because freertrade may lead to a loss of tax revenue as tariffs andother trade taxes are cut, it is important to evaluatethe revenue implications of trade liberalization, fo-cusing on what has actually happened to revenueduring liberalization, with a view to drawing policyimplications. Clearly, for countries with significantfiscal imbalances, any loss of revenue would be animportant consideration.3 Moreover, for many devel-oping countries, taxes on international trade are alarge source of revenue. Indeed, an impetus for thispaper was the observation, in a recent evaluation ofIMF-approved Structural Adjustment Facility (SAF)and Extended Structural Adjustment Facility (ESAF)programs, that some countries had targeted an in-
1See Escolano (1995), Farhadian-Lorie and Katz (1988),Helpman and Krugman (1989), Krueger (1995), andSubramanian, Ibrahim, and Torres-Castro (1993).
2In addition to progress on the multilateral front, trade liberal-ization has also resulted in an increased reliance on regional tradearrangements. See Harmsen and Leidy (1994).
3For example, the group of African countries that entered intoStructural Adjustment Facility or Extended Structural AdjustmentFacility arrangements with the IMF during the 1980s and 1990shad overall fiscal deficits averaging more than 9 percent of GDPin the year immediately preceding the program. See Abed andothers (1998).
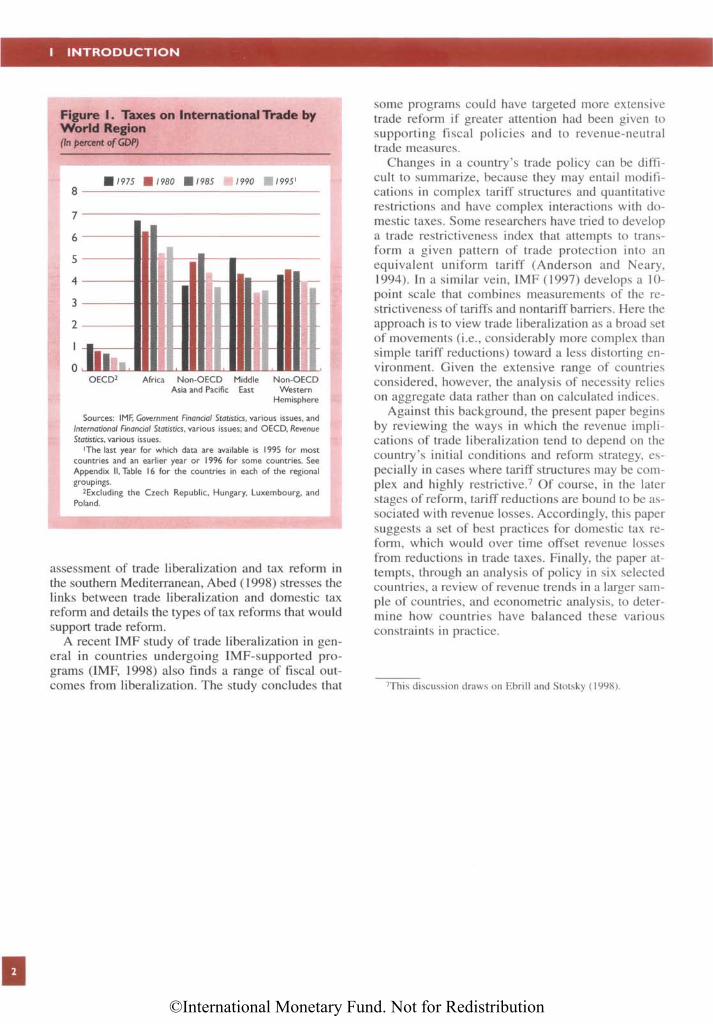
creased reliance on revenue from international tradetaxes or, in any event, had attained higher ratios ofinternational trade tax revenue to GDP at the end ofthe SAF/ESAF-supported adjustment period. Thishad occurred despite an apparent commitment totrade liberalization (Abed and others, 1998). Manyof these countries are in Africa, where despite a de-clining, if uneven, trend, trade taxes accounted forabout 5 1/2 percent of GDP on average in 1995 (Figure1).4
The revenue implications of trade liberalizationare, in general, uncertain. Blejer and Cheasty (1990)and Tanzi (1989) conclude that ultimately the net im-pact of trade reform on revenue is an empirical mat-ter.5 Similarly, in a case study analysis of the revenueimplications of World Bank-supported StructuralAdjustment Loans, Greenaway and Milner (1991)conclude that a range of outcomes is possible, de-pending on the country's initial conditions and thecomponents of the reform package. In related work,the World Bank has considered the interaction be-tween the reform of trade taxes and that of domestictaxes in World Bank programs. Rajaram (1994) ex-amines whether the revenue effects of tariff reformproposals were anticipated and complemented byother tax measures. He finds that in some but not allcases the revenue implications of trade reform andcomplementary reforms of the domestic tax systemwere considered. He suggests that a more systematicintegration of revenue and trade protection objectivesin World Bank programs is needed. Mitra (1992) andDatta-Mitra (1997) also conclude that, in some coun-tries with World Bank reform programs, greater em-phasis on revenue issues is called for.6 Finally, in an
4Because of data limitations, tariffs cannot always be separatedfrom other taxes, such as excise and sales taxes, that are also col-lected at customs (e.g., in Burkina Faso, Mali, and Tanzania). Inaddition, some countries in the CFA franc zone of West andCentral Africa levy charges on reexports (primarily to Nigeria),which cannot be distinguished from export taxes.
5In related analyses, Bevan (1995), Feltenstein (1992), andTokarick (1995) use applied general equilibrium analysis to eval-uate the effect of trade liberalization on fiscal variables.
6See also Thomas and others (1991) and Papageorgiou, Choksi,and Michaely (1990).
I
I
©International Monetary Fund. Not for Redistribution
I INTRODUCTION
Figure I. Taxes on International Trade byWorld Region(In percent of GDP)
Sources: IMF, Government Financial Statistics, various issues, andInternational Financial Statistics, various issues; and OECD, RevenuStatistics, various issues.
1The last year for which data are available is 1995 for mostcountries and an earlier year or 1996 for some countries. SeeAppendix II, Table 16 for the countries in each of the regionalgroupings.
2Excluding the Czech Republic, Hungary, Luxembourg, andPoland.
assessment of trade liberalization and tax reform inthe southern Mediterranean, Abed (1998) stresses thelinks between trade liberalization and domestic taxreform and details the types of tax reforms that wouldsupport trade reform.
A recent IMF study of trade liberalization in gen-eral in countries undergoing IMF-supported pro-grams (IMF, 1998) also finds a range of fiscal out-comes from liberalization. The study concludes that
some programs could have targeted more extensivetrade reform if greater attention had been given tosupporting fiscal policies and to revenue-neutraltrade measures.
Changes in a country's trade policy can be diffi-cult to summarize, because they may entail modifi-cations in complex tariff structures and quantitativerestrictions and have complex interactions with do-mestic taxes. Some researchers have tried to developa trade restrictiveness index that attempts to trans-form a given pattern of trade protection into anequivalent uniform tariff (Anderson and Neary,1994). In a similar vein, IMF (1997) develops a 10point scale that combines measurements of the restrictiveness of tariffs and nontariff barriers. Here theapproach is to view trade liberalization as a broad setof movements (i.e., considerably more complex thansimple tariff reductions) toward a less distorting en-vironment. Given the extensive range of countriesconsidered, however, the analysis of necessity relieson aggregate data rather than on calculated indices.
Against this background, the present paper beginsby reviewing the ways in which the revenue impli-cations of trade liberalization tend to depend on thcountry's initial conditions and reform strategy, es-pecially in cases where tariff structures may be com-plex and highly restrictive.7 Of course, in the laterstages of reform, tariff reductions are bound to be as-sociated with revenue losses. Accordingly, this papersuggests a set of best practices for domestic tax reform, which would over time offset revenue lossesfrom reductions in trade taxes. Finally, the paper at-tempts, through an analysis of policy in six selectedcountries, a review of revenue trends in a larger sam-ple of countries, and econometric analysis, to deter-mine how countries have balanced these variousconstraints in practice.
7This discussion draws on Ebrill and Stotsky (1998).
2
©International Monetary Fund. Not for Redistribution
II Potential Revenue Implications ofTrade Reform
conomists often rank trade liberalization reformsby order of importance, giving highest priority to
the reduction or removal of quantitative restrictionsand other nontariff barriers to trade or their conver-sion to tariffs. This is followed by reductions in boththe number of distinct tariff rates and the range thatthey cover (i.e., their dispersion) and finally by re-ductions in the levels of tariffs. Although this liberal-ization strategy is typically justified on economic ef-ficiency grounds (Box 1), the initial focus on theremoval of nontariff barriers also has the advantageof helping preserve the revenue yield. The agenda fortrade reform is also influenced by international prac-tice and agreements and, in particular, by WTO rulesand agreements on the design of trade reform.1
Reform of Quantitative Restrictions
In their study of countries undergoing WorldBank-assisted trade liberalization, Papageorgiou,Choksi, and Michaely (1990) conclude that signifi-cant reductions in quantitative restrictions have oftenbeen a component of successful liberalization.Takacs (1990) outlines the different methods of lib-eralizing import quotas. These include
• Gradually raising quota ceilings to nonbindinglevels.
• Converting quotas into equivalent tariffs (tariffi-cation), with the goal of later reducing these tar-iffs. The equivalent tariff is set at a rate equal tothe percentage difference between the domesticprice and the import (world) price under thequantitative restriction.
• Auctioning licenses or permits to import a spe-cific quantity of the item.2 The number of li-censes can then be gradually increased, or theselicenses can be converted into tariffs.
1In addition, trade and trade-related measures recommended bythe IMF should be consistent with members' obligations underWTO agreements.
2If license fees exceed the cost of issuing the license, there issome potential for license fees to violate WTO rules.
• Converting quotas to tariff quotas and then re-ducing the tariff rates. Under a tariff quota, onetariff rate is applied to some specified volume ofimports and a higher, often prohibitive, rate toany imports above that volume.
Of course, quantitative restrictions take manyforms other than quotas, including bans, restrictivegranting of import licenses, and state trading mo-nopolies. There may also be limits on the ability ofimporters to buy foreign exchange, which often giverise to black markets in foreign currencies. These re-strictions, which encourage rent seeking, have seri-ous efficiency and distributional implications.
Typically, countries liberalize quantitative restric-tions gradually, to minimize politically contentiousdisruptions to the domestic economy and to preventa surge in imports that could lead to balance of pay-ments problems. Maintenance of such restrictionsmay indeed temporarily limit imports, but balance ofpayments problems are best dealt with through ap-propriate macroeconomic policies, not through tradebarriers. Restrictions are also usually reduced oreliminated first on raw materials, intermediategoods, and other goods not viewed as competingwith domestic production. These reforms are thenextended to final goods, including those competingwith domestic production.
The channel by which the elimination of quantita-tive restrictions affects trade revenue will differ de-pending on the nature of the restriction and how it iseliminated. Tariffication of quotas that produces nochange in the level of imports, for example, wouldlead to an increase in revenue, as economic rents aretransferred to the government in the form of highertrade tax revenue. In addition, many goods subject toquotas are also subject to tariffs. Accordingly, if quo-tas are eliminated on these goods, revenue may in-crease as the value of imports of goods subject to tar-iffs increases (the volume is likely to increase, butthe price of these previously restricted imports islikely to fall).
The impact on import volumes and revenue of re-laxing quantitative restrictions also depends on theextent to which countries are able to improve their
3
E
©International Monetary Fund. Not for Redistribution
II POTENTIAL REVENUE IMPLICATIONS OF TRADE REFORM
Box I. Efficiency Gains from Trade Liberalization and the Budget Constraint
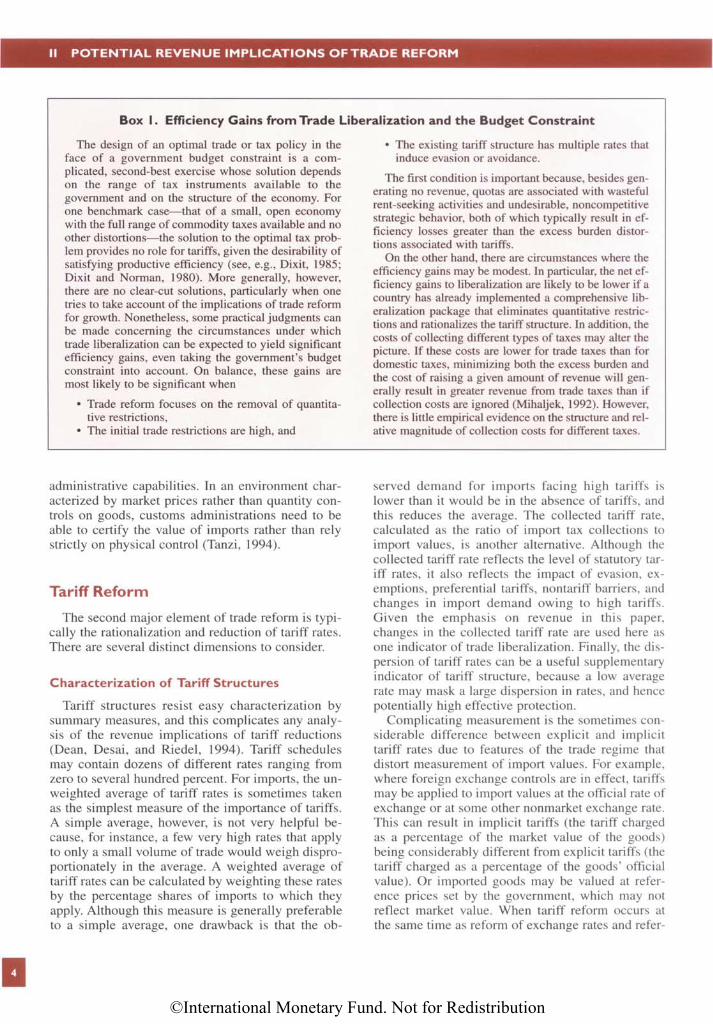
The design of an optimal trade or tax policy in theface of a government budget constraint is a com-plicated, second-best exercise whose solution dependson the range of tax instruments available to thegovernment and on the structure of the economy. Forone benchmark case—that of a small, open economywith the full range of commodity taxes available and noother distortions—the solution to the optimal tax prob-lem provides no role for tariffs, given the desirability ofsatisfying productive efficiency (see, e.g., Dixit, 1985;Dixit and Norman, 1980). More generally, however,there are no clear-cut solutions, particularly when onetries to take account of the implications of trade reformfor growth. Nonetheless, some practical judgments canbe made concerning the circumstances under whichtrade liberalization can be expected to yield significantefficiency gains, even taking the government's budgetconstraint into account. On balance, these gains aremost likely to be significant when
• Trade reform focuses on the removal of quantita-tive restrictions,
• The initial trade restrictions are high, and
• The existing tariff structure has multiple rates thatinduce evasion or avoidance.
The first condition is important because, besides gen-erating no revenue, quotas are associated with wastefulrent-seeking activities and undesirable, noncompetitivestrategic behavior, both of which typically result in ef-ficiency losses greater than the excess burden distor-tions associated with tariffs.
On the other hand, there are circumstances where theefficiency gains may be modest. In particular, the net ef-ficiency gains to liberalization are likely to be lower if acountry has already implemented a comprehensive lib-eralization package that eliminates quantitative restric-tions and rationalizes the tariff structure. In addition, thecosts of collecting different types of taxes may alter thepicture. If these costs are lower for trade taxes than fordomestic taxes, minimizing both the excess burden andthe cost of raising a given amount of revenue will gen-erally result in greater revenue from trade taxes than ifcollection costs are ignored (Mihaljek, 1992). However,there is little empirical evidence on the structure and rel-ative magnitude of collection costs for different taxes.
administrative capabilities. In an environment char-acterized by market prices rather than quantity con-trols on goods, customs administrations need to beable to certify the value of imports rather than relystrictly on physical control (Tanzi, 1994).
Tariff Reform
The second major element of trade reform is typi-cally the rationalization and reduction of tariff rates.There are several distinct dimensions to consider.
Characterization of Tariff Structures
Tariff structures resist easy characterization bysummary measures, and this complicates any analy-sis of the revenue implications of tariff reductions(Dean, Desai, and Riedel, 1994). Tariff schedulesmay contain dozens of different rates ranging fromzero to several hundred percent. For imports, the un-weighted average of tariff rates is sometimes takenas the simplest measure of the importance of tariffs.A simple average, however, is not very helpful be-cause, for instance, a few very high rates that applyto only a small volume of trade would weigh dispro-portionately in the average. A weighted average oftariff rates can be calculated by weighting these ratesby the percentage shares of imports to which theyapply. Although this measure is generally preferableto a simple average, one drawback is that the ob-
served demand for imports facing high tariffs islower than it would be in the absence of tariffs, andthis reduces the average. The collected tariff rate,calculated as the ratio of import tax collections toimport values, is another alternative. Although thecollected tariff rate reflects the level of statutory tar-iff rates, it also reflects the impact of evasion, ex-emptions, preferential tariffs, nontariff barriers, andchanges in import demand owing to high tariffs.Given the emphasis on revenue in this paper,changes in the collected tariff rate are used here asone indicator of trade liberalization. Finally, the dis-persion of tariff rates can be a useful supplementaryindicator of tariff structure, because a low averagerate may mask a large dispersion in rates, and hencepotentially high effective protection.
Complicating measurement is the sometimes con-siderable difference between explicit and implicittariff rates due to features of the trade regime thatdistort measurement of import values. For example,where foreign exchange controls are in effect, tariffsmay be applied to import values at the official rate ofexchange or at some other nonmarket exchange rate.This can result in implicit tariffs (the tariff chargedas a percentage of the market value of the goods)being considerably different from explicit tariffs (thetariff charged as a percentage of the goods' officialvalue). Or imported goods may be valued at refer-ence prices set by the government, which may notreflect market value. When tariff reform occurs atthe same time as reform of exchange rates and refer-
4
©International Monetary Fund. Not for Redistribution
Tariff Reform
ence prices, changes in explicit tariffs may be a mis-leading indicator of changes in implicit tariffs be-cause of these changes in valuation of the goods.
Reductions in Tariff Levels
The effect of tariff reductions on revenue dependson the levels and coverage of tariffs in effect beforethe reduction and on the extent to which they arethen reduced. The precise impact is difficult to pre-dict because it depends on complex economic re-sponses. If import values are unchanged, the imme-diate effect of a reduction in tariff rates is to lowerrevenue. If goods subject to trade taxes are includedin the base of domestic taxes on imports, this reduc-tion in trade taxes will also be accompanied by a re-duction in excise and value-added tax (VAT) collec-tions levied on imports.3
The value of imports, however, can be expected tochange in response to tariff reductions. If the priceelasticity of net demand for imports is sufficientlyhigh, the revenue gain due to increased demand forthe now-cheaper imports may compensate for or evenoutweigh the revenue loss due to the tariff cut itself.4
Although it is difficult to generalize, demand for im-ports of final consumption goods is likely to be moreprice elastic than that for imports of intermediategoods and raw materials (see, e.g., Clarida, 1996). Inmany developing countries, imports of consumergoods constitute only about 10 to 20 percent of totalimports but are often taxed at the highest rates. Sincemany trade liberalization programs involve a dispro-portionate reduction in higher tariff rates, the demandelasticity of those goods subject to tariff reductionsmight be quite high, mitigating the revenue losses.5
The response of import values also depends on theprice elasticity of supply of import substitutes. Theless elastic this supply, the smaller the reduction inoutput for a given fall in price and hence the smaller
3The precise outcome will depend on how the market prices ofgoods adjust. If, for instance, the market prices of goods that useimported inputs do not fall, then, implicitly, domestic value addedon these goods has risen and VAT revenue would not fall.
4The revenue impact of a tariff change actually depends on theelasticities of both demand and supply. The revenue-maximizingtariff will be t = (e s - e j)/-e s(1 + ed), where t is the ad valoremtariff rate, Es is the elasticity of import supply, and e d is the elas-ticity of import demand. See Blinder (1981) for an elaboration ofthis point. Note that the (absolute values of the) elasticities re-quired to ensure that the value of imports increases following atariff rate reduction would typically be less than those required toensure an increase in tariff revenue, since the share of the tariff inthe total price declines with the tariff rate reduction.
5Above-average tax rates are also often levied on inelasticallydemanded goods such as alcohol and tobacco, for both revenueand protection purposes. The focus of trade liberalization policiesin these cases should be on ensuring that domestic production isnot favored while satisfying revenue objectives.
the increase in import values. Moreover, since priceelasticities of demand and supply typically are notconstant over the entire range of prices, the startingpoint for tariff reform is also likely to affect the eco-nomic response. Indeed, if protectionist motives havedominated the setting of tariff rates, tariffs may beabove their revenue-maximizing levels.
Reduction in Tariff Dispersion
Although it depends somewhat on the circum-stances, reducing tariff dispersion is typically consis-tent with a reduction in average effective protection.The revenue implications of reducing tariff dispersionare more ambiguous. If tariff reform reduces the dis-persion of tariffs around an average value by lower-ing the higher tariffs and increasing the lower ones,the revenue effects would depend in part on the rela-tive price elasticities of demand of the goods affected.On the presumption that higher tariffs levied for pro-tection purposes apply mainly to elastically de-manded goods, a reduction in tariff dispersion willtend to increase revenue. To the extent that reductionsin tariff dispersion significantly reduce effective ratesof protection, tariff revenue effects will tend to be fur-ther mitigated as imports replace import-competingproduction. Alternatively, a reduction in the disper-sion of tariffs is often accompanied by an increase inthe minimum rate, which could imply some overallincrease in the average rate (at least temporarily), andthis also bolsters the prospect that revenue would in-crease. This approach, however, is less common andmay be restricted by WTO tariff bindings. (These arecommitments undertaken by countries within theWTO not to raise tariffs on certain goods above aspecified level.) Reducing tariff dispersion could alsobolster revenue by reducing tax evasion (see below).Taxes that are levied at a uniform rate tend to mini-mize evasion and administrative difficulties, espe-cially by reducing opportunities for misclassificationand valuation mistakes.
Tariff Exemptions and Tax Evasion
In a study of several developing countries, Pritch-ett and Sethi (1994) find a nonlinear relationship be-tween statutory tariff rates and rates actually col-lected. They argue that the higher the tariff rates, thegreater the incentive for importers to put effort intoseeking exemptions. As a result, revenue tends not toincrease in proportion to an increase in tariffs. Theconverse may also apply: reducing very high tariffsmay not always lead to a proportionate fall in rev-enue. Moreover, eliminating tariff exemptions cancontribute to trade reform while preserving revenue,by broadening the tax base. In addition to their directimpact on revenue, when exemptions become more
5
©International Monetary Fund. Not for Redistribution
II POTENTIAL REVENUE IMPLICATIONS OFTRADE REFORM
prevalent, the incentive to classify taxable productsas exempt also grows, further contributing to a lowerrate of compliance.
The extent of tax evasion is directly related to thepotential benefits to would-be evaders (Tanzi andShome, 1993). The lower the tariff, the lower themarginal benefit from evasion. On the other hand,customs evasion is associated with many costs to theevader. These include the need to find alternative—often more expensive—routes to avoid customscheckpoints, to package goods so as to conceal theirpresence or their true value, and to bribe corrupt of-ficials. Other costs include those stemming from thelack of proper invoices for subsequent use of thegoods, such as crediting under a VAT, and the costsassociated with punishment for those who arecaught. Any reduction in the marginal benefit of eva-sion is therefore likely to bolster revenue.
Reduction of Export Taxes
Export taxes are typically levied on important pri-mary commodities with relatively few exporters.There are three principal arguments for export taxes.First, they can be used as a substitute for the incometax, particularly in difficult-to-tax sectors such asagriculture. Second, they can be levied on windfallgains from changes in the international prices ofcommodities. And third, for goods in which thecountry has market power, they may reduce the sup-ply and thus increase the price of the commodity ex-ported. In the main, however, export taxes are mainlyan expedient to raise revenue; improvements in thedomestic tax system would be more desirable.Conversely, given that export taxes are often claimedto be substitutes for income taxes on hard-to-tax sec-tors, their elimination will be more likely if they areimplemented as part of an overall tax reform pack-age to broaden the tax base.
Export taxes often are levied as a combination ofa basic tax and a progressively rising rate on price in-crements. Alternatively, they may take the form ofimplicit taxes; examples include an overvalued cur-rency or a multiple exchange rate system, foreign ex-change surrender requirements at nonmarket ex-change rates, and the use of export marketing boardsthat do not pay producers market prices. These im-plicit taxes may distort the revenue picture in thatthey remain unrecorded.
Development of Regional TradeArrangements
Regional trade arrangements lower tariffs amongmembers but do not lower them for countries out-
side the arrangement. In the participating countries,many imports from within the region may arriveduty free, and trade tax revenue may thereforedecline even in the absence of changes in externaltariff rates. Foroutan (1993, p. 255) argues thatrevenue considerations in trade liberalization clashwith the conditions that minimize the likelihoodof trade diversion from outside the region to withinthe region. These conditions are, first, that thepartners have extensive trade links and, second,that they not raise their trade barriers with the restof the world. But the stronger the trade links amongthe partners, the greater the likelihood of a revenueloss from regional trade integration.6 In fact, how-ever, intraregional trade linkages among low-income countries participating in regional arrange-ments are often weak. Finally, the preexistence ofregional trade agreements may mitigate the revenueeffect of subsequent reductions in external tariffrates.7
Revenue Implications of the Indirectand Interactive Effects of Liberalization
Trade liberalization can interact with the domestictax system and the macroeconomic environment,with implications for economic growth, revenue, andthe overall budget.
Import Composition and Economic Growth
Both relaxation of quantitative restrictions and re-form of tariffs may lead to changes in the composi-tion of imports. It is difficult, however, to predictsuch changes, because they are likely to vary acrosscountries. In particular, if trade reforms diminish theshare of import-substituting industries in the econ-omy, imports of the goods produced by these indus-tries will increase. If these goods are taxed at ahigher-than-average rate, this might induce an in-crease in revenue.
Considerable evidence has accumulated over timethat trade liberalization is linked to higher rates ofeconomic growth, which is its main objective(Escolano, 1995). Trade liberalization leads both to abetter static allocation of resources and to a higherrate of output growth in the long run. This enhancedgrowth leads to expansion of tax bases, with a con-comitant expansion of revenue potential. Over time,the influence of economic growth on revenue may
6However, in assessing the revenue implications of regionaltrade arrangements, it should also be noted that such arrange-ments are typically implemented only over a transition period.
7Regional trade arrangements may also influence the likelihoodof further trade liberalization (Bhagwati and Panagariya, 1996).
6
©International Monetary Fund. Not for Redistribution
Revenue Implications of Indirect and Interactive Effects of Liberalization
dominate the influence of shorter-term changes inthe trade regime.8 To the extent that growth follow-ing liberalization is associated with an increased im-portance of trade, the ratio of trade taxes to GDPwould tend to increase for a given level of tariffs.That said, along with this growth, the composition ofrevenue is also likely to change over time, with in-creased reliance on domestic taxes and reduced re-liance on trade taxes, consistent with reductions intariff rates.
The Role of Domestic and InternationalTrade Taxes
Domestic indirect taxes may reinforce the protec-tive elements of trade taxes through several channels.One is through the differential application of VATs toimports and domestic production.9 Such discrimina-tion is rare, although in a few cases surcharges areadded to the VAT on imports. More common is thedifferential application of excise taxes to imports andto domestic production. Some countries apply twodifferent schedules of excise rates, levying lowerrates on imports than on domestic production—insome commonwealth countries, excise taxes applyonly to domestic production.
Interactions with Accompanying Policies
Reform of tax policy and of tax and customs ad-ministration, by protecting the revenue base, pro-vides essential support to trade liberalization. Suc-cessful trade liberalization can be greatly facilitatedif steps are taken to strengthen domestic taxes, espe-cially at the earliest stages of the process, because ittakes time for tax and customs administrations toimprove revenue collection. Box 2 outlines the criti-cal reforms needed to improve tax structure and ad-ministration in low-income countries. In Africa,where there is a particularly heavy reliance on tradetaxes, a number of countries have reformed theirtax systems. A relevant example is Benin, althoughother countries have also made substantial progress(Abed and others, 1998). However, even when pur-suing comprehensive tax reform, many countriesfacing fiscal imbalances have also resorted to short-
8Alternatively, the longer-term growth impact of trade liberal-ization works to alleviate concerns that measured elasticities ofsupply and demand are insufficiently high to offset the direct rev-enue consequences of tariff rate reductions.
9If a good is not produced domestically (e.g., automobiles inmany countries, wine in some industrial countries), an excise taxand a tariff will have an equivalent effect if levied at the samerate. However, a tariff may induce domestic firms to begin pro-ducing the good, because it would confer an advantage on them,whereas an excise tax, applied without discrimination to both im-ports and domestic production, would not.
term measures to mobilize revenue until the struc-tural reforms take effect. For example, an importantthrust of Kenya's fiscal reforms was to lower the av-erage rate of effective protection, reduce the disper-sion of rates, and phase out export duties. However,the authorities also planned to introduce a presump-tive tax of 5 percent on the value of gross sales ofagricultural products to offset the revenue loss fromeliminating the export tax on coffee and tea.
Interactions with MacroeconomicDevelopments
The economic adjustments to trade liberalizationmay include significant changes in the macroecon-omy as well. If trade balances initially worsen withtariff reductions, the currency may depreciate. In-deed, in many cases trade reform is accompanied byan intentional devaluation to forestall the need foroffsetting adjustments to fiscal and monetary policy.In general, the effect of a fall in value of the cur-rency on trade tax revenue is ambiguous (Tanzi,1989). One benchmark case, however, occurs whenthe demand for imports is relatively inelastic. Theincrease in the value of imports in domestic currencyterms following a depreciation can then bolster rev-enue, as was found in several successful stabilizationcases in African countries, where a large share of im-ports consists of price-inelastic necessities withoutclose domestic substitutes.
The 1994 devaluation of the CFA franc under-scores the importance of the circumstances sur-rounding a change in the value of a currency for taxrevenue. The CFA franc (the currency used by sev-eral francophone countries in West and CentralAfrica) had been overvalued prior to the devalua-tion, and imports had fallen because of weak eco-nomic activity in the region. Accordingly, when thecurrency was devalued as part of an overall adjust-ment package, imports by countries in the CFA franczone expanded sharply (from 25.4 percent of GDP in1993 to 34.8 percent in 1994) as a result of the over-all recovery in demand. This surge had a positiveimpact on revenue.10
Conclusions
The revenue implications of trade liberalizationwill depend significantly on the form of liberaliza-tion and the circumstances under which it occurs.What is important for the analysis that follows is thatcertain trade reform strategies can achieve consider-
10The CFA franc devaluation was also associated with a seriesof IMF-supported adjustment programs for the countries involved(Clement and others, 1996).
7
©International Monetary Fund. Not for Redistribution
II POTENTIAL REVENUE IMPLICATIONS OF TRADE REFORM
Box 2. Best Practices
Theoretical and practical considerations have yieldeda set of best practices in tax and tariff systems in devel-oping countries (Abed, 1998; Shome, 1995). The besttax systems are those that cause a minimum of distor-tion in the allocation of resources, are equitable, and arerelatively easy to administer.
In practice, comprehensive tax and tariff policy re-forms typically include most or all of the following keyelements:
• A broad-based consumption tax, notably a VAT,should be introduced or strengthened, preferablywith a single rate, minimal exemptions, and athreshold to exclude smaller enterprises from taxa-tion. Although VATs are often initially applied tomanufactures and imports, they are typically sub-sequently extended to the distribution sector and toagricultural inputs. Experience suggests that excisetaxes should be restricted to a limited list of prod-ucts, principally petroleum products, alcohol, andtobacco. VATs and excises should be appliedequally to imports and domestic products.
• Taxes on international trade should play a minimalrole. Import tariffs should have a low average rateand a limited dispersion of rates, to reduce arbi-trary and excessive rates of protection. Exportersshould have duties rebated on imported inputs usedfor producing exports. Export duties should gener-ally be avoided.
• The personal income tax should be characterizedby only a few brackets and a moderate top mar-
ginal rate, by limited personal exemptions and de-ductions, by a standard exemption that excludespersons with low incomes, and by extensive use offinal withholding. The corporate income taxshould be levied at one moderate rate.Depreciation allowances should be uniform acrosssectors. There should be little use of tax incentives.
• These reforms may be usefully complemented insome countries by the introduction of a simplifiedtax regime for small businesses and the informalsector.
• Nontax revenue, to the extent that it reflects the ex-traction of surpluses from state enterprises or prof-its from central bank operations, should declinewith the development of the economy and, espe-cially, with the devolution of the state's role in pro-ductive activities.
• Reform of tax and customs administrations shouldinclude modernization of systems and procedures.Simplification of the tax and tariff systems is aprerequisite for administrative reforms. Typicalreforms stress the reorganization of tax and cus-toms administrations along functional lines; theadoption of effective procedures for a nationalsystem of unique taxpayer identification numbers;strengthening of audits; and improvement of tax-payer services. Computerization is generally acentral component of reform, along with upgrad-ing the skills of tax and customs officers and pro-viding them with administrative autonomy andpay incentives.
able trade liberalization without overly adverse con-sequences for revenue mobilization. In principle,some strategies could even lead to increased rev-enue, especially in the initial stages of trade reform.Specifically, revenue will likely be least affected,and could increase, when
• The initial position is highly restrictive• Trade liberalization involves the tariffication of
quantitative restrictions, the auctioning of li-censes to import, or both
• Trade liberalization includes such reforms as a re-duction in tariff dispersion, the introduction of aminimum tariff, or the elimination of exemptions
• Trade liberalization is accompanied by reformsin customs and tax administrations, which alsoreduce the incentives to evade taxes, and
• Trade liberalization is supported by soundmacroeconomic policies that ensure that liberal-ization is consistent with external balance.
Finally, even though certain trade reform strate-gies can minimize adverse revenue consequences, itmay well be the case that trade liberalization wouldbe pursued more vigorously if revenue concernswere absent. This point underscores the urgency ofreforming domestic tax systems to diversify revenuebases.
8
©International Monetary Fund. Not for Redistribution
Ill Analysis of Trade Liberalization andRevenue Developments
his section considers the interplay between tradeliberalization and revenue from international
trade taxes in recent decades. The intent is to reviewwhat has actually occurred, in order to gain insightinto the factors that govern the revenue conse-quences of trade liberalization and the related issueof how countries have pursued liberalization.
Trade Liberalization Strategiesand Revenue Implications:A Comparative Analysis
A detailed comparison of country experiences is auseful way of examining the interaction among themany dimensions of trade liberalization, their rev-enue implications, and the economic circumstancesof individual countries. The six countries whose his-tories of trade liberalization are described in this sec-tion—Argentina, Malawi, Morocco, the Philippines,Poland, and Senegal—all have considerable experi-ence with trade reform, which has sometimesoccurred in phases. They were selected to provide arange of country experience, with a focus on Africa,where some of the issues concerning the revenueimpact of trade reform have received particularattention. The selection is not, however, intended tobe representative of other countries but merelyillustrative.
The discussion of Argentina focuses on that coun-try's reforms in two distinct periods: from 1987 to1991, and since 1991. The discussion of Malawi fo-cuses on the late 1980s and mid-1990s. In the case ofMorocco, a distinction can be made between themacroeconomic context of the reforms implementedin the 1980s and that of more recent reforms. In thePhilippines, trade reform was implemented at a timeof weak overall revenue performance in the mid-1980s. The discussion of Poland covers the periodsince 1990, the beginning of its transformation into amarket economy, and thus its trade policy reformsexemplify the case of a transition economy. InSenegal, the reform process can again be decom-posed into phases: an initial phase in the mid-1980sand a subsequent phase beginning in 1994.
Trade Liberalization Measures
How have these countries handled each of themany dimensions of trade reform? First, in the areaof reform of nontariff barriers, reducing quantitativerestrictions was a priority in all cases, although thepace and nature of that reform appear to have re-flected revenue concerns, among others. Poland in1990 placed a strong emphasis on eliminating quan-titative restrictions: their removal was integral to thecountry's "big bang" transformation. The 1991 tradereform package in Argentina included tariffication ofthe automobile import quota and the elimination ofsome reference prices. Both Malawi and Senegalpursued strategies in the late 1980s and the 1990sthat stressed bolstering the domestic tax systemwhile moving less rapidly with the outright elimina-tion of quantitative restrictions. Nonetheless, bothmade progress in reducing such restrictions.Malawi's trade liberalization program in the late1980s included a focus on eliminating foreign ex-change rationing. Similarly, Senegal embarked in1986 on a phased reduction of quantitative restric-tions, concentrating initially on goods not producedlocally. The Philippines focused on the tarifficationof quantitative restrictions during the initial phasesof its trade liberalization efforts. Finally, reflecting atrade liberalization strategy adopted in 1983,Morocco's reforms included a gradual elimination ofquantitative restrictions on imports and the abolitionof import deposit requirements.
Again, all cases stressed tariff reductions in theirreform programs, although with hesitation at times.Morocco's reductions in statutory tariffs resulted in adecline in the collected tariff rate1 from 26.3 percentin 1980 to 14.9 percent in 1995 (Table 10 inAppendix I). This success owes much to improvedstabilization policies, which supported an opening ofthe economy that led to a strengthened performance
1As already mentioned, the collected tariff rate is the ratio ofimport tax collections to import values. Reference is also made inthis paper to the collected trade tax rate, which is the ratio of tradetaxes—including export taxes—to the value of trade (importsplus exports).
9
T
©International Monetary Fund. Not for Redistribution
Ill ANALYSIS OF TRADE LIBERALIZATION AND REVENUE DEVELOPMENTS
of domestic tax revenue. In contrast, Senegal's earlyliberalization efforts in the mid-1980s faltered in theface of weaknesses in macroeconomic managementand stagnant trade; as a consequence, tariff reduc-tions were accompanied by serious revenue short-falls, which led to a reversal of the tariff cuts.Senegal's second phase, implemented in conjunctionwith the 1994 devaluation of the CFA franc, wasmore successful. In the Philippines, reduced relianceon trade taxes has at times been constrained by theweakness of domestic tax mobilization. The tariffi-cation of quotas there has already been noted. In ad-dition, the Philippines imposed a temporary importsurcharge in the early 1990s. As a result, the col-lected tariff rate declined only slightly, from 16.7percent in 1985 to 14.4 percent in 1995 (Table 11 inAppendix I). Poland adopted comprehensive tradeliberalization at the outset of its transformation pro-gram in 1990, with a view to using internationalprices as a guide to price formation within the do-mestic economy. However, in the face of sharp out-put declines and revenue pressures, some reversalsoccurred, which have been overcome in recent yearsas reform of the economy more generally has takenhold. Finally, Malawi imposed a temporary exportlevy to address revenue shortfalls that compromisedits trade liberalization efforts.
Several of the countries accorded high priority toreducing tariff dispersion and consolidating tariffstructures. Between October 1988 and June 1991,Argentina reduced the dispersion of its existing tariffrates, in part through the introduction of a 5 percentminimum tariff in 1989; this reduction was partlyoffset by the introduction of specific duties on arange of goods. In the late 1980s, Malawi reducedthe range of its tariffs from 0-220 percent to 0-45percent; by August 1997 the maximum tariff rate hadbeen reduced to 35 percent. In its early reform ef-forts, Morocco considerably simplified and rational-ized its complex tariff schedules. The maximum tar-iff rate was reduced from 400 percent in 1982 to 60percent in 1984 and 35 percent in 1993; in addition,the number of tariff bands was reduced from 47 in1980 to 6 in 1996. Senegal also made progress in ra-tionalizing its tariff structure. In the Philippines,however, partly as a result of the tariffication of quo-tas, measured tariff dispersion was not reduced at theoutset, although later both tariff rates and tariff dis-persion were reduced.
In Argentina, as part of the 1991 reform package,which included steps to broaden the domestic taxbase, export taxes on many agricultural productswere eliminated, with the exception of unprocessedoilseeds. In Malawi in 1995, the opportunity to taxthe windfall gains associated with a sharp deprecia-tion of the currency and a deteriorating revenue per-formance led to an export levy being imposed on
certain agricultural exports, although this was ac-companied by a plan to phase it out. In Morocco, thead valorem taxes levied on exports were abolished in1995, leaving only raw phosphate exports subject toa specific tax.
Regional developments have also helped promotetrade liberalization in this group of countries.Malawi's trade reform efforts in recent years havebeen guided by its participation in regional trade ini-tiatives, principally the Cross-Border Initiative(CBI).2 Morocco currently faces the fiscal challengeposed by its 1996 Association Agreement with theEuropean Union (AAEU): Morocco must remove alltariffs on EU industrial goods imports over a 12-yearperiod. One estimate (Abed, 1998) suggests thatMorocco's resulting revenue loss might amount to asmuch as 2 to 2.6 percent of its GDP by the end of thetransition period.3
The countries in the sample also afford examplesof how domestic taxes can reinforce the protectionprovided by trade taxes. In Malawi, until the 1992/93fiscal year, the surtax (a broad-based sales tax) ef-fectively taxed imported goods that compete withdomestic goods at a higher rate than domestic goods,to strengthen protection. This differential was elimi-nated in that fiscal year, in combination with an up-ward adjustment in import duty rates on importedgoods previously carrying the higher effective surtaxrate as an offset. In Poland, excise tax rates on someitems were 5 percent higher on imports than on do-mestic production.
Experience in all the countries demonstrates theimportance of broadening the domestic tax base aspart of an overall liberalization package. In the late1980s Malawi embarked on a program to reform thetax system by, among other things, lowering mar-ginal tax rates and converting the sales tax into acredit-based VAT. Trade liberalization in Moroccohas been accompanied by improvements in the taxstructure, as exemplified by the introduction of aVAT in 1986 and, more recently, by a complete over-haul of the tax and customs administrations. In thePhilippines, both direct and indirect taxation werereformed, the latter through the introduction of aVAT; however, there was less progress in bolsteringtax administration. In Poland, as in many transitioneconomies, the imperative was to implement a mod-ern tax system to accommodate the rapid changes inthe underlying economic structure. However, as
2The CBI, endorsed at a ministerial-level meeting in 1993, callsfor countries in eastern and southern Africa and the Indian Oceanto pursue comprehensive trade reform by, among other things,dismantling quantitative restrictions on a reciprocal basis, and toestablish a common external tariff.
3The range reflects alternative assumptions about how muchMorocco will substitute EU imports for non-EU imports.
10
©International Monetary Fund. Not for Redistribution
Trade Liberalization Strategies and Revenue Implications
Poland discovered, even with rapid progress on taxreform the effective implementation of new taxesand associated administration structures is time-con-suming. This experience shows that revenue consid-erations can impede trade liberalization in the shortterm. Finally, Senegal has been successfully refiningits VAT (reducing the number of rates and expandingthe base) to bolster revenue mobilization.
The importance of administrative capacity has notalways been recognized. Malawi and Morocco bothundertook trade liberalization without first improv-ing customs administration. Only recently have bothcountries made customs administration reform a cen-tral component of trade reform.
Impact on Revenue
Clearly, many of the initial conditions and thetrade liberalization strategies that would be consis-tent with minimal revenue consequences, as dis-cussed above, were present to varying degrees and atdifferent times in each of the six countries. It is in-teresting to consider how these disparate elementswere reflected in actual trends in revenue in eachcountry.
During most of the first phase of reform inArgentina (1988-91), overall tax revenue perfor-mance was weak, and revenue from taxes on inter-national trade tended to fluctuate around a broadlyunchanged trend. Over this period the dispersion oftariffs and the average tariff rate were only slightlyreduced. The indications are that the failure to boostother sources of revenue and to achieve macroeco-nomic stability compromised trade reform in thatphase. However, in the post-1991 period, when thebase broadening of the VAT (which was extended tomost movable goods) took hold, and inflation wasreduced, overall revenue performance strengthened.Tax revenue increased from 12.3 percent of GDP in1990 to 16.0 percent in 1995 (Table 8 in Appendix I),and there was a reduced reliance on internationaltrade taxes, in relation to both total revenue andGDP.
Trade liberalization and economic reform inMalawi also went through phases. During the late1980s, complementary tax reforms were revenue en-hancing. Moreover, the liberalization of foreign ex-change restrictions and a 15 percent devaluation ofthe currency in 1988 resulted in a modest increase inimports as a percentage of GDP. As a result, from fis-cal year 1987 to fiscal year 1990, both the collectedtrade tax rate and the share of trade taxes in tax rev-enue declined modestly; in contrast, trade taxes as apercentage of GDP increased modestly (Table 9 inAppendix I). This would appear to be an examplewhere the initial focus on reducing quantitative re-strictions and tariff dispersion, together with the fa-
vorable impact of liberalizing the foreign exchangemarket and enhancing tax administration, resulted inboth strengthened revenue mobilization and a moreliberal trade regime. The more recent phase affordsan example of how difficult it can be to liberalize inthe face of weak domestic tax performance. Despitereductions in tariff rates in the mid-1990s, the col-lected trade tax rate tended to increase, in large partbecause of the imposition of a temporary export levyin 1995. The tendency for the collected import tariffrate to increase in recent years could also reflect im-provements in tax and customs administration.
As already noted, reform of the domestic tax sys-tem took place alongside a program of trade liberal-ization during the initial reform phase in Morocco inthe 1980s. The country was therefore able to main-tain a relatively high and stable tax revenue-GDPratio even as the collected trade tax rate and relianceon taxes from international trade tended to decline(Table 10 in Appendix I). More recent years havewitnessed a further decline both in the collectedtrade tax rate and in trade taxes as a share of tax rev-enue, reflecting, among other things, improved taxadministration and the pursuit of sound macroeco-nomic policies more generally.
The interesting phase of reform in the Philippinesbegan in 1986 against a background of weak overallrevenue performance: revenue was only about 10percent of GNP (Table 11 in Appendix I). Budgetarypressures constrained the reform, which conse-quently focused on the tariffication of quantitativerestrictions and reductions in tariff dispersion, whilerevenue was bolstered by, among other things, a newsurcharge on non-oil imports. Reflecting the liberal-ization, imports increased significantly as a percent-age of GDP. This increase in imports, in combinationwith the reform strategy that has been pursued, hasresulted in an increase in trade taxes as a percentageof GDP and of total tax revenue, even as the col-lected trade tax rate has declined modestly.
Poland illustrates the difficulties that transitioneconomies experience as they attempt to move to amarket-oriented economy. The initial liberalizationwas dramatic. However, a consequence of economictransformation is that the traditional sources of rev-enue (e.g., levies on state enterprises) tend to declinesharply even as expenditure pressures remain high.Hence the Polish authorities had to move rapidly toimplement the full range of modern taxes with sup-porting tax administrations. Perhaps inevitably, thisprocess was not always smooth. As a result, the paceof trade liberalization suffered some hesitations,which reflected in part the pressure to protect rev-enue in the face of a severe economic downturn andin part the fact that it took time for tax reform to con-tribute significantly to the budget. Between 1991 and1994 the collected international trade tax rate and the
I I
©International Monetary Fund. Not for Redistribution
Ill ANALYSIS OF TRADE LIBERALIZATION AND REVENUE DEVELOPMENTS
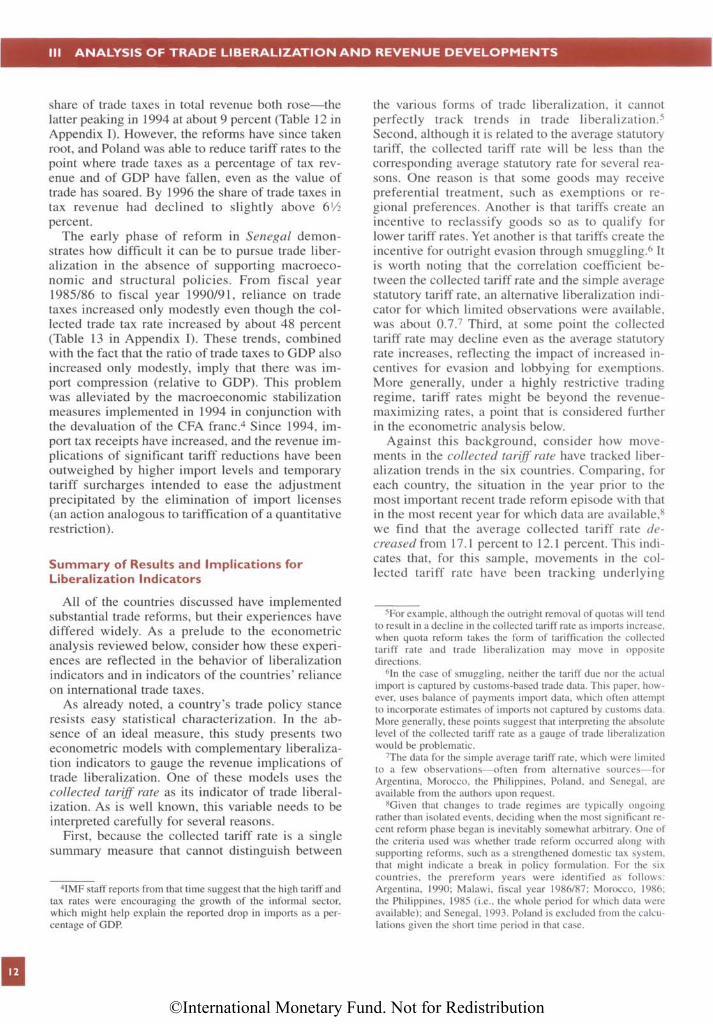
share of trade taxes in total revenue both rose—thelatter peaking in 1994 at about 9 percent (Table 12 inAppendix I). However, the reforms have since takenroot, and Poland was able to reduce tariff rates to thepoint where trade taxes as a percentage of tax rev-enue and of GDP have fallen, even as the value oftrade has soared. By 1996 the share of trade taxes intax revenue had declined to slightly above 6 1percent.
The early phase of reform in Senegal demon-strates how difficult it can be to pursue trade liber-alization in the absence of supporting macroeco-nomic and structural policies. From fiscal year1985/86 to fiscal year 1990/91, reliance on tradetaxes increased only modestly even though the col-lected trade tax rate increased by about 48 percent(Table 13 in Appendix I). These trends, combinedwith the fact that the ratio of trade taxes to GDP alsoincreased only modestly, imply that there was im-port compression (relative to GDP). This problemwas alleviated by the macroeconomic stabilizationmeasures implemented in 1994 in conjunction withthe devaluation of the CFA franc.4 Since 1994, im-port tax receipts have increased, and the revenue im-plications of significant tariff reductions have beenoutweighed by higher import levels and temporarytariff surcharges intended to ease the adjustmentprecipitated by the elimination of import licenses(an action analogous to tariffication of a quantitativerestriction).
Summary of Results and Implications forLiberalization Indicators
All of the countries discussed have implementedsubstantial trade reforms, but their experiences havediffered widely. As a prelude to the econometricanalysis reviewed below, consider how these experi-ences are reflected in the behavior of liberalizationindicators and in indicators of the countries' relianceon international trade taxes.
As already noted, a country's trade policy stanceresists easy statistical characterization. In the ab-sence of an ideal measure, this study presents twoeconometric models with complementary liberaliza-tion indicators to gauge the revenue implications oftrade liberalization. One of these models uses thecollected tariff rate as its indicator of trade liberal-ization. As is well known, this variable needs to beinterpreted carefully for several reasons.
First, because the collected tariff rate is a singlesummary measure that cannot distinguish between
4IMF staff reports from that time suggest that the high tariff andtax rates were encouraging the growth of the informal sector,which might help explain the reported drop in imports as a per-centage of GDP.
the various forms of trade liberalization, it cannotperfectly track trends in trade liberalization.5
Second, although it is related to the average statutorytariff, the collected tariff rate will be less than thecorresponding average statutory rate for several rea-sons. One reason is that some goods may receivepreferential treatment, such as exemptions or re-gional preferences. Another is that tariffs create anincentive to reclassify goods so as to qualify forlower tariff rates. Yet another is that tariffs create theincentive for outright evasion through smuggling.6 Itis worth noting that the correlation coefficient be-tween the collected tariff rate and the simple averagestatutory tariff rate, an alternative liberalization indi-cator for which limited observations were available,was about 0.7.7 Third, at some point the collectedtariff rate may decline even as the average statutoryrate increases, reflecting the impact of increased in-centives for evasion and lobbying for exemptions.More generally, under a highly restrictive tradingregime, tariff rates might be beyond the revenue-maximizing rates, a point that is considered furtherin the econometric analysis below.
Against this background, consider how move-ments in the collected tariff rate have tracked liber-alization trends in the six countries. Comparing, foreach country, the situation in the year prior to themost important recent trade reform episode with thatin the most recent year for which data are available,8
we find that the average collected tariff rate de-creased from 17.1 percent to 12.1 percent. This indi-cates that, for this sample, movements in the col-lected tariff rate have been tracking underlying
5For example, although the outright removal of quotas will tendto result in a decline in the collected tariff rate as imports increase,when quota reform takes the form of tariffication the collectedtariff rate and trade liberalization may move in oppositedirections.
6In the case of smuggling, neither the tariff due nor the actualimport is captured by customs-based trade data. This paper, how-ever, uses balance of payments import data, which often attemptto incorporate estimates of imports not captured by customs data.More generally, these points suggest that interpreting the absolutelevel of the collected tariff rate as a gauge of trade liberalizationwould be problematic.
7The data for the simple average tariff rate, which were limitedto a few observations—often from alternative sources—forArgentina, Morocco, the Philippines, Poland, and Senegal, areavailable from the authors upon request.
8Given that changes to trade regimes are typically ongoingrather than isolated events, deciding when the most significant re-cent reform phase began is inevitably somewhat arbitrary. One ofthe criteria used was whether trade reform occurred along withsupporting reforms, such as a strengthened domestic tax system,that might indicate a break in policy formulation. For the sixcountries, the prereform years were identified as follows:Argentina, 1990; Malawi, fiscal year 1986/87; Morocco, 1986;the Philippines, 1985 (i.e., the whole period for which data wereavailable); and Senegal, 1993. Poland is excluded from the calcu-lations given the short time period in that case.
12
©International Monetary Fund. Not for Redistribution
Trade Liberalization and Revenue Trends
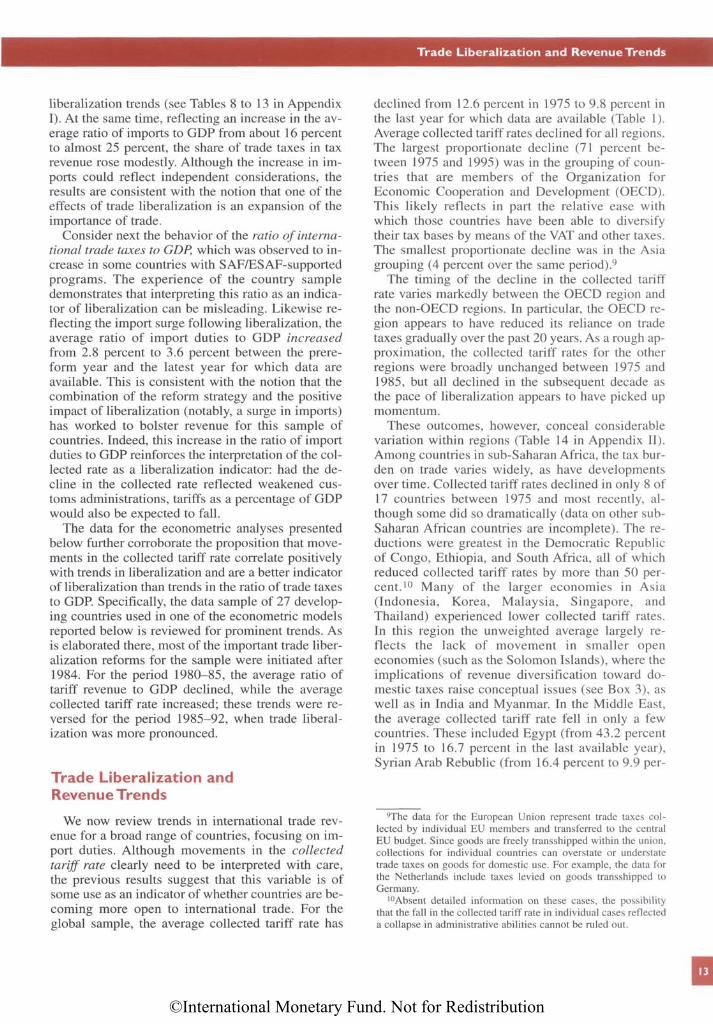
liberalization trends (see Tables 8 to 13 in AppendixI). At the same time, reflecting an increase in the av-erage ratio of imports to GDP from about 16 percentto almost 25 percent, the share of trade taxes in taxrevenue rose modestly. Although the increase in im-ports could reflect independent considerations, theresults are consistent with the notion that one of theeffects of trade liberalization is an expansion of theimportance of trade.
Consider next the behavior of the ratio of interna-tional trade taxes to GDP, which was observed to in-crease in some countries with SAF/ESAF-supportedprograms. The experience of the country sampledemonstrates that interpreting this ratio as an indica-tor of liberalization can be misleading. Likewise re-flecting the import surge following liberalization, theaverage ratio of import duties to GDP increasedfrom 2.8 percent to 3.6 percent between the prere-form year and the latest year for which data areavailable. This is consistent with the notion that thecombination of the reform strategy and the positiveimpact of liberalization (notably, a surge in imports)has worked to bolster revenue for this sample ofcountries. Indeed, this increase in the ratio of importduties to GDP reinforces the interpretation of the col-lected rate as a liberalization indicator: had the de-cline in the collected rate reflected weakened cus-toms administrations, tariffs as a percentage of GDPwould also be expected to fall.
The data for the econometric analyses presentedbelow further corroborate the proposition that move-ments in the collected tariff rate correlate positivelywith trends in liberalization and are a better indicatorof liberalization than trends in the ratio of trade taxesto GDP. Specifically, the data sample of 27 develop-ing countries used in one of the econometric modelsreported below is reviewed for prominent trends. Asis elaborated there, most of the important trade liber-alization reforms for the sample were initiated after1984. For the period 1980-85, the average ratio oftariff revenue to GDP declined, while the averagecollected tariff rate increased; these trends were re-versed for the period 1985-92, when trade liberal-ization was more pronounced.
Trade Liberalization andRevenue Trends
We now review trends in international trade rev-enue for a broad range of countries, focusing on im-port duties. Although movements in the collectedtariff rate clearly need to be interpreted with care,the previous results suggest that this variable is ofsome use as an indicator of whether countries are be-coming more open to international trade. For theglobal sample, the average collected tariff rate has
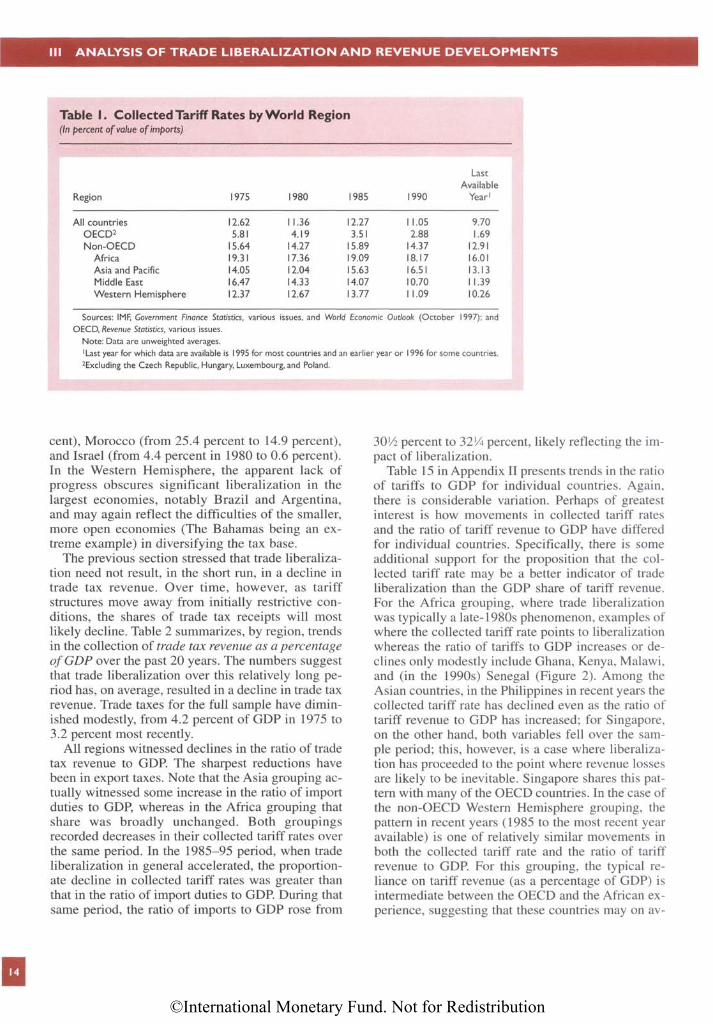
declined from 12.6 percent in 1975 to 9.8 percent inthe last year for which data are available (Table 1).Average collected tariff rates declined for all regions.The largest proportionate decline (71 percent be-tween 1975 and 1995) was in the grouping of coun-tries that are members of the Organization forEconomic Cooperation and Development (OECD).This likely reflects in part the relative ease withwhich those countries have been able to diversifytheir tax bases by means of the VAT and other taxes.The smallest proportionate decline was in the Asiagrouping (4 percent over the same period).9
The timing of the decline in the collected tariffrate varies markedly between the OECD region andthe non-OECD regions. In particular, the OECD re-gion appears to have reduced its reliance on tradetaxes gradually over the past 20 years. As a rough ap-proximation, the collected tariff rates for the otherregions were broadly unchanged between 1975 and1985, but all declined in the subsequent decade asthe pace of liberalization appears to have picked upmomentum.
These outcomes, however, conceal considerablevariation within regions (Table 14 in Appendix II).Among countries in sub-Saharan Africa, the tax bur-den on trade varies widely, as have developmentsover time. Collected tariff rates declined in only 8 of17 countries between 1975 and most recently, al-though some did so dramatically (data on other sub-Saharan African countries are incomplete). The re-ductions were greatest in the Democratic Republicof Congo, Ethiopia, and South Africa, all of whichreduced collected tariff rates by more than 50 per-cent.10 Many of the larger economies in Asia(Indonesia, Korea, Malaysia, Singapore, andThailand) experienced lower collected tariff rates.In this region the unweighted average largely re-flects the lack of movement in smaller openeconomies (such as the Solomon Islands), where theimplications of revenue diversification toward do-mestic taxes raise conceptual issues (see Box 3), aswell as in India and Myanmar. In the Middle East,the average collected tariff rate fell in only a fewcountries. These included Egypt (from 43.2 percentin 1975 to 16.7 percent in the last available year),Syrian Arab Rebublic (from 16.4 percent to 9.9 per-
9The data for the European Union represent trade taxes col-lected by individual EU members and transferred to the centralEU budget. Since goods are freely transshipped within the union,collections for individual countries can overstate or understatetrade taxes on goods for domestic use. For example, the data forthe Netherlands include taxes levied on goods transshipped toGermany.
10Absent detailed information on these cases, the possibilitythat the fall in the collected tariff rate in individual cases reflecteda collapse in administrative abilities cannot be ruled out.
13
©International Monetary Fund. Not for Redistribution
Ill ANALYSIS OF TRADE LIBERALIZATION AND REVENUE DEVELOPMENTS
Table I. Collected Tariff Rates by World Region(In percent of value of imports)
Last
AvailableRegion 1975 1980 1985 1990 Year1
All countries 12.62 11.36 12.27 11.05 9.70
OECD2 5.81 4.19 3.51 2.88 1.69
Non-OECD 15.64 14.27 15.89 14.37 12.91
Africa 19.31 17.36 19.09 18.17 16.01
Asia and Pacific 14.05 12.04 15.63 16.51 13.13
Middle East 16.47 14.33 14.07 10.70 11.39
Western Hemisphere 12.37 12.67 13.77 11.09 10.26
Sources: IMF, Government Finance Statistics, various issues, and World Economic Outlook (October 1997); and
OECD, Revenue Statistics, various issues.
Note: Data are unweighted averages.1Last year for which data are available is 1995 for most countries and an earlier year or 1996 for some countries.
Excluding the Czech Republic, Hungary, Luxembourg, and Poland.
cent), Morocco (from 25.4 percent to 14.9 percent),and Israel (from 4.4 percent in 1980 to 0.6 percent).In the Western Hemisphere, the apparent lack ofprogress obscures significant liberalization in thelargest economies, notably Brazil and Argentina,and may again reflect the difficulties of the smaller,more open economies (The Bahamas being an ex-treme example) in diversifying the tax base.
The previous section stressed that trade liberaliza-tion need not result, in the short run, in a decline intrade tax revenue. Over time, however, as tariffstructures move away from initially restrictive con-ditions, the shares of trade tax receipts will mostlikely decline. Table 2 summarizes, by region, trendsin the collection of trade tax revenue as a percentageof GDP over the past 20 years. The numbers suggestthat trade liberalization over this relatively long pe-riod has, on average, resulted in a decline in trade taxrevenue. Trade taxes for the full sample have dimin-ished modestly, from 4.2 percent of GDP in 1975 to3.2 percent most recently.
All regions witnessed declines in the ratio of tradetax revenue to GDP. The sharpest reductions havebeen in export taxes. Note that the Asia grouping ac-tually witnessed some increase in the ratio of importduties to GDP, whereas in the Africa grouping thatshare was broadly unchanged. Both groupingsrecorded decreases in their collected tariff rates overthe same period. In the 1985-95 period, when tradeliberalization in general accelerated, the proportion-ate decline in collected tariff rates was greater thanthat in the ratio of import duties to GDP. During thatsame period, the ratio of imports to GDP rose from
30 1/2 percent to 32 1/4 percent, likely reflecting the im-pact of liberalization.
Table 15 in Appendix II presents trends in the ratioof tariffs to GDP for individual countries. Again,there is considerable variation. Perhaps of greatestinterest is how movements in collected tariff ratesand the ratio of tariff revenue to GDP have differedfor individual countries. Specifically, there is someadditional support for the proposition that the collected tariff rate may be a better indicator of tradeliberalization than the GDP share of tariff revenue.For the Africa grouping, where trade liberalizationwas typically a late-1980s phenomenon, examples ofwhere the collected tariff rate points to liberalizationwhereas the ratio of tariffs to GDP increases or declines only modestly include Ghana, Kenya, Malawi,and (in the 1990s) Senegal (Figure 2). Among theAsian countries, in the Philippines in recent years thecollected tariff rate has declined even as the ratio oftariff revenue to GDP has increased; for Singapore,on the other hand, both variables fell over the sample period; this, however, is a case where liberaliza-tion has proceeded to the point where revenue lossesare likely to be inevitable. Singapore shares this pat-tern with many of the OECD countries. In the case ofthe non-OECD Western Hemisphere grouping, thepattern in recent years (1985 to the most recent yearavailable) is one of relatively similar movements inboth the collected tariff rate and the ratio of tariffrevenue to GDP. For this grouping, the typical re-liance on tariff revenue (as a percentage of GDP) isintermediate between the OECD and the African ex-perience, suggesting that these countries may on av-
14
©International Monetary Fund. Not for Redistribution
Econometric Analysis
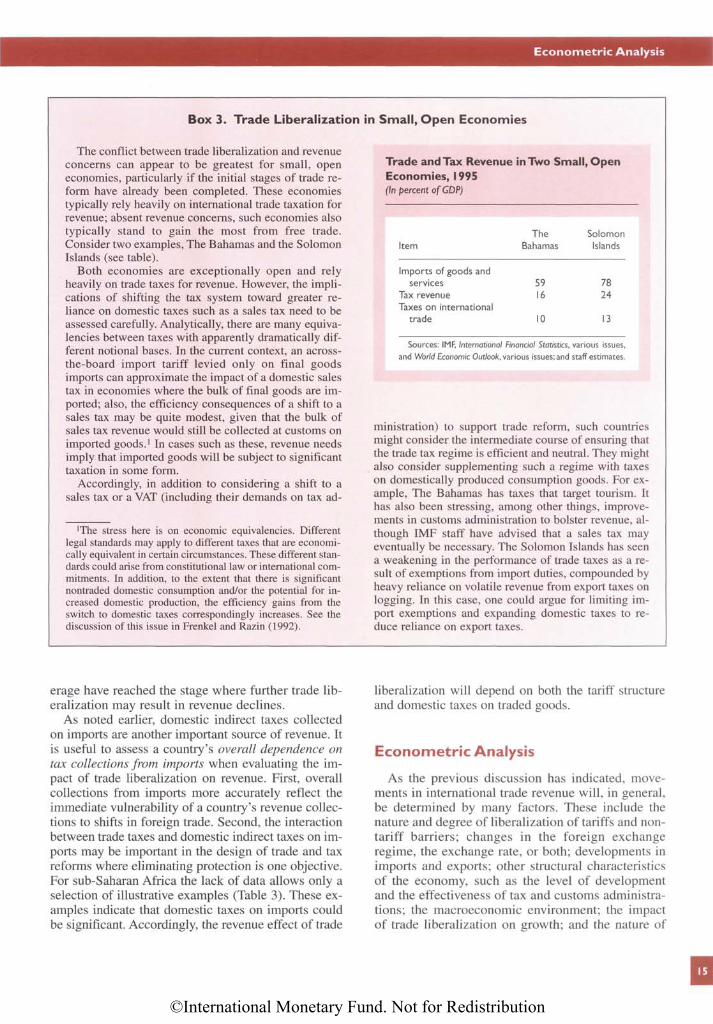
Box 3. Trade Liberalization in Small, Open Economies
The conflict between trade liberalization and revenueconcerns can appear to be greatest for small, openeconomies, particularly if the initial stages of trade re-form have already been completed. These economiestypically rely heavily on international trade taxation forrevenue; absent revenue concerns, such economies alsotypically stand to gain the most from free trade.Consider two examples, The Bahamas and the SolomonIslands (see table).
Both economies are exceptionally open and relyheavily on trade taxes for revenue. However, the impli-cations of shifting the tax system toward greater re-liance on domestic taxes such as a sales tax need to beassessed carefully. Analytically, there are many equiva-lencies between taxes with apparently dramatically dif-ferent notional bases. In the current context, an across-the-board import tariff levied only on final goodsimports can approximate the impact of a domestic salestax in economies where the bulk of final goods are im-ported; also, the efficiency consequences of a shift to asales tax may be quite modest, given that the bulk ofsales tax revenue would still be collected at customs onimported goods.1 In cases such as these, revenue needsimply that imported goods will be subject to significanttaxation in some form.
Accordingly, in addition to considering a shift to asales tax or a VAT (including their demands on tax ad-
1The stress here is on economic equivalencies. Differentlegal standards may apply to different taxes that are economi-cally equivalent in certain circumstances. These different stan-dards could arise from constitutional law or international com-mitments. In addition, to the extent that there is significantnontraded domestic consumption and/or the potential for in-creased domestic production, the efficiency gains from theswitch to domestic taxes correspondingly increases. See thediscussion of this issue in Frenkel and Razin (1992).
Trade and Tax Revenue in Two Small, OpenEconomies, 1995(In percent of GDP)
The SolomonItem Bahamas Islands
Imports of goods andservices 59 78
Tax revenue 16 24Taxes on international
trade 10 13
Sources: IMF, International Financial Statistics, various issues,
and World Economic Outlook, various issues; and staff estimates.
ministration) to support trade reform, such countriesmight consider the intermediate course of ensuring thatthe trade tax regime is efficient and neutral. They mightalso consider supplementing such a regime with taxeson domestically produced consumption goods. For ex-ample, The Bahamas has taxes that target tourism. Ithas also been stressing, among other things, improve-ments in customs administration to bolster revenue, al-though IMF staff have advised that a sales tax mayeventually be necessary. The Solomon Islands has seena weakening in the performance of trade taxes as a re-sult of exemptions from import duties, compounded byheavy reliance on volatile revenue from export taxes onlogging. In this case, one could argue for limiting im-port exemptions and expanding domestic taxes to re-duce reliance on export taxes.
erage have reached the stage where further trade lib-eralization may result in revenue declines.
As noted earlier, domestic indirect taxes collectedon imports are another important source of revenue. Itis useful to assess a country's overall dependence ontax collections from imports when evaluating the im-pact of trade liberalization on revenue. First, overallcollections from imports more accurately reflect theimmediate vulnerability of a country's revenue collec-tions to shifts in foreign trade. Second, the interactionbetween trade taxes and domestic indirect taxes on im-ports may be important in the design of trade and taxreforms where eliminating protection is one objective.For sub-Saharan Africa the lack of data allows only aselection of illustrative examples (Table 3). These ex-amples indicate that domestic taxes on imports couldbe significant. Accordingly, the revenue effect of trade
liberalization will depend on both the tariff structureand domestic taxes on traded goods.
Econometric Analysis
As the previous discussion has indicated, move-ments in international trade revenue will, in general,be determined by many factors. These include thenature and degree of liberalization of tariffs and non-tariff barriers; changes in the foreign exchangeregime, the exchange rate, or both; developments inimports and exports; other structural characteristicsof the economy, such as the level of developmentand the effectiveness of tax and customs administra-tions; the macroeconomic environment; the impactof trade liberalization on growth; and the nature of
15
©International Monetary Fund. Not for Redistribution
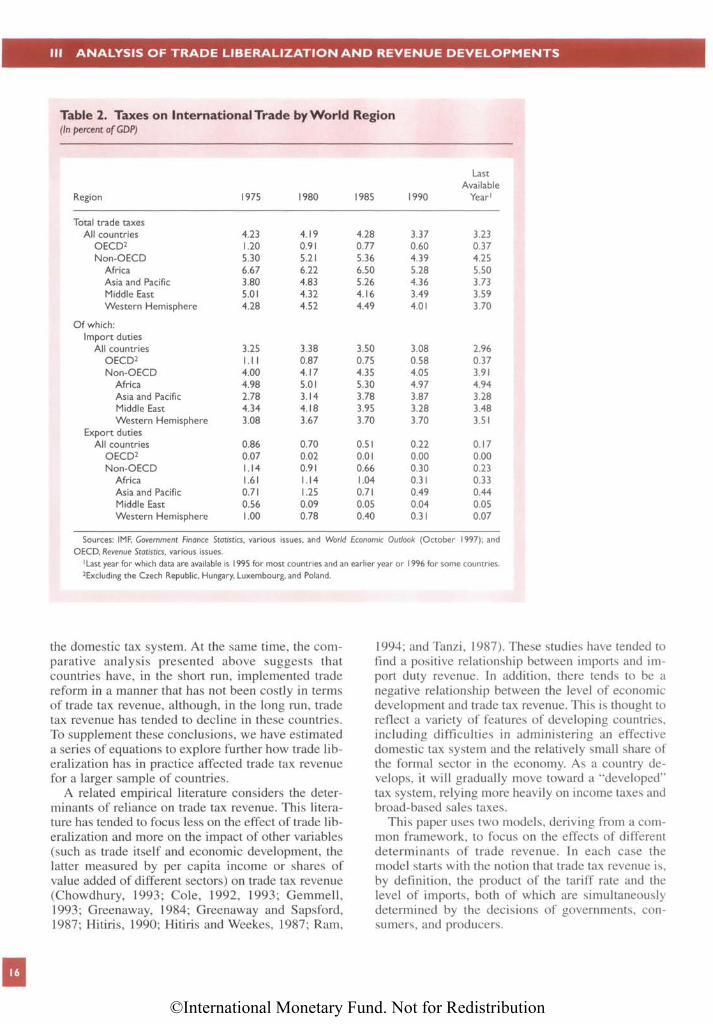
Ill ANALYSIS OF TRADE LIBERALIZATION AND REVENUE DEVELOPMENTS
Table 2. Taxes on International Trade by World Region(In percent of GDP)
LastAvailable
Region 1975 1980 1985 1990 Year1
Total trade taxesAll countries 4.23 4.19 4.28 3.37 3.23
OECD2 1.20 0.91 0.77 0.60 0.37Non-OECD 5.30 5.21 5.36 4.39 4.25
Africa 6.67 6.22 6.50 5.28 5.50Asia and Pacific 3.80 4.83 5.26 4.36 3.73Middle East 5.01 4.32 4.16 3.49 3.59Western Hemisphere 4.28 4.52 4.49 4.01 3.70
Of which:Import duties
All countries 3.25 3.38 3.50 3.08 2.96OECD2 0.87 0.75 0.58 0.37Non-OECD 4.00 4.17 4.35 4.05 3.91
Africa 4.98 5.01 5.30 4.97 4.94Asia and Pacific 2.78 3.14 3.78 3.87 3.28Middle East 4.34 4.18 3.95 3.28 3.48Western Hemisphere 3.08 3.67 3.70 3.70 3.51
Export dutiesAll countries 0.86 0.70 0.51 0.22 0.17
OECD2 0.07 0.02 0.01 0.00 0.00Non-OECD 1.14 0.91 0.66 0.30 0.23
Africa 1.61 1.14 1.04 0.31 0.33Asia and Pacific 0.71 1.25 0.71 0.49 0.44Middle East 0.56 0.09 0.05 0.04 0.05Western Hemisphere 1.00 0.78 0.40 0.31 0.07
Sources: IMF, Government Finance Statistics, various issues, and World Economic Outlook (October 1997); and
OECD, Revenue Statistics, various issues.
1Last year for which data are available is 1995 for most countries and an earlier year or 1996 for some countries.
2Excluding the Czech Republic, Hungary, Luxembourg, and Poland.
the domestic tax system. At the same time, the com-parative analysis presented above suggests thatcountries have, in the short run, implemented tradereform in a manner that has not been costly in termsof trade tax revenue, although, in the long run, tradetax revenue has tended to decline in these countries.To supplement these conclusions, we have estimateda series of equations to explore further how trade lib-eralization has in practice affected trade tax revenuefor a larger sample of countries.
A related empirical literature considers the deter-minants of reliance on trade tax revenue. This litera-ture has tended to focus less on the effect of trade lib-eralization and more on the impact of other variables(such as trade itself and economic development, thelatter measured by per capita income or shares ofvalue added of different sectors) on trade tax revenue(Chowdhury, 1993; Cole, 1992, 1993; Gemmell,1993; Greenaway, 1984; Greenaway and Sapsford,1987; Hitiris, 1990; Hitiris and Weekes, 1987; Ram,
1994; and Tanzi, 1987). These studies have tended tofind a positive relationship between imports and im-port duty revenue. In addition, there tends to be anegative relationship between the level of economicdevelopment and trade tax revenue. This is thought toreflect a variety of features of developing countries,including difficulties in administering an effectivedomestic tax system and the relatively small share ofthe formal sector in the economy. As a country de-velops, it will gradually move toward a "developed"tax system, relying more heavily on income taxes andbroad-based sales taxes.
This paper uses two models, deriving from a com-mon framework, to focus on the effects of differentdeterminants of trade revenue. In each case themodel starts with the notion that trade tax revenue is,by definition, the product of the tariff rate and thelevel of imports, both of which are simultaneouslydetermined by the decisions of governments, con-sumers, and producers.
16
1.11
©International Monetary Fund. Not for Redistribution
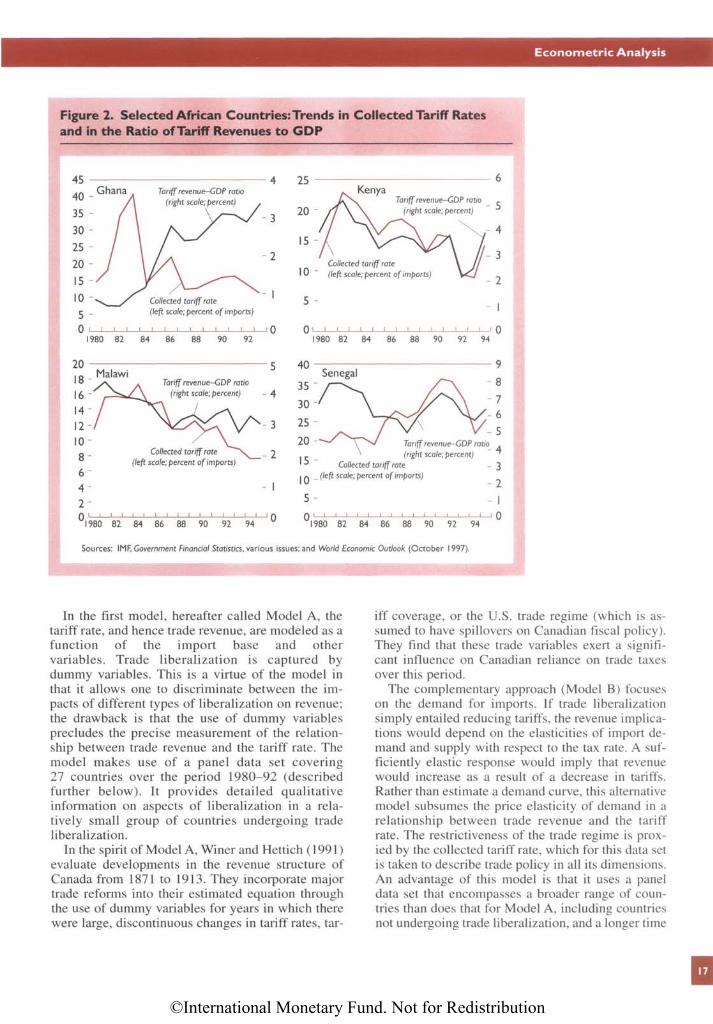
Econometric Analysis
Figure 2. Selected African Countries: Trends in Collected Tariff Ratesand in the Ratio of Tariff Revenues to GDP
Sources: IMF, Government Financial Statistics, various issues; and World Economic Outlook (October 1997).
In the first model, hereafter called Model A, thetariff rate, and hence trade revenue, are modeled as afunction of the import base and othervariables. Trade liberalization is captured bydummy variables. This is a virtue of the model inthat it allows one to discriminate between the im-pacts of different types of liberalization on revenue;the drawback is that the use of dummy variablesprecludes the precise measurement of the relation-ship between trade revenue and the tariff rate. Themodel makes use of a panel data set covering27 countries over the period 1980-92 (describedfurther below). It provides detailed qualitativeinformation on aspects of liberalization in a rela-tively small group of countries undergoing tradeliberalization.
In the spirit of Model A, Winer and Hettich (1991)evaluate developments in the revenue structure ofCanada from 1871 to 1913. They incorporate majortrade reforms into their estimated equation throughthe use of dummy variables for years in which therewere large, discontinuous changes in tariff rates, tar-
iff coverage, or the U.S. trade regime (which is assumed to have spillovers on Canadian fiscal policy).They find that these trade variables exert a signifi-cant influence on Canadian reliance on trade taxesover this period.
The complementary approach (Model B) focuseson the demand for imports. If trade liberalizationsimply entailed reducing tariffs, the revenue implica-tions would depend on the elasticities of import de-mand and supply with respect to the tax rate. A suf-ficiently elastic response would imply that revenuewould increase as a result of a decrease in tariffs.Rather than estimate a demand curve, this alternativemodel subsumes the price elasticity of demand in arelationship between trade revenue and the tariffrate. The restrictiveness of the trade regime is prox-ied by the collected tariff rate, which for this data setis taken to describe trade policy in all its dimensions.An advantage of this model is that it uses a paneldata set that encompasses a broader range of coun-tries than does that for Model A, including countriesnot undergoing trade liberalization, and a longer time
17
©International Monetary Fund. Not for Redistribution
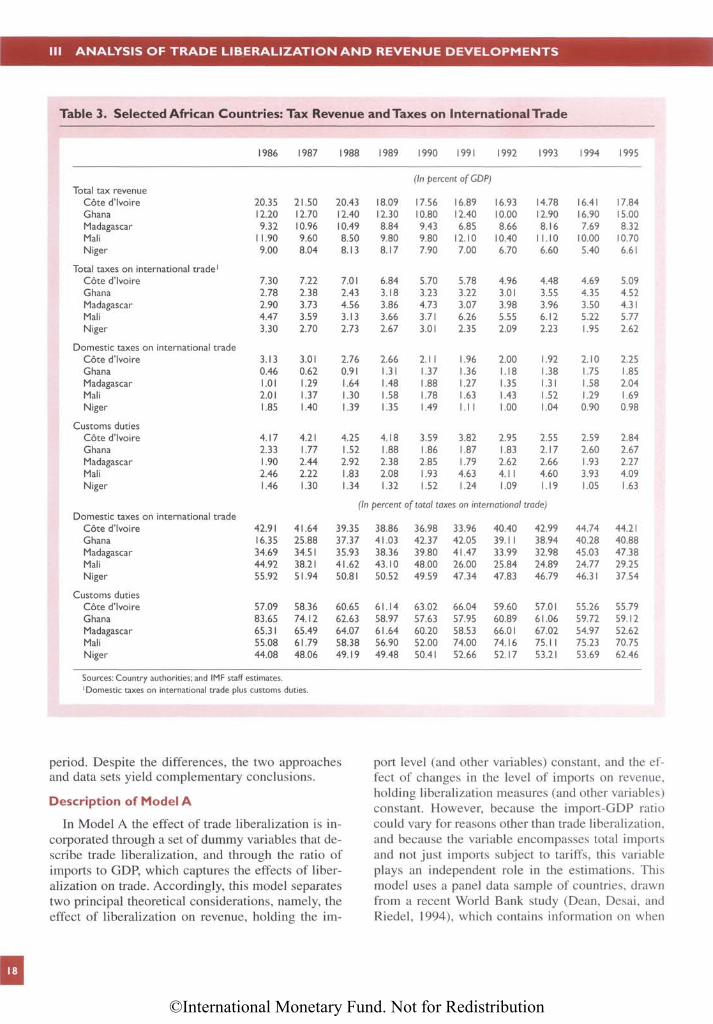
Ill ANALYSIS OF TRADE LIBERALIZATION AND REVENUE DEVELOPMENTS
Table 3. Selected African Countries: Tax Revenue and Taxes on International Trade
1986 1987 1988 1989 1990 1991 1992 1993 1994 1995
(In percent of GDP)Total tax revenue
Cote d'lvoire 20.35 21.50 20.43 18.09 17.56 16.89 16.93 14.78 16.41 17.84Ghana 12.20 12.70 12.40 12.30 10.80 12.40 10.00 12.90 16.90 15.00Madagascar 9.32 10.96 10.49 8.84 9.43 6.85 8.66 8.16 7.69 8.32Mali 11.90 9.60 8.50 9.80 9.80 12.10 10.40 11.10 10.00 10.70Niger 9.00 8.04 8.13 8.17 7.90 7.00 6.70 6.60 5.40 6.61
Total taxes on international trade1
Cote d'lvoire 7.30 7.22 7.01 6.84 5.70 5.78 4.96 4.48 4.69 5.09Ghana 2.78 2.38 2.43 3.18 3.23 3.22 3.01 3.55 4.35 4.52Madagascar 2.90 3.73 4.56 3.86 4.73 3.07 3.98 3.96 3.50 4.31Mali 4.47 3.59 3.13 3.66 3.71 6.26 5.55 6.12 5.22 5.77Niger 3.30 2.70 2.73 2.67 3.01 2.35 2.09 2.23 1.95 2.62
Domestic taxes on international tradeCote d'lvoire 3.13 3.01 2.76 2.66 2.11 1.96 2.00 1.92 2.10 2.25Ghana 0.46 0.62 0.91 1.31 1.37 1.36 1.18 1.38 1.75 1.85Madagascar 1.01 1.29 1.64 1.48 1.88 1.27 1.35 1.31 1.58 2.04Mali 2.01 1.37 1.30 1.58 1.78 1.63 1.43 1.52 1.29 1.69Niger 1.85 1.40 1.39 1.35 1.49 1.11 1.00 1.04 0.90 0.98
Customs dutiesCote d'lvoire 4.17 4.21 4.25 4.18 3.59 3.82 2.95 2.55 2.59 2.84Ghana 2.33 1.77 1.52 1.88 1.86 1.87 1.83 2.17 2.60 2.67Madagascar 1.90 2.44 2.92 2.38 2.85 1.79 2.62 2.66 1.93 2.27Mali 2.46 2.22 1.83 2.08 1.93 4.63 4.11 4.60 3.93 4.09Niger 1.46 1.30 1.34 1.32 1.52 1.24 1.09 1.19 1.05 1.63
(In percent of total taxes on international trade)
Domestic taxes on international tradeCote d'lvoire 42.91 41.64 39.35 38.86 36.98 33.96 40.40 42.99 44.74 44.21Ghana 16.35 25.88 37.37 41.03 42.37 42.05 39.11 38.94 40.28 40.88Madagascar 34.69 34.51 35.93 38.36 39.80 41.47 33.99 32.98 45.03 47.38Mali 44.92 38.21 41.62 43.10 48.00 26.00 25.84 24.89 24.77 29.25Niger 55.92 51.94 50.81 50.52 49.59 47.34 47.83 46.79 46.31 37.54
Customs dutiesCote d'lvoire 57.09 58.36 60.65 61.14 63.02 66.04 59.60 57.01 55.26 55.79Ghana 83.65 74.12 62.63 58.97 57.63 57.95 60.89 61.06 59.72 59.12Madagascar 65.31 65.49 64.07 61.64 60.20 58.53 66.01 67.02 54.97 52.62Mali 55.08 61.79 58.38 56.90 52.00 74.00 74.16 75.11 75.23 70.75Niger 44.08 48.06 49.19 49.48 50.41 52.66 52.17 53.21 53.69 62.46
Sources: Country authorities; and IMF staff estimates.1Domestic taxes on international trade plus customs duties.
period. Despite the differences, the two approachesand data sets yield complementary conclusions.
Description of Model A
In Model A the effect of trade liberalization is in-corporated through a set of dummy variables that de-scribe trade liberalization, and through the ratio ofimports to GDP, which captures the effects of liber-alization on trade. Accordingly, this model separatestwo principal theoretical considerations, namely, theeffect of liberalization on revenue, holding the im-
port level (and other variables) constant, and the ef-fect of changes in the level of imports on revenue,holding liberalization measures (and other variables)constant. However, because the import-GDP ratiocould vary for reasons other than trade liberalization,and because the variable encompasses total importsand not just imports subject to tariffs, this variableplays an independent role in the estimations. Thismodel uses a panel data sample of countries, drawnfrom a recent World Bank study (Dean, Desai, andRiedel, 1994), which contains information on when
18
©International Monetary Fund. Not for Redistribution
Econometric Analysis
each country undertook significant trade reform andthe nature of that reform.11
The model uses three dummy variables represent-ing reduction of quantitative restrictions or foreignexchange constraints, reduction of import tariffs, andreduction of export barriers (notably, export taxes).When reform is judged to have occurred for eachvariable is based on the World Bank study (Table 16in Appendix II). For each country in the sample, inthe year in which trade liberalization was initiatedfor any of these areas, and in subsequent years, thecorresponding dummy variable takes a value of oneand otherwise is zero.12 It is not uncommon forcountries to undertake liberalization by simultane-ously reducing quantitative restrictions and importtariffs, and this might make it difficult to separate theeffects of these policy actions with the two dummyvariables. The correlation coefficient between thetwo variables in this data set is only 0.47, however.Also, this specification only tests the empirical rela-tionship between the broad type of trade liberaliza-tion and revenue. For instance, countries may ac-company liberalization of quantitative restrictionswithout changing tariffs, or they may replace uanti-tative restrictions for certain goods with tariffs. Thisanalysis controls for the tariff level (through the tar-iff dummy variable) only insofar as the country alsoundertook tariff reform as part of its trade liberaliza-tion. In addition, the extent to which tariff reform re-sulted in reductions in tariff rates varied across re-forming countries.
The final estimated equation takes the followingform:
where TR is import (or trade) tax revenue as a per-centage of GDP; M is imports as a percentage ofGDP; w represents one or more other continuousvariables, such as exports and the exchange rate; andD is the set of trade liberalization and other dummyvariables. Specifically, in addition to the liberaliza-tion dummies, the independent variables are importsas a percentage of GDP, exports as a share of GDP,per capita income in 1990 U.S. dollars, dummy vari-ables to indicate whether the country has a VAT andwhether it has accepted IMF Article VIII status (apossible indicator of liberalization of the tradingregime), and a real exchange rate index (defined
11The initial level of openness in these countries is quite differ-ent, and a few, such as Korea and Sri Lanka, had already under-taken reforms prior to the period of study.
12Trade liberalization was rarely reversed, and when it was, itwas not reversed completely. Hence, it seems more accurate to as-sign all subsequent years in the sample a value of 1 (with the ex-ception of Senegal, where the trade reform of the mid-1980s wasclearly reversed after a certain point).
such that an increase indicates a real depreciation).13
Macroeconomic conditions are captured through thereal exchange rate, per capita income, and timedummy variables.
Prior expectations about the revenue effect oftrade liberalization—defined as the elimination ofquantitative restrictions and reductions in averagetariff levels—would suggest that the coefficients onthe quantitative restrictions reform and tariff reformdummies might be zero and negative, respectively,given that results are conditioned on the level of im-ports. The coefficient of the export barriers reformdummy would be expected to be negative when tradetax revenue is the dependent variable. In addition,one would expect the coefficient on the import-GDPratio to be positive. Although there is some a prioriambiguity, the coefficient on the real exchange ratevariable could in general be expected also to be pos-itive, since a real depreciation implies higher nomi-nal values for imports and hence increased tariff rev-enue. The coefficient on the per capita incomevariable is expected to be negative, given the obser-vation that the more developed the country, the lesslikely it is that the country will rely on trade taxes.Priors for the coefficient on the VAT dummy are notstrong—the coefficient could be either negative (be-cause the VAT substitutes for trade revenue) or posi-tive (if the presence of a VAT is consistent withstrengthened revenue administration). Priors on theremaining variables are also not strong.
As already noted, the data set for this model isbased on countries in the 1994 World Bank study,but it excludes centrally planned economies andcountries for which significant trade reform episodescould not be identified. The data set consists of 27countries from Africa, Asia, and the WesternHemisphere, for a total of 344 observations spanning1980 to 1992. A few observations were dropped be-cause of missing data. The sample is not random inthat it only includes countries undertaking liberaliza-tion; hence the results are conditional on the coun-tries undertaking liberalization. Before turning to theestimation results, it is useful to review some of thebasic characteristics of the data set. Table 4 summa-rizes developments in the ratio of tariff revenue toGDP and the collected tariff rate. These observationsare best interpreted by recognizing that, with two ex-ceptions (South Africa and Tanzania in 1984), tradereforms were initiated for this sample of countries ei-ther in 1985 or thereafter (Table 16 in Appendix II).
13For both models, all financial data are obtained from theGovernment Finance Statistics and World Economic Outlookdatabases of the IMF. Per capita GDP data are from the WorldBank database, and information on whether the country had aVAT and had achieved Article VIII status is from IMF sources.
19
©International Monetary Fund. Not for Redistribution
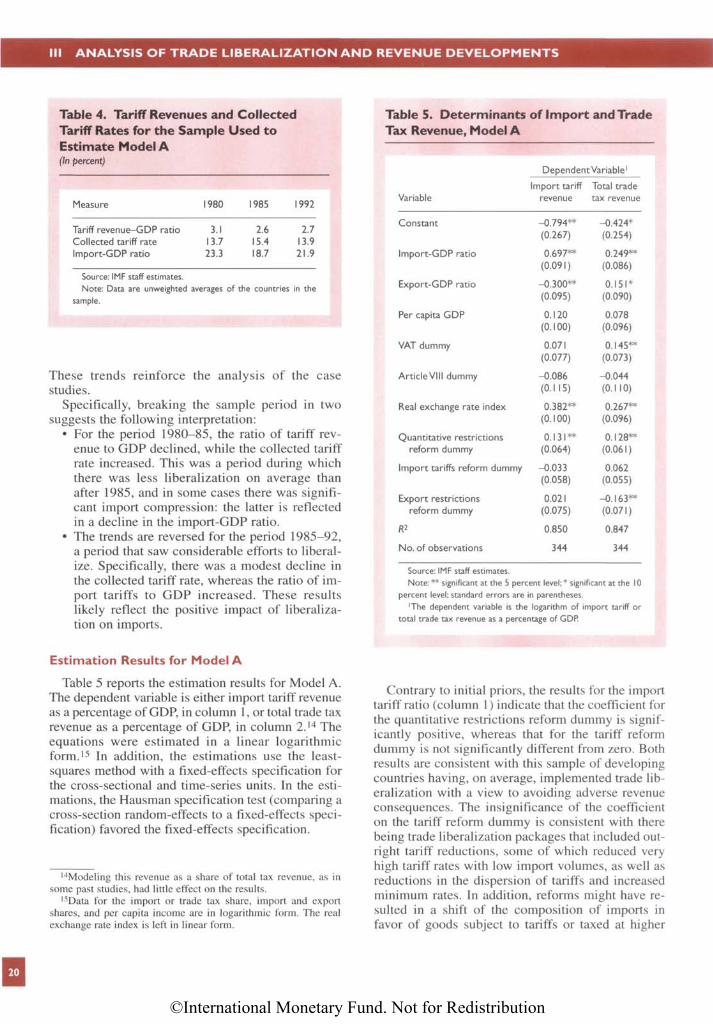
Ill ANALYSIS OF TRADE LIBERALIZATION AND REVENUE DEVELOPMENTS
Table 4. Tariff Revenues and CollectedTariff Rates for the Sample Used toEstimate Model A(In percent)
Measure 1980 1985 1992
Tariff revenue-GDP ratio 3.1 2.6 2.7Collected tariff rate 13.7 15.4 13.9Import-GDP ratio 23.3 18.7 21.9
Source: IMF staff estimates.
Note: Data are unweighted averages of the countries in the
sample.
These trends reinforce the analysis of the casestudies.
Specifically, breaking the sample period in twosuggests the following interpretation:
• For the period 1980-85, the ratio of tariff rev-enue to GDP declined, while the collected tariffrate increased. This was a period during whichthere was less liberalization on average thanafter 1985, and in some cases there was signifi-cant import compression: the latter is reflectedin a decline in the import-GDP ratio.
• The trends are reversed for the period 1985-92,a period that saw considerable efforts to liberal-ize. Specifically, there was a modest decline inthe collected tariff rate, whereas the ratio of im-port tariffs to GDP increased. These resultslikely reflect the positive impact of liberaliza-tion on imports.
Estimation Results for Model A
Table 5 reports the estimation results for Model A.The dependent variable is either import tariff revenueas a percentage of GDP, in column 1, or total trade taxrevenue as a percentage of GDP, in column 2.14 Theequations were estimated in a linear logarithmicform.15 In addition, the estimations use the least-squares method with a fixed-effects specification forthe cross-sectional and time-series units. In the esti-mations, the Hausman specification test (comparing across-section random-effects to a fixed-effects speci-fication) favored the fixed-effects specification.
14Modeling this revenue as a share of total tax revenue, as insome past studies, had little effect on the results.
15Data for the import or trade tax share, import and exportshares, and per capita income are in logarithmic form. The realexchange rate index is left in linear form.
Table 5. Determinants of Import and TradeTax Revenue, Model A
Dependent Variable1
Import tariff Total tradeVariable revenue tax revenue
Constant -0.794** -0.424*(0.267) (0.254)
Import-GDP ratio 0.697** 0.249**(0.091) (0.086)
Export-GDP ratio -0.300** 0.151 *(0.095) (0.090)
Per capita GDP 0.120 0.078(0.100) (0.096)
VAT dummy 0.071 0.145**(0.077) (0.073)
ArticleVIII dummy -0.086 -0.044(0.115) (0.110)
Real exchange rate index 0.382** 0.267**(0.100) (0.096)
Quantitative restrictions 0.131 ** 0.128**reform dummy (0.064) (0.061)
Import tariffs reform dummy -0.033 0.062(0.058) (0.055)
Export restrictions 0.021 -0.163**reform dummy (0.075) (0.071)
R2 0.850 0.847
No. of observations 344 344
Source: IMF staff estimates.
Note: ** significant at the 5 percent level; * significant at the 10
percent level; standard errors are in parentheses.
1The dependent variable is the logarithm of import tariff or
total trade tax revenue as a percentage of GDP.
Contrary to initial priors, the results for the importtariff ratio (column 1) indicate that the coefficient forthe quantitative restrictions reform dummy is signif-icantly positive, whereas that for the tariff reformdummy is not significantly different from zero. Bothresults are consistent with this sample of developingcountries having, on average, implemented trade lib-eralization with a view to avoiding adverse revenueconsequences. The insignificance of the coefficienton the tariff reform dummy is consistent with therebeing trade liberalization packages that included out-right tariff reductions, some of which reduced veryhigh tariff rates with low import volumes, as well asreductions in the dispersion of tariffs and increasedminimum rates. In addition, reforms might have re-sulted in a shift of the composition of imports infavor of goods subject to tariffs or taxed at higher
20
©International Monetary Fund. Not for Redistribution
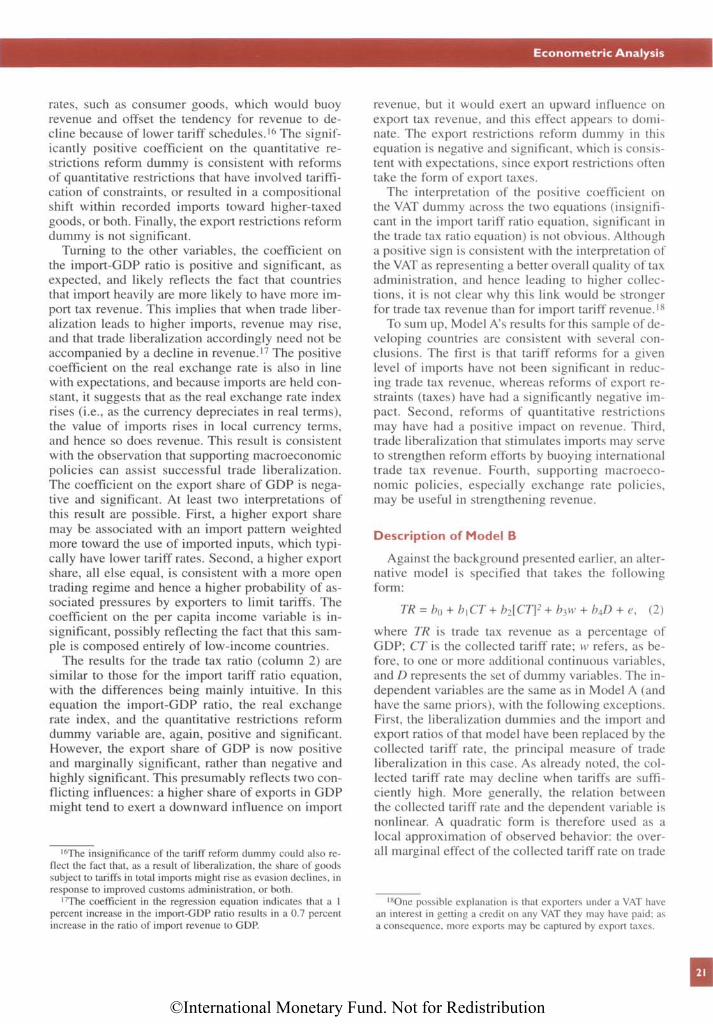
Econometric Analysis
rates, such as consumer goods, which would buoyrevenue and offset the tendency for revenue to de-cline because of lower tariff schedules.16 The signif-icantly positive coefficient on the quantitative re-strictions reform dummy is consistent with reformsof quantitative restrictions that have involved tariffi-cation of constraints, or resulted in a compositionalshift within recorded imports toward higher-taxedgoods, or both. Finally, the export restrictions reformdummy is not significant.
Turning to the other variables, the coefficient onthe import-GDP ratio is positive and significant, asexpected, and likely reflects the fact that countriesthat import heavily are more likely to have more im-port tax revenue. This implies that when trade liber-alization leads to higher imports, revenue may rise,and that trade liberalization accordingly need not beaccompanied by a decline in revenue.17 The positivecoefficient on the real exchange rate is also in linewith expectations, and because imports are held con-stant, it suggests that as the real exchange rate indexrises (i.e., as the currency depreciates in real terms),the value of imports rises in local currency terms,and hence so does revenue. This result is consistentwith the observation that supporting macroeconomicpolicies can assist successful trade liberalization.The coefficient on the export share of GDP is nega-tive and significant. At least two interpretations ofthis result are possible. First, a higher export sharemay be associated with an import pattern weightedmore toward the use of imported inputs, which typi-cally have lower tariff rates. Second, a higher exportshare, all else equal, is consistent with a more opentrading regime and hence a higher probability of as-sociated pressures by exporters to limit tariffs. Thecoefficient on the per capita income variable is in-significant, possibly reflecting the fact that this sam-ple is composed entirely of low-income countries.
The results for the trade tax ratio (column 2) aresimilar to those for the import tariff ratio equation,with the differences being mainly intuitive. In thisequation the import-GDP ratio, the real exchangerate index, and the quantitative restrictions reformdummy variable are, again, positive and significant.However, the export share of GDP is now positiveand marginally significant, rather than negative andhighly significant. This presumably reflects two con-flicting influences: a higher share of exports in GDPmight tend to exert a downward influence on import
16The insignificance of the tariff reform dummy could also re-flect the fact that, as a result of liberalization, the share of goodssubject to tariffs in total imports might rise as evasion declines, inresponse to improved customs administration, or both.
17The coefficient in the regression equation indicates that a 1percent increase in the import-GDP ratio results in a 0.7 percentincrease in the ratio of import revenue to GDP.
revenue, but it would exert an upward influence onexport tax revenue, and this effect appears to domi-nate. The export restrictions reform dummy in thisequation is negative and significant, which is consis-tent with expectations, since export restrictions oftentake the form of export taxes.
The interpretation of the positive coefficient onthe VAT dummy across the two equations (insignifi-cant in the import tariff ratio equation, significant inthe trade tax ratio equation) is not obvious. Althougha positive sign is consistent with the interpretation ofthe VAT as representing a better overall quality of taxadministration, and hence leading to higher collec-tions, it is not clear why this link would be strongerfor trade tax revenue than for import tariff revenue.18
To sum up, Model A's results for this sample of de-veloping countries are consistent with several con-clusions. The first is that tariff reforms for a givenlevel of imports have not been significant in reduc-ing trade tax revenue, whereas reforms of export re-straints (taxes) have had a significantly negative im-pact. Second, reforms of quantitative restrictionsmay have had a positive impact on revenue. Third,trade liberalization that stimulates imports may serveto strengthen reform efforts by buoying internationaltrade tax revenue. Fourth, supporting macroeco-nomic policies, especially exchange rate policies,may be useful in strengthening revenue.
Description of Model B
Against the background presented earlier, an alter-native model is specified that takes the followingform:
where TR is trade tax revenue as a percentage ofGDP; CT is the collected tariff rate; w refers, as be-fore, to one or more additional continuous variables,and D represents the set of dummy variables. The in-dependent variables are the same as in Model A (andhave the same priors), with the following exceptions.First, the liberalization dummies and the import andexport ratios of that model have been replaced by thecollected tariff rate, the principal measure of tradeliberalization in this case. As already noted, the col-lected tariff rate may decline when tariffs are suffi-ciently high. More generally, the relation betweenthe collected tariff rate and the dependent variable isnonlinear. A quadratic form is therefore used as alocal approximation of observed behavior: the over-all marginal effect of the collected tariff rate on trade
18One possible explanation is that exporters under a VAT havean interest in getting a credit on any VAT they may have paid; asa consequence, more exports may be captured by export taxes.
21
©International Monetary Fund. Not for Redistribution
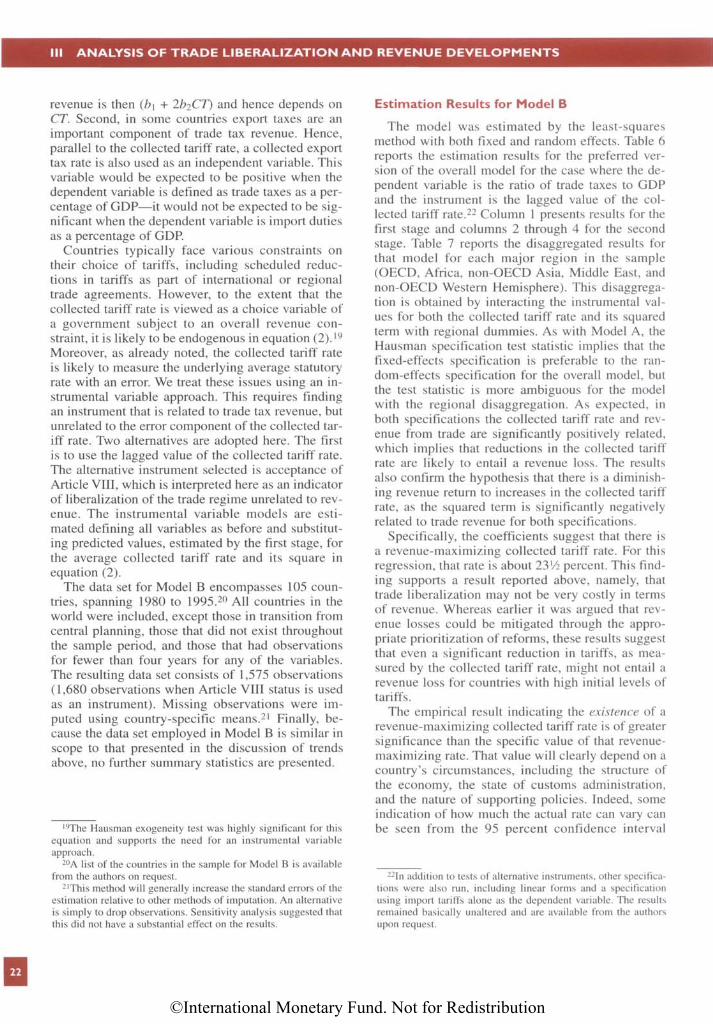
Ill ANALYSIS OF TRADE LIBERALIZATION AND REVENUE DEVELOPMENTS
revenue is then (b1 + 2b2CT) and hence depends onCT. Second, in some countries export taxes are animportant component of trade tax revenue. Hence,parallel to the collected tariff rate, a collected exporttax rate is also used as an independent variable. Thisvariable would be expected to be positive when thedependent variable is defined as trade taxes as a per-centage of GDP—it would not be expected to be sig-nificant when the dependent variable is import dutiesas a percentage of GDP.
Countries typically face various constraints ontheir choice of tariffs, including scheduled reduc-tions in tariffs as part of international or regionaltrade agreements. However, to the extent that thecollected tariff rate is viewed as a choice variable ofa government subject to an overall revenue con-straint, it is likely to be endogenous in equation (2).19
Moreover, as already noted, the collected tariff rateis likely to measure the underlying average statutoryrate with an error. We treat these issues using an in-strumental variable approach. This requires findingan instrument that is related to trade tax revenue, butunrelated to the error component of the collected tar-iff rate. Two alternatives are adopted here. The firstis to use the lagged value of the collected tariff rate.The alternative instrument selected is acceptance ofArticle VIII, which is interpreted here as an indicatorof liberalization of the trade regime unrelated to rev-enue. The instrumental variable models are esti-mated defining all variables as before and substitut-ing predicted values, estimated by the first stage, forthe average collected tariff rate and its square inequation (2).
The data set for Model B encompasses 105 coun-tries, spanning 1980 to 1995.20 All countries in theworld were included, except those in transition fromcentral planning, those that did not exist throughoutthe sample period, and those that had observationsfor fewer than four years for any of the variables.The resulting data set consists of 1,575 observations(1,680 observations when Article VIII status is usedas an instrument). Missing observations were im-puted using country-specific means.21 Finally, be-cause the data set employed in Model B is similar inscope to that presented in the discussion of trendsabove, no further summary statistics are presented.
19The Hausman exogeneity test was highly significant for thisequation and supports the need for an instrumental variableapproach.
20A list of the countries in the sample for Model B is availablefrom the authors on request.
21This method will generally increase the standard errors of theestimation relative to other methods of imputation. An alternativeis simply to drop observations. Sensitivity analysis suggested thatthis did not have a substantial effect on the results.
Estimation Results for Model B
The model was estimated by the least-squaresmethod with both fixed and random effects. Table 6reports the estimation results for the preferred ver-sion of the overall model for the case where the de-pendent variable is the ratio of trade taxes to GDPand the instrument is the lagged value of the col-lected tariff rate.22 Column 1 presents results for thefirst stage and columns 2 through 4 for the secondstage. Table 7 reports the disaggregated results forthat model for each major region in the sample(OECD, Africa, non-OECD Asia, Middle East, andnon-OECD Western Hemisphere). This disaggrega-tion is obtained by interacting the instrumental val-ues for both the collected tariff rate and its squaredterm with regional dummies. As with Model A, theHausman specification test statistic implies that thefixed-effects specification is preferable to the ran-dom-effects specification for the overall model, butthe test statistic is more ambiguous for the modelwith the regional disaggregation. As expected, inboth specifications the collected tariff rate and rev-enue from trade are significantly positively related,which implies that reductions in the collected tariffrate are likely to entail a revenue loss. The resultsalso confirm the hypothesis that there is a diminish-ing revenue return to increases in the collected tariffrate, as the squared term is significantly negativelyrelated to trade revenue for both specifications.
Specifically, the coefficients suggest that there isa revenue-maximizing collected tariff rate. For thisregression, that rate is about 23 1/2 percent. This find-ing supports a result reported above, namely, thattrade liberalization may not be very costly in termsof revenue. Whereas earlier it was argued that rev-enue losses could be mitigated through the appro-priate prioritization of reforms, these results suggestthat even a significant reduction in tariffs, as mea-sured by the collected tariff rate, might not entail arevenue loss for countries with high initial levels oftariffs.
The empirical result indicating the existence of arevenue-maximizing collected tariff rate is of greatersignificance than the specific value of that revenue-maximizing rate. That value will clearly depend on acountry's circumstances, including the structure ofthe economy, the state of customs administration,and the nature of supporting policies. Indeed, someindication of how much the actual rate can vary canbe seen from the 95 percent confidence interval
22In addition to tests of alternative instruments, other specifica-tions were also run, including linear forms and a specificationusing import tariffs alone as the dependent variable. The resultsremained basically unaltered and are available from the authorsupon request.
22
©International Monetary Fund. Not for Redistribution
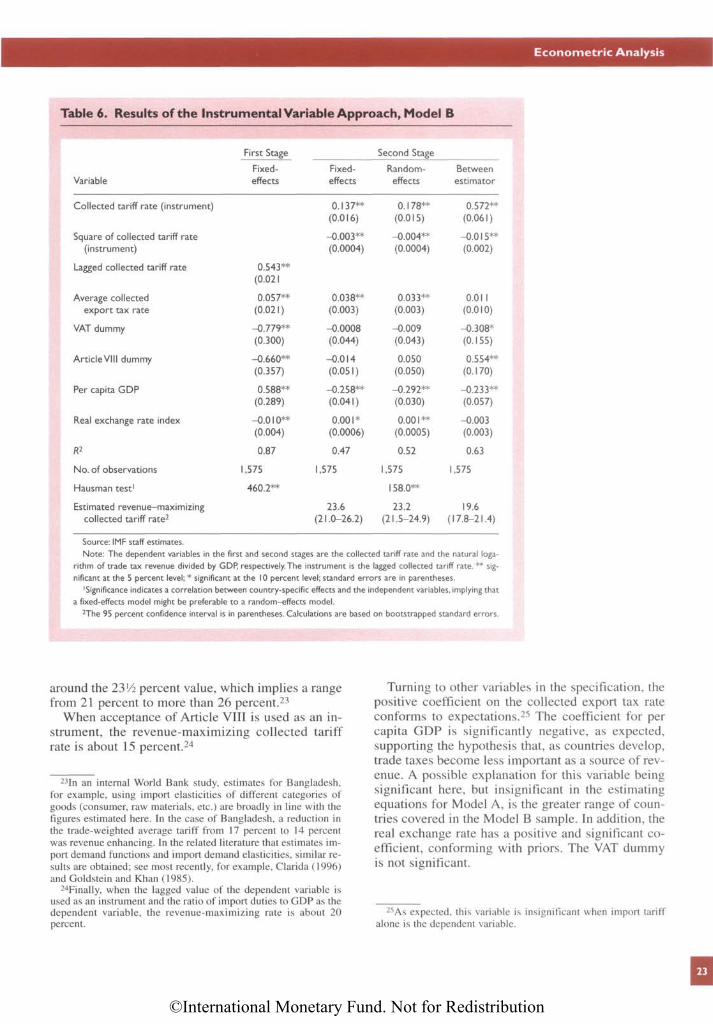
Econometric Analysis
Table 6. Results of the Instrumental Variable Approach, Model B
First Stage Second Stage
Fixed- Fixed- Random- BetweenVariable effects effects effects estimator
Collected tariff rate (instrument) 0.137** 0.178** 0.572**(0.016) (0.015) (0.061)
Square of collected tariff rate -0.003** -0.004** -0.015**(instrument) (0.0004) (0.0004) (0.002)
Lagged collected tariff rate 0.543**(0.021
Average collected 0.057** 0.038** 0.033** 0.011export tax rate (0.021) (0.003) (0.003) (0.010)
VAT dummy -0.779** -0.0008 -0.009 -0.308*(0.300) (0.044) (0.043) (0.155)
ArticleVIII dummy -0.660** -0.014 0.050 0.554**(0.357) (0.051) (0.050) (0.170)
Per capita GDP 0.588** -0.258** -0.292** -0.233**(0.289) (0.041) (0.030) (0.057)
Real exchange rate index -0.010** 0.001 * 0.001 ** -0.003(0.004) (0.0006) (0.0005) (0.003)
R2 0.87 0.47 0.52 0.63
No. of observations 1,575 1,575 1,575 1,575
Hausmantest1 460 .2* * 158.0**
Estimated revenue-maximizing 23.6 23.2 19.6collected tariff rate2 (21.0-26.2) (21.5-24.9) (17.8-21.4)
Source: IMF staff estimates.
Note: The dependent variables in the first and second stages are the collected tariff rate and the natural loga-
rithm of trade tax revenue divided by GDP, respectively.The instrument is the lagged collected tariff rate. ** sig-
nificant at the 5 percent level; * significant at the 10 percent level; standard errors are in parentheses.
1Significance indicates a correlation between country-specific effects and the independent variables, implying that
a fixed-effects model might be preferable to a random-effects model.2The 95 percent confidence interval is in parentheses. Calculations are based on bootstrapped standard errors.
around the 23 1/2 percent value, which implies a rangefrom 21 percent to more than 26 percent.23
When acceptance of Article VIII is used as an in-strument, the revenue-maximizing collected tariffrate is about 15 percent.24
23In an internal World Bank study, estimates for Bangladesh,for example, using import elasticities of different categories ofgoods (consumer, raw materials, etc.) are broadly in line with thefigures estimated here. In the case of Bangladesh, a reduction inthe trade-weighted average tariff from 17 percent to 14 percentwas revenue enhancing. In the related literature that estimates im-port demand functions and import demand elasticities, similar re-sults are obtained; see most recently, for example, Clarida (1996)and Goldstein and Khan (1985).
24Finally, when the lagged value of the dependent variable isused as an instrument and the ratio of import duties to GDP as thedependent variable, the revenue-maximizing rate is about 20percent.
Turning to other variables in the specification, thepositive coefficient on the collected export tax rateconforms to expectations.25 The coefficient for percapita GDP is significantly negative, as expected,supporting the hypothesis that, as countries develop,trade taxes become less important as a source of rev-enue. A possible explanation for this variable beingsignificant here, but insignificant in the estimatingequations for Model A, is the greater range of coun-tries covered in the Model B sample. In addition, thereal exchange rate has a positive and significant co-efficient, conforming with priors. The VAT dummyis not significant.
25As expected, this variable is insignificant when import tariffalone is the dependent variable.
23
©International Monetary Fund. Not for Redistribution
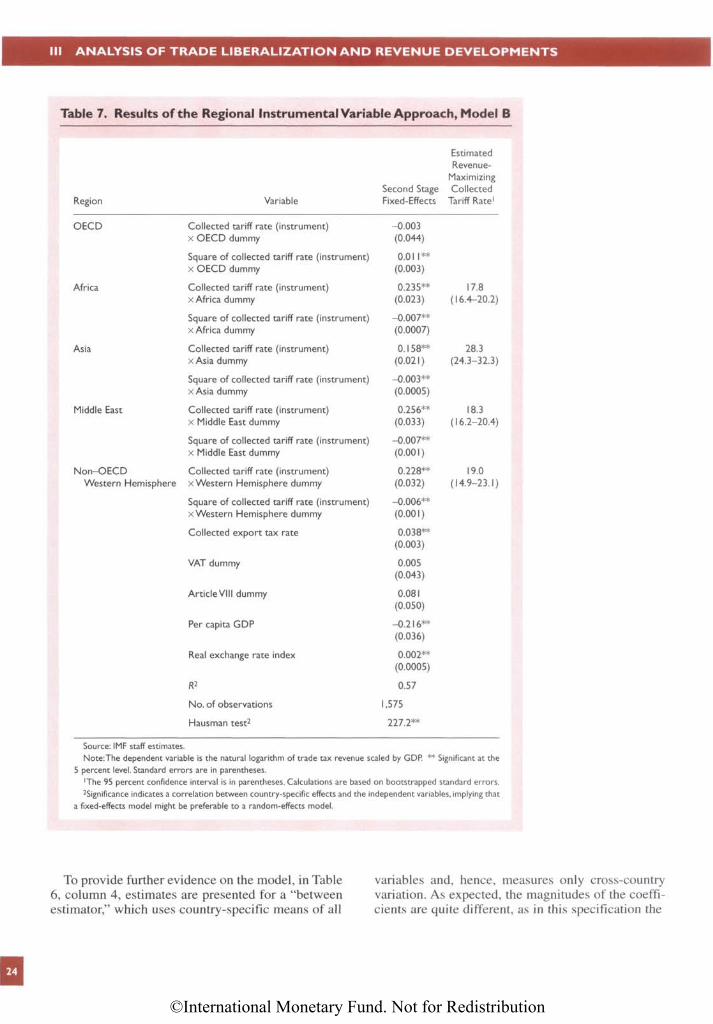
Ill ANALYSIS OF TRADE LIBERALIZATION AND REVENUE DEVELOPMENTS
Table 7. Results of the Regional Instrumental Variable Approach, Model B
EstimatedRevenue-
MaximizingSecond Stage Collected
Region Variable Fixed-Effects Tariff Rate1
OECD Collected tariff rate (instrument) -0.003x OECD dummy (0.044)
Square of collected tariff rate (instrument) 0.011 **x OECD dummy (0.003)
Africa Collected tariff rate (instrument) 0.235** 17.8x Africa dummy (0.023) (16.4-20.2)
Square of collected tariff rate (instrument) -0.007**x Africa dummy (0.0007)
Asia Collected tariff rate (instrument) 0.158** 28.3x Asia dummy (0.021) (24.3-32.3)
Square of collected tariff rate (instrument) -0.003**x Asia dummy (0.0005)
Middle East Collected tariff rate (instrument) 0.256** 18.3x Middle East dummy (0.033) (16.2-20.4)
Square of collected tariff rate (instrument) -0.007**x Middle East dummy (0.001)
Non-OECD Collected tariff rate (instrument) 0.228** 19.0Western Hemisphere x Western Hemisphere dummy (0.032) (14.9-23.1)
Square of collected tariff rate (instrument) -0.006**x Western Hemisphere dummy (0.001)
Collected export tax rate 0.038**(0.003)
VAT dummy 0.005(0.043)
ArticleVIII dummy 0.081(0.050)
Per capita GDP -0.216**(0.036)
Real exchange rate index 0.002**(0.0005)
R2 0.57
No. of observations 1,575
Hausman test2 227.2**
Source: IMF staff estimates.
Note:The dependent variable is the natural logarithm of trade tax revenue scaled by GDP. ** Significant at the
5 percent level. Standard errors are in parentheses.
1The 95 percent confidence interval is in parentheses. Calculations are based on bootstrapped standard errors.
Significance indicates a correlation between country-specific effects and the independent variables, implying that
a fixed-effects model might be preferable to a random-effects model.
To provide further evidence on the model, in Table6, column 4, estimates are presented for a "betweenestimator," which uses country-specific means of all
24
variables and, hence, measures only cross-countryvariation. As expected, the magnitudes of the coeffi-cients are quite different, as in this specification the
©International Monetary Fund. Not for Redistribution
Econometric Analysis
information from the time-series variation is ne-glected. Nevertheless, the estimated revenue-maxi-mizing collected tariff rate is broadly unchanged.
Additional information is obtained when the re-sults are disaggregated by region. First, the OECDsubsample does not have a revenue-maximizing col-lected tariff rate, suggesting that the revenue-maxi-mizing collected tariff for the full sample needs to beinterpreted with caution. The other regional subsam-ples, however, have revenue-maximizing collectedtariff rates that range from 17.8 percent (for theAfrica region) to 28.3 percent (for the Asia region).On further examination, the result for the Asia regionis heavily influenced by the inclusion of India andMyanmar. Excluding these two outliers from thesample results in a revenue-maximizing tariff ratefor the Asia region of 20 percent, which is within therange reported for the other regions.
The data indicate that many countries with veryhigh levels of tariffs have not reduced their col-lected tariff rates. The number of countries with acollected tariff rate in excess of 25 percent increasedfrom 7 in 1980 to 9 during the sample period(1980-95); the number of countries with a collectedtariff rate in excess of 20 percent also remained sig-nificant, falling only from 19 in 1980 to 16 in 1995(out of a sample of 105 countries). These data sug-gest that a significant number of countries couldachieve further reductions in tariffs without majorrevenue loss.
Finally, in interpreting this result, note that boththe weighted and the unweighted average statutorytariff rates associated with any specific revenue-maximizing collected tariff rate would be signifi-cantly higher in the presence of evasion or of tariffexemptions for some imports. An additional reasonwhy the actual tax burden may be significantlyhigher than implied by any collected tariff rate is thatmany goods subject to tariffs are also subject to do-mestic taxes.
The main conclusions that emerge from the econo-metric analysis are the following:
• The results, particularly the dummy variable re-sults, are consistent with the proposition thattrade reforms in many developing countrieshave been fashioned so as to minimize adverserevenue consequences.
• The results indicate that trade liberalization thatleads to increased imports has a positive impacton trade revenue. This indicates more generallythat, whatever the initial impact of reform onrevenue, economic growth and increasing im-ports are likely to buoy trade tax revenue overtime.
• The evidence of a revenue-maximizing col-lected trade tax rate implies that some countrieswith collected tariff rates above revenue-maxi-mizing levels may be able to liberalize withoutadverse revenue consequences.26 Both theweighted-average and the unweighted-averagestatutory rates associated with this result wouldbe significantly higher than the collected rate,given evasion and tariff exemptions. In thatconnection it is important to remember thatmany goods subject to tariffs are also subject todomestic taxes, increasing the incentive to sub-stitute lower-taxed goods for higher-taxed onesand to evade taxes.
• In interpreting the calculated revenue-maximiz-ing tariff for any given country, it is also impor-tant to take account of the circumstances of thatcountry (e.g., the degree of its openness to trade,the efficiency of customs administration, thepresence or absence of supporting policies). Inaddition, as the empirical results in Model Ashow, the revenue impact will be influenced bythe pattern of trade liberalization.
• The other side of the behavior of the collectedtariff rate variable is that trade tax revenue willtend to decline as trade liberalization results inever deeper cuts in tariff levels.
• There is also support for the proposition that thelevel of trade revenue depends on supportingmacroeconomic policies. In particular, the re-sults indicate that a depreciation in terms of thereal exchange rate commonly enhances trade taxrevenue, at least until the full effects of the de-preciation are felt throughout all sectors of theeconomy.
26To stress the obvious, the existence of a revenue-maximizingrate should not be interpreted as providing countries with lower tar-iffs a rationale for increasing their revenue by raising tariff rates.
25
©International Monetary Fund. Not for Redistribution
IV Conclusions
he association between trade liberalization andeconomic growth underscores the importance of
ensuring that fiscal considerations do not constrainthe pace of trade reform. This study has examinedthe effect of trade liberalization on government rev-enue. The strategy has been to determine the revenueimplications of trade reform in practice by takingthree complementary approaches: a comparativeanalysis of reforms in selected countries, a simpleexamination of trends in a broad range of countries,and econometric analysis.
The results suggest some observations and policyconclusions:
• Current levels of protection would suggest thatmany countries could liberalize further withoutadverse consequences for trade tax revenueeven in the near term. In addition, the evidencefrom the comparative analysis indicates thatscope may exist to tailor the pattern of trade lib-eralization to avoid adverse revenue conse-quences. Moreover, over the longer term thelink between trade liberalization and more rapideconomic growth will further bolster revenuefor a given level of tariffs.
• Even though some countries have been able toachieve significant trade liberalization by tailor-ing that liberalization to minimize the revenueconsequences, more substantial trade reformmight have occurred had maintaining revenuenot been a consideration. Accordingly, imple-menting comprehensive reform of the domestictax system from the outset of the liberalizationprocess is a priority. An additional reason forstressing the urgency of reforms to bolster do-mestic taxes is that such reforms have long ges-tation periods.
• Precisely because trade liberalization can beassociated with revenue increases even in
cases where trade restrictions are initially high,it can be misleading to interpret an increase inthe ratio of trade tax revenue to GDP as evi-dence of a negative orientation toward trade re-form. This is especially true in Africa, whichstarted out with the highest levels of trade taxdependence.
• Genuine trade liberalization must neverthelesseventually result in reduced trade tax revenueand hence will raise difficult fiscal issues if ap-propriate steps have not been taken tostrengthen the domestic tax system. Indeed,some countries have encountered setbacks onthe path of trade liberalization because of therevenue consequences. Alternatively, if the rev-enue impact of trade liberalization is not offsetby enhanced revenue performance of the do-mestic tax structure, the ability of governmentsto meet essential expenditure needs could becompromised.
• A reformed tax system not only will help gener-ate revenue but also will work to improve re-source allocation, potentially contributing tohigher rates of sustainable growth.
• It is clear that successful trade liberalization isgreatly facilitated by sound supporting macro-economic policies, and in particular appropriateexchange rate policies.
• The interpretation of the trade orientation ofsmall, open economies can be complicated,given that in some circumstances the economicimpact of some tariff and domestic tax struc-tures can be broadly similar.
In sum, the main policy conclusion is that tradeliberalization would be greatly facilitated bymutually reinforcing combinations of trade reform,domestic tax reform, and sound macroeconomicpolicies.
26
T
©International Monetary Fund. Not for Redistribution
Appendix 1 Summary Measures forthe Countries in theComparative Analysis
27
©International Monetary Fund. Not for Redistribution
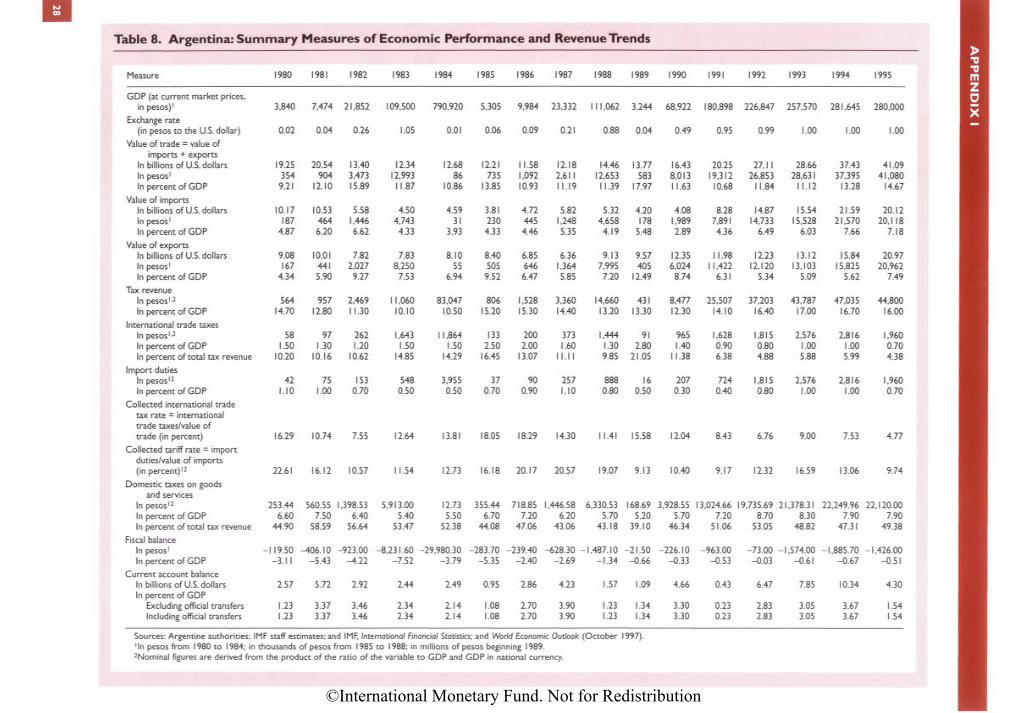
Table 8. Argentina: Summary Measures of Economic Performance and Revenue Trends
Measure 1980 1981 1982 1983 1984 1985 1986 1987 1988 1989 1990 1991 1992 1993 1994 1995
GDP (at current market prices,in pesos)1 3,840 7,474 21,852 109,500 790,920 5,305 9,984 23,332 111,062 3,244 68,922 180,898 226,847 257,570 281,645 280,000
Exchange rate(in pesos to the U.S. dollar) 0.02 0.04 0.26 1.05 0.01 0.06 0.09 0.21 0.88 0.04 0.49 0.95 0.99 1.00 1.00 1.00
Value of trade = value ofimports + exports
In billions of U.S. dollars 19.25 20.54 13.40 12.34 12.68 12.21 11.58 12.18 14.46 13.77 16.43 20.25 27.11 28.66 37.43 41.09In pesos1 354 904 3,473 12,993 86 735 1,092 2,611 12,653 583 8,013 19,312 26,853 28,631 37,395 41,080In percent of GDP 9.21 12.10 15.89 11.87 10.86 13.85 10.93 11.19 11.39 17.97 11.63 10.68 11.84 11.12 13.28 14.67
Value of importsIn billions of U.S. dollars 10.17 10.53 5.58 4.50 4.59 3.81 4.72 5.82 5.32 4.20 4.08 8.28 14.87 15.54 21.59 20.12In pesos' 187 464 1,446 4,743 31 230 445 1,248 4,658 178 1,989 7,891 14,733 15,528 21,570 20,118In percent of GDP 4.87 6.20 6.62 4.33 3.93 4.33 4.46 5.35 4.19 5.48 2.89 4.36 6.49 6.03 7.66 7.18
Value of exportsIn billions of U.S. dollars 9.08 10.01 7.82 7.83 8.10 8.40 6.85 6.36 9.13 9.57 12.35 11.98 12.23 13.12 15.84 20.97In pesos1 167 441 2,027 8,250 55 505 646 1,364 7,995 405 6,024 11,422 12,120 13,103 15,825 20,962In percent of GDP 4.34 5.90 9.27 7.53 6.94 9.52 6.47 5.85 7.20 12.49 8.74 6.31 5.34 5.09 5.62 7.49
Tax revenueIn pesos12 564 957 2,469 11,060 83,047 806 1,528 3,360 14,660 431 8,477 25,507 37,203 43,787 47,035 44,800In percent of GDP 14.70 12.80 11.30 10.10 10.50 15.20 15.30 14.40 13.20 13.30 12.30 14.10 16.40 17.00 16.70 16.00
International trade taxesIn pesos12 58 97 262 1,643 11,864 133 200 373 1,444 91 965 1,628 1,815 2,576 2,816 1,960In percent of GDP 1.50 1.30 1.20 1.50 1.50 2.50 2.00 1.60 1.30 2.80 1.40 0.90 0.80 1.00 1.00 0.70In percent of total tax revenue 10.20 10.16 10.62 14.85 14.29 16.45 13.07 11.11 9.85 21.05 11.38 6.38 4.88 5.88 5.99 4.38
Import dutiesIn pesos12 42 75 153 548 3,955 37 90 257 888 16 207 724 1,815 2,576 2,816 1,960In percent of GDP 1.10 1.00 0.70 0.50 0.50 0.70 0.90 1.10 0.80 0.50 0.30 0.40 0.80 1.00 1.00 0.70
Collected international tradetax rate = internationaltrade taxes/value oftrade (in percent) 16.29 10.74 7.55 12.64 13.81 18.05 18.29 14.30 11.41 15.58 12.04 8.43 6.76 9.00 7.53 4.77
Collected tariff rate = importduties/value of imports(in percent)12 22.61 16.12 10.57 11.54 12.73 16.18 20.17 20.57 19.07 9.13 10.40 9.17 12.32 16.59 13.06 9.74
Domestic taxes on goodsand services
In pesos12 253.44 560.55 1,398.53 5,913.00 12.73 355.44 718.85 1,446.58 6,330.53 168.69 3,928.55 13,024.66 19,735.69 21,378.31 22,249.96 22,120.00In percent of GDP 6.60 7.50 6.40 5.40 5.50 6.70 7.20 6.20 5.70 5.20 5.70 7.20 8.70 8.30 7.90 7.90In percent of total tax revenue 44.90 58.59 56.64 53.47 52.38 44.08 47.06 43.06 43.18 39.10 46.34 51.06 53.05 48.82 47.31 49.38
Fiscal balanceIn pesos' -119.50 -406.10 -923.00 -8,231.60 -29,980.30 -283.70 -239.40 -628.30 -1,487.10 -21.50 -226.10 -963.00 -73.00 -1,574.00 -1,885.70 -1,426.00In percent of GDP -3.11 -5.43 -422 -7.52 -3.79 -5.35 -2.40 -2.69 -1.34 -0.66 -0.33 -0.53 -0.03 -0.61 -0.67 -0.51
Current account balanceIn billions of U.S. dollars 2.57 5.72 2.92 2.44 2.49 0.95 2.86 4.23 1.57 1.09 4.66 0.43 6.47 7.85 10.34 4.30In percent of GDP
Excluding official transfers 1.23 3.37 3.46 2.34 2.14 1.08 2.70 3.90 1.23 1.34 3.30 0.23 2.83 3.05 3.67 1.54Including official transfers 1.23 3.37 3.46 2.34 2.14 1.08 2.70 3.90 1.23 1.34 3.30 0.23 2.83 3.05 3.67 1.54
Sources: Argentine authorities; IMF staff estimates; and IMF, International Financial Statistics; and World Economic Outlook (October .'In pesos from 1980 to 1984; in thousands of pesos from 1985 to 1988; in millions of pesos beginning 1989.2Nominal figures are derived from the product of the ratio of the variable to GDP and GDP in national currency.
©International Monetary Fund. Not for Redistribution
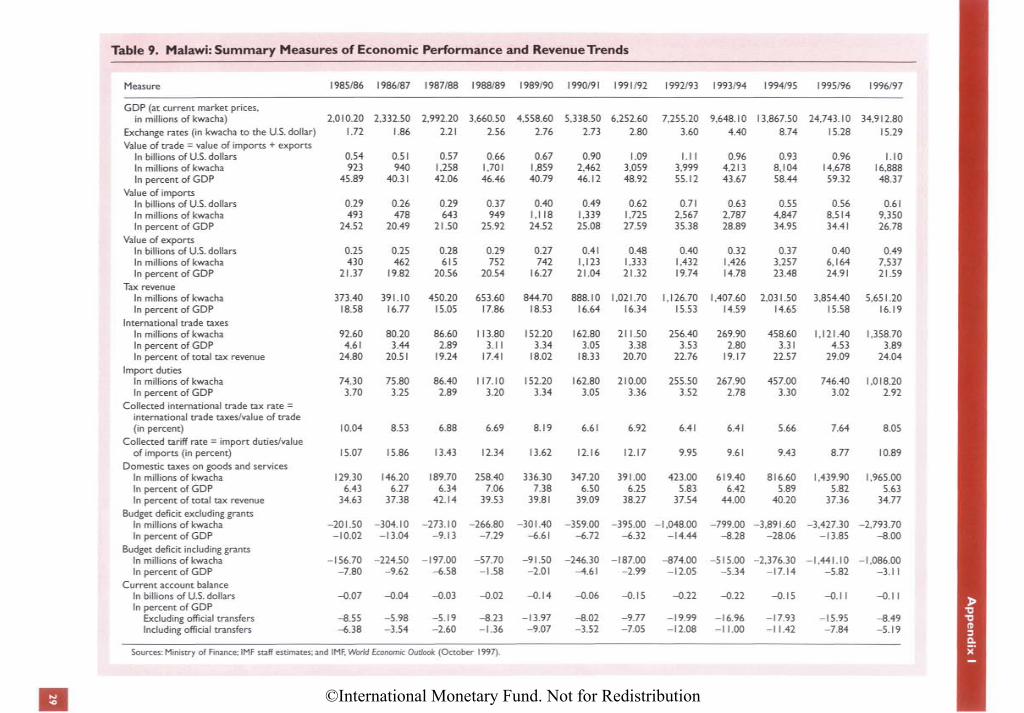
Table 9. Malawi: Summary Measures of Economic Performance and Revenue Trends
Measure 1985/86 1986/87 1987/88 1988/89 1989/90 1990/91 1991/92 1992/93 1993/94 1994/95 1995/96 1996/97
GDP (at current market prices,in millions of kwacha) 2,010.20 2,332.50 2,992.20 3,660.50 4,558.60 5,338.50 6,252.60 7,255.20 9,648.10 13,867.50 24,743.10 34,912.80
Exchange rates (in kwacha to the U.S. dollar) 1.72 1.86 2.21 2.56 2.76 2.73 2.80 3.60 4.40 8.74 15.28 15.29Value of trade = value of imports + exports
In billions of U.S. dollars 0.54 0.51 0.57 0.66 0.67 0.90 1.09 I.I I 0.96 0.93 0.96 1.10In millions of kwacha 923 940 1,258 1,701 1,859 2,462 3,059 3,999 4,213 8,104 14,678 16,888In percent of GDP 45.89 40.31 42.06 46.46 40.79 46.12 48.92 55.12 43.67 58.44 59.32 48.37
Value of importsIn billions of U.S. dollars 0.29 0.26 0.29 0.37 0.40 0.49 0.62 0.71 0.63 0.55 0.56 0.61In millions of kwacha 493 478 643 949 1,118 1,339 1,725 2,567 2,787 4,847 8,514 9,350In percent of GDP 24.52 20.49 21.50 25.92 24.52 25.08 27.59 35.38 28.89 34.95 34.41 26.78
Value of exportsIn billions of U.S. dollars 0.25 0.25 0.28 0.29 0.27 0.41 0.48 0.40 0.32 0.37 0.40 0.49In millions of kwacha 430 462 615 752 742 1,123 1,333 1,432 1,426 3,257 6,164 7,537In percent of GDP 21.37 19.82 20.56 20.54 16.27 21.04 21.32 19.74 14.78 23.48 24.91 21.59
Tax revenueIn millions of kwacha 373.40 391.10 450.20 653.60 844.70 888.10 1,021.70 1,126.70 1,407.60 2,031.50 3,854.40 5,651.20In percent of GDP 18.58 16.77 15.05 17.86 18.53 16.64 16.34 15.53 14.59 14.65 15.58 16.19
International trade taxesIn millions of kwacha 92.60 80.20 86.60 113.80 152.20 162.80 211.50 256.40 269.90 458.60 1,121.40 1,358.70In percent of GDP 4.61 3.44 2.89 3.11 3.34 3.05 3.38 3.53 2.80 3.31 4.53 3.89In percent of total tax revenue 24.80 20.51 19.24 17.41 18.02 18.33 20.70 22.76 19.17 22.57 29.09 24.04
Import dutiesIn millions of kwacha 74.30 75.80 86.40 117.10 152.20 162.80 210.00 255.50 267.90 457.00 746.40 1,018.20In percent of GDP 3.70 3.25 2.89 3.20 3.34 3.05 3.36 3.52 2.78 3.30 3.02 2.92
Collected international trade tax rate =international trade taxes/value of trade(in percent) 10.04 8.53 6.88 6.69 8.19 6.61 6.92 6.41 6.41 5.66 7.64 8.05
Collected tariff rate = import duties/valueof imports (in percent) 15.07 15.86 13.43 12.34 13.62 12.16 12.17 9.95 9.61 9.43 8.77 10.89
Domestic taxes on goods and servicesIn millions of kwacha 129.30 146.20 189.70 258.40 336.30 347.20 391.00 423.00 619.40 816.60 1,439.90 1,965.00In percent of GDP 6.43 6.27 6.34 7.06 7.38 6.50 6.25 5.83 6.42 5.89 5.82 5.63In percent of total tax revenue 34.63 37.38 42.14 39.53 39.81 39.09 38.27 37.54 44.00 40.20 37.36 34.77
Budget deficit excluding grantsIn millions of kwacha -201.50 -304.10 -273.10 -266.80 -301.40 -359.00 -395.00 -1,048.00 -799.00 -3,891.60 -3,427.30 -2,793.70In percent of GDP -10.02 -13.04 -9.13 -7.29 -6.61 -6.72 -6.32 -14.44 -8.28 -28.06 -13.85 -8.00
Budget deficit including grantsIn millions of kwacha -156.70 -224.50 -197.00 -57.70 -91.50 -246.30 -187.00 -874.00 -515.00 -2,376.30 -1,441.10 -1,086.00In percent of GDP -7.80 -9.62 -6.58 -1.58 -2.01 -4.61 -2.99 -12.05 -5.34 -17.14 -5.82 -3.11
Current account balanceIn billions of U.S. dollars -0.07 -0.04 -0.03 -0.02 -0.14 -0.06 -0.15 -0.22 -0.22 -0.15 -0.1 I -0.1 IIn percent of GDP
Excluding official transfers -8.55 -5.98 -5.19 -8.23 -13.97 -8.02 -9.77 -19.99 -16.96 -17.93 -15.95 -8.49Including official transfers -6.38 -3.54 -2.60 -1.36 -9.07 -3.52 -7.05 -12.08 -11.00 -11.42 -7.84 -5.19
Sources: Ministry of Finance; IMF staff estimates; and IMF, World Economic Outlook (October 1997).
©International Monetary Fund. Not for Redistribution
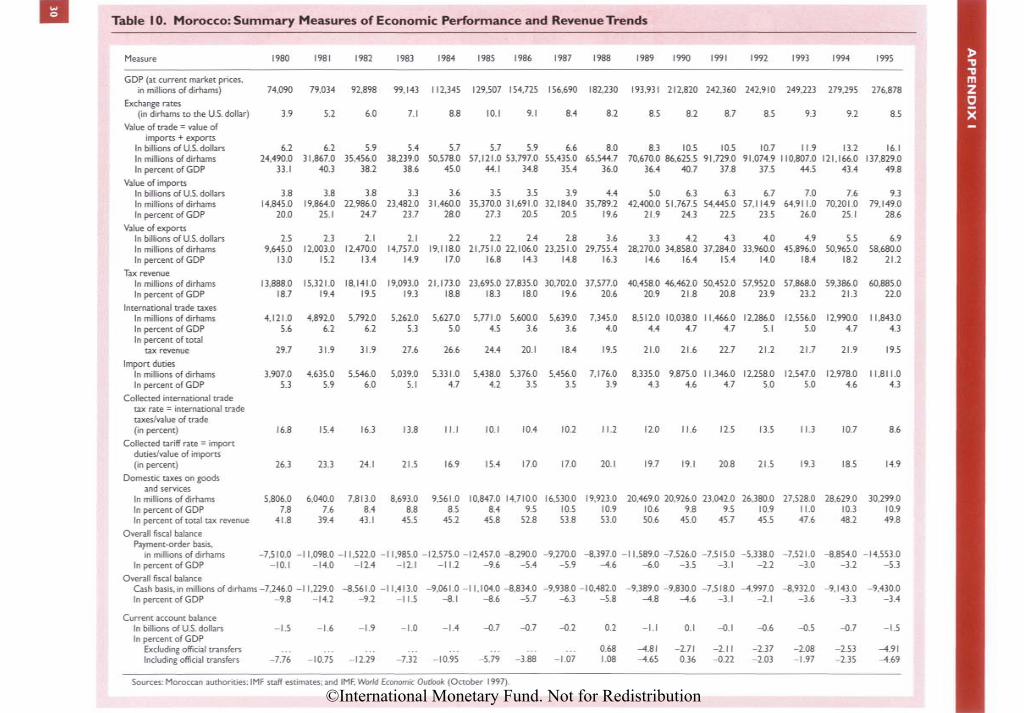
Table 10. Morocco: Summary Measures of Economic Performance and Revenue Trends
Measure 1980 1981 1982 1983 1984 1985 1986 1987 1988 1989 1990 1991 1992 1993 1994 1995
GDP (at current market prices,in millions of dirhams) 74,090 79,034 92,898 99,143 112,345 129,507 154,725 156,690 182,230 193,931 212,820 242,360 242,910 249,223 279,295 276,878
Exchange rates(in dirhams to the U.S. dollar) 3.9 5.2 6.0 7.1 8.8 10.1 9.1 8.4 8.2 8.5 8.2 8.7 8.5 9.3 9.2 8.5
Value of trade = value ofimports + exports
In billions of U.S. dollars 6.2 6.2 5.9 5.4 5.7 5.7 5.9 6.6 8.0 8.3 10.5 10.5 10.7 11.9 13.2 16.1In millions of dirhams 24,490.0 31,867.0 35,456.0 38,239.0 50,578.0 57,121.0 53,797.0 55,435.0 65,544.7 70,670.0 86,625.5 91,729.0 91,074.9 110,807.0 121,166.0 137,829.0In percent of GDP 33.1 40.3 38.2 38.6 45.0 44.1 34.8 35.4 36.0 36.4 40.7 37.8 37.5 44.5 43.4 49.8
Value of importsIn billions of U.S. dollars 3.8 3.8 3.8 3.3 3.6 3.5 3.5 3.9 4.4 5.0 6.3 6.3 6.7 7.0 7.6 9.3In millions of dirhams 14,845.0 19,864.0 22,986.0 23,482.0 31,460.0 35,370.0 31,691.0 32,184.0 35,789.2 42,400.0 51,767.5 54,445.0 57,114.9 64,911.0 70,201.0 79,149.0In percent of GDP 20.0 25.1 24.7 23.7 28.0 27.3 20.5 20.5 19.6 21.9 24.3 22.5 23.5 26.0 25.1 28.6
Value of exportsIn billions of U.S. dollars 2.5 2.3 2.1 2.1 2.2 2.2 2.4 2.8 3.6 3.3 4.2 4.3 4.0 4.9 5.5 6.9In millions of dirhams 9,645.0 12,003.0 12,470.0 14,757.0 19,118.0 21,751.0 22,106.0 23,251.0 29,755.4 28,270.0 34,858.0 37,284.0 33,960.0 45,896.0 50,965.0 58,680.0In percent of GDP 13.0 15.2 13.4 14.9 17.0 16.8 14.3 14.8 16.3 14.6 16.4 15.4 14.0 18.4 18.2 21.2
Tax revenueIn millions of dirhams 13,888.0 15,321.0 18,141.0 19,093.0 21,173.0 23,695.027,835.030,702.0 37,577.0 40,458.046,462.050,452.057,952.0 57,868.0 59,386.0 60,885.0In percent of GDP 18.7 19.4 19.5 19.3 18.8 18.3 18.0 19.6 20.6 20.9 21.8 20.8 23.9 23.2 21.3 22.0
International trade taxesIn millions of dirhams 4,121.0 4,892.0 5,792.0 5,262.0 5,627.0 5,771.0 5,600.0 5,639.0 7,345.0 8,512.0 10,038.0 11,466.0 12,286.0 12,556.0 12,990.0 11,843.0In percent of GDP 5.6 6.2 6.2 5.3 5.0 4.5 3.6 3.6 4.0 4.4 4.7 4.7 5.1 5.0 4.7 4.3In percent of total
tax revenue 29.7 31.9 31.9 27.6 26.6 24.4 20.1 18.4 19.5 21.0 21.6 22.7 21.2 21.7 21.9 19.5
Import dutiesIn millions of dirhams 3,907.0 4,635.0 5,546.0 5,039.0 5,331.0 5,438.0 5,376.0 5,456.0 7,176.0 8,335.0 9,875.0 11,346.0 12,258.0 12,547.0 12,978.0 11,811.0In percent of GDP 5.3 5.9 6.0 5.1 4.7 4.2 3.5 3.5 3.9 4.3 4.6 4.7 5.0 5.0 4.6 4.3
Collected international tradetax rate = international tradetaxes/value of trade(in percent) 16.8 15.4 16.3 13.8 I I.I 10.1 10.4 10.2 11.2 12.0 11.6 12.5 13.5 11.3 10.7 8.6
Collected tariff rate = importduties/value of imports(in percent) 26.3 23.3 24.1 21.5 16.9 15.4 17.0 17.0 20.1 19.7 19.1 20.8 21.5 19.3 18.5 14.9
Domestic taxes on goodsand services
In millions of dirhams 5,806.0 6,040.0 7,813.0 8,693.0 9,561.0 10,847.0 14,710.0 16,530.0 19,923.0 20,469.0 20,926.0 23,042.0 26,380.0 27,528.0 28,629.0 30,299.0In percent of GDP 7.8 7.6 8.4 8.8 8.5 8.4 9.5 10.5 10.9 10.6 9.8 9.5 10.9 11.0 10.3 10.9In percent of total tax revenue 41.8 39.4 43.1 45.5 45.2 45.8 52.8 53.8 53.0 50.6 45.0 45.7 45.5 47.6 48.2 49.8
Overall fiscal balancePayment-order basis,
in millions of dirhams -7,510.0-11,098.0-11,522.0-11,985.0-12,575.0-12,457.0-8,290.0 -9,270.0 -8 ,397.0-11,589.0-7,526.0-7,515.0 -5,338.0 -7,521.0 ^8,854.0 -14,553.0In percent of GDP -10.1 -14.0 -12.4 -12.1 -11.2 -9.6 -5.4 -5.9 -4.6 -6.0 -3.5 -3.1 -2.2 -3.0 -3.2 -5.3
Overall fiscal balanceCash basis, in millions of dirhams-7,246.0-11,229.0 -8,561.0-11,413.0 -9,061.0-11,104.0-8,834.0 -9,938.0-10,482.0 -9,389.0-9,830.0-7,518.0 -4,997.0 -8,932.0 -9,143.0 -9,430.0In percent of GDP -9.8 -14.2 -9.2 -11.5 -8.1 -8.6 -5.7 -6.3 -5.8 -4.8 -4.6 -3.1 -2.1 -3.6 -3.3 -3.4
Current account balanceIn billions of U.S. dollars -1.5 -1.6 -1.9 -1.0 -1.4 -0.7 -0.7 -0.2 0.2 - I . I 0.1 -0.1 -0.6 -0.5 -0.7 -1.5In percent of GDP
Excluding official transfers . . . . . . . . . . . . . . . . . . 0.68 -4.81 -2.71 -2.11 -2.37 -2.08 -2.53 -4.91Including official transfers -7.76 -10.75 -12.29 -7.32 -10.95 -5.79 -3.88 -1.07 1.08 -4.65 0.36 -0.22 -2.03 -1.97 -2.35 -4.69
Sources: Moroccan authorities; IMF staff estimates; and IMF, World Economic Outlook (October 1997).
©International Monetary Fund. Not for Redistribution
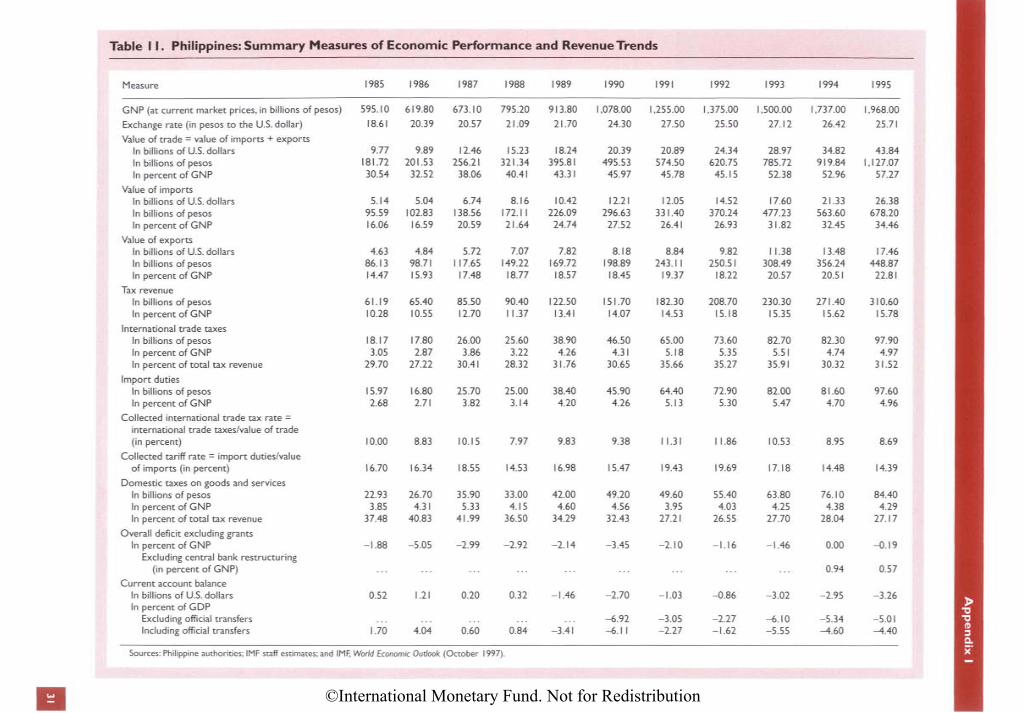
Table 11. Philippines: Summary Measures of Economic Performance and Revenue Trends
Measure 1985 1986 1987 1988 1989 1990 1991 1992 1993 1994 1995
GNP (at current market prices, in billions of pesos) 595.10 619.80 673.10 795.20 913.80 1,078.00 1,255.00 1,375.00 1,500.00 1,737.00 1,968.00
Exchange rate (in pesos to the U.S. dollar) 18.61 20.39 20.57 21.09 21.70 24.30 27.50 25.50 27.12 26.42 25.71
Value of trade = value of imports + exportsIn billions of U.S. dollars 9.77 9.89 12.46 15.23 18.24 20.39 20.89 24.34 28.97 34.82 43.84In billions of pesos 181.72 201.53 256.21 321.34 395.81 495.53 574.50 620.75 785.72 919.84 1,127.07In percent of GNP 30.54 32.52 38.06 40.41 43.31 45.97 45.78 45.15 52.38 52.96 57.27
Value of importsIn billions of U.S. dollars 5.14 5.04 6.74 8.16 10.42 12.21 12.05 14.52 17.60 21.33 26.38In billions of pesos 95.59 102.83 138.56 172.11 226.09 296.63 331.40 370.24 477.23 563.60 678.20In percent of GNP 16.06 16.59 20.59 21.64 24.74 27.52 26.41 26.93 31.82 32.45 34.46
Value of exportsIn billions of U.S. dollars 4.63 4.84 5.72 7.07 7.82 8.18 8.84 9.82 11.38 13.48 17.46In billions of pesos 86.13 98.71 117.65 149.22 169.72 198.89 243.11 250.51 308.49 356.24 448.87In percent of GNP 14.47 15.93 17.48 18.77 18.57 18.45 19.37 18.22 20.57 20.51 22.81
Tax revenueIn billions of pesos 61.19 65.40 85.50 90.40 122.50 151.70 182.30 208.70 230.30 271.40 310.60In percent of GNP 10.28 10.55 12.70 11.37 13.41 14.07 14.53 15.18 15.35 15.62 15.78
International trade taxesIn billions of pesos 18.17 17.80 26.00 25.60 38.90 46.50 65.00 73.60 82.70 82.30 97.90In percent of GNP 3.05 2.87 3.86 3.22 4.26 4.31 5.18 5.35 5.51 4.74 4.97In percent of total tax revenue 29.70 27.22 30.41 28.32 31.76 30.65 35.66 35.27 35.91 30.32 31.52
Import dutiesIn billions of pesos 15.97 16.80 25.70 25.00 38.40 45.90 64.40 72.90 82.00 81.60 97.60In percent of GNP 2.68 2.71 3.82 3.14 4.20 4.26 5.13 5.30 5.47 4.70 4.96
Collected international trade tax rate =international trade taxes/value of trade(in percent) 10.00 8.83 10.15 7.97 9.83 9.38 11.31 11.86 10.53 8.95 8.69
Collected tariff rate = import duties/valueof imports (in percent) 16.70 16.34 18.55 14.53 16.98 15.47 19.43 19.69 17.18 14.48 14.39
Domestic taxes on goods and servicesIn billions of pesos 22.93 26.70 35.90 33.00 42.00 49.20 49.60 55.40 63.80 76.10 84.40In percent of GNP 3.85 4.31 5.33 4.15 4.60 4.56 3.95 4.03 4.25 4.38 4.29In percent of total tax revenue 37.48 40.83 41.99 36.50 34.29 32.43 27.21 26.55 27.70 28.04 27.17
Overall deficit excluding grantsIn percent of GNP -1.88 -5.05 -2.99 -2.92 -2.14 -3.45 -2.10 -1.16 -1.46 0.00 -0.19
Excluding central bank restructuring(in percent of GNP) . . . . . . . . . . . . . . . . . . . . . . . . . . . 0.94 0.57
Current account balanceIn billions of U.S. dollars 0.52 1.21 0.20 0.32 -1.46 -2.70 -1.03 -0.86 -3.02 -2.95 -3.26In percent of GDP
Excluding official transfers . . . . . . . . . . . . . . . -6.92 -3.05 -2.27 -6.10 -5.34 -5.01Including official transfers 1.70 4.04 0.60 0.84 -3.41 -6.11 -2.27 -1.62 -5.55 -4.60 -4.40
Sources: Philippine authorities; IMF staff estimates; and IMF, World Economic Outlook (October 1997).
©International Monetary Fund. Not for Redistribution
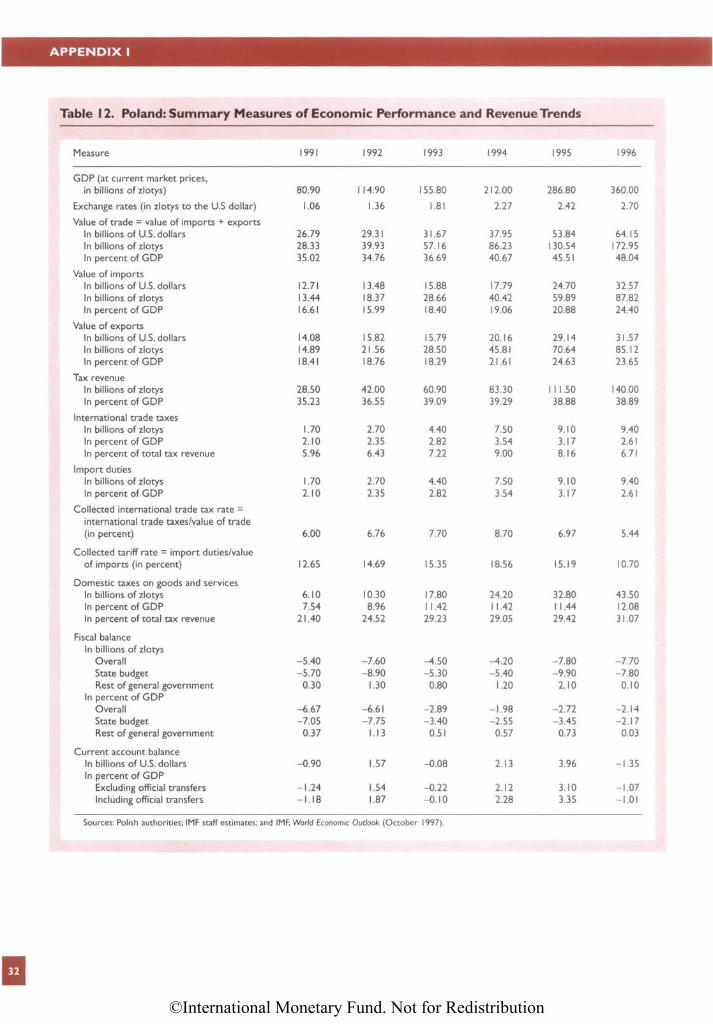
APPENDIX 1
Table 12. Poland: Summary Measures of Economic Performance and Revenue Trends
Measure 1991 1992 1993 1994 1995 1996
GDP (at current market prices,in billions of zlotys) 80.90 114.90 155.80 212.00 286.80 360.00
Exchange rates (in zlotys to the U.S dollar) 1.06 1.36 1.81 2.27 2.42 2.70
Value of trade = value of imports + exportsIn billions of U.S. dollars 26.79 29.31 31.67 37.95 53.84 64.15In billions of zlotys 28.33 39.93 57.16 86.23 130.54 172.95In percent of GDP 35.02 34.76 36.69 40.67 45.51 48.04
Value of importsIn billions of U.S. dollars 12.71 13.48 15.88 17.79 24.70 32.57In billions of zlotys 13.44 18.37 28.66 40.42 59.89 87.82In percent of GDP 16.61 15.99 18.40 19.06 20.88 24.40
Value of exportsIn billions of U.S. dollars 14.08 15.82 15.79 20.16 29.14 31.57In billions of zlotys 14.89 21.56 28.50 45.81 70.64 85.12In percent of GDP 18.41 18.76 18.29 21.61 24.63 23.65
Tax revenueIn billions of zlotys 28.50 42.00 60.90 83.30 111.50 140.00In percent of GDP 35.23 36.55 39.09 39.29 38.88 38.89
International trade taxesIn billions of zlotys 1.70 2.70 4.40 7.50 9.10 9.40In percent of GDP 2.10 2.35 2.82 3.54 3.17 2.61In percent of total tax revenue 5.96 6.43 7.22 9.00 8.16 6.71
Import dutiesIn billions of zlotys 1.70 2.70 4.40 7.50 9.10 9.40In percent of GDP 2.10 2.35 2.82 3.54 3.17 2.61
Collected international trade tax rate =international trade taxes/value of trade(in percent) 6.00 6.76 7.70 8.70 6.97 5.44
Collected tariff rate = import duties/valueof imports (in percent) 12.65 14.69 15.35 18.56 15.19 10.70
Domestic taxes on goods and servicesIn billions of zlotys 6.10 10.30 17.80 24.20 32.80 43.50In percent of GDP 7.54 8.96 11.42 11.42 11.44 12.08In percent of total tax revenue 21.40 24.52 29.23 29.05 29.42 31.07
Fiscal balanceIn billions of zlotys
Overall -5.40 -7.60 -4.50 -4.20 -7.80 -7.70State budget -5.70 -8.90 -5.30 -5.40 -9.90 -7.80Rest of general government 0.30 1.30 0.80 1.20 2.10 0.10
In percent of GDPOverall -6.67 -6.61 -2.89 -1.98 -2.72 -2.14State budget -7.05 -7.75 -3.40 -2.55 -3.45 -2.17Rest of general government 0.37 1.13 0.51 0.57 0.73 0.03
Current account balanceIn billions of U.S. dollars -0.90 1.57 -0.08 2.13 3.96 -1.35In percent of GDP
Excluding official transfers -1.24 1.54 -0.22 2.12 3.10 -1.07Including official transfers -1.18 1.87 -0.10 2.28 3.35 -1.01
Sources: Polish authorities; IMF staff estimates; and IMF, World Economic Outlook (Octobe
32
©International Monetary Fund. Not for Redistribution
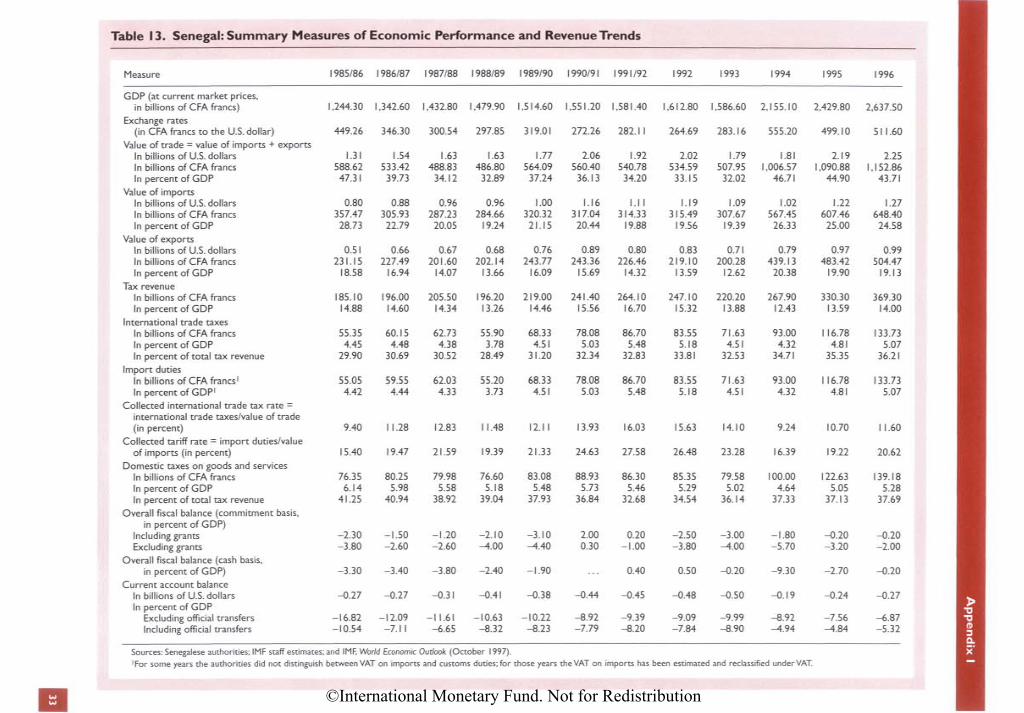
Table 13. Senegal: Summary Measures of Economic Performance and Revenue Trends
Measure 1985/86 1986/87 1987/88 1988/89 1989/90 1990/91 1991/92 1992 1993 1994 1995 1996
GDP (at current market prices,in billions of CFA francs) 1,244.30 1,342.60 1,432.80 1,479.90 1,514.60 1,551.20 1,581.40 1,612.80 1,586.60 2,155.10 2,429.80 2,637.50
Exchange rates(in CFA francs to the U.S. dollar) 449.26 346.30 300.54 297.85 319.01 272.26 282.11 264.69 283.16 555.20 499.10 511.60
Value of trade = value of imports + exportsIn billions of U.S. dollars 1.31 1.54 1.63 1.63 1.77 2.06 1.92 2.02 1.79 1.81 2.19 2.25In billions of CFA francs 588.62 533.42 488.83 486.80 564.09 560.40 540.78 534.59 507.95 1,006.57 1,090.88 1,152.86In percent of GDP 47.31 39.73 34.12 32.89 37.24 36.13 34.20 33.15 32.02 46.71 44.90 43.71
Value of importsIn billions of U.S. dollars 0.80 0.88 0.96 0.96 1.00 1.16 I.I I 1.19 1.09 1.02 1.22 1.27In billions of CFA francs 357.47 305.93 287.23 284.66 320.32 317.04 314.33 315.49 307.67 567.45 607.46 648.40In percent of GDP 28.73 22.79 20.05 19.24 21.15 20.44 19.88 19.56 19.39 26.33 25.00 24.58
Value of exportsIn billions of U.S. dollars 0.51 0.66 0.67 0.68 0.76 0.89 0.80 0.83 0.71 0.79 0.97 0.99In billions of CFA francs 231.15 227.49 201.60 202.14 243.77 243.36 226.46 219.10 200.28 439.13 483.42 504.47In percent of GDP 18.58 16.94 14.07 13.66 16.09 15.69 14.32 13.59 12.62 20.38 19.90 19.13
Tax revenueIn billions of CFA francs 185.10 196.00 205.50 196.20 219.00 241.40 264.10 247.10 220.20 267.90 330.30 369.30In percent of GDP 14.88 14.60 14.34 13.26 14.46 15.56 16.70 15.32 13.88 12.43 13.59 14.00
International trade taxesIn billions of CFA francs 55.35 60.15 62.73 55.90 68.33 78.08 86.70 83.55 71.63 93.00 116.78 133.73In percent of GDP 4.45 4.48 4.38 3.78 4.51 5.03 5.48 5.18 4.51 4.32 4.81 5.07In percent of total tax revenue 29.90 30.69 30.52 28.49 31.20 32.34 32.83 33.81 32.53 34.71 35.35 36.21
Import dutiesIn billions of CFA francs' 55.05 59.55 62.03 55.20 68.33 78.08 86.70 83.55 71.63 93.00 116.78 133.73In percent of GDP1 4.42 4.44 4.33 3.73 4.51 5.03 5.48 5.18 4.51 4.32 4.81 5.07
Collected international trade tax rate =international trade taxes/value of trade(in percent) 9.40 11.28 12.83 11.48 12.11 13.93 16.03 15.63 14.10 9.24 10.70 11.60
Collected tariff rate = import duties/valueof imports (in percent) 15.40 19.47 21.59 19.39 21.33 24.63 27.58 26.48 23.28 16.39 19.22 20.62
Domestic taxes on goods and servicesIn billions of CFA francs 76.35 80.25 79.98 76.60 83.08 88.93 86.30 85.35 79.58 100.00 122.63 139.18In percent of GDP 6.14 5.98 5.58 5.18 5.48 5.73 5.46 5.29 5.02 4.64 5.05 5.28In percent of total tax revenue 41.25 40.94 38.92 39.04 37.93 36.84 32.68 34.54 36.14 37.33 37.13 37.69
Overall fiscal balance (commitment basis,in percent of GDP)
Including grants -2.30 -1.50 -1.20 -2.10 -3.10 2.00 0.20 -2.50 -3.00 -1.80 -0.20 -0.20Excluding grants -3.80 -2.60 -2.60 -4.00 -4.40 0.30 -1.00 -3.80 -4.00 -5.70 -3.20 -2.00
Overall fiscal balance (cash basis,in percent of GDP) -3.30 -3.40 -3.80 -2.40 -1.90 . . . 0.40 0.50 -0.20 -9.30 -2.70 -0.20
Current account balanceIn billions of U.S. dollars -0.27 -0.27 -0.31 -0.41 -0.38 -0.44 -0.45 -0.48 -0.50 -0.19 -0.24 -0.27In percent of GDP
Excluding official transfers -16.82 -12.09 -11.61 -10.63 -10.22 -8.92 -9.39 -9.09 -9.99 -8.92 -7.56 -6.87Including official transfers -10.54 -7.11 -6.65 -8.32 -8.23 -7.79 -8.20 -7.84 -8.90 -4.94 -4.84 -5.32
Sources: Senegalese authorities; IMF staff estimates; and IMF, World Economic Outlook (October 1997).'For some years the authorities did not distinguish between VAT on imports and customs duties; for those years the VAT on imports has been estimated and reclassified under VAT.
©International Monetary Fund. Not for Redistribution
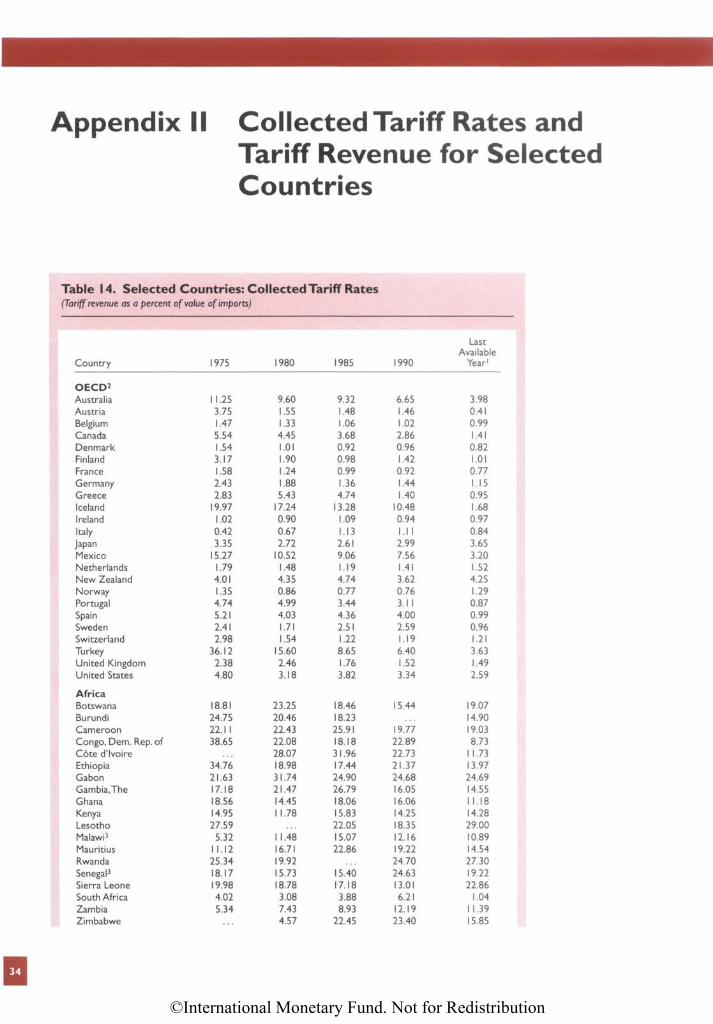
Appendix 11 Collected Tariff Rates andTariff Revenue for SelectedCountries
Table 14. Selected Countries: Collected Tariff Rates(Tariff revenue as a percent of value of imports)
LastAvailable
Country 1975 1980 1985 1990 Year1
OECD2
Australia 11.25 9.60 9.32 6.65 3.98Austria 3.75 1.55 1.48 1.46 0.41Belgium 1.47 1.33 1.06 1.02 0.99Canada 5.54 4.45 3.68 2.86 1.41Denmark 1.54 1.01 0.92 0.96 0.82Finland 3.17 1.90 0.98 1.42 1.01France 1.58 1.24 0.99 0.92 0.77Germany 2.43 1.88 1.36 1.44 1.15Greece 2.83 5.43 4.74 1.40 0.95Iceland 19.97 17.24 13.28 10.48 1.68Ireland 1.02 0.90 1.09 0.94 0.97Italy 0.42 0.67 1.13 1.11 0.84Japan 3.35 2.72 2.61 2.99 3.65Mexico 15.27 10.52 9.06 7.56 3.20Netherlands 1.79 1.48 1.19 1.41 1.52New Zealand 4.01 4.35 4.74 3.62 4.25Norway 1.35 0.86 0.77 0.76 1.29Portugal 4.74 4.99 3.44 3.11 0.87Spain 5.21 4.03 4.36 4.00 0.99Sweden 2.41 1.71 2.51 2.59 0.96Switzerland 2.98 1.54 1.22 1.19 1.21Turkey 36.12 15.60 8.65 6.40 3.63United Kingdom 2.38 2.46 1.76 1.52 1.49United States 4.80 3.18 3.82 3.34 2.59
AfricaBotswana 18.81 23.25 18.46 15.44 19.07Burundi 24.75 20.46 18.23 . . . 14.90Cameroon 22.11 22.43 25.91 19.77 19.03Congo, Dem. Rep. of 38.65 22.08 18.18 22.89 8.73Coted'lvoire . . . 28.07 31.96 22.73 11.73Ethiopia 34.76 18.98 17.44 21.37 13.97Gabon 21.63 31.74 24.90 24.68 24.69Gambia,The 17.18 21.47 26.79 16.05 14.55Ghana 18.56 14.45 18.06 16.06 11.18Kenya 14.95 11.78 15.83 14.25 14.28Lesotho 27.59 . . . 22.05 18.35 29.00Malawi3 5.32 11.48 15.07 12.16 10.89Mauritius 11.12 16.71 22.86 19.22 14.54Rwanda 25.34 19.92 . . . 24.70 27.30Senegal3 18.17 15.73 15.40 24.63 19.22Sierra Leone 19.98 18.78 17.18 13.01 22.86South Africa 4.02 3.08 3.88 6.21 1.04Zambia 5.34 7.43 8.93 12.19 11.39Zimbabwe . . . 4.57 22.45 23.40 15.85
34
©International Monetary Fund. Not for Redistribution
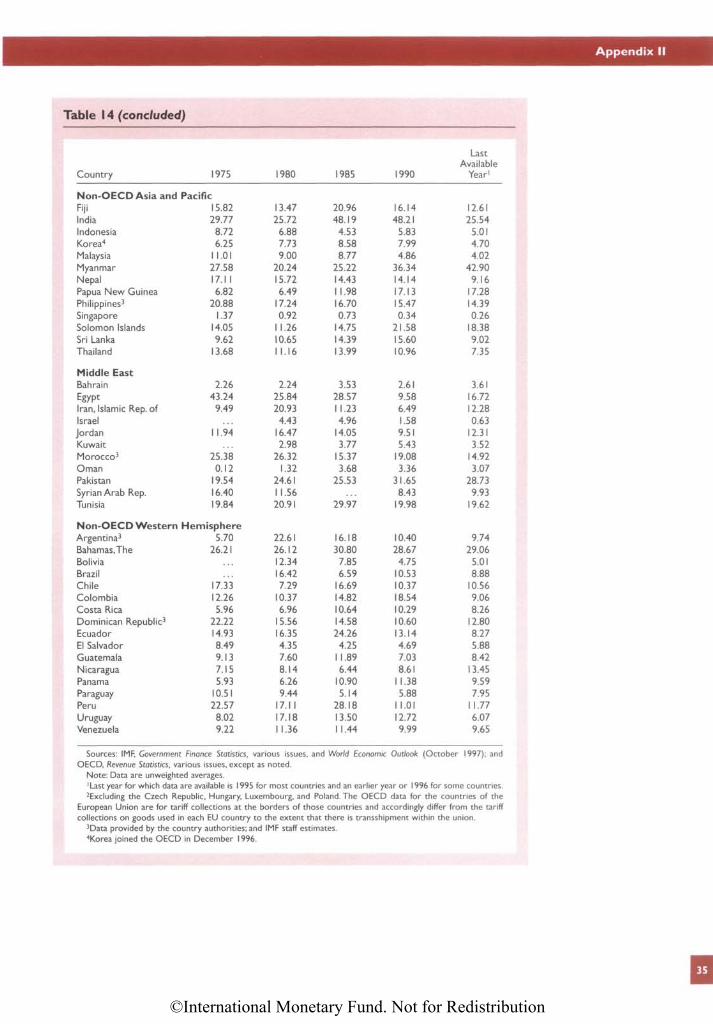
Appendix II
Table 14 (concluded)
LastAvailable
Country 1975 1980 1985 1990 Year'
Non-OECD Asia and PacificFiji 15.82 13.47 20.96 16.14 12.61India 29.77 25.72 48.19 48.21 25.54Indonesia 8.72 6.88 4.53 5.83 5.01Korea4 6.25 7.73 8.58 7.99 4.70Malaysia 11.01 9.00 8.77 4.86 4.02Myanmar 27.58 20.24 25.22 36.34 42.90Nepal 17.11 15.72 14.43 14.14 9.16Papua New Guinea 6.82 6.49 11.98 17.13 17.28Philippines3 20.88 17.24 16.70 15.47 14.39Singapore 1.37 0.92 0.73 0.34 0.26Solomon Islands 14.05 11.26 14.75 21.58 18.38Sri Lanka 9.62 10.65 14.39 15.60 9.02Thailand 13.68 11.16 13.99 10.96 7.35
Middle EastBahrain 2.26 2.24 3.53 2.61 3.61Egypt 43.24 25.84 28.57 9.58 16.72Iran, Islamic Rep. of 9.49 20.93 11.23 6.49 12.28Israel . . . 4.43 4.96 1.58 0.63Jordan 11.94 16.47 14.05 9.51 12.31Kuwait . . . 2.98 3.77 5.43 3.52Morocco3 25.38 26.32 15.37 19.08 14.92Oman 0.12 1.32 3.68 3.36 3.07Pakistan 19.54 24.61 25.53 31.65 28.73Syrian Arab Rep. 16.40 11.56 . . . 8.43 9.93Tunisia 19.84 20.91 29.97 19.98 19.62
Non-OECD Western HemisphereArgentina3 5.70 22.61 16.18 10.40 9.74Bahamas,The 26.21 26.12 30.80 28.67 29.06Bolivia . . . 12.34 7.85 4.75 5.01Brazil . . . 16.42 6.59 10.53 8.88Chile 17.33 7.29 16.69 10.37 10.56Colombia 12.26 10.37 14.82 18.54 9.06Costa Rica 5.96 6.96 10.64 10.29 8.26Dominican Republic3 22.22 15.56 14.58 10.60 12.80Ecuador 14.93 16.35 24.26 13.14 8.27El Salvador 8.49 4.35 4.25 4.69 5.88Guatemala 9.13 7.60 11.89 7.03 8.42Nicaragua 7.15 8.14 6.44 8.61 13.45Panama 5.93 6.26 10.90 11.38 9.59Paraguay 10.51 9.44 5.14 5.88 7.95Peru 22.57 17.11 28.18 11.01 11.77Uruguay 8.02 17.18 13.50 12.72 6.07Venezuela 9.22 11.36 11.44 9.99 9.65
Sources: IMF, Government Finance Statistics, various issues, and World Economic Outlook (October 1997); andOECD, Revenue Statistics, various issues, except as noted.
Note: Data are unweighted averages.1Last year for which data are available is 1995 for most countries and an earlier year or 1996 for some countries.Excluding the Czech Republic, Hungary, Luxembourg, and Poland. The OECD data for the countries of the
European Union are for tariff collections at the borders of those countries and accordingly differ from the tariffcollections on goods used in each EU country to the extent that there is transshipment within the union.
3Data provided by the country authorities; and IMF staff estimates.4Korea joined the OECD in December 1996.
35
©International Monetary Fund. Not for Redistribution
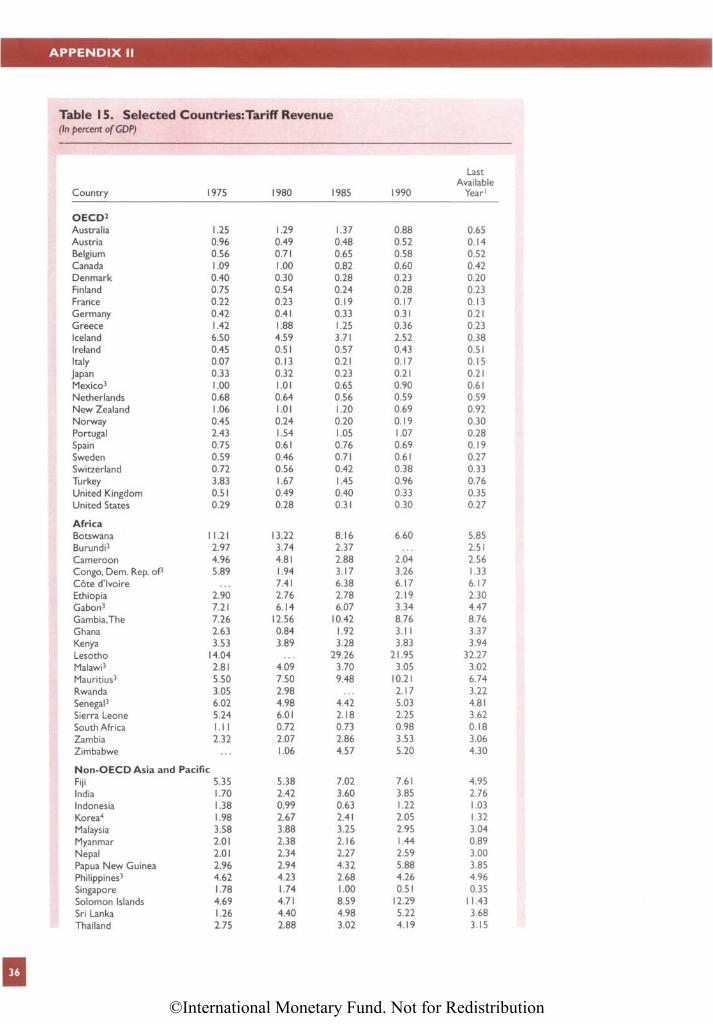
APPENDIX II
Table 15. Selected Countries:Tariff Revenue(In percent of GDP)
LastAvailable
Country 1975 1980 1985 1990 Year1
OECD2
Australia 1.25 1.29 1.37 0.88 0.65Austria 0.96 0.49 0.48 0.52 0.14Belgium 0.56 0.71 0.65 0.58 0.52Canada 1.09 1.00 0.82 0.60 0.42Denmark 0.40 0.30 0.28 0.23 0.20Finland 0.75 0.54 0.24 0.28 0.23France 0.22 0.23 0.19 0.17 0.13Germany 0.42 0.41 0.33 0.31 0.21Greece 1.42 1.88 1.25 0.36 0.23Iceland 6.50 4.59 3.71 2.52 0.38Ireland 0.45 0.51 0.57 0.43 0.51Italy 0.07 0.13 0.21 0.17 0.15Japan 0.33 0.32 0.23 0.21 0.21Mexico3 1.00 1.01 0.65 0.90 0.61Netherlands 0.68 0.64 0.56 0.59 0.59New Zealand 1.06 1.01 1.20 0.69 0.92Norway 0.45 0.24 0.20 0.19 0.30Portugal 2.43 1.54 1.05 1.07 0.28Spain 0.75 0.61 0.76 0.69 0.19Sweden 0.59 0.46 0.71 0.61 0.27Switzerland 0.72 0.56 0.42 0.38 0.33Turkey 3.83 1.67 1.45 0.96 0.76United Kingdom 0.51 0.49 0.40 0.33 0.35United States 0.29 0.28 0.31 0.30 0.27
AfricaBotswana 11.21 13.22 8.16 6.60 5.85Burundi3 2.97 3.74 2.37 . . . 2.51Cameroon 4.96 4.81 2.88 2.04 2.56Congo, Dem. Rep. of3 5.89 1.94 3.17 3.26 1.33Coted'lvoire . . . 7.41 6.38 6.17 6.17Ethiopia 2.90 2.76 2.78 2.19 2.30Gabon3 7.21 6.14 6.07 3.34 4.47Gambia,The 7.26 12.56 10.42 8.76 8.76Ghana 2.63 0.84 1.92 3.11 3.37Kenya 3.53 3.89 3.28 3.83 3.94Lesotho 14.04 . . . 29.26 21.95 32.27Malawi3 2.81 4.09 3.70 3.05 3.02Mauritius3 5.50 7.50 9.48 10.21 6.74Rwanda 3.05 2.98 . . . 2.17 3.22Senegal3 6.02 4.98 4.42 5.03 4.81Sierra Leone 5.24 6.01 2.18 2.25 3.62South Africa 1.11 0.72 0.73 0.98 0.18Zambia 2.32 2.07 2.86 3.53 3.06Zimbabwe . . . 1.06 4.57 5.20 4.30
Non-OECD Asia and PacificFiji 5.35 5.38 7.02 7.61 4.95India 1.70 2.42 3.60 3.85 2.76Indonesia 1.38 0.99 0.63 1.22 1.03Korea4 1.98 2.67 2.41 2.05 1.32Malaysia 3.58 3.88 3.25 2.95 3.04Myanmar 2.01 2.38 2.16 1.44 0.89Nepal 2.01 2.34 2.27 2.59 3.00Papua New Guinea 2.96 2.94 4.32 5.88 3.85Philippines3 4.62 4.23 2.68 4.26 4.96Singapore 1.78 1.74 1.00 0.51 0.35Solomon Islands 4.69 4.71 8.59 12.29 11.43Sri Lanka 1.26 4.40 4.98 5.22 3.68Thailand 2.75 2.88 3.02 4.19 3.15
36
©International Monetary Fund. Not for Redistribution
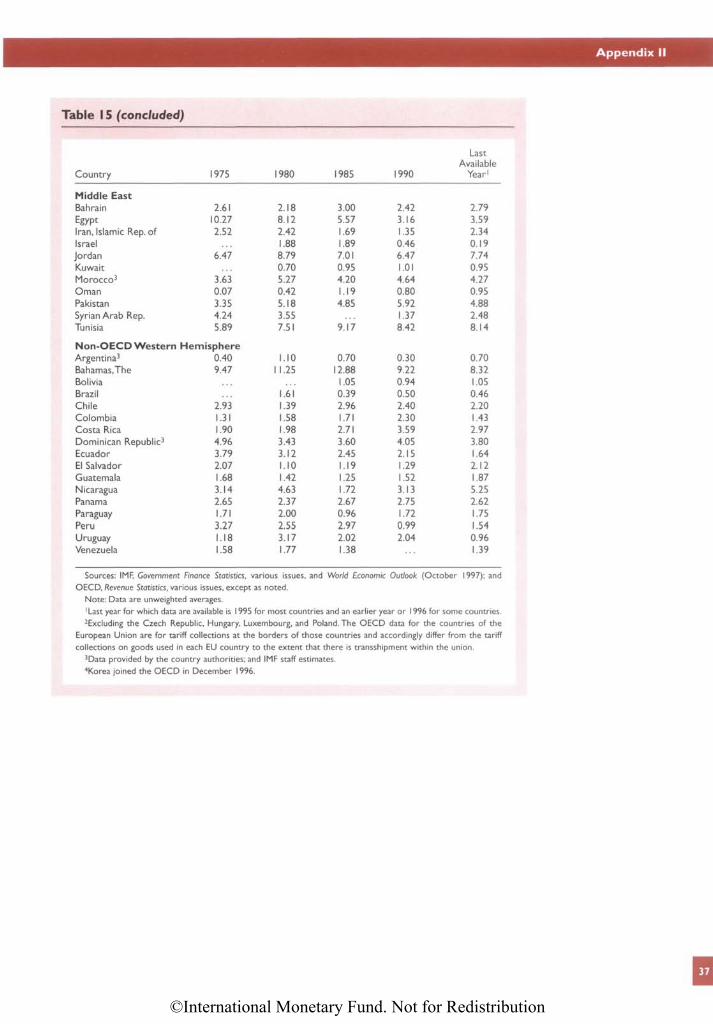
Appendix II
Table 15 (concluded)
LastAvailable
Country 1975 1980 1985 1990 Year1
Middle EastBahrain 2.61 2.18 3.00 2.42 2.79
Egypt 10.27 8.12 5.57 3.16 3.59
Iran, Islamic Rep. of 2.52 2.42 1.69 1.35 2.34
Israel . . . 1.88 1.89 0.46 0.19
Jordan 6.47 8.79 7.01 6.47 7.74
Kuwait . . . 0.70 0.95 1.01 0.95
Morocco3 3.63 5.27 4.20 4.64 4.27
Oman 0.07 0.42 1.19 0.80 0.95
Pakistan 3.35 5.18 4.85 5.92 4.88
Syrian Arab Rep. 4.24 3.55 . . . 1.37 2.48
Tunisia 5.89 7.51 9.17 8.42 8.14
Non-OECD Western HemisphereArgentina3 0.40 1.10 0.70 0.30 0.70
Bahamas.The 9.47 11.25 12.88 9.22 8.32
Bolivia . . . . . . 1.05 0.94 1.05
Brazil . . . 1.61 0.39 0.50 0.46
Chile 2.93 1.39 2.96 2.40 2.20
Colombia 1.31 1.58 1.71 2.30 1.43
Costa Rica 1.90 1.98 2.71 3.59 2.97
Dominican Republic3 4.96 3.43 3.60 4.05 3.80
Ecuador 3.79 3.12 2.45 2.15 1.64
El Salvador 2.07 1.10 1.19 1.29 2.12
Guatemala 1.68 1.42 1.25 1.52 1.87
Nicaragua 3.14 4.63 1.72 3.13 5.25
Panama 2.65 2.37 2.67 2.75 2.62
Paraguay 1.71 2.00 0.96 1.72 1.75
Peru 3.27 2.55 2.97 0.99 1.54
Uruguay 1.18 3.17 2.02 2.04 0.96
Venezuela 1.58 1.77 1.38 . . . 1.39
Sources: IMF, Government Finance Statistics, various issues, and World Economic Outlook (October 1997); and
OECD, Revenue Statistics, various issues, except as note
Note: Data are unweighted averages.
1Last year for which data are available is 1995 for most countries and an earlier year or 1996 for some countries.
2Excluding the Czech Republic, Hungary, Luxembourg, and Poland. The OECD data for the countries of the
European Union are for tariff collections at the borders of those countries and accordingly differ from the tariff
collections on goods used in each EL) country to the extent that there is transshipment within the union.3Data provided by the country authorities; and IMF staff estimates.4Korea joined the OECD in December 1996.
37
©International Monetary Fund. Not for Redistribution
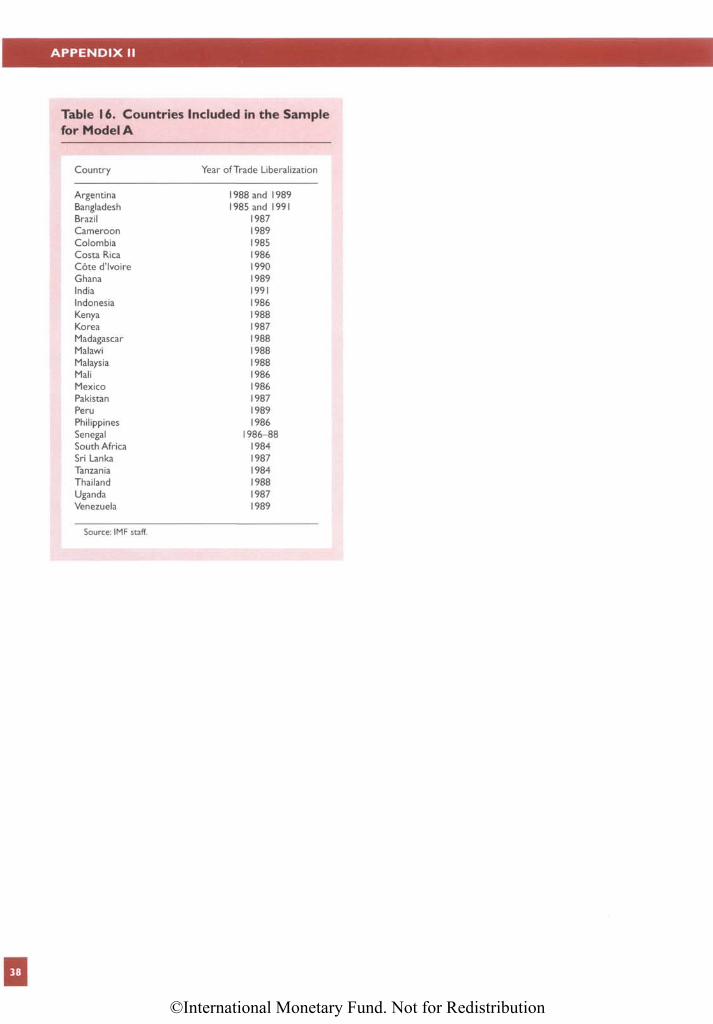
APPENDIX II
Table 16. Countries Included in the Samplefor Model A
Country Year of Trade Liberalization
Argentina 1988 and 1989Bangladesh 1985 and 1991Brazil 1987Cameroon 1989Colombia 1985Costa Rica 1986Cote d'lvoire 1990Ghana 1989India 1991Indonesia 1986Kenya 1988Korea 1987Madagascar 1988Malawi 1988Malaysia 1988Mali 1986Mexico 1986Pakistan 1987Peru 1989Philippines 1986Senegal 1986-88South Africa 1984Sri Lanka 1987Tanzania 1984Thailand 1988Uganda 1987Venezuela 1989
Source: IMF staff.
38
©International Monetary Fund. Not for Redistribution
References
Abed, George T., 1998, "Trade Liberalization and Tax Re-form in the Southern Mediterranean Region," IMFWorking Paper 98/49 (Washington: Fiscal Affairs De-partment, International Monetary Fund).
, and others, 1998, Fiscal Reforms in Low-IncomeCountries: Experience Under Fund-Supported Pro-grams, IMF Occasional Paper No. 160 (Washington:International Monetary Fund).
Anderson, James E., and J. Peter Neary, 1994, "Measuringthe Restrictiveness of Trade Policy," World BankEconomic Review, Vol. 8 (May), pp. 151-69.
Bevan, David, 1995, "Fiscal Implications of Trade Liber-alization," IMF Working Paper 95/50 (Washington:Research Department, International Monetary Fund).
Bhagwati, Jagdish, and Arvind Panagariya, 1996, TheEconomics of Preferential Trade Agreements (Wash-ington: AEI Press).
Blejer, Mario, and Adrienne Cheasty, 1990, "Fiscal Impli-cations of Trade Liberalization," in Fiscal Policy inOpen Developing Economies, ed. by Vito Tanzi(Washington: International Monetary Fund), pp.66-81.
Blinder, Alan S., 1981, "Thoughts on the Laffer Curve," inThe Supply-Side Effects of Economic Policy, ed. byL.H. Meyer (Boston: Kluwer-Nijhoff Publishing).
Chowdhury, Abdur R., 1993, "Fiscal Dependence onTrade Taxes and the Level of Economic Develop-ment: A Comment," Applied Economics, Vol. 25, pp.1393-97.
Clarida, Richard H., 1996, "Consumption, Import Prices,and the Demand for Imported Consumer Durables: AStructural Econometric Investigation," Review ofEconomics and Statistics, Vol. 78, pp. 369-74.
Clement, Jean A.R, Johannes Mueller, Stephane Cosse,and Jean LeDem, 1996, Aftermath of the CFA FrancDevaluation, IMF Occasional Paper No. 138(Washington: International Monetary Fund).
Cole, Ismail M., 1992, "Fiscal Dependence on TradeTaxes and Economic Development: Additional Re-sults and a Reconciliation of the Empirical Evi-dence," Applied Economics, Vol. 24, pp. 1321-25.
, 1993, "Fiscal Dependence on Trade Taxes and theLevel of Economic Development: A Reply," AppliedEconomics, Vol. 25, pp. 1398-1400.
Datta-Mitra, Jayati, 1997, Fiscal Management in Adjust-ment Lending (Washington: World Bank).
Dean, Judith M., Seema Desai, and James Riedel, 1994,"Trade Policy Reform in Developing Countries Since
1985: A Review of the Evidence," World Bank Dis-cussion Papers No. 267 (Washington: World Bank).
Dixit, Avinash, 1985, "Tax Policy in Open Economies," inHandbook of Public Economics, Vol. 1, ed. by Alan J.Auerbach and Martin Feldstein (Amsterdam: North-Holland), pp. 313-74.
, and Victor D. Norman, 1980, Theory of Interna-tional Trade: A Dual, General Equilibrium Approach(Cambridge: Cambridge University Press).
Ebrill, Liam P., and Janet G. Stotsky, 1998, "The RevenueImplications of Trade Liberalization," in Trade Re-form and Regional Integration in Africa, ed. byZubair Iqbal and Mohsin S. Khan (Washington: Inter-national Monetary Fund).
Escolano, Julio, 1995, "International Trade Taxes," in TaxPolicy Handbook, ed. by Parthasarathi Shome (Wash-ington: International Monetary Fund), pp. 199-215.
Farhadian-Lorie, Ziba, and Menachem Katz, 1988, "FiscalDimensions of Trade Policy," IMF Working Paper88/44 (Washington: Fiscal Affairs Department, Inter-national Monetary Fund).
Feltenstein, Andrew, 1992, "Tax Policy and Trade Liberal-ization: An Application to Mexico," IMF WorkingPaper 92/108 (Washington: Fiscal Affairs Depart-ment, International Monetary Fund).
Foroutan, Faezeh, 1993, "Regional Integration in Sub-Saharan Africa: Past Experience and Future Prospects,"Chapter 8 in New Dimensions in Regional Integra-tion, ed. by Jaime De Melo and Arvind Panagariya(Cambridge, England: Cambridge University Press),pp. 234-71.
Frenkel, Jacob A., and Assaf Razin, 1992, Fiscal Policiesand the World Economy (Cambridge, Massachusetts:MIT Press).
Gemmell, Norman, 1993, "Fiscal Dependence on TradeTaxes and Economic Development: Some New Evi-dence," Scottish Journal of Political Economy, Vol.40, pp. 56-68.
Goldstein, Morris, and Mohsin Khan, 1985, "Income andPrice Effects in Foreign Trade," in Handbook of In-ternational Economics, ed. by Ronald W. Jones andPeter B. Kenen (Amsterdam: North-Holland), pp.1042-99.
Greenaway, David, 1984, "A Statistical Analysis of FiscalDependence on Trade Taxes and Economic Develop-ment," Public Finance, Vol. 39, pp. 70-89.
, and David Sapsford, 1987, "Further EconometricAnalysis of the Relationship between Fiscal Depen-
39
©International Monetary Fund. Not for Redistribution
REFERENCES
dence on Trade Taxes and Economic Development,"Public Finance, Vol. 42, pp. 309-19.
Greenaway, David, and Chris Milner, 1991, "Fiscal De-pendence on Trade Taxes and Trade Policy Reform,"Journal of Development Studies, Vol. 27, pp. 95-132.
Harmsen, Richard, and Michael Leidy, 1994, "RegionalTrading Arrangements," in International Trade Poli-cies: The Uruguay Round and Beyond, Vol. II. Back-ground Papers (Washington: International MonetaryFund), pp. 88-130.
Helpman, Elhanan, and Paul Krugman, 1989, Trade Pol-icy and Market Structure (Cambridge, Massachusetts:MIT Press).
Hitiris, Theo, 1990, "Trade Structure, Trade Taxes, andEconomic Development: An Empirical Investiga-tion," in Fiscal Policy in Open DevelopingEconomies, ed. by Vito Tanzi (Washington:International Monetary Fund), pp. 29-41.
, and A.J. Weekes, 1987, "Fiscal Dependence onTrade Taxes and Economic Development: An Econo-metric Investigation," Public Finance, Vol. 42, pp.297-308.
International Monetary Fund, 1998, Trade Liberalizationin IMF-Supported Programs, prepared by a staff teamled by R. Sharer (Washington: International MonetaryFund).
Krueger, Anne O., 1995, Trade Policies and DevelopingNations (Washington: Brookings Institution).
Mihaljek, Dubravko, 1992, "Tariffs, Optimal Taxes, andCollection Costs," IMF Working Paper 92/28 (Wash-ington: European I Department, International Mone-tary Fund).
Mitra, Pradeep, 1992, "Coordinated Reform of Tariffs andIndirect Taxes," World Bank Research Observer, Vol.7, pp. 195-218.
Papageorgiou, Demetrios, Armeane M. Choksi, andMichael Michaely, 1990, Liberalizing Foreign Tradein Developing Countries: The Lessons of Experience(Washington: World Bank).
Pritchett, Lant, and Geeta Sethi, 1994, "Tariff Rates, TariffRevenue, and Tariff Reform: Some New Facts,"World Bank Economic Review, Vol. 8, pp. 1-16.
Rajaram, Anand, 1994, "Tariff and Tax Reforms—DoWorld Bank Recommendations Integrate Revenue
and Protection Objectives?" Economic Studies Quar-terly, Vol. 45, pp. 321-38.
Ram, Rati, 1994, "Level of Economic Development andShare of Trade Taxes in Government Revenue: SomeEvidence from Individual-Country Time-SeriesData," Public Finance, Vol. 49, pp. 409-26.
Shome, Parthasarathi, ed., 1995, Tax Policy Handbook(Washington: International Monetary Fund).
Subramanian, Arvind, Ali Ibrahim, and Luis A. Torres-Castro, 1993, "Optimal Tariffs: Theory and Practice,"IMF Working Paper 93/50 (Washington: Policy De-velopment and Review Department, InternationalMonetary Fund).
Takacs, Wendy E., 1990, "Options for Dismantling TradeRestrictions in Developing Countries," World BankResearch Observer, Vol. 5, pp. 25-46.
Tanzi, Vito, 1987, "Quantitative Characteristics of the TaxSystems of Developing Countries," in The Theory ofTaxation for Developing Countries, ed. by DavidM.G. Newbery and Nicholas Herbert Stern (NewYork: Oxford University Press for the World Bank),pp. 205-41.
, 1989, "Impact of Macroeconomic Policies on theLevel of Taxation and the Fiscal Balance in Develop-ing Countries," Staff Papers, International MonetaryFund, Vol. 36 (September), pp. 633-56.
, 1994, "Customs Administration and the Econ-omy—Keeping Pace with Development" (unpub-lished; Washington: Fiscal Affairs Department, Inter-national Monetary Fund).
, and Parthasarathi Shome, 1993, "Primer on TaxEvasion," Staff Papers, International Monetary Fund,Vol. 40, pp. 807-28.
Thomas, Vinod, and John D. Nash, with Sebastian Ed-wards and others, 1991, Best Practices in Trade Pol-icy Reform (New York: Oxford University Press forthe World Bank).
Tokarick, Stephen, 1995, "External Shocks, the Real Ex-change Rate, and Tax Policy," Staff Papers, Interna-tional Monetary Fund, Vol. 42 (March), pp. 49-79.
Winer, Stanley L., and Walter Hettich, 1991, "Debt andTariffs: An Empirical Investigation of the Evolutionof Revenue Systems," Journal of Public Economics,Vol. 45, pp. 215-42.
40
©International Monetary Fund. Not for Redistribution
Occasional Papers
Recent Occasional Papers of the International Monetary Fund
180. Revenue Implications of Trade Liberalization, by Liam Ebrill, Janet Stotsky, and Reint Gropp. 1999
179. Disinflation in Transition: 1993-97, by Carlo Cottarelli and Peter Doyle. 1999.
178. IMF-Supported Programs in Indonesia, Korea, and Thailand: A Preliminary Assessment, by Timothy Lane,Atish Ghosh, Javier Hamann, Steven Phillips, Marianne Schulze-Ghattas, and Tsidi Tsikata. 1999.
177. Perspectives on Regional Unemployment in Europe, by Paolo Mauro, Esawar Prasad, and AntonioSpilimbergo. 1999.
176. Back to the Future: Postwar Reconstruction and Stabilization in Lebanon, edited by Sena Eken andThomas Helbling. 1999.
175. Macroeconomic Developments in the Baltics, Russia, and Other Countries of the Former Soviet Union,1992-97, by Luis M. Valdivieso. 1998.
174. Impact of EMU on Selected Non-European Union Countries, by R. Feldman, K. Nashashibi, R. Nord,P. Allum, D. Desruelle, K. Enders, R. Kahn, and H. Temprano-Arroyo. 1998.
173. The Baltic Countries: From Economic Stabilization to EU Accession, by Julian Berengaut, AugustoLopez-Claros, Franchise Le Gall, Dennis Jones, Richard Stern, Ann-Margret Westin, Effie Psalida,Pietro Garibaldi. 1998.
172. Capital Account Liberalization: Theoretical and Practical Aspects, by a staff team led by BarryEichengreen and Michael Mussa, with Giovanni Dell'Ariccia, Enrica Detragiache, Gian Maria Milesi-Ferretti, and Andrew Tweedie. 1998.
171. Monetary Policy in Dollarized Economies, by Tomas Balino, Adam Bennett, and Eduardo Borensztein.1998.
170. The West African Economic and Monetary Union: Recent Developments and Policy Issues, by a staffteam led by Ernesto Hernandez-Cata and comprising Christian A. Francois, Paul Masson, PascalBouvier, Patrick Peroz, Dominique Desruelle, and Athanasios Vamvakidis. 1998.
169. Financial Sector Development in Sub-Saharan African Countries, by Hassanali Mehran, Piero Ugolini,Jean Phillipe Briffaux, George Iden, Tonny Lybek, Stephen Swaray, and Peter Hayward. 1998.
168. Exit Strategies: Policy Options for Countries Seeking Greater Exchange Rate Flexibility, by a staff teamled by Barry Eichengreen and Paul Masson with Hugh Bredenkamp, Barry Johnston, Javier Hamann,Esteban Jadresic, and Inci Otker. 1998.
167. Exchange Rate Assessment: Extensions of the Macroeconomic Balance Approach, edited by Peter Isardand Hamid Faruqee. 1998
166. Hedge Funds and Financial Market Dynamics, by a staff team led by Barry Eichengreen and DonaldMathieson with Bankim Chadha, Anne Jansen, Laura Kodres, and Sunil Sharma. 1998.
165. Algeria: Stabilization and Transition to the Market, by Karim Nashashibi, Patricia Alonso-Gamo, StefaniaBazzoni, Alain Feler, Nicole Laframboise, and Sebastian Paris Horvitz. 1998.
164. MULTIMOD Mark III: The Core Dynamic and Steady-State Model, by Douglas Laxton, Peter Isard,Hamid Faruqee, Eswar Prasad, and Bart Turtelboom. 1998.
163. Egypt: Beyond Stabilization, Toward a Dynamic Market Economy, by a staff team led by Howard Handy.1998.
162. Fiscal Policy Rules, by George Kopits and Steven Symansky. 1998.
161. The Nordic Banking Crises: Pitfalls in Financial Liberalization? by Burkhard Dress and CeylaPazarba§ioglu. 1998.
160. Fiscal Reform in Low-Income Countries: Experience Under IMF-Supported Programs, by a staff team ledby George T. Abed and comprising Liam Ebrill, Sanjeev Gupta, Benedict Clements, Ronald McMorran,Anthony Pellechio, Jerald Schiff, and Marijn Verhoeven. 1998.
159. Hungary: Economic Policies for Sustainable Growth, Carlo Cottarelli, Thomas Krueger, RezaMoghadam, Perry Perone, Edgardo Ruggiero, and Rachel van Elkan. 1998.
41
©International Monetary Fund. Not for Redistribution

OCCASIONAL PAPERS
158. Transparency in Government Operations, by George Kopits and Jon Craig. 1998.
157. Central Bank Reforms in the Baltics, Russia, and the Other Countries of the Former Soviet Union, by astaff team led by Malcolm Knight and comprising Susana Almuina, John Dalton, Inci Otker, CeylaPazarba§ioglu, Arne B. Petersen, Peter Quirk, Nicholas M. Roberts, Gabriel Sensenbrenner, and JanWillem van der Vossen. 1997.
156. The ESAF at Ten Years: Economic Adjustment and Reform in Low-Income Countries, by the staff of theInternational Monetary Fund. 1997.
155. Fiscal Policy Issues During the Transition in Russia, by Augusto Lopez-Claros and Sergei V.Alexashenko. 1998.
154. Credibility Without Rules? Monetary Frameworks in the Post-Bretton Woods Era, by Carlo Cottarelli andCurzio Giannini. 1997.
153. Pension Regimes and Saving, by G.A. Mackenzie, Philip Gerson, and Alfredo Cuevas. 1997.
152. Hong Kong, China: Growth, Structural Change, and Economic Stability During the Transition, by JohnDodsworth and Dubravko Mihaljek. 1997.
151. Currency Board Arrangements: Issues and Experiences, by a staff team led by Tomas J.T. Balino andCharles Enoch. 1997.
150. Kuwait: From Reconstruction to Accumulation for Future Generations, by Nigel Andrew Chalk,Mohamed A. El-Erian, Susan J. Fennell, Alexei P. Kireyev, and John F. Wilson. 1997.
149. The Composition of Fiscal Adjustment and Growth: Lessons from Fiscal Reforms in Eight Economies,by G.A. Mackenzie, David W.H. Orsmond, and Philip R. Gerson. 1997.
148. Nigeria: Experience with Structural Adjustment, by Gary Moser, Scott Rogers, and Reinold van Til, withRobin Kibuka and Inutu Lukonga. 1997.
147. Aging Populations and Public Pension Schemes, by Sheetal K. Chand and Albert Jaeger. 1996.
146. Thailand: The Road to Sustained Growth, by Kalpana Kochhar, Louis Dicks-Mireaux, Balazs Horvath,Mauro Mecagni, Erik Offerdal, and Jianping Zhou. 1996.
145. Exchange Rate Movements and Their Impact on Trade and Investment in the APEC Region, by TakatoshiIto, Peter Isard, Steven Symansky, and Tamim Bayoumi. 1996.
144. National Bank of Poland: The Road to Indirect Instruments, by Piero Ugolini. 1996.
143. Adjustment for Growth: The African Experience, by Michael T. Hadjimichael, Michael Nowak, RobertSharer, and Amor Tahari. 1996.
142. Quasi-Fiscal Operations of Public Financial Institutions, by G.A. Mackenzie and Peter Stella. 1996.
141. Monetary and Exchange System Reforms in China: An Experiment in Gradualism, by Hassanali Mehran,Marc Quintyn, Tom Nordman, and Bernard Laurens. 1996.
140. Government Reform in New Zealand, by Graham C. Scott. 1996.
139. Reinvigorating Growth in Developing Countries: Lessons from Adjustment Policies in Eight Economies,by David Goldsbrough, Sharmini Coorey, Louis Dicks-Mireaux, Balazs Horvath, Kalpana Kochhar,Mauro Mecagni, Erik Offerdal, and Jianping Zhou. 1996.
138. Aftermath of the CFA Franc Devaluation, by Jean A.P. Clement, with Johannes Mueller, Stephane Cosse,and Jean Le Dem. 1996.
137. The Lao People's Democratic Republic: Systemic Transformation and Adjustment, edited by Ichiro Otaniand Chi Do Pham. 1996.
136. Jordan: Strategy for Adjustment and Growth, edited by Edouard Maciejewski and Ahsan Mansur. 1996.
135. Vietnam: Transition to a Market Economy, by John R. Dodsworth, Erich Spitaller, Michael Braulke,Keon Hyok Lee, Kenneth Miranda, Christian Mulder, Hisanobu Shishido, and Krishna Srinivasan.1996.
Note: For information on the title and availability of Occasional Papers not listed, please consult the IMF Publications Catalog or contact IMFPublication Services.
42
©International Monetary Fund. Not for Redistribution