Embed Size (px)
Citation preview
W E S T E R N E L E C T R I C I T Y C O O R D I N A T I N G C O U N C I L • W W W . W E C C . B I Z 1 5 5 N O R T H 4 0 0 W E S T • S U I T E 2 0 0 • S A L T L A K E C I T Y • U T A H • 8 4 1 0 3 - 1 1 1 4 • P H 8 0 1 . 5 8 2 . 0 3 5 3
Document name WECC Variable Generation Planning Reference Book
Category ( ) Regional Reliability Standard ( ) Regional Criteria ( ) Policy ( ) Guideline (x) Report or other ( ) Charter
Document date May 14, 2013 Adopted/approved by Variable Generation Subcommittee Date adopted/approved May 14, 2013 Custodian (entity responsible for maintenance and upkeep)
Stored/filed Physical location: Web URL:
Previous name/number (if any) Status ( ) in effect
( ) usable, minor formatting/editing required ( ) modification needed ( ) superseded by _____________________ ( ) other _____________________________ ( ) obsolete/archived)
May 14, 2013 2
W E S T E R N E L E C T R I C I T Y C O O R D I N A T I N G C O U N C I L • W W W . W E C C . B I Z 1 5 5 N O R T H 4 0 0 W E S T • S U I T E 2 0 0 • S A L T L A K E C I T Y • U T A H • 8 4 1 0 3 - 1 1 1 4 • P H 8 0 1 . 5 8 2 . 0 3 5 3
WECC Variable Generation Planning Reference Book
A Guidebook for Including Variable Generation in the
Planning Process
Volume 2: Appendices
Version 1
May 14, 2013

May 14, 2013 3
W E S T E R N E L E C T R I C I T Y C O O R D I N A T I N G C O U N C I L • W W W . W E C C . B I Z 1 5 5 N O R T H 4 0 0 W E S T • S U I T E 2 0 0 • S A L T L A K E C I T Y • U T A H • 8 4 1 0 3 - 1 1 1 4 • P H 8 0 1 . 5 8 2 . 0 3 5 3
May 14, 2013 4
W E S T E R N E L E C T R I C I T Y C O O R D I N A T I N G C O U N C I L • W W W . W E C C . B I Z 1 5 5 N O R T H 4 0 0 W E S T • S U I T E 2 0 0 • S A L T L A K E C I T Y • U T A H • 8 4 1 0 3 - 1 1 1 4 • P H 8 0 1 . 5 8 2 . 0 3 5 3
Project Lead Dr. Yuri V. Makarov, Chief Scientist – Power Systems, (Pacific Northwest National Laboratory (PNNL) Western Electricity Coordinating Council (WECC) Project Manager Matthew Hunsaker, Renewable Integration Manager Contributors Art Diaz-Gonzalez, Supervisory Power System Dispatcher, Western Area Power Administration (WAPA) Ross T. Guttromson, PE, MBA, Manager Energy Storage, Sandia National Laboratory Dr. Pengwei Du, Research Engineer, PNNL Dr. Pavel V. Etingov, Senior Research Engineer, PNNL Dr. Hassan Ghoudjehbaklou, Senior Transmission Planner, San Diego Gas & Electric (SDG&E) Dr. Jian Ma, PE, PMP, Research Engineer, PNNL David Tovar, Principal Electrical Systems Engineer, El Paso Electric Company Dr. Vilayanur V. Viswanathan, PNNL Dr. Bharat Vyakaranam, PNNL WECC Member Reviewers Variable Generation Subcommittee Members Antonio Alvarez, Manager IRP, Pacific Gas and Electric (PG&E) Steve Enyeart, Customer Service Engineering, Bonneville Power Administration (BPA) Yi Zhang, California Independent System Operator (ISO) PNNL Peer Reviewers and Content Advisors Dr. Krishnappa Subbarao, Senior Research Engineer Dr. Pavel V. Etingov, Senior Research Engineer Dr. Landis Kannberg, Manager, Energy Storage and Renewables Integration Dr. Ning Lu, Senior Research Engineer, previous PNNL employee Dr. Ronald Melton, Senior Staff Engineer Acknowledgements U.S. Department of Energy (DOE) Office of Electricity Delivery and Energy Reliability WECC Variable Generation Subcommittee (VGS) Members Ravi Aggarwal, BPA Gil Bindewald, DOE Linda Brown, SDG&E Carl Imhoff, Business Line Manager, PNNL Dale King, Product Line Manager, PNNL Dmitry Kosterev, BPA Mariam Mirzadeh, SDG&E Bradley Nickell, Director of Transmission Planning, Western Electricity Coordinating Council (WECC) Robert Sparks, Manager, Grid Planning South, California ISO
May 14, 2013 5
W E S T E R N E L E C T R I C I T Y C O O R D I N A T I N G C O U N C I L • W W W . W E C C . B I Z 1 5 5 N O R T H 4 0 0 W E S T • S U I T E 2 0 0 • S A L T L A K E C I T Y • U T A H • 8 4 1 0 3 - 1 1 1 4 • P H 8 0 1 . 5 8 2 . 0 3 5 3
Table of Contents Appendix 1: Glossary ................................................................................................... 11 Appendix 2: Recent Approaches to the Probabilistic Load Flow Problems .................. 56 Appendix 3: Additional Useful Frequently-Used Probabilistic Reliability Indices .......... 60
3.1 Severity Risk Indices (SRI) ............................................................................. 60 3.2 Risk Indices ..................................................................................................... 60
Appendix 4: High-impact Low-frequency (HILF) Events ............................................... 62 Appendix 5: Examples of Wide-area Nomograms ........................................................ 65
5.1 Central Allocation Office GmbH – CAO (Central and Eastern Europe) ........... 65 5.2 Community Activity Room – CAR (EPRI) ........................................................ 67 5.3 Physical and Operational Margins – POM (V&R Energy Systems Research) 69 5.4 Wide-area Security Nomograms (PNNL) ........................................................ 70
Appendix 6: Elements of the Theory Behind Transmission Line Ratings ..................... 74 6.1 Overhead Transmission Line Conductors: Conductor Ampacity, Conductor Temperature, Sag, and Other Factors ...................................................................... 74 6.2. Conductor Ampacity, Conductor Temperature, and Sag ................................ 75 6.3. Types of dynamic rating methods ................................................................... 76 6.4. Potential implications for the power industry ................................................... 76 6.5. Potential implications for the renewable industry ............................................ 77
Appendix 7: Relative Costs per MW-km of Different Transmission Technologies ........ 79 Appendix 8: National and International Experience in UHV Transmission ................... 81
8.1 United States .................................................................................................. 81 8.2 Russia ............................................................................................................. 81 8.3 Japan .............................................................................................................. 82 8.4 Canada ........................................................................................................... 82 8.5 Italy ................................................................................................................. 82 8.6 China .............................................................................................................. 83
Appendix 9: Additional Information on HVDC Line Design Considerations .................. 86 9.1 Advantages of DC systems over AC systems ................................................. 86 9.2 Characteristics of VSC-HVDC ......................................................................... 89 9.3 Additional information on the selection of rated current in HVDC projects ...... 90 9.4 Selection of rated voltage, current, and project configuration ......................... 91 9.5 National and international HVDC projects ....................................................... 92 9.6 Atlantic Wind Connection (AWC) Project ........................................................ 93 9.7 Iowa Rock Island Clean Line ........................................................................... 93 9.8 Pittsburg-San Francisco Transbay cable ........................................................ 94 9.9 China .............................................................................................................. 94
May 14, 2013 6
W E S T E R N E L E C T R I C I T Y C O O R D I N A T I N G C O U N C I L • W W W . W E C C . B I Z 1 5 5 N O R T H 4 0 0 W E S T • S U I T E 2 0 0 • S A L T L A K E C I T Y • U T A H • 8 4 1 0 3 - 1 1 1 4 • P H 8 0 1 . 5 8 2 . 0 3 5 3
9.10 Neptune Regional Transmission System (RTS) .......................................... 94 9.11 European experience .................................................................................. 95
Appendix 10: Additional Information on Rewiring ......................................................... 98 Appendix 11: Types of HTLS Conductors .................................................................. 100 Appendix 12: Direct Method and Energy Functions Transient Stability Analysis ........ 103
12.1 System model and energy function ........................................................... 104 12.2 Potential energy boundary surface (PEBS) ............................................... 106 12.3 Boundary controlling unstable (BCU) ........................................................ 108 12.4 Hybrid method ........................................................................................... 109 12.5 Artificial intelligence ................................................................................... 109
Appendix 13: Blackouts Caused by Voltage Instability ............................................... 112 13.1 Summary of recommendations by WECC ................................................. 113
Appendix 14: Algorithm for Parameter Continuation Predictor-corrector Methods ..... 116 Appendix 15: Approximation Techniques for Security Regions .................................. 119 Appendix 16: Impact of Wind Power on Power System Small Signals Stability ......... 122 Appendix 17: Additional Information on FIDVR Events and Grid Planning Solutions . 125
17.1 Faster clearing of faults ............................................................................. 125 17.2 Special protection schemes (SPS) ............................................................ 125 17.3 Limiting impacted load ............................................................................... 126 17.4 Addition of reactive sources or relocation of reactive sources relative to critical load .............................................................................................................. 126 17.5 Under-voltage Load Shedding (UVLS) ...................................................... 127 17.6 Promoting energy-saving devices to reduce demand ................................ 127 17.7 Unit-level solutions .................................................................................... 127
Appendix 18: FACTS Controllers ............................................................................... 129 18.1 Static VAr compensator (SVC) .................................................................. 129 18.2 Static synchronous compensator (STATCOM) .......................................... 130 18.3 Thyristor-controlled series capacitor (TCSC) ............................................. 132
Appendix 19: European Standards and Practice ........................................................ 135 19.1 Germany .................................................................................................... 135 19.2 Spain ......................................................................................................... 136
Appendix 20: International Experience ....................................................................... 138 20.1 Germany .................................................................................................... 138 20.2 Spain ......................................................................................................... 138
Appendix 21: Inertia and Frequency Response ......................................................... 141 21.1 Inertia ........................................................................................................ 141 21.2 Frequency response .................................................................................. 142 21.3 Impacts of renewable on frequency response and inertia ......................... 143
May 14, 2013 7
W E S T E R N E L E C T R I C I T Y C O O R D I N A T I N G C O U N C I L • W W W . W E C C . B I Z 1 5 5 N O R T H 4 0 0 W E S T • S U I T E 2 0 0 • S A L T L A K E C I T Y • U T A H • 8 4 1 0 3 - 1 1 1 4 • P H 8 0 1 . 5 8 2 . 0 3 5 3
Appendix 22: Western Renewable Energy Zones Initiative Renewable Energy Generating Capacity Summary ................................................................................... 146 Appendix 23: Energy Storage .................................................................................... 151
23.1. Electrochemical Capacitors ....................................................................... 151 23.2. Regenerative and conventional fuel cells .................................................. 158 23.3. High-temperature sodium beta batteries ................................................... 160 23.4. Summary of zinc-air battery development in the past. ............................... 162 23.5. N-Zn battery management ......................................................................... 163 23.6. Li-Ion batteries ........................................................................................... 163 23.7. Flow Batteries ............................................................................................ 164 23.8. Xtreme Power demonstration projects ...................................................... 166 23.9. Flywheels .................................................................................................. 167 23.10. CAES performance and life ....................................................................... 168
Appendix 24: Additional Information on Demand Response ...................................... 172 Appendix 25: Various BA Consolidation Options ....................................................... 175 Appendix 26: Generator Power Management Requirements ..................................... 179
26.1 Active power management ........................................................................ 179 26.2 Ramp rate limits and control ...................................................................... 179 26.3 Over-frequency response .......................................................................... 180 26.4 Interconnection application data recommendation .................................... 180 26.5 Future analyses ......................................................................................... 180
Appendix 27: European Planning Guidelines ............................................................. 184 27.1 Germany ......................................................................................................... 184 27.2 Spain ......................................................................................................... 184
Bibliography .............................................................................................................. 185
May 14, 2013 8
W E S T E R N E L E C T R I C I T Y C O O R D I N A T I N G C O U N C I L • W W W . W E C C . B I Z 1 5 5 N O R T H 4 0 0 W E S T • S U I T E 2 0 0 • S A L T L A K E C I T Y • U T A H • 8 4 1 0 3 - 1 1 1 4 • P H 8 0 1 . 5 8 2 . 0 3 5 3
Figures Figure 1. Critical interfaces controlled by CAO in Central and Eastern Europe ............ 65 Figure 2. Security region used by CAO ........................................................................ 67 Figure 3. Probabilistic Community Activity Room. ........................................................ 68 Figure 4. Boundary of secure operating region for two simultaneous transfers ............ 69 Figure 5. Wide-area security nomogram advantages and industry needs. ................... 71 Figure 6. Proposed system design of the WASN system. ............................................ 72 Figure 7. A comparison of DC cost with AC cost.. ........................................................ 87 Figure 8. Neptune project. ............................................................................................ 95 Figure 9. Current capacity in function of the cross sectional area . ........................... 100 Figure 10. Sag in function of the conductor temperature for a span length of 400 m. 101 Figure 11. The boundary of stability region ................................................................ 103 Figure 12. (a) Region of stability and (b) its local approximation ................................ 107 Figure 13. Equipotential energy surfaces for a three-machine system. . .................... 107 Figure 14. Energy function and system trajectories. .................................................. 108 Figure 15. Three main computational tasks in the BCU method. .............................. 108 Figure 16. SVC and its characteristics. ...................................................................... 129 Figure 17. Site view of the SVC ................................................................................. 130 Figure 18. STATCOM based on voltage-sourced converter (VSC). ........................... 131 Figure 19. Site view, STACOM and mechanically switched capacitor banks ............. 132 Figure 20. TCSC. ....................................................................................................... 133 Figure 21. Site view of Pingguo TCSC. ...................................................................... 133 Figure 22. Typical frequency excursion. ..................................................................... 142 Figure 23. Trend in Eastern Interconnection frequency response. ............................. 143 Figure 24. Trend in Western Interconnection frequency response. ............................ 143 Figure 25. Schematic of an electrochemical capacitor ............................................. 153 Figure 26. Plot of area specific capacitance for various carbons. ............................. 155 Figure 27. Range of specific capacitance values for various materials.. ................... 156 Figure 28. Ragone plot for asymmetric capacitors. .................................................... 156 Figure 29. Polarization curves during electrolysis and fuel cell mode for URFC . ..... 159
May 14, 2013 9
W E S T E R N E L E C T R I C I T Y C O O R D I N A T I N G C O U N C I L • W W W . W E C C . B I Z 1 5 5 N O R T H 4 0 0 W E S T • S U I T E 2 0 0 • S A L T L A K E C I T Y • U T A H • 8 4 1 0 3 - 1 1 1 4 • P H 8 0 1 . 5 8 2 . 0 3 5 3
Tables Table 1. Technical profile and offered capacities in Central and Eastern Europe ........ 66 Table 2. Commercial profile direction and total promise of capacities in Central and Eastern Europe ............................................................................................................. 66 Table 3. Western Renewable Energy Zones Initiative Renewable Energy Generating Capacity Summary. .................................................................................................... 147 Table 4. Western Renewable Energy Zones Initiative Renewable Energy Generation Summary. ................................................................................................................. 148 Table 5. Summary of capital cost diversity for CAES systems ................................... 170 Table 6. Various BA consolidation options ................................................................. 175

May 14, 2013 10
W E S T E R N E L E C T R I C I T Y C O O R D I N A T I N G C O U N C I L • W W W . W E C C . B I Z 1 5 5 N O R T H 4 0 0 W E S T • S U I T E 2 0 0 • S A L T L A K E C I T Y • U T A H • 8 4 1 0 3 - 1 1 1 4 • P H 8 0 1 . 5 8 2 . 0 3 5 3
APPENDIX 1
Glossary
May 14, 2013 11
W E S T E R N E L E C T R I C I T Y C O O R D I N A T I N G C O U N C I L • W W W . W E C C . B I Z 1 5 5 N O R T H 4 0 0 W E S T • S U I T E 2 0 0 • S A L T L A K E C I T Y • U T A H • 8 4 1 0 3 - 1 1 1 4 • P H 8 0 1 . 5 8 2 . 0 3 5 3
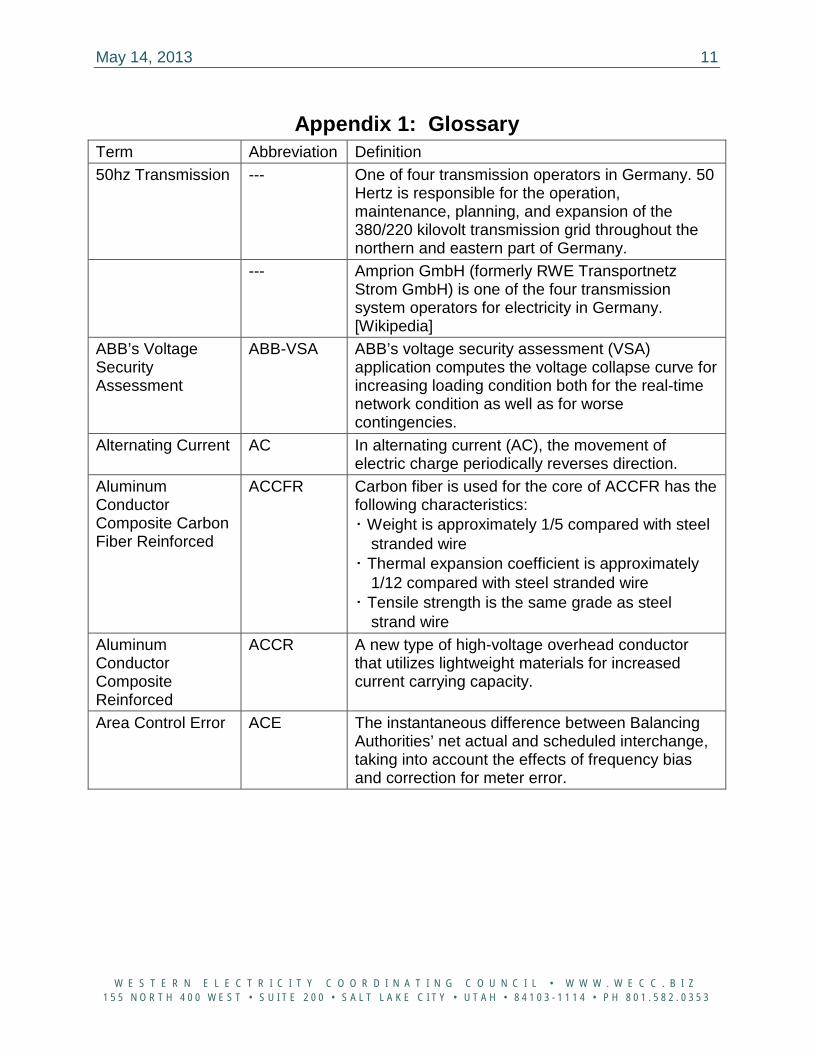
Appendix 1: Glossary Term Abbreviation Definition 50hz Transmission --- One of four transmission operators in Germany. 50
Hertz is responsible for the operation, maintenance, planning, and expansion of the 380/220 kilovolt transmission grid throughout the northern and eastern part of Germany.
--- Amprion GmbH (formerly RWE Transportnetz Strom GmbH) is one of the four transmission system operators for electricity in Germany. [Wikipedia]
ABB’s Voltage Security Assessment
ABB-VSA ABB’s voltage security assessment (VSA) application computes the voltage collapse curve for increasing loading condition both for the real-time network condition as well as for worse contingencies.
Alternating Current AC In alternating current (AC), the movement of electric charge periodically reverses direction.
Aluminum Conductor Composite Carbon Fiber Reinforced
ACCFR Carbon fiber is used for the core of ACCFR has the following characteristics: ・ Weight is approximately 1/5 compared with steel
stranded wire ・ Thermal expansion coefficient is approximately
1/12 compared with steel stranded wire ・ Tensile strength is the same grade as steel
strand wire Aluminum Conductor Composite Reinforced
ACCR A new type of high-voltage overhead conductor that utilizes lightweight materials for increased current carrying capacity.
Area Control Error ACE The instantaneous difference between Balancing Authorities’ net actual and scheduled interchange, taking into account the effects of frequency bias and correction for meter error.
May 14, 2013 12
W E S T E R N E L E C T R I C I T Y C O O R D I N A T I N G C O U N C I L • W W W . W E C C . B I Z 1 5 5 N O R T H 4 0 0 W E S T • S U I T E 2 0 0 • S A L T L A K E C I T Y • U T A H • 8 4 1 0 3 - 1 1 1 4 • P H 8 0 1 . 5 8 2 . 0 3 5 3
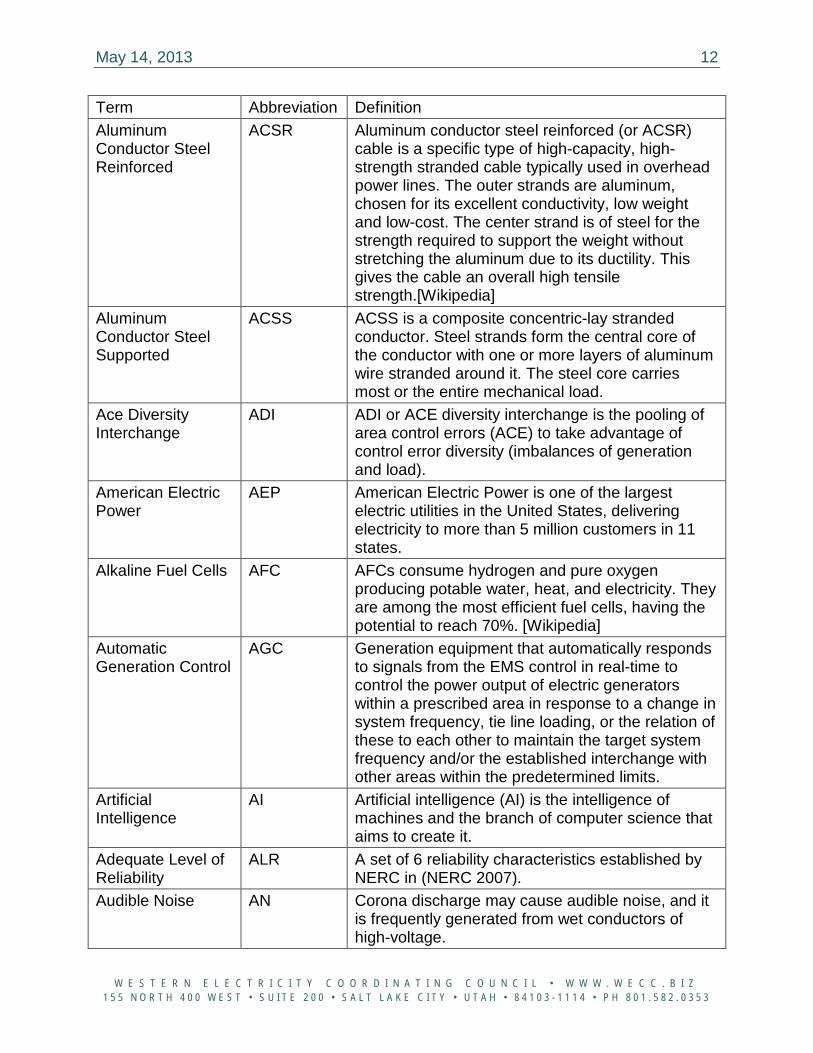
Term Abbreviation Definition Aluminum Conductor Steel Reinforced
ACSR Aluminum conductor steel reinforced (or ACSR) cable is a specific type of high-capacity, high-strength stranded cable typically used in overhead power lines. The outer strands are aluminum, chosen for its excellent conductivity, low weight and low-cost. The center strand is of steel for the strength required to support the weight without stretching the aluminum due to its ductility. This gives the cable an overall high tensile strength.[Wikipedia]
Aluminum Conductor Steel Supported
ACSS ACSS is a composite concentric-lay stranded conductor. Steel strands form the central core of the conductor with one or more layers of aluminum wire stranded around it. The steel core carries most or the entire mechanical load.
Ace Diversity Interchange
ADI ADI or ACE diversity interchange is the pooling of area control errors (ACE) to take advantage of control error diversity (imbalances of generation and load).
American Electric Power
AEP American Electric Power is one of the largest electric utilities in the United States, delivering electricity to more than 5 million customers in 11 states.
Alkaline Fuel Cells AFC AFCs consume hydrogen and pure oxygen producing potable water, heat, and electricity. They are among the most efficient fuel cells, having the potential to reach 70%. [Wikipedia]
Automatic Generation Control
AGC Generation equipment that automatically responds to signals from the EMS control in real-time to control the power output of electric generators within a prescribed area in response to a change in system frequency, tie line loading, or the relation of these to each other to maintain the target system frequency and/or the established interchange with other areas within the predetermined limits.
Artificial Intelligence
AI Artificial intelligence (AI) is the intelligence of machines and the branch of computer science that aims to create it.
Adequate Level of Reliability
ALR A set of 6 reliability characteristics established by NERC in (NERC 2007).
Audible Noise AN Corona discharge may cause audible noise, and it is frequently generated from wet conductors of high-voltage.
May 14, 2013 13
W E S T E R N E L E C T R I C I T Y C O O R D I N A T I N G C O U N C I L • W W W . W E C C . B I Z 1 5 5 N O R T H 4 0 0 W E S T • S U I T E 2 0 0 • S A L T L A K E C I T Y • U T A H • 8 4 1 0 3 - 1 1 1 4 • P H 8 0 1 . 5 8 2 . 0 3 5 3
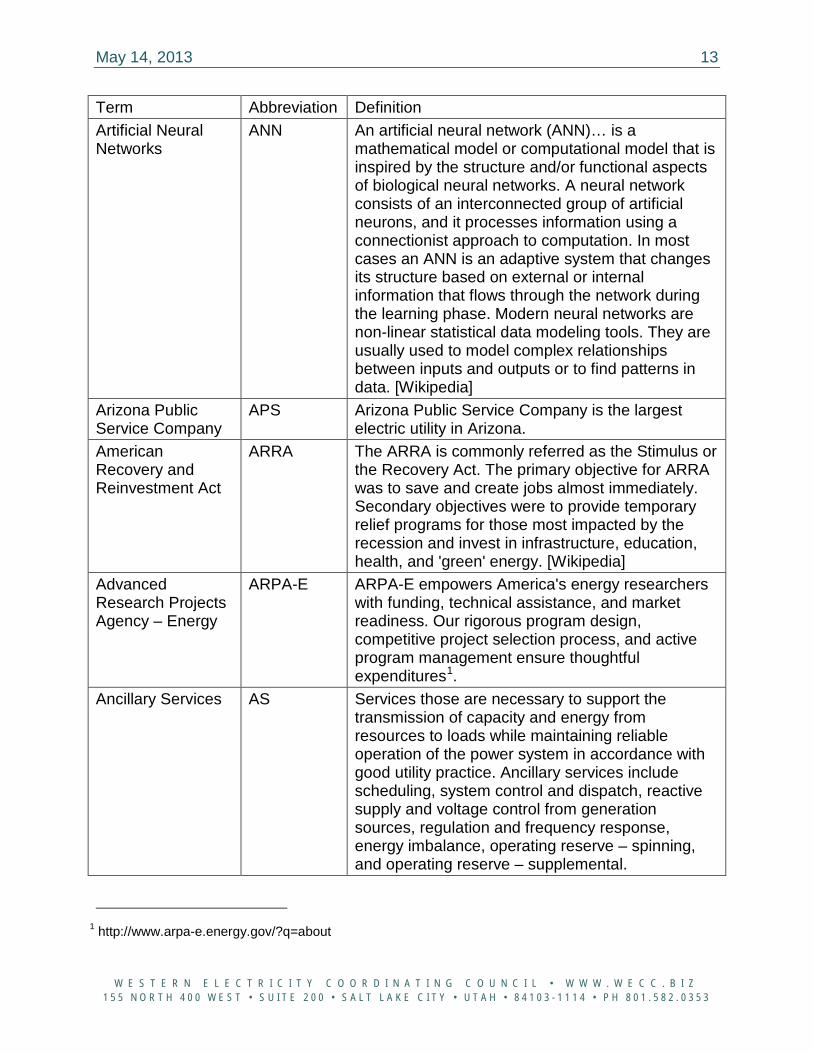
Term Abbreviation Definition Artificial Neural Networks
ANN An artificial neural network (ANN)… is a mathematical model or computational model that is inspired by the structure and/or functional aspects of biological neural networks. A neural network consists of an interconnected group of artificial neurons, and it processes information using a connectionist approach to computation. In most cases an ANN is an adaptive system that changes its structure based on external or internal information that flows through the network during the learning phase. Modern neural networks are non-linear statistical data modeling tools. They are usually used to model complex relationships between inputs and outputs or to find patterns in data. [Wikipedia]
Arizona Public Service Company
APS Arizona Public Service Company is the largest electric utility in Arizona.
American Recovery and Reinvestment Act
ARRA The ARRA is commonly referred as the Stimulus or the Recovery Act. The primary objective for ARRA was to save and create jobs almost immediately. Secondary objectives were to provide temporary relief programs for those most impacted by the recession and invest in infrastructure, education, health, and 'green' energy. [Wikipedia]
Advanced Research Projects Agency – Energy
ARPA-E ARPA-E empowers America's energy researchers with funding, technical assistance, and market readiness. Our rigorous program design, competitive project selection process, and active program management ensure thoughtful expenditures1.
Ancillary Services AS
Services those are necessary to support the transmission of capacity and energy from resources to loads while maintaining reliable operation of the power system in accordance with good utility practice. Ancillary services include scheduling, system control and dispatch, reactive supply and voltage control from generation sources, regulation and frequency response, energy imbalance, operating reserve – spinning, and operating reserve – supplemental.
1 http://www.arpa-e.energy.gov/?q=about
May 14, 2013 14
W E S T E R N E L E C T R I C I T Y C O O R D I N A T I N G C O U N C I L • W W W . W E C C . B I Z 1 5 5 N O R T H 4 0 0 W E S T • S U I T E 2 0 0 • S A L T L A K E C I T Y • U T A H • 8 4 1 0 3 - 1 1 1 4 • P H 8 0 1 . 5 8 2 . 0 3 5 3
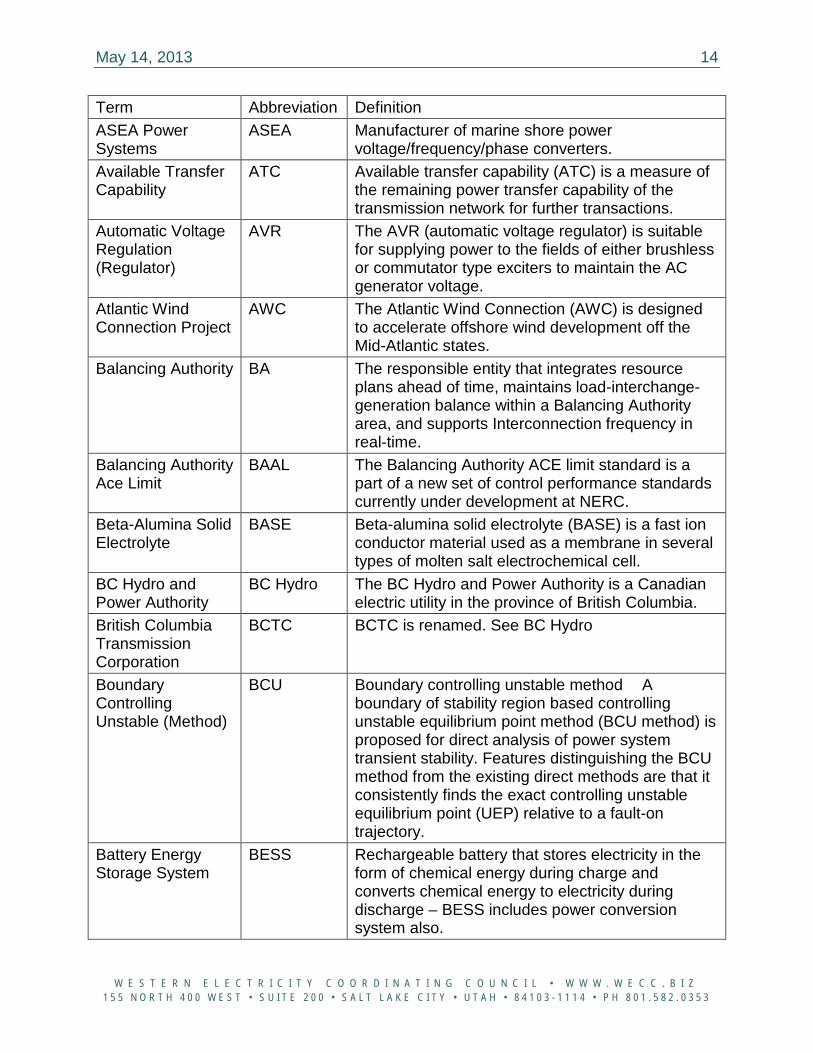
Term Abbreviation Definition ASEA Power Systems
ASEA Manufacturer of marine shore power voltage/frequency/phase converters.
Available Transfer Capability
ATC Available transfer capability (ATC) is a measure of the remaining power transfer capability of the transmission network for further transactions.
Automatic Voltage Regulation (Regulator)
AVR The AVR (automatic voltage regulator) is suitable for supplying power to the fields of either brushless or commutator type exciters to maintain the AC generator voltage.
Atlantic Wind Connection Project
AWC The Atlantic Wind Connection (AWC) is designed to accelerate offshore wind development off the Mid-Atlantic states.
Balancing Authority BA The responsible entity that integrates resource plans ahead of time, maintains load-interchange-generation balance within a Balancing Authority area, and supports Interconnection frequency in real-time.
Balancing Authority Ace Limit
BAAL The Balancing Authority ACE limit standard is a part of a new set of control performance standards currently under development at NERC.
Beta-Alumina Solid Electrolyte
BASE Beta-alumina solid electrolyte (BASE) is a fast ion conductor material used as a membrane in several types of molten salt electrochemical cell.
BC Hydro and Power Authority
BC Hydro The BC Hydro and Power Authority is a Canadian electric utility in the province of British Columbia.
British Columbia Transmission Corporation
BCTC BCTC is renamed. See BC Hydro
Boundary Controlling Unstable (Method)
BCU Boundary controlling unstable method A boundary of stability region based controlling unstable equilibrium point method (BCU method) is proposed for direct analysis of power system transient stability. Features distinguishing the BCU method from the existing direct methods are that it consistently finds the exact controlling unstable equilibrium point (UEP) relative to a fault-on trajectory.
Battery Energy Storage System
BESS Rechargeable battery that stores electricity in the form of chemical energy during charge and converts chemical energy to electricity during discharge – BESS includes power conversion system also.
May 14, 2013 15
W E S T E R N E L E C T R I C I T Y C O O R D I N A T I N G C O U N C I L • W W W . W E C C . B I Z 1 5 5 N O R T H 4 0 0 W E S T • S U I T E 2 0 0 • S A L T L A K E C I T Y • U T A H • 8 4 1 0 3 - 1 1 1 4 • P H 8 0 1 . 5 8 2 . 0 3 5 3
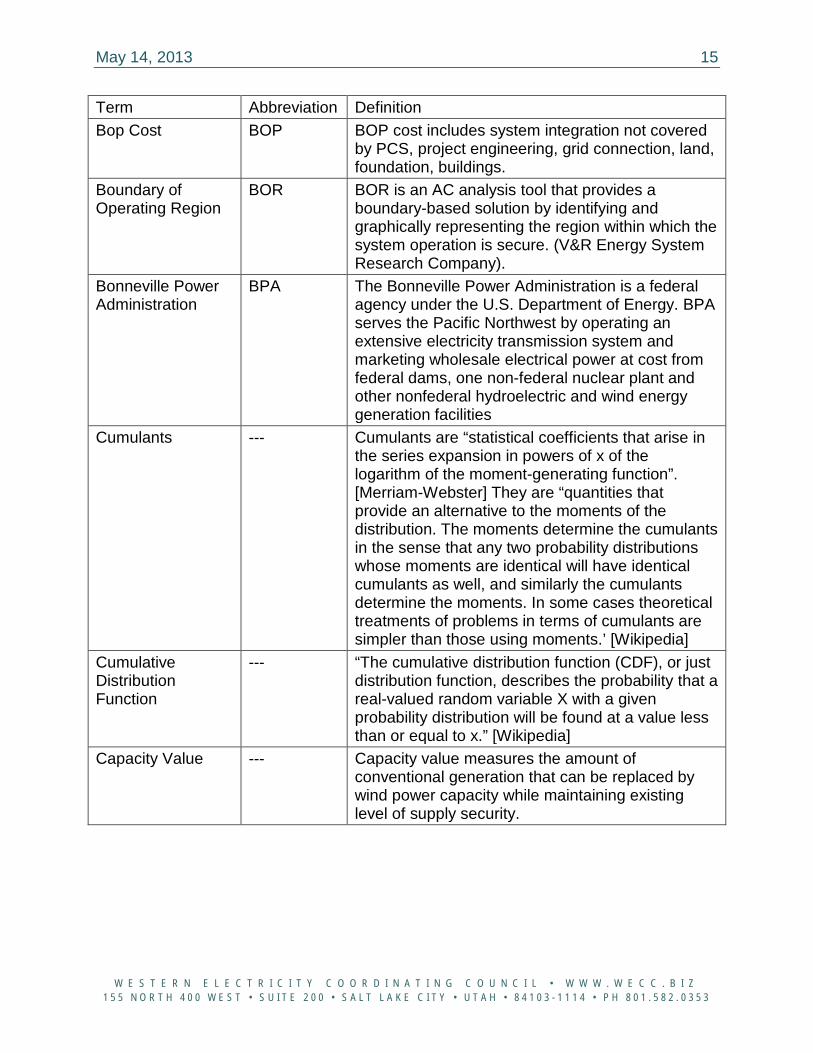
Term Abbreviation Definition Bop Cost BOP BOP cost includes system integration not covered
by PCS, project engineering, grid connection, land, foundation, buildings.
Boundary of Operating Region
BOR BOR is an AC analysis tool that provides a boundary-based solution by identifying and graphically representing the region within which the system operation is secure. (V&R Energy System Research Company).
Bonneville Power Administration
BPA The Bonneville Power Administration is a federal agency under the U.S. Department of Energy. BPA serves the Pacific Northwest by operating an extensive electricity transmission system and marketing wholesale electrical power at cost from federal dams, one non-federal nuclear plant and other nonfederal hydroelectric and wind energy generation facilities
Cumulants --- Cumulants are “statistical coefficients that arise in the series expansion in powers of x of the logarithm of the moment-generating function”. [Merriam-Webster] They are “quantities that provide an alternative to the moments of the distribution. The moments determine the cumulants in the sense that any two probability distributions whose moments are identical will have identical cumulants as well, and similarly the cumulants determine the moments. In some cases theoretical treatments of problems in terms of cumulants are simpler than those using moments.’ [Wikipedia]
Cumulative Distribution Function
--- “The cumulative distribution function (CDF), or just distribution function, describes the probability that a real-valued random variable X with a given probability distribution will be found at a value less than or equal to x.” [Wikipedia]
Capacity Value --- Capacity value measures the amount of conventional generation that can be replaced by wind power capacity while maintaining existing level of supply security.
May 14, 2013 16
W E S T E R N E L E C T R I C I T Y C O O R D I N A T I N G C O U N C I L • W W W . W E C C . B I Z 1 5 5 N O R T H 4 0 0 W E S T • S U I T E 2 0 0 • S A L T L A K E C I T Y • U T A H • 8 4 1 0 3 - 1 1 1 4 • P H 8 0 1 . 5 8 2 . 0 3 5 3
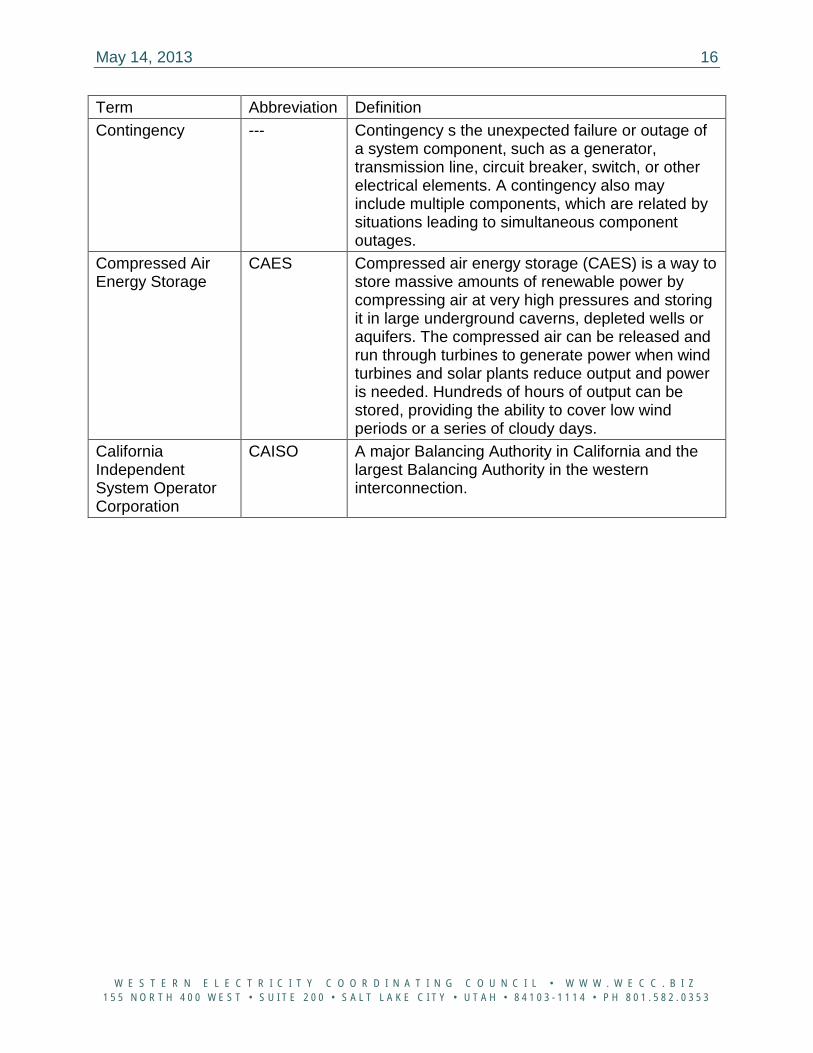
Term Abbreviation Definition Contingency --- Contingency s the unexpected failure or outage of
a system component, such as a generator, transmission line, circuit breaker, switch, or other electrical elements. A contingency also may include multiple components, which are related by situations leading to simultaneous component outages.
Compressed Air Energy Storage
CAES Compressed air energy storage (CAES) is a way to store massive amounts of renewable power by compressing air at very high pressures and storing it in large underground caverns, depleted wells or aquifers. The compressed air can be released and run through turbines to generate power when wind turbines and solar plants reduce output and power is needed. Hundreds of hours of output can be stored, providing the ability to cover low wind periods or a series of cloudy days.
California Independent System Operator Corporation
CAISO A major Balancing Authority in California and the largest Balancing Authority in the western interconnection.
May 14, 2013 17
W E S T E R N E L E C T R I C I T Y C O O R D I N A T I N G C O U N C I L • W W W . W E C C . B I Z 1 5 5 N O R T H 4 0 0 W E S T • S U I T E 2 0 0 • S A L T L A K E C I T Y • U T A H • 8 4 1 0 3 - 1 1 1 4 • P H 8 0 1 . 5 8 2 . 0 3 5 3
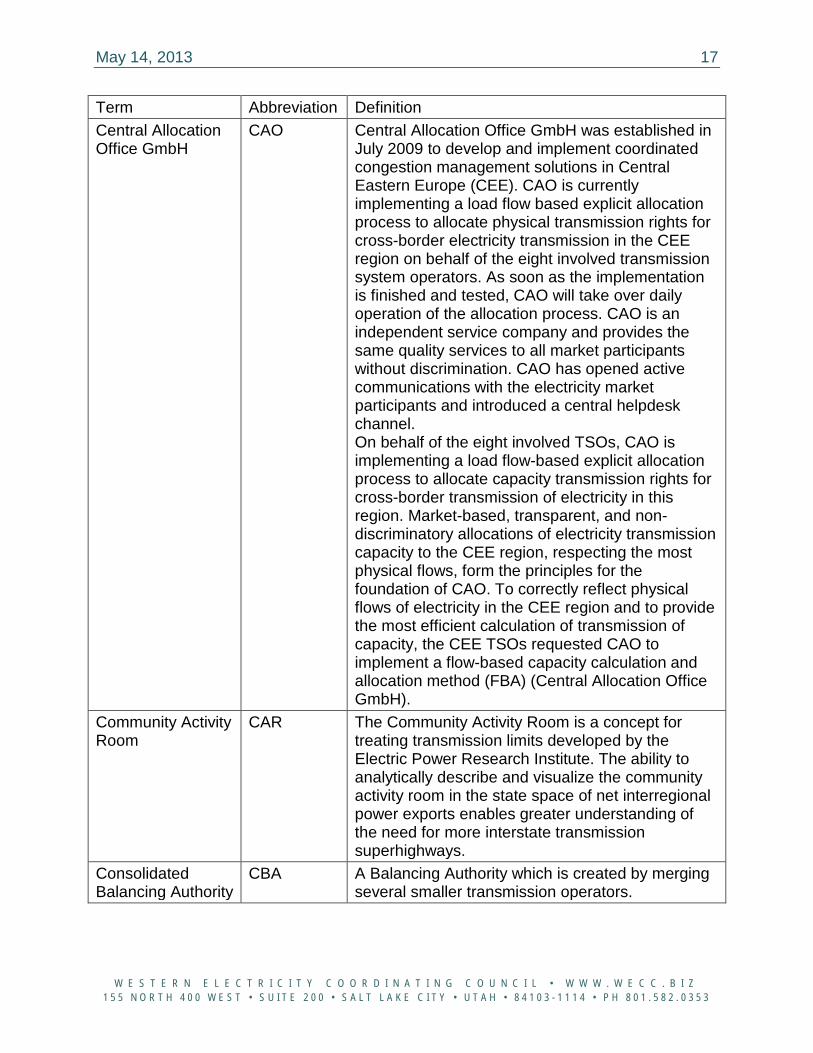
Term Abbreviation Definition Central Allocation Office GmbH
CAO Central Allocation Office GmbH was established in July 2009 to develop and implement coordinated congestion management solutions in Central Eastern Europe (CEE). CAO is currently implementing a load flow based explicit allocation process to allocate physical transmission rights for cross-border electricity transmission in the CEE region on behalf of the eight involved transmission system operators. As soon as the implementation is finished and tested, CAO will take over daily operation of the allocation process. CAO is an independent service company and provides the same quality services to all market participants without discrimination. CAO has opened active communications with the electricity market participants and introduced a central helpdesk channel. On behalf of the eight involved TSOs, CAO is implementing a load flow-based explicit allocation process to allocate capacity transmission rights for cross-border transmission of electricity in this region. Market-based, transparent, and non-discriminatory allocations of electricity transmission capacity to the CEE region, respecting the most physical flows, form the principles for the foundation of CAO. To correctly reflect physical flows of electricity in the CEE region and to provide the most efficient calculation of transmission of capacity, the CEE TSOs requested CAO to implement a flow-based capacity calculation and allocation method (FBA) (Central Allocation Office GmbH).
Community Activity Room
CAR The Community Activity Room is a concept for treating transmission limits developed by the Electric Power Research Institute. The ability to analytically describe and visualize the community activity room in the state space of net interregional power exports enables greater understanding of the need for more interstate transmission superhighways.
Consolidated Balancing Authority
CBA A Balancing Authority which is created by merging several smaller transmission operators.
May 14, 2013 18
W E S T E R N E L E C T R I C I T Y C O O R D I N A T I N G C O U N C I L • W W W . W E C C . B I Z 1 5 5 N O R T H 4 0 0 W E S T • S U I T E 2 0 0 • S A L T L A K E C I T Y • U T A H • 8 4 1 0 3 - 1 1 1 4 • P H 8 0 1 . 5 8 2 . 0 3 5 3
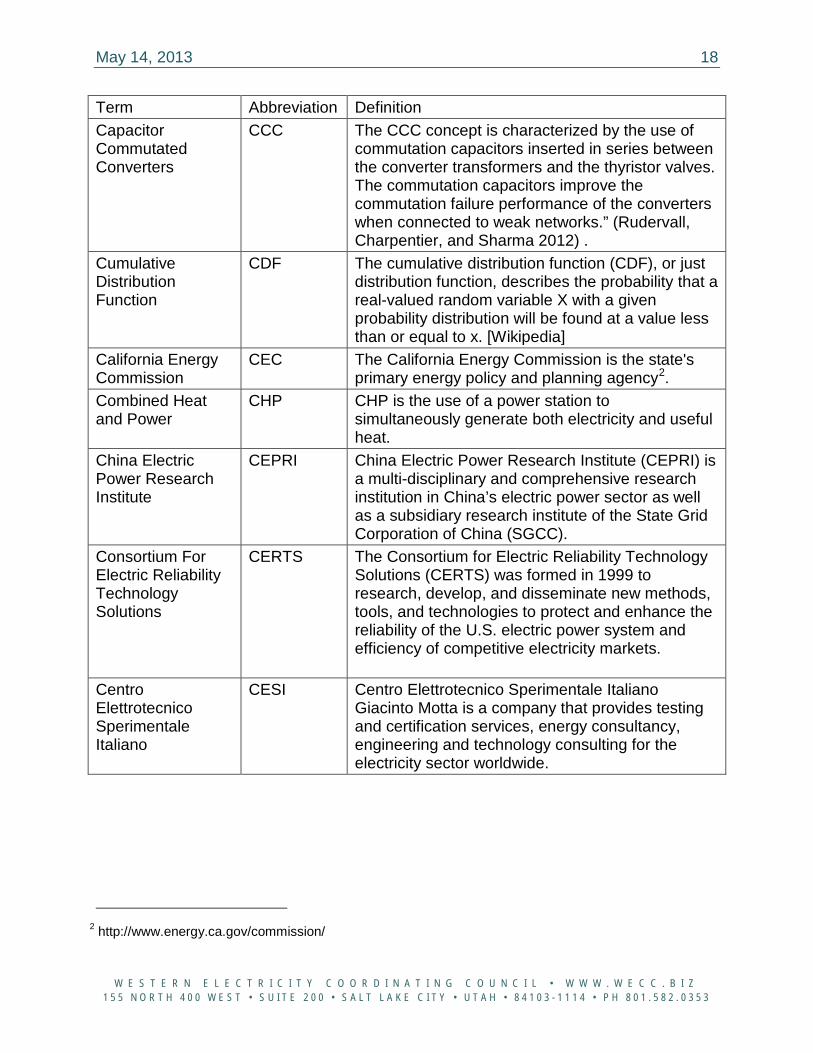
Term Abbreviation Definition Capacitor Commutated Converters
CCC The CCC concept is characterized by the use of commutation capacitors inserted in series between the converter transformers and the thyristor valves. The commutation capacitors improve the commutation failure performance of the converters when connected to weak networks.” (Rudervall, Charpentier, and Sharma 2012) .
Cumulative Distribution Function
CDF The cumulative distribution function (CDF), or just distribution function, describes the probability that a real-valued random variable X with a given probability distribution will be found at a value less than or equal to x. [Wikipedia]
California Energy Commission
CEC The California Energy Commission is the state's primary energy policy and planning agency2.
Combined Heat and Power
CHP CHP is the use of a power station to simultaneously generate both electricity and useful heat.
China Electric Power Research Institute
CEPRI China Electric Power Research Institute (CEPRI) is a multi-disciplinary and comprehensive research institution in China’s electric power sector as well as a subsidiary research institute of the State Grid Corporation of China (SGCC).
Consortium For Electric Reliability Technology Solutions
CERTS The Consortium for Electric Reliability Technology Solutions (CERTS) was formed in 1999 to research, develop, and disseminate new methods, tools, and technologies to protect and enhance the reliability of the U.S. electric power system and efficiency of competitive electricity markets.
Centro Elettrotecnico Sperimentale Italiano
CESI Centro Elettrotecnico Sperimentale Italiano Giacinto Motta is a company that provides testing and certification services, energy consultancy, engineering and technology consulting for the electricity sector worldwide.
2 http://www.energy.ca.gov/commission/
May 14, 2013 19
W E S T E R N E L E C T R I C I T Y C O O R D I N A T I N G C O U N C I L • W W W . W E C C . B I Z 1 5 5 N O R T H 4 0 0 W E S T • S U I T E 2 0 0 • S A L T L A K E C I T Y • U T A H • 8 4 1 0 3 - 1 1 1 4 • P H 8 0 1 . 5 8 2 . 0 3 5 3
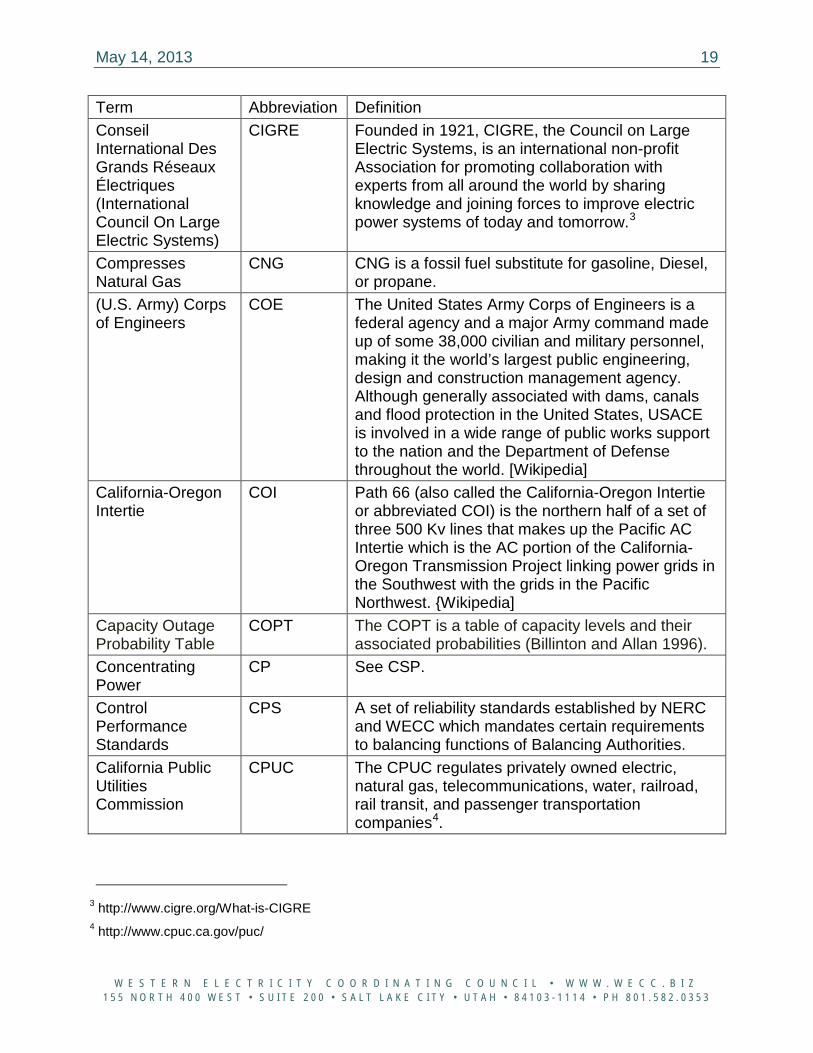
Term Abbreviation Definition Conseil International Des Grands Réseaux Électriques (International Council On Large Electric Systems)
CIGRE Founded in 1921, CIGRE, the Council on Large Electric Systems, is an international non-profit Association for promoting collaboration with experts from all around the world by sharing knowledge and joining forces to improve electric power systems of today and tomorrow.3
Compresses Natural Gas
CNG CNG is a fossil fuel substitute for gasoline, Diesel, or propane.
(U.S. Army) Corps of Engineers
COE The United States Army Corps of Engineers is a federal agency and a major Army command made up of some 38,000 civilian and military personnel, making it the world’s largest public engineering, design and construction management agency. Although generally associated with dams, canals and flood protection in the United States, USACE is involved in a wide range of public works support to the nation and the Department of Defense throughout the world. [Wikipedia]
California-Oregon Intertie
COI Path 66 (also called the California-Oregon Intertie or abbreviated COI) is the northern half of a set of three 500 Kv lines that makes up the Pacific AC Intertie which is the AC portion of the California-Oregon Transmission Project linking power grids in the Southwest with the grids in the Pacific Northwest. Wikipedia]
Capacity Outage Probability Table
COPT The COPT is a table of capacity levels and their associated probabilities (Billinton and Allan 1996).
Concentrating Power
CP See CSP.
Control Performance Standards
CPS A set of reliability standards established by NERC and WECC which mandates certain requirements to balancing functions of Balancing Authorities.
California Public Utilities Commission
CPUC The CPUC regulates privately owned electric, natural gas, telecommunications, water, railroad, rail transit, and passenger transportation companies4.
3 http://www.cigre.org/What-is-CIGRE 4 http://www.cpuc.ca.gov/puc/
May 14, 2013 20
W E S T E R N E L E C T R I C I T Y C O O R D I N A T I N G C O U N C I L • W W W . W E C C . B I Z 1 5 5 N O R T H 4 0 0 W E S T • S U I T E 2 0 0 • S A L T L A K E C I T Y • U T A H • 8 4 1 0 3 - 1 1 1 4 • P H 8 0 1 . 5 8 2 . 0 3 5 3
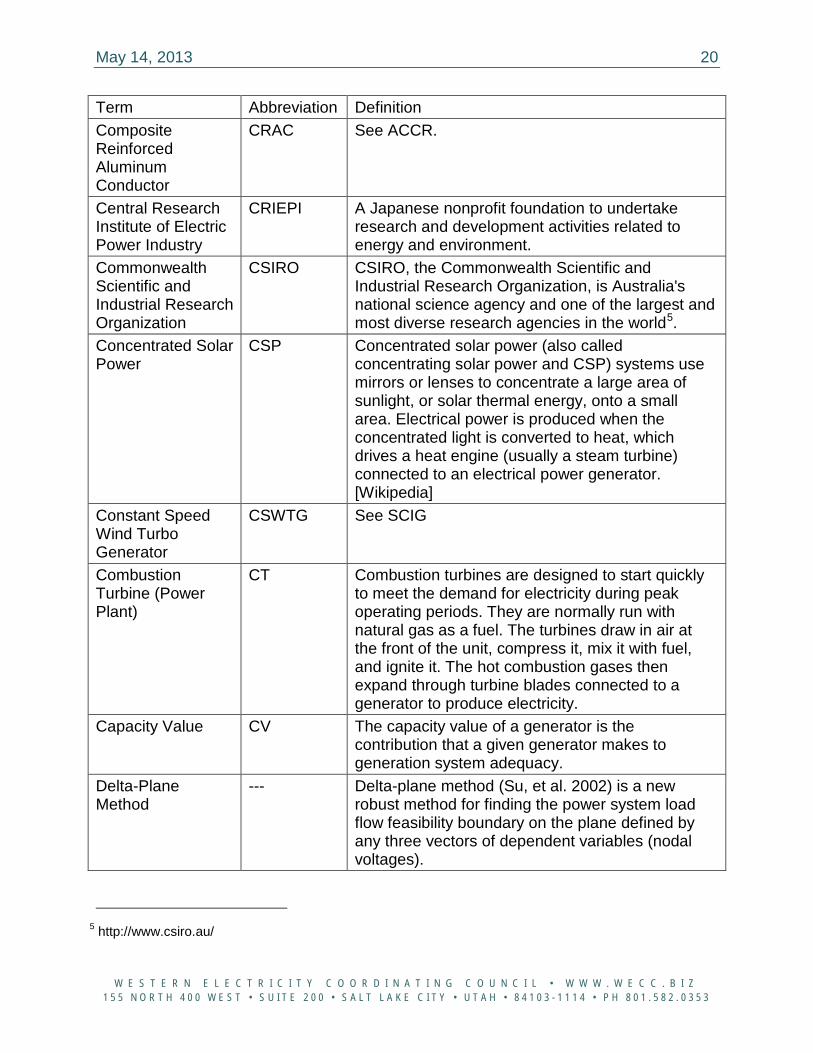
Term Abbreviation Definition Composite Reinforced Aluminum Conductor
CRAC See ACCR.
Central Research Institute of Electric Power Industry
CRIEPI A Japanese nonprofit foundation to undertake research and development activities related to energy and environment.
Commonwealth Scientific and Industrial Research Organization
CSIRO CSIRO, the Commonwealth Scientific and Industrial Research Organization, is Australia's national science agency and one of the largest and most diverse research agencies in the world5.
Concentrated Solar Power
CSP Concentrated solar power (also called concentrating solar power and CSP) systems use mirrors or lenses to concentrate a large area of sunlight, or solar thermal energy, onto a small area. Electrical power is produced when the concentrated light is converted to heat, which drives a heat engine (usually a steam turbine) connected to an electrical power generator. [Wikipedia]
Constant Speed Wind Turbo Generator
CSWTG See SCIG
Combustion Turbine (Power Plant)
CT Combustion turbines are designed to start quickly to meet the demand for electricity during peak operating periods. They are normally run with natural gas as a fuel. The turbines draw in air at the front of the unit, compress it, mix it with fuel, and ignite it. The hot combustion gases then expand through turbine blades connected to a generator to produce electricity.
Capacity Value CV The capacity value of a generator is the contribution that a given generator makes to generation system adequacy.
Delta-Plane Method
--- Delta-plane method (Su, et al. 2002) is a new robust method for finding the power system load flow feasibility boundary on the plane defined by any three vectors of dependent variables (nodal voltages).
5 http://www.csiro.au/
May 14, 2013 21
W E S T E R N E L E C T R I C I T Y C O O R D I N A T I N G C O U N C I L • W W W . W E C C . B I Z 1 5 5 N O R T H 4 0 0 W E S T • S U I T E 2 0 0 • S A L T L A K E C I T Y • U T A H • 8 4 1 0 3 - 1 1 1 4 • P H 8 0 1 . 5 8 2 . 0 3 5 3
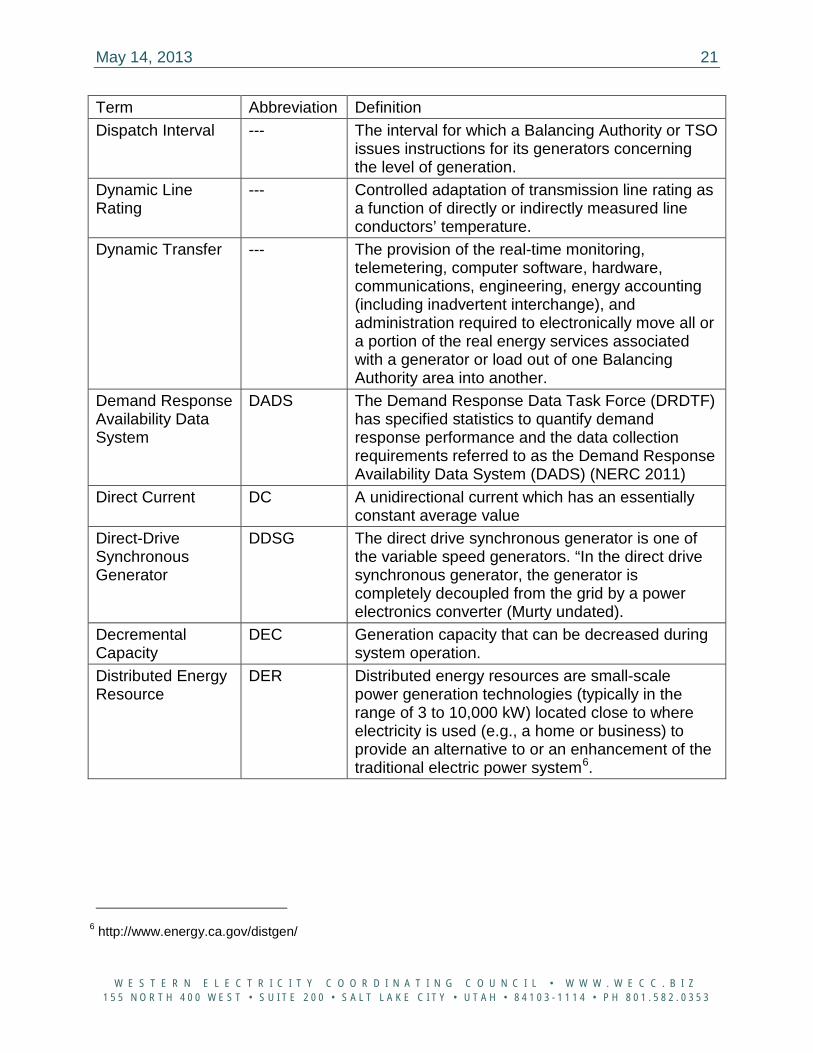
Term Abbreviation Definition Dispatch Interval --- The interval for which a Balancing Authority or TSO
issues instructions for its generators concerning the level of generation.
Dynamic Line Rating
--- Controlled adaptation of transmission line rating as a function of directly or indirectly measured line conductors’ temperature.
Dynamic Transfer --- The provision of the real-time monitoring, telemetering, computer software, hardware, communications, engineering, energy accounting (including inadvertent interchange), and administration required to electronically move all or a portion of the real energy services associated with a generator or load out of one Balancing Authority area into another.
Demand Response Availability Data System
DADS The Demand Response Data Task Force (DRDTF) has specified statistics to quantify demand response performance and the data collection requirements referred to as the Demand Response Availability Data System (DADS) (NERC 2011)
Direct Current DC A unidirectional current which has an essentially constant average value
Direct-Drive Synchronous Generator
DDSG The direct drive synchronous generator is one of the variable speed generators. “In the direct drive synchronous generator, the generator is completely decoupled from the grid by a power electronics converter (Murty undated).
Decremental Capacity
DEC Generation capacity that can be decreased during system operation.
Distributed Energy Resource
DER Distributed energy resources are small-scale power generation technologies (typically in the range of 3 to 10,000 kW) located close to where electricity is used (e.g., a home or business) to provide an alternative to or an enhancement of the traditional electric power system6.
6 http://www.energy.ca.gov/distgen/
May 14, 2013 22
W E S T E R N E L E C T R I C I T Y C O O R D I N A T I N G C O U N C I L • W W W . W E C C . B I Z 1 5 5 N O R T H 4 0 0 W E S T • S U I T E 2 0 0 • S A L T L A K E C I T Y • U T A H • 8 4 1 0 3 - 1 1 1 4 • P H 8 0 1 . 5 8 2 . 0 3 5 3
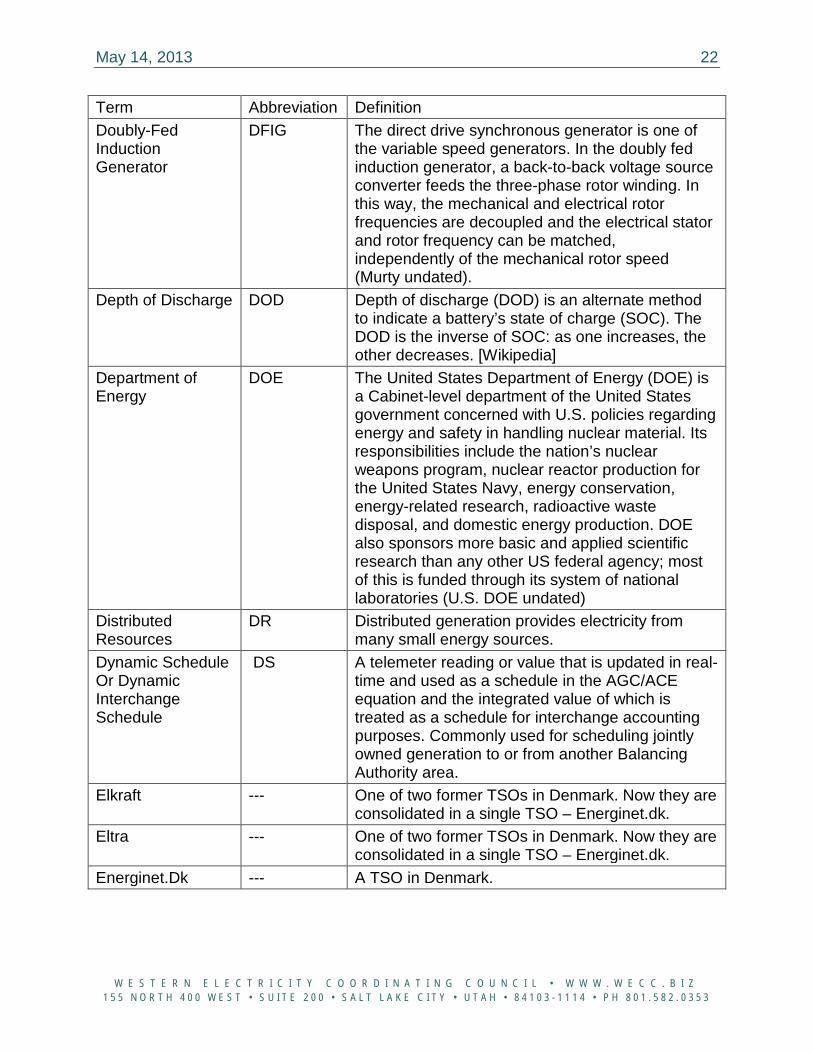
Term Abbreviation Definition Doubly-Fed Induction Generator
DFIG The direct drive synchronous generator is one of the variable speed generators. In the doubly fed induction generator, a back-to-back voltage source converter feeds the three-phase rotor winding. In this way, the mechanical and electrical rotor frequencies are decoupled and the electrical stator and rotor frequency can be matched, independently of the mechanical rotor speed (Murty undated).
Depth of Discharge DOD Depth of discharge (DOD) is an alternate method to indicate a battery’s state of charge (SOC). The DOD is the inverse of SOC: as one increases, the other decreases. [Wikipedia]
Department of Energy
DOE The United States Department of Energy (DOE) is a Cabinet-level department of the United States government concerned with U.S. policies regarding energy and safety in handling nuclear material. Its responsibilities include the nation’s nuclear weapons program, nuclear reactor production for the United States Navy, energy conservation, energy-related research, radioactive waste disposal, and domestic energy production. DOE also sponsors more basic and applied scientific research than any other US federal agency; most of this is funded through its system of national laboratories (U.S. DOE undated)
Distributed Resources
DR Distributed generation provides electricity from many small energy sources.
Dynamic Schedule Or Dynamic Interchange Schedule
DS A telemeter reading or value that is updated in real-time and used as a schedule in the AGC/ACE equation and the integrated value of which is treated as a schedule for interchange accounting purposes. Commonly used for scheduling jointly owned generation to or from another Balancing Authority area.
Elkraft --- One of two former TSOs in Denmark. Now they are consolidated in a single TSO – Energinet.dk.
Eltra --- One of two former TSOs in Denmark. Now they are consolidated in a single TSO – Energinet.dk.
Energinet.Dk --- A TSO in Denmark.
May 14, 2013 23
W E S T E R N E L E C T R I C I T Y C O O R D I N A T I N G C O U N C I L • W W W . W E C C . B I Z 1 5 5 N O R T H 4 0 0 W E S T • S U I T E 2 0 0 • S A L T L A K E C I T Y • U T A H • 8 4 1 0 3 - 1 1 1 4 • P H 8 0 1 . 5 8 2 . 0 3 5 3
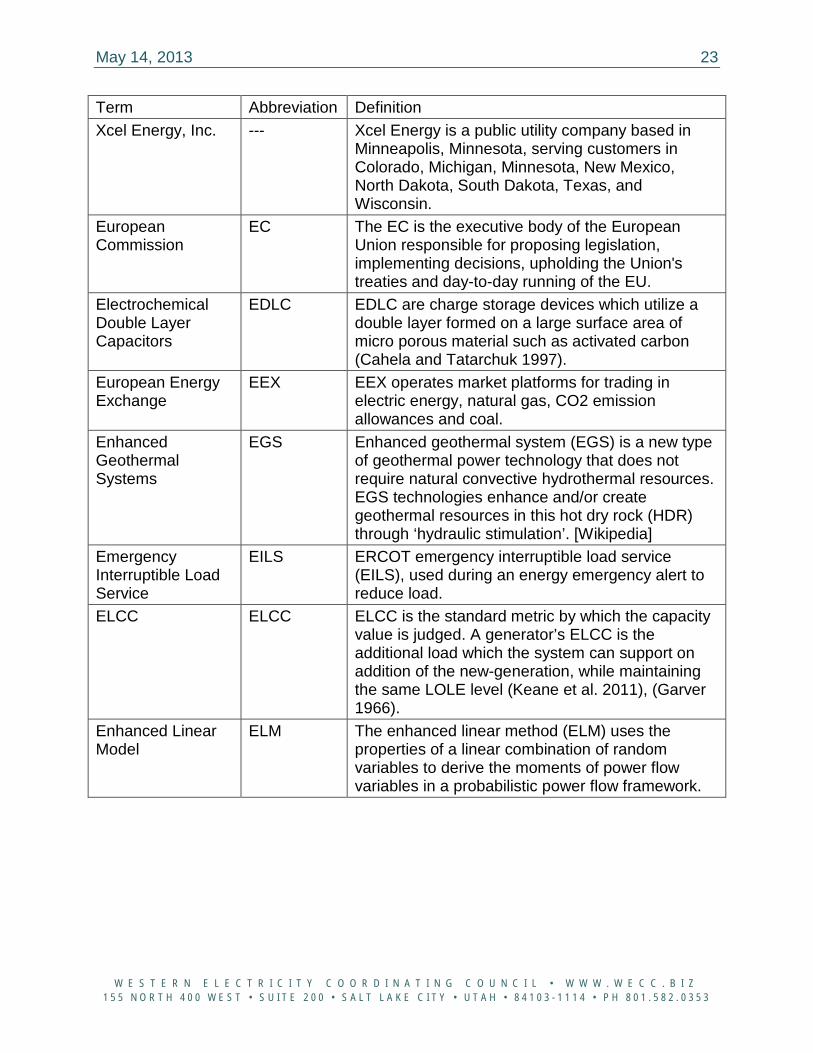
Term Abbreviation Definition Xcel Energy, Inc. --- Xcel Energy is a public utility company based in
Minneapolis, Minnesota, serving customers in Colorado, Michigan, Minnesota, New Mexico, North Dakota, South Dakota, Texas, and Wisconsin.
European Commission
EC The EC is the executive body of the European Union responsible for proposing legislation, implementing decisions, upholding the Union's treaties and day-to-day running of the EU.
Electrochemical Double Layer Capacitors
EDLC EDLC are charge storage devices which utilize a double layer formed on a large surface area of micro porous material such as activated carbon (Cahela and Tatarchuk 1997).
European Energy Exchange
EEX EEX operates market platforms for trading in electric energy, natural gas, CO2 emission allowances and coal.
Enhanced Geothermal Systems
EGS Enhanced geothermal system (EGS) is a new type of geothermal power technology that does not require natural convective hydrothermal resources. EGS technologies enhance and/or create geothermal resources in this hot dry rock (HDR) through ‘hydraulic stimulation’. [Wikipedia]
Emergency Interruptible Load Service
EILS ERCOT emergency interruptible load service (EILS), used during an energy emergency alert to reduce load.
ELCC ELCC ELCC is the standard metric by which the capacity value is judged. A generator’s ELCC is the additional load which the system can support on addition of the new-generation, while maintaining the same LOLE level (Keane et al. 2011), (Garver 1966).
Enhanced Linear Model
ELM The enhanced linear method (ELM) uses the properties of a linear combination of random variables to derive the moments of power flow variables in a probabilistic power flow framework.
May 14, 2013 24
W E S T E R N E L E C T R I C I T Y C O O R D I N A T I N G C O U N C I L • W W W . W E C C . B I Z 1 5 5 N O R T H 4 0 0 W E S T • S U I T E 2 0 0 • S A L T L A K E C I T Y • U T A H • 8 4 1 0 3 - 1 1 1 4 • P H 8 0 1 . 5 8 2 . 0 3 5 3
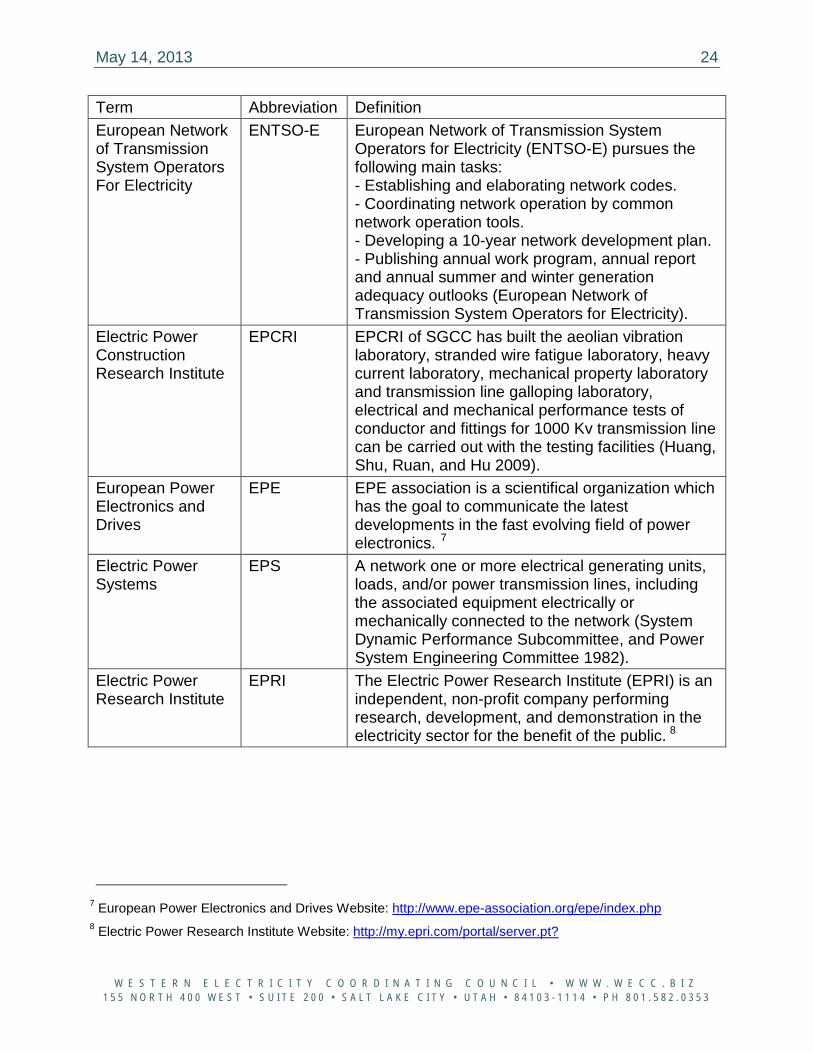
Term Abbreviation Definition European Network of Transmission System Operators For Electricity
ENTSO-E European Network of Transmission System Operators for Electricity (ENTSO-E) pursues the following main tasks: - Establishing and elaborating network codes. - Coordinating network operation by common network operation tools. - Developing a 10-year network development plan. - Publishing annual work program, annual report and annual summer and winter generation adequacy outlooks (European Network of Transmission System Operators for Electricity).
Electric Power Construction Research Institute
EPCRI EPCRI of SGCC has built the aeolian vibration laboratory, stranded wire fatigue laboratory, heavy current laboratory, mechanical property laboratory and transmission line galloping laboratory, electrical and mechanical performance tests of conductor and fittings for 1000 Kv transmission line can be carried out with the testing facilities (Huang, Shu, Ruan, and Hu 2009).
European Power Electronics and Drives
EPE EPE association is a scientifical organization which has the goal to communicate the latest developments in the fast evolving field of power electronics. 7
Electric Power Systems
EPS A network one or more electrical generating units, loads, and/or power transmission lines, including the associated equipment electrically or mechanically connected to the network (System Dynamic Performance Subcommittee, and Power System Engineering Committee 1982).
Electric Power Research Institute
EPRI The Electric Power Research Institute (EPRI) is an independent, non-profit company performing research, development, and demonstration in the electricity sector for the benefit of the public. 8
7 European Power Electronics and Drives Website: http://www.epe-association.org/epe/index.php 8 Electric Power Research Institute Website: http://my.epri.com/portal/server.pt?
May 14, 2013 25
W E S T E R N E L E C T R I C I T Y C O O R D I N A T I N G C O U N C I L • W W W . W E C C . B I Z 1 5 5 N O R T H 4 0 0 W E S T • S U I T E 2 0 0 • S A L T L A K E C I T Y • U T A H • 8 4 1 0 3 - 1 1 1 4 • P H 8 0 1 . 5 8 2 . 0 3 5 3
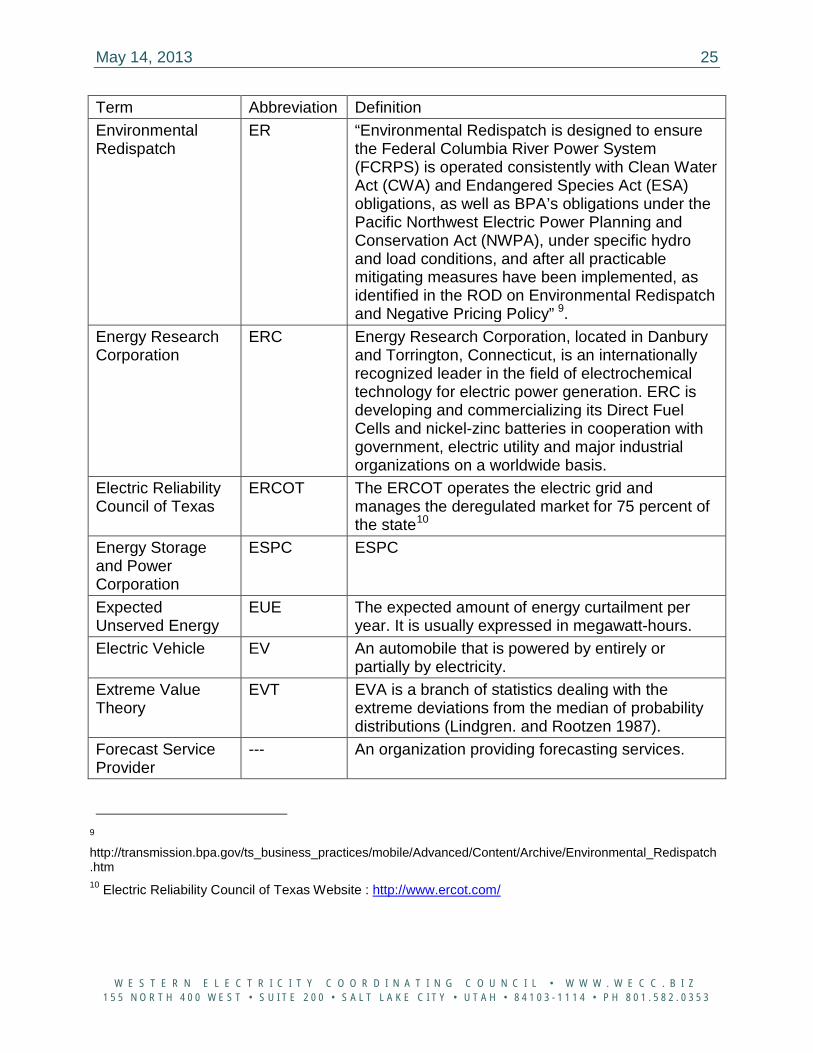
Term Abbreviation Definition Environmental Redispatch
ER “Environmental Redispatch is designed to ensure the Federal Columbia River Power System (FCRPS) is operated consistently with Clean Water Act (CWA) and Endangered Species Act (ESA) obligations, as well as BPA’s obligations under the Pacific Northwest Electric Power Planning and Conservation Act (NWPA), under specific hydro and load conditions, and after all practicable mitigating measures have been implemented, as identified in the ROD on Environmental Redispatch and Negative Pricing Policy” 9.
Energy Research Corporation
ERC Energy Research Corporation, located in Danbury and Torrington, Connecticut, is an internationally recognized leader in the field of electrochemical technology for electric power generation. ERC is developing and commercializing its Direct Fuel Cells and nickel-zinc batteries in cooperation with government, electric utility and major industrial organizations on a worldwide basis.
Electric Reliability Council of Texas
ERCOT The ERCOT operates the electric grid and manages the deregulated market for 75 percent of the state10
Energy Storage and Power Corporation
ESPC ESPC
Expected Unserved Energy
EUE The expected amount of energy curtailment per year. It is usually expressed in megawatt-hours.
Electric Vehicle EV An automobile that is powered by entirely or partially by electricity.
Extreme Value Theory
EVT EVA is a branch of statistics dealing with the extreme deviations from the median of probability distributions (Lindgren. and Rootzen 1987).
Forecast Service Provider
--- An organization providing forecasting services.
9 http://transmission.bpa.gov/ts_business_practices/mobile/Advanced/Content/Archive/Environmental_Redispatch.htm 10 Electric Reliability Council of Texas Website : http://www.ercot.com/
May 14, 2013 26
W E S T E R N E L E C T R I C I T Y C O O R D I N A T I N G C O U N C I L • W W W . W E C C . B I Z 1 5 5 N O R T H 4 0 0 W E S T • S U I T E 2 0 0 • S A L T L A K E C I T Y • U T A H • 8 4 1 0 3 - 1 1 1 4 • P H 8 0 1 . 5 8 2 . 0 3 5 3
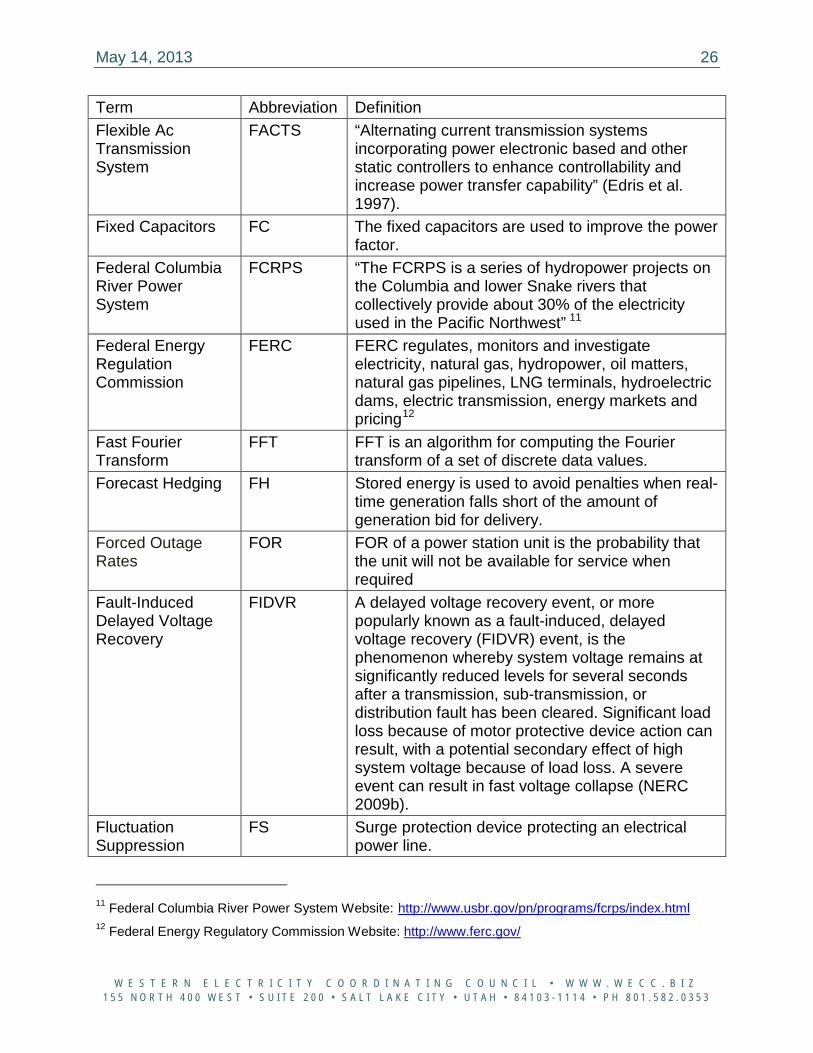
Term Abbreviation Definition Flexible Ac Transmission System
FACTS “Alternating current transmission systems incorporating power electronic based and other static controllers to enhance controllability and increase power transfer capability” (Edris et al. 1997).
Fixed Capacitors FC The fixed capacitors are used to improve the power factor.
Federal Columbia River Power System
FCRPS “The FCRPS is a series of hydropower projects on the Columbia and lower Snake rivers that collectively provide about 30% of the electricity used in the Pacific Northwest” 11
Federal Energy Regulation Commission
FERC FERC regulates, monitors and investigate electricity, natural gas, hydropower, oil matters, natural gas pipelines, LNG terminals, hydroelectric dams, electric transmission, energy markets and pricing12
Fast Fourier Transform
FFT FFT is an algorithm for computing the Fourier transform of a set of discrete data values.
Forecast Hedging FH Stored energy is used to avoid penalties when real-time generation falls short of the amount of generation bid for delivery.
Forced Outage Rates
FOR FOR of a power station unit is the probability that the unit will not be available for service when required
Fault-Induced Delayed Voltage Recovery
FIDVR A delayed voltage recovery event, or more popularly known as a fault-induced, delayed voltage recovery (FIDVR) event, is the phenomenon whereby system voltage remains at significantly reduced levels for several seconds after a transmission, sub-transmission, or distribution fault has been cleared. Significant load loss because of motor protective device action can result, with a potential secondary effect of high system voltage because of load loss. A severe event can result in fast voltage collapse (NERC 2009b).
Fluctuation Suppression
FS Surge protection device protecting an electrical power line.
11 Federal Columbia River Power System Website: http://www.usbr.gov/pn/programs/fcrps/index.html 12 Federal Energy Regulatory Commission Website: http://www.ferc.gov/
May 14, 2013 27
W E S T E R N E L E C T R I C I T Y C O O R D I N A T I N G C O U N C I L • W W W . W E C C . B I Z 1 5 5 N O R T H 4 0 0 W E S T • S U I T E 2 0 0 • S A L T L A K E C I T Y • U T A H • 8 4 1 0 3 - 1 1 1 4 • P H 8 0 1 . 5 8 2 . 0 3 5 3
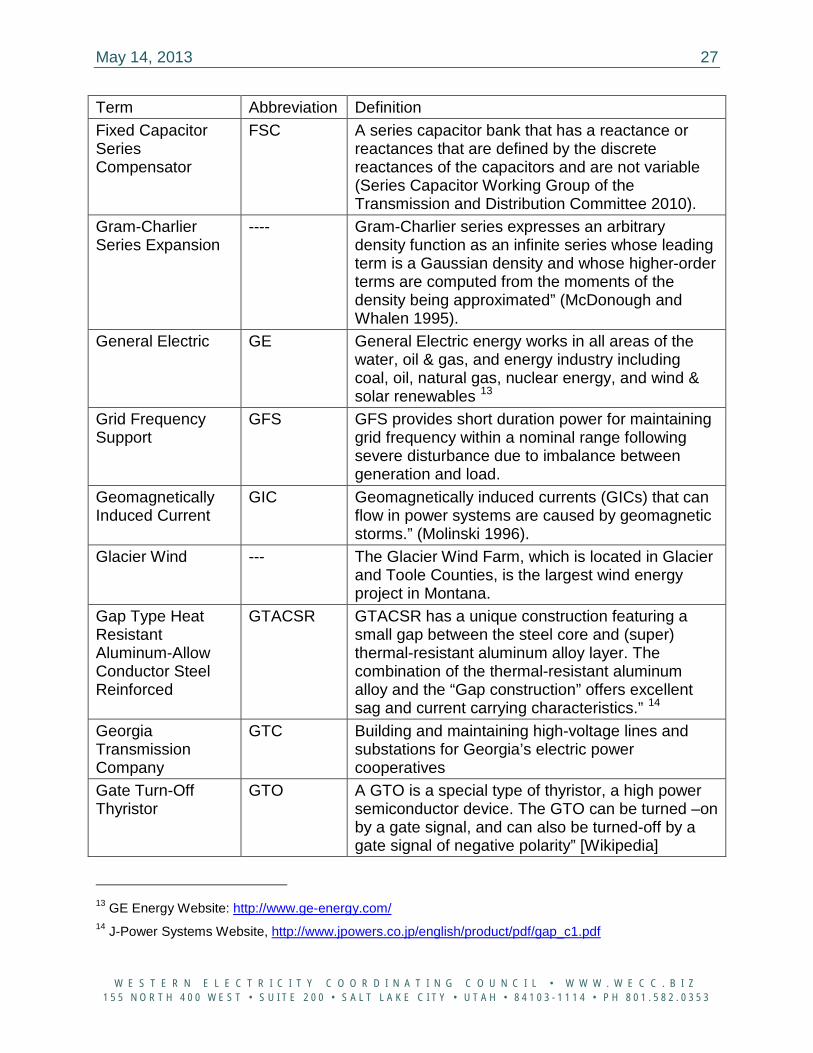
Term Abbreviation Definition Fixed Capacitor Series Compensator
FSC A series capacitor bank that has a reactance or reactances that are defined by the discrete reactances of the capacitors and are not variable (Series Capacitor Working Group of the Transmission and Distribution Committee 2010).
Gram-Charlier Series Expansion
---- Gram-Charlier series expresses an arbitrary density function as an infinite series whose leading term is a Gaussian density and whose higher-order terms are computed from the moments of the density being approximated” (McDonough and Whalen 1995).
General Electric GE General Electric energy works in all areas of the water, oil & gas, and energy industry including coal, oil, natural gas, nuclear energy, and wind & solar renewables 13
Grid Frequency Support
GFS GFS provides short duration power for maintaining grid frequency within a nominal range following severe disturbance due to imbalance between generation and load.
Geomagnetically Induced Current
GIC Geomagnetically induced currents (GICs) that can flow in power systems are caused by geomagnetic storms.” (Molinski 1996).
Glacier Wind --- The Glacier Wind Farm, which is located in Glacier and Toole Counties, is the largest wind energy project in Montana.
Gap Type Heat Resistant Aluminum-Allow Conductor Steel Reinforced
GTACSR GTACSR has a unique construction featuring a small gap between the steel core and (super) thermal-resistant aluminum alloy layer. The combination of the thermal-resistant aluminum alloy and the “Gap construction” offers excellent sag and current carrying characteristics.” 14
Georgia Transmission Company
GTC Building and maintaining high-voltage lines and substations for Georgia’s electric power cooperatives
Gate Turn-Off Thyristor
GTO A GTO is a special type of thyristor, a high power semiconductor device. The GTO can be turned –on by a gate signal, and can also be turned-off by a gate signal of negative polarity” [Wikipedia]
13 GE Energy Website: http://www.ge-energy.com/ 14 J-Power Systems Website, http://www.jpowers.co.jp/english/product/pdf/gap_c1.pdf
May 14, 2013 28
W E S T E R N E L E C T R I C I T Y C O O R D I N A T I N G C O U N C I L • W W W . W E C C . B I Z 1 5 5 N O R T H 4 0 0 W E S T • S U I T E 2 0 0 • S A L T L A K E C I T Y • U T A H • 8 4 1 0 3 - 1 1 1 4 • P H 8 0 1 . 5 8 2 . 0 3 5 3
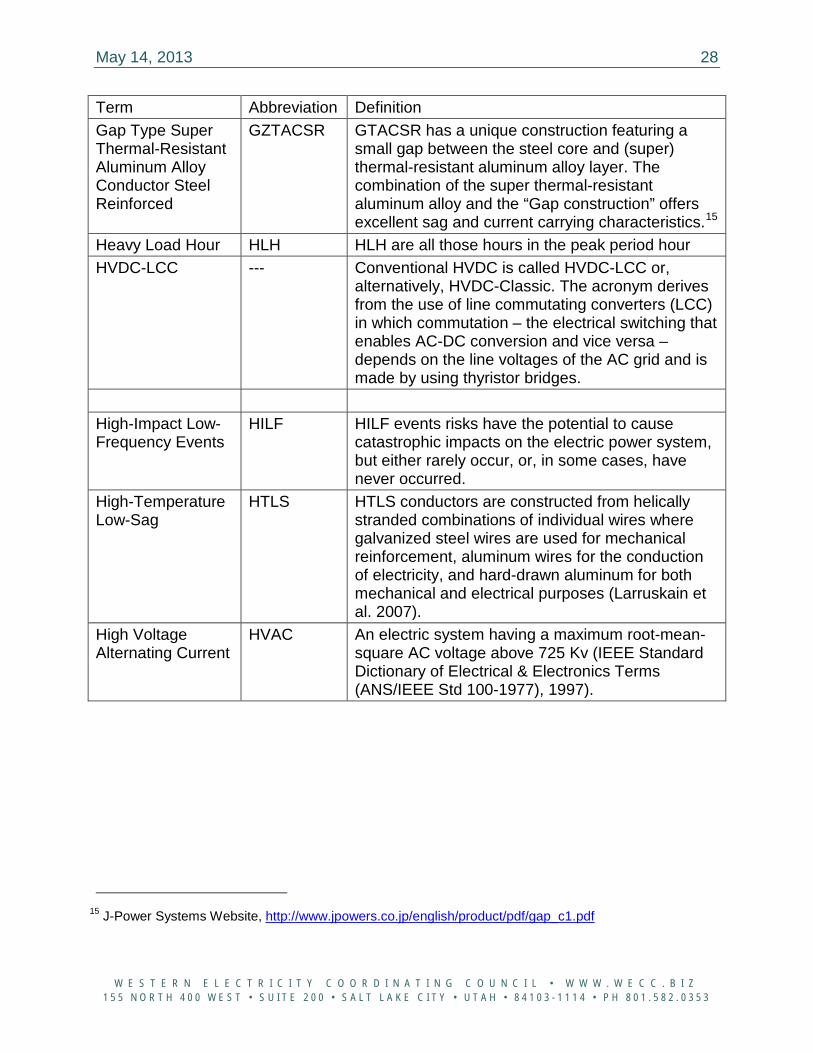
Term Abbreviation Definition Gap Type Super Thermal-Resistant Aluminum Alloy Conductor Steel Reinforced
GZTACSR GTACSR has a unique construction featuring a small gap between the steel core and (super) thermal-resistant aluminum alloy layer. The combination of the super thermal-resistant aluminum alloy and the “Gap construction” offers excellent sag and current carrying characteristics.15
Heavy Load Hour HLH HLH are all those hours in the peak period hour HVDC-LCC --- Conventional HVDC is called HVDC-LCC or,
alternatively, HVDC-Classic. The acronym derives from the use of line commutating converters (LCC) in which commutation – the electrical switching that enables AC-DC conversion and vice versa – depends on the line voltages of the AC grid and is made by using thyristor bridges.
High-Impact Low-Frequency Events
HILF HILF events risks have the potential to cause catastrophic impacts on the electric power system, but either rarely occur, or, in some cases, have never occurred.
High-Temperature Low-Sag
HTLS HTLS conductors are constructed from helically stranded combinations of individual wires where galvanized steel wires are used for mechanical reinforcement, aluminum wires for the conduction of electricity, and hard-drawn aluminum for both mechanical and electrical purposes (Larruskain et al. 2007).
High Voltage Alternating Current
HVAC An electric system having a maximum root-mean-square AC voltage above 725 Kv (IEEE Standard Dictionary of Electrical & Electronics Terms (ANS/IEEE Std 100-1977), 1997).
15 J-Power Systems Website, http://www.jpowers.co.jp/english/product/pdf/gap_c1.pdf
May 14, 2013 29
W E S T E R N E L E C T R I C I T Y C O O R D I N A T I N G C O U N C I L • W W W . W E C C . B I Z 1 5 5 N O R T H 4 0 0 W E S T • S U I T E 2 0 0 • S A L T L A K E C I T Y • U T A H • 8 4 1 0 3 - 1 1 1 4 • P H 8 0 1 . 5 8 2 . 0 3 5 3
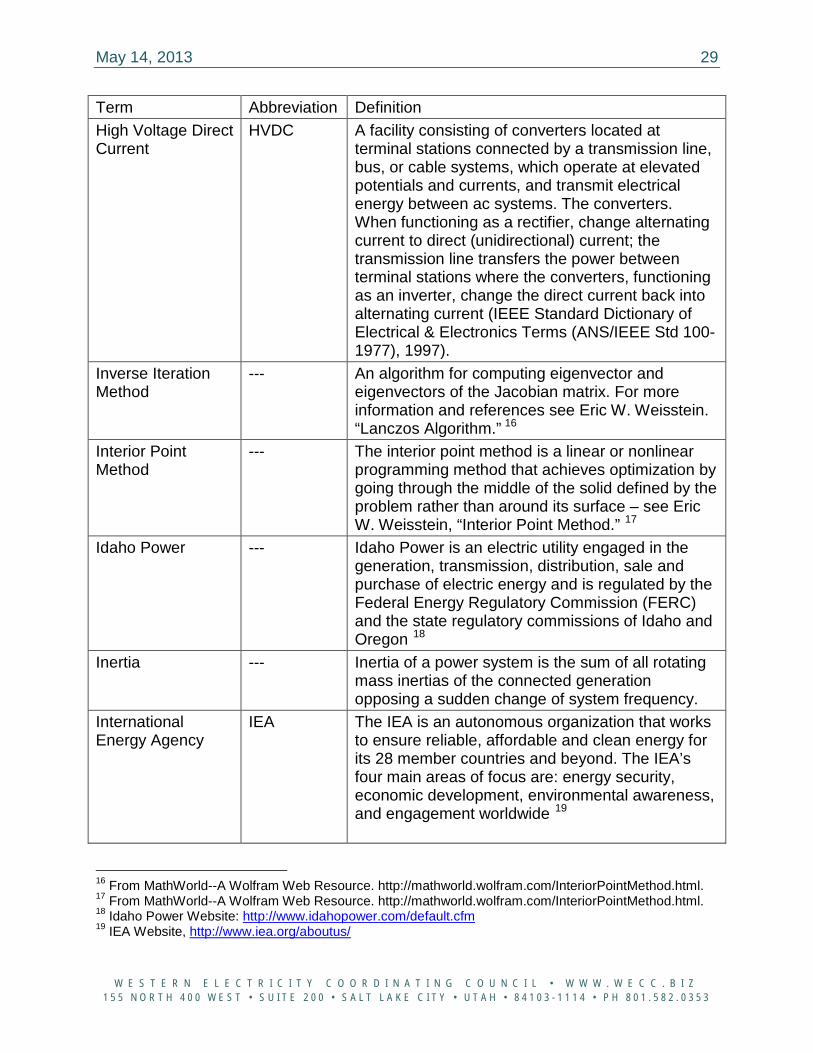
Term Abbreviation Definition High Voltage Direct Current
HVDC A facility consisting of converters located at terminal stations connected by a transmission line, bus, or cable systems, which operate at elevated potentials and currents, and transmit electrical energy between ac systems. The converters. When functioning as a rectifier, change alternating current to direct (unidirectional) current; the transmission line transfers the power between terminal stations where the converters, functioning as an inverter, change the direct current back into alternating current (IEEE Standard Dictionary of Electrical & Electronics Terms (ANS/IEEE Std 100-1977), 1997).
Inverse Iteration Method
--- An algorithm for computing eigenvector and eigenvectors of the Jacobian matrix. For more information and references see Eric W. Weisstein. “Lanczos Algorithm.” 16
Interior Point Method
--- The interior point method is a linear or nonlinear programming method that achieves optimization by going through the middle of the solid defined by the problem rather than around its surface – see Eric W. Weisstein, “Interior Point Method.” 17
Idaho Power --- Idaho Power is an electric utility engaged in the generation, transmission, distribution, sale and purchase of electric energy and is regulated by the Federal Energy Regulatory Commission (FERC) and the state regulatory commissions of Idaho and Oregon 18
Inertia --- Inertia of a power system is the sum of all rotating mass inertias of the connected generation opposing a sudden change of system frequency.
International Energy Agency
IEA The IEA is an autonomous organization that works to ensure reliable, affordable and clean energy for its 28 member countries and beyond. The IEA’s four main areas of focus are: energy security, economic development, environmental awareness, and engagement worldwide 19
16 From MathWorld--A Wolfram Web Resource. http://mathworld.wolfram.com/InteriorPointMethod.html. 17 From MathWorld--A Wolfram Web Resource. http://mathworld.wolfram.com/InteriorPointMethod.html. 18 Idaho Power Website: http://www.idahopower.com/default.cfm 19 IEA Website, http://www.iea.org/aboutus/
May 14, 2013 30
W E S T E R N E L E C T R I C I T Y C O O R D I N A T I N G C O U N C I L • W W W . W E C C . B I Z 1 5 5 N O R T H 4 0 0 W E S T • S U I T E 2 0 0 • S A L T L A K E C I T Y • U T A H • 8 4 1 0 3 - 1 1 1 4 • P H 8 0 1 . 5 8 2 . 0 3 5 3
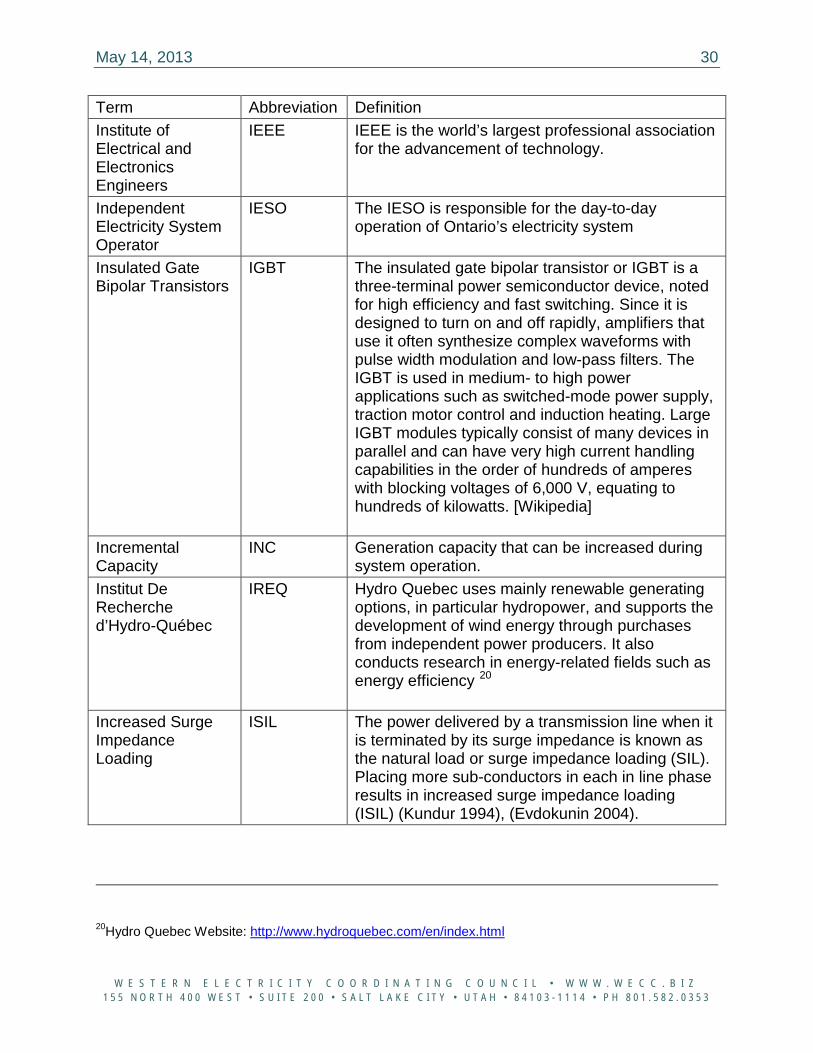
Term Abbreviation Definition Institute of Electrical and Electronics Engineers
IEEE IEEE is the world’s largest professional association for the advancement of technology.
Independent Electricity System Operator
IESO The IESO is responsible for the day-to-day operation of Ontario’s electricity system
Insulated Gate Bipolar Transistors
IGBT The insulated gate bipolar transistor or IGBT is a three-terminal power semiconductor device, noted for high efficiency and fast switching. Since it is designed to turn on and off rapidly, amplifiers that use it often synthesize complex waveforms with pulse width modulation and low-pass filters. The IGBT is used in medium- to high power applications such as switched-mode power supply, traction motor control and induction heating. Large IGBT modules typically consist of many devices in parallel and can have very high current handling capabilities in the order of hundreds of amperes with blocking voltages of 6,000 V, equating to hundreds of kilowatts. [Wikipedia]
Incremental Capacity
INC Generation capacity that can be increased during system operation.
Institut De Recherche d’Hydro-Québec
IREQ Hydro Quebec uses mainly renewable generating options, in particular hydropower, and supports the development of wind energy through purchases from independent power producers. It also conducts research in energy-related fields such as energy efficiency 20
Increased Surge Impedance Loading
ISIL The power delivered by a transmission line when it is terminated by its surge impedance is known as the natural load or surge impedance loading (SIL). Placing more sub-conductors in each in line phase results in increased surge impedance loading (ISIL) (Kundur 1994), (Evdokunin 2004).
20Hydro Quebec Website: http://www.hydroquebec.com/en/index.html
May 14, 2013 31
W E S T E R N E L E C T R I C I T Y C O O R D I N A T I N G C O U N C I L • W W W . W E C C . B I Z 1 5 5 N O R T H 4 0 0 W E S T • S U I T E 2 0 0 • S A L T L A K E C I T Y • U T A H • 8 4 1 0 3 - 1 1 1 4 • P H 8 0 1 . 5 8 2 . 0 3 5 3
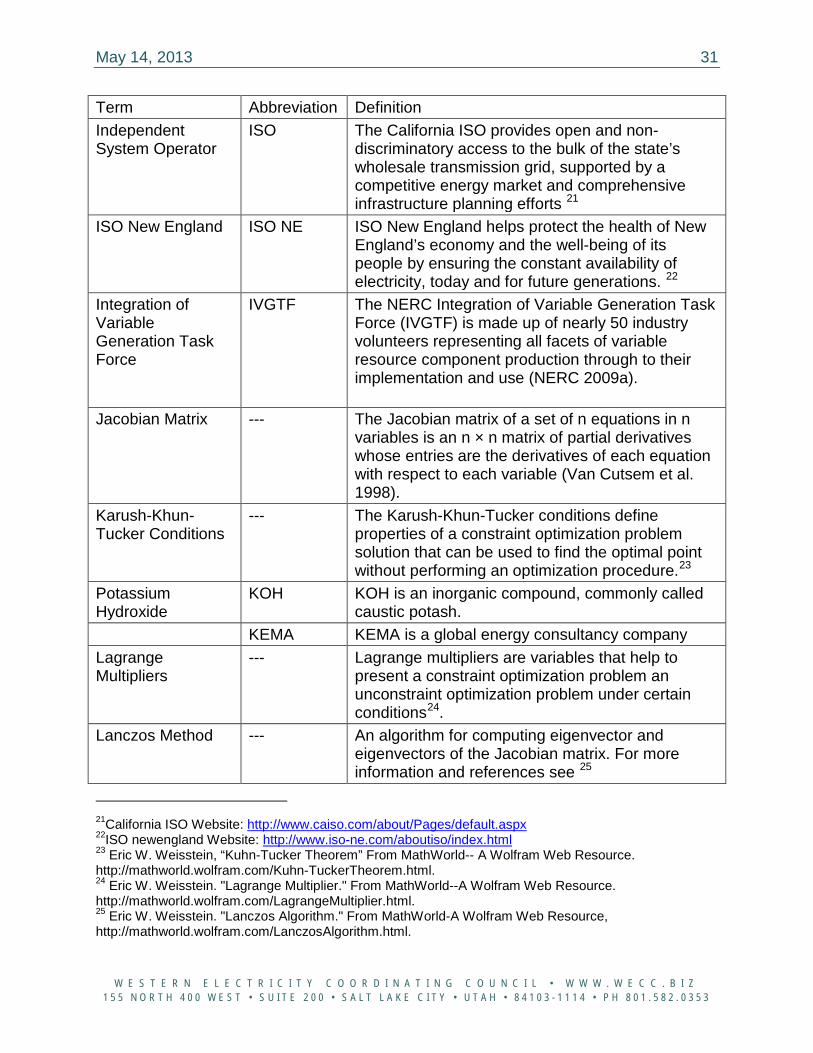
Term Abbreviation Definition Independent System Operator
ISO The California ISO provides open and non- discriminatory access to the bulk of the state’s wholesale transmission grid, supported by a competitive energy market and comprehensive infrastructure planning efforts 21
ISO New England ISO NE ISO New England helps protect the health of New England’s economy and the well-being of its people by ensuring the constant availability of electricity, today and for future generations. 22
Integration of Variable Generation Task Force
IVGTF The NERC Integration of Variable Generation Task Force (IVGTF) is made up of nearly 50 industry volunteers representing all facets of variable resource component production through to their implementation and use (NERC 2009a).
Jacobian Matrix --- The Jacobian matrix of a set of n equations in n variables is an n × n matrix of partial derivatives whose entries are the derivatives of each equation with respect to each variable (Van Cutsem et al. 1998).
Karush-Khun-Tucker Conditions
--- The Karush-Khun-Tucker conditions define properties of a constraint optimization problem solution that can be used to find the optimal point without performing an optimization procedure.23
Potassium Hydroxide
KOH KOH is an inorganic compound, commonly called caustic potash.
KEMA KEMA is a global energy consultancy company Lagrange Multipliers
--- Lagrange multipliers are variables that help to present a constraint optimization problem an unconstraint optimization problem under certain conditions24.
Lanczos Method --- An algorithm for computing eigenvector and eigenvectors of the Jacobian matrix. For more information and references see 25
21California ISO Website: http://www.caiso.com/about/Pages/default.aspx 22ISO newengland Website: http://www.iso-ne.com/aboutiso/index.html 23 Eric W. Weisstein, “Kuhn-Tucker Theorem” From MathWorld-- A Wolfram Web Resource. http://mathworld.wolfram.com/Kuhn-TuckerTheorem.html. 24 Eric W. Weisstein. "Lagrange Multiplier." From MathWorld--A Wolfram Web Resource. http://mathworld.wolfram.com/LagrangeMultiplier.html. 25 Eric W. Weisstein. "Lanczos Algorithm." From MathWorld-A Wolfram Web Resource, http://mathworld.wolfram.com/LanczosAlgorithm.html.
May 14, 2013 32
W E S T E R N E L E C T R I C I T Y C O O R D I N A T I N G C O U N C I L • W W W . W E C C . B I Z 1 5 5 N O R T H 4 0 0 W E S T • S U I T E 2 0 0 • S A L T L A K E C I T Y • U T A H • 8 4 1 0 3 - 1 1 1 4 • P H 8 0 1 . 5 8 2 . 0 3 5 3
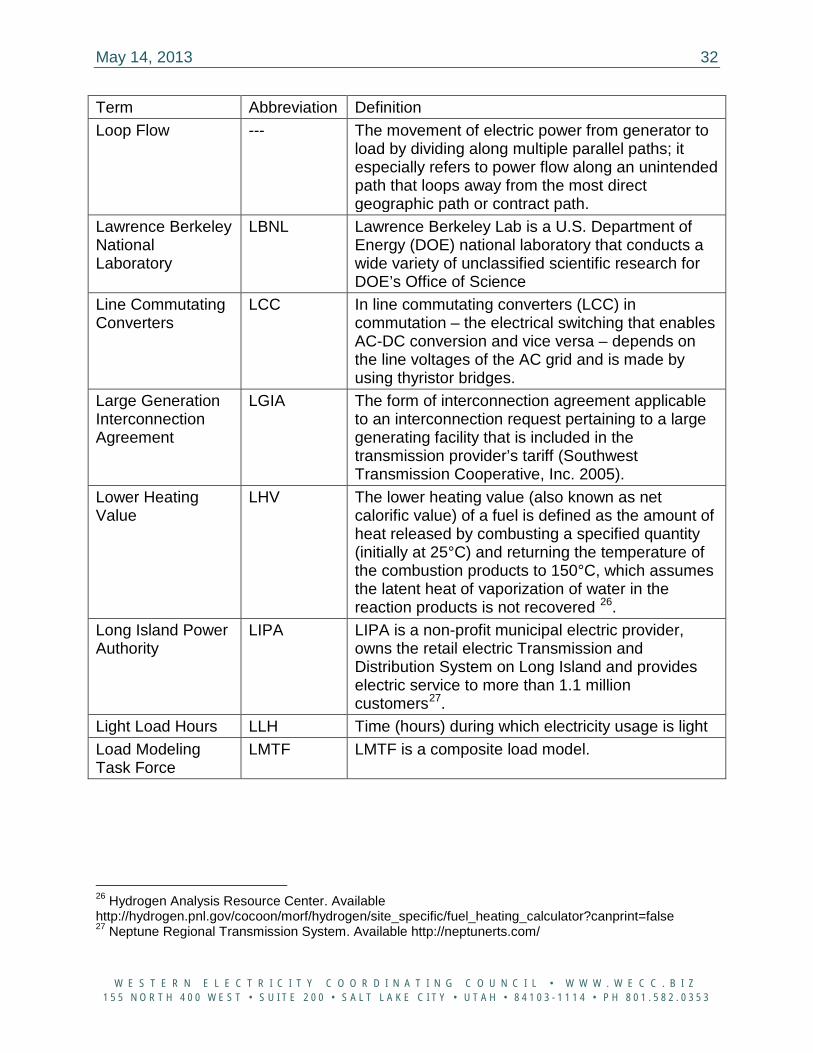
Term Abbreviation Definition Loop Flow --- The movement of electric power from generator to
load by dividing along multiple parallel paths; it especially refers to power flow along an unintended path that loops away from the most direct geographic path or contract path.
Lawrence Berkeley National Laboratory
LBNL Lawrence Berkeley Lab is a U.S. Department of Energy (DOE) national laboratory that conducts a wide variety of unclassified scientific research for DOE’s Office of Science
Line Commutating Converters
LCC In line commutating converters (LCC) in commutation – the electrical switching that enables AC-DC conversion and vice versa – depends on the line voltages of the AC grid and is made by using thyristor bridges.
Large Generation Interconnection Agreement
LGIA The form of interconnection agreement applicable to an interconnection request pertaining to a large generating facility that is included in the transmission provider’s tariff (Southwest Transmission Cooperative, Inc. 2005).
Lower Heating Value
LHV The lower heating value (also known as net calorific value) of a fuel is defined as the amount of heat released by combusting a specified quantity (initially at 25°C) and returning the temperature of the combustion products to 150°C, which assumes the latent heat of vaporization of water in the reaction products is not recovered 26.
Long Island Power Authority
LIPA LIPA is a non-profit municipal electric provider, owns the retail electric Transmission and Distribution System on Long Island and provides electric service to more than 1.1 million customers27.
Light Load Hours LLH Time (hours) during which electricity usage is light Load Modeling Task Force
LMTF LMTF is a composite load model.
26 Hydrogen Analysis Resource Center. Available http://hydrogen.pnl.gov/cocoon/morf/hydrogen/site_specific/fuel_heating_calculator?canprint=false 27 Neptune Regional Transmission System. Available http://neptunerts.com/
May 14, 2013 33
W E S T E R N E L E C T R I C I T Y C O O R D I N A T I N G C O U N C I L • W W W . W E C C . B I Z 1 5 5 N O R T H 4 0 0 W E S T • S U I T E 2 0 0 • S A L T L A K E C I T Y • U T A H • 8 4 1 0 3 - 1 1 1 4 • P H 8 0 1 . 5 8 2 . 0 3 5 3
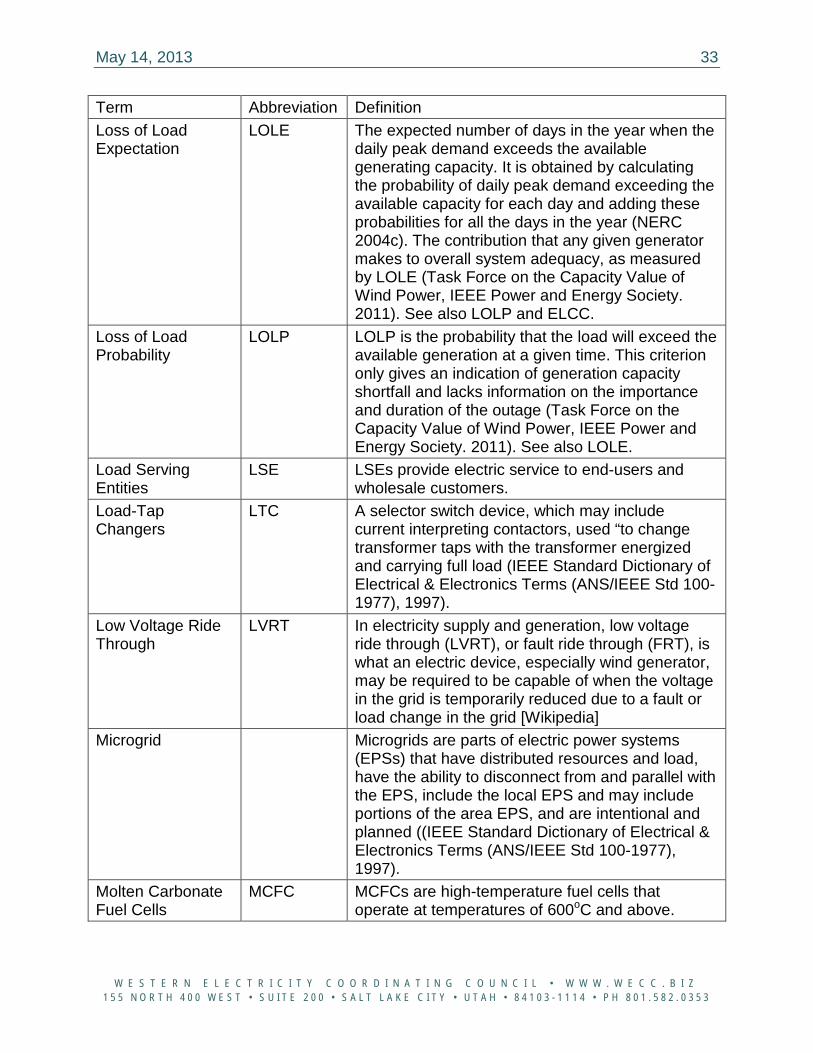
Term Abbreviation Definition Loss of Load Expectation
LOLE The expected number of days in the year when the daily peak demand exceeds the available generating capacity. It is obtained by calculating the probability of daily peak demand exceeding the available capacity for each day and adding these probabilities for all the days in the year (NERC 2004c). The contribution that any given generator makes to overall system adequacy, as measured by LOLE (Task Force on the Capacity Value of Wind Power, IEEE Power and Energy Society. 2011). See also LOLP and ELCC.
Loss of Load Probability
LOLP LOLP is the probability that the load will exceed the available generation at a given time. This criterion only gives an indication of generation capacity shortfall and lacks information on the importance and duration of the outage (Task Force on the Capacity Value of Wind Power, IEEE Power and Energy Society. 2011). See also LOLE.
Load Serving Entities
LSE LSEs provide electric service to end-users and wholesale customers.
Load-Tap Changers
LTC A selector switch device, which may include current interpreting contactors, used “to change transformer taps with the transformer energized and carrying full load (IEEE Standard Dictionary of Electrical & Electronics Terms (ANS/IEEE Std 100-1977), 1997).
Low Voltage Ride Through
LVRT In electricity supply and generation, low voltage ride through (LVRT), or fault ride through (FRT), is what an electric device, especially wind generator, may be required to be capable of when the voltage in the grid is temporarily reduced due to a fault or load change in the grid [Wikipedia]
Microgrid Microgrids are parts of electric power systems (EPSs) that have distributed resources and load, have the ability to disconnect from and parallel with the EPS, include the local EPS and may include portions of the area EPS, and are intentional and planned ((IEEE Standard Dictionary of Electrical & Electronics Terms (ANS/IEEE Std 100-1977), 1997).
Molten Carbonate Fuel Cells
MCFC MCFCs are high-temperature fuel cells that operate at temperatures of 600oC and above.
May 14, 2013 34
W E S T E R N E L E C T R I C I T Y C O O R D I N A T I N G C O U N C I L • W W W . W E C C . B I Z 1 5 5 N O R T H 4 0 0 W E S T • S U I T E 2 0 0 • S A L T L A K E C I T Y • U T A H • 8 4 1 0 3 - 1 1 1 4 • P H 8 0 1 . 5 8 2 . 0 3 5 3
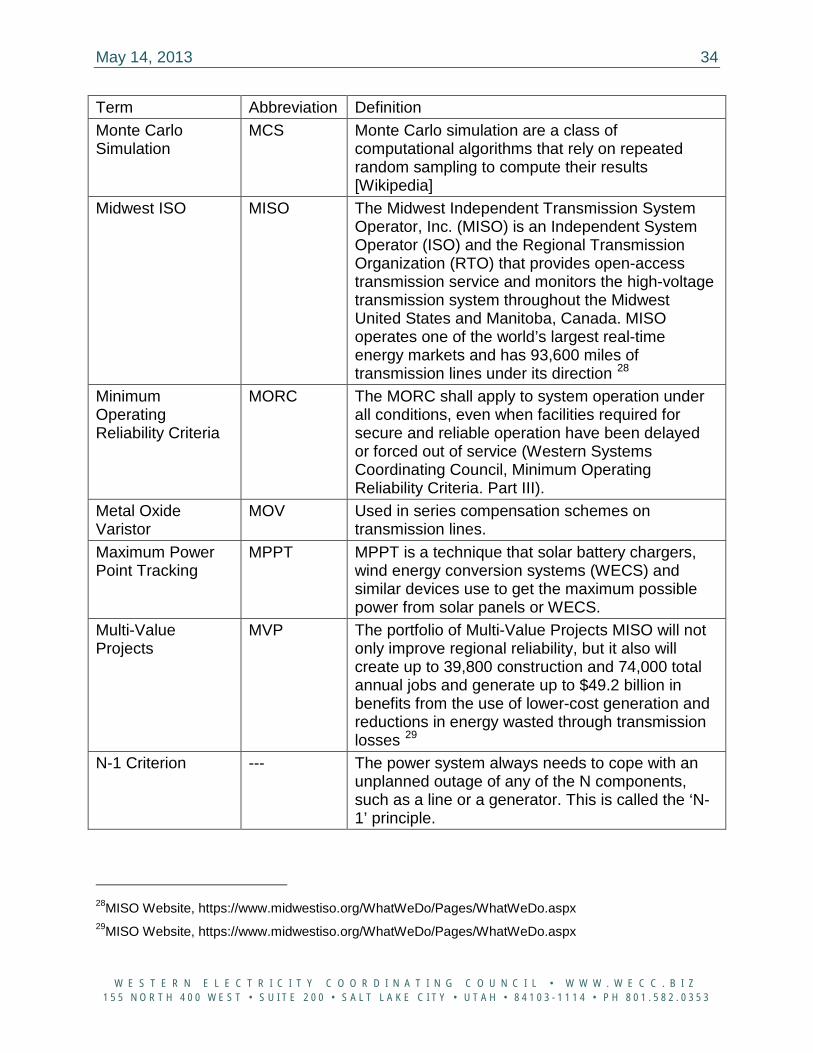
Term Abbreviation Definition Monte Carlo Simulation
MCS Monte Carlo simulation are a class of computational algorithms that rely on repeated random sampling to compute their results [Wikipedia]
Midwest ISO MISO The Midwest Independent Transmission System Operator, Inc. (MISO) is an Independent System Operator (ISO) and the Regional Transmission Organization (RTO) that provides open-access transmission service and monitors the high-voltage transmission system throughout the Midwest United States and Manitoba, Canada. MISO operates one of the world’s largest real-time energy markets and has 93,600 miles of transmission lines under its direction 28
Minimum Operating Reliability Criteria
MORC The MORC shall apply to system operation under all conditions, even when facilities required for secure and reliable operation have been delayed or forced out of service (Western Systems Coordinating Council, Minimum Operating Reliability Criteria. Part III).
Metal Oxide Varistor
MOV Used in series compensation schemes on transmission lines.
Maximum Power Point Tracking
MPPT MPPT is a technique that solar battery chargers, wind energy conversion systems (WECS) and similar devices use to get the maximum possible power from solar panels or WECS.
Multi-Value Projects
MVP The portfolio of Multi-Value Projects MISO will not only improve regional reliability, but it also will create up to 39,800 construction and 74,000 total annual jobs and generate up to $49.2 billion in benefits from the use of lower-cost generation and reductions in energy wasted through transmission losses 29
N-1 Criterion --- The power system always needs to cope with an unplanned outage of any of the N components, such as a line or a generator. This is called the ‘N-1’ principle.
28MISO Website, https://www.midwestiso.org/WhatWeDo/Pages/WhatWeDo.aspx 29MISO Website, https://www.midwestiso.org/WhatWeDo/Pages/WhatWeDo.aspx
May 14, 2013 35
W E S T E R N E L E C T R I C I T Y C O O R D I N A T I N G C O U N C I L • W W W . W E C C . B I Z 1 5 5 N O R T H 4 0 0 W E S T • S U I T E 2 0 0 • S A L T L A K E C I T Y • U T A H • 8 4 1 0 3 - 1 1 1 4 • P H 8 0 1 . 5 8 2 . 0 3 5 3
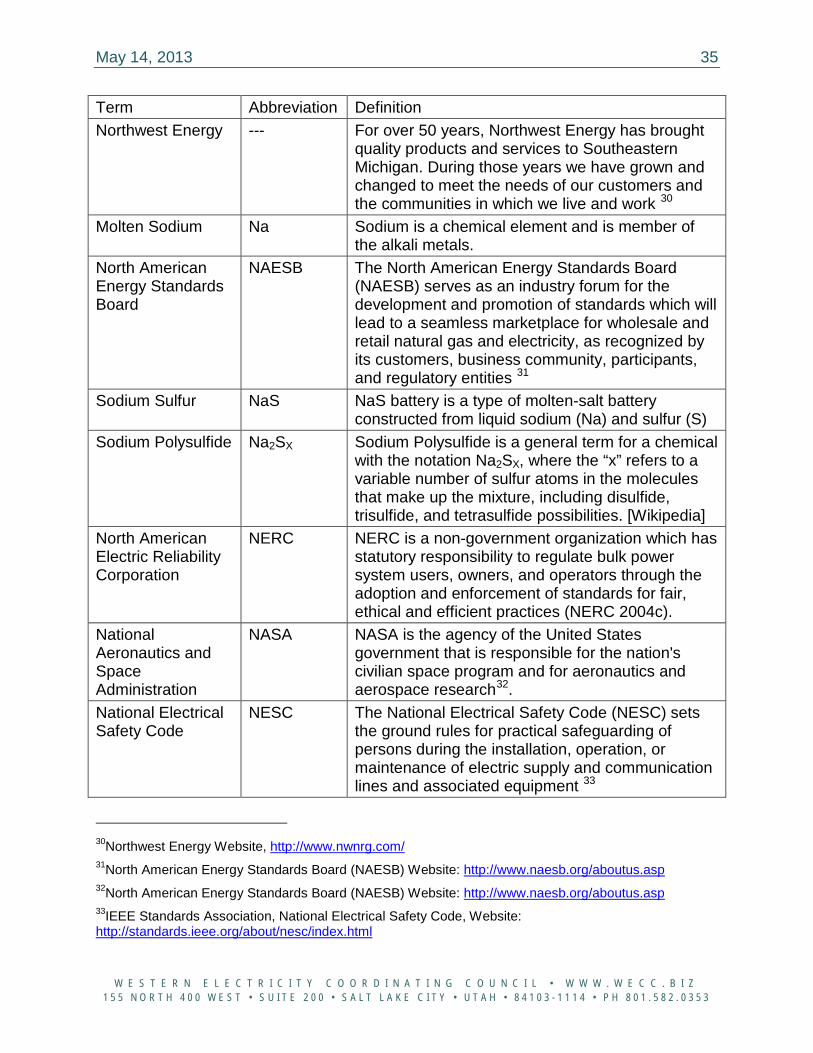
Term Abbreviation Definition Northwest Energy --- For over 50 years, Northwest Energy has brought
quality products and services to Southeastern Michigan. During those years we have grown and changed to meet the needs of our customers and the communities in which we live and work 30
Molten Sodium Na Sodium is a chemical element and is member of the alkali metals.
North American Energy Standards Board
NAESB The North American Energy Standards Board (NAESB) serves as an industry forum for the development and promotion of standards which will lead to a seamless marketplace for wholesale and retail natural gas and electricity, as recognized by its customers, business community, participants, and regulatory entities 31
Sodium Sulfur NaS NaS battery is a type of molten-salt battery constructed from liquid sodium (Na) and sulfur (S)
Sodium Polysulfide Na2SX Sodium Polysulfide is a general term for a chemical with the notation Na2SX, where the “x” refers to a variable number of sulfur atoms in the molecules that make up the mixture, including disulfide, trisulfide, and tetrasulfide possibilities. [Wikipedia]
North American Electric Reliability Corporation
NERC NERC is a non-government organization which has statutory responsibility to regulate bulk power system users, owners, and operators through the adoption and enforcement of standards for fair, ethical and efficient practices (NERC 2004c).
National Aeronautics and Space Administration
NASA NASA is the agency of the United States government that is responsible for the nation's civilian space program and for aeronautics and aerospace research32.
National Electrical Safety Code
NESC The National Electrical Safety Code (NESC) sets the ground rules for practical safeguarding of persons during the installation, operation, or maintenance of electric supply and communication lines and associated equipment 33
30Northwest Energy Website, http://www.nwnrg.com/ 31North American Energy Standards Board (NAESB) Website: http://www.naesb.org/aboutus.asp 32North American Energy Standards Board (NAESB) Website: http://www.naesb.org/aboutus.asp 33IEEE Standards Association, National Electrical Safety Code, Website: http://standards.ieee.org/about/nesc/index.html
May 14, 2013 36
W E S T E R N E L E C T R I C I T Y C O O R D I N A T I N G C O U N C I L • W W W . W E C C . B I Z 1 5 5 N O R T H 4 0 0 W E S T • S U I T E 2 0 0 • S A L T L A K E C I T Y • U T A H • 8 4 1 0 3 - 1 1 1 4 • P H 8 0 1 . 5 8 2 . 0 3 5 3
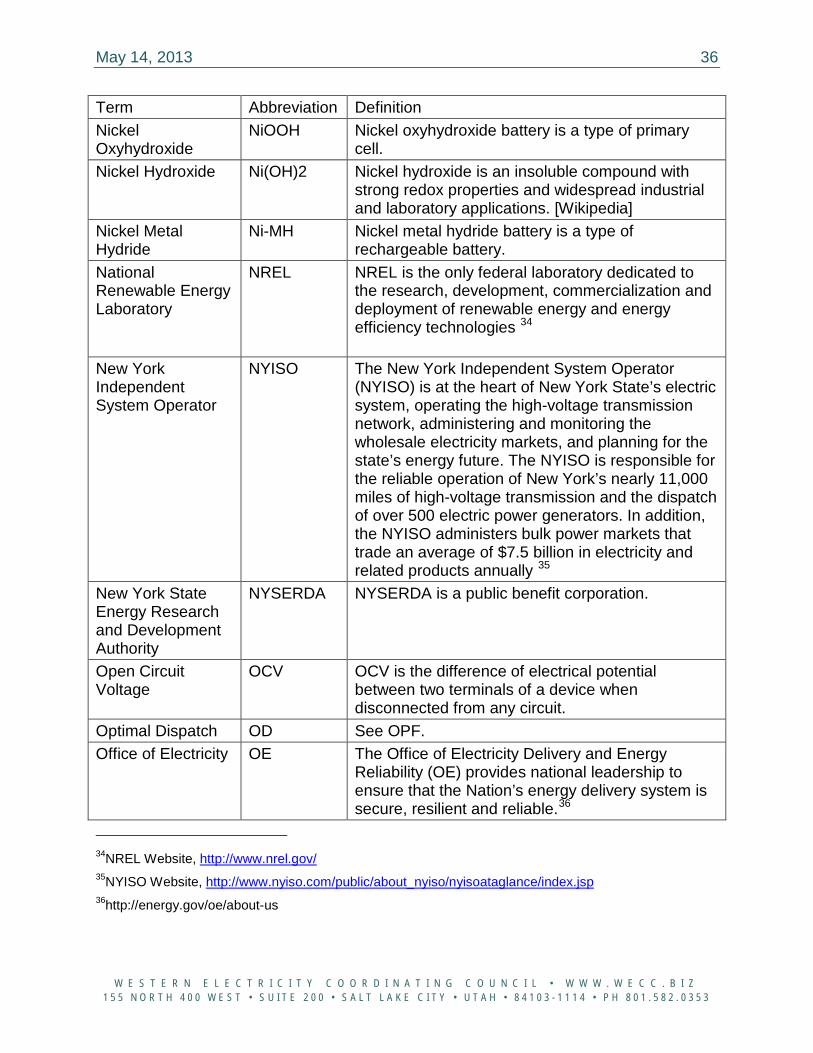
Term Abbreviation Definition Nickel Oxyhydroxide
NiOOH Nickel oxyhydroxide battery is a type of primary cell.
Nickel Hydroxide Ni(OH)2 Nickel hydroxide is an insoluble compound with strong redox properties and widespread industrial and laboratory applications. [Wikipedia]
Nickel Metal Hydride
Ni-MH Nickel metal hydride battery is a type of rechargeable battery.
National Renewable Energy Laboratory
NREL NREL is the only federal laboratory dedicated to the research, development, commercialization and deployment of renewable energy and energy efficiency technologies 34
New York Independent System Operator
NYISO The New York Independent System Operator (NYISO) is at the heart of New York State’s electric system, operating the high-voltage transmission network, administering and monitoring the wholesale electricity markets, and planning for the state’s energy future. The NYISO is responsible for the reliable operation of New York’s nearly 11,000 miles of high-voltage transmission and the dispatch of over 500 electric power generators. In addition, the NYISO administers bulk power markets that trade an average of $7.5 billion in electricity and related products annually 35
New York State Energy Research and Development Authority
NYSERDA NYSERDA is a public benefit corporation.
Open Circuit Voltage
OCV OCV is the difference of electrical potential between two terminals of a device when disconnected from any circuit.
Optimal Dispatch OD See OPF. Office of Electricity OE The Office of Electricity Delivery and Energy
Reliability (OE) provides national leadership to ensure that the Nation’s energy delivery system is secure, resilient and reliable.36
34NREL Website, http://www.nrel.gov/ 35NYISO Website, http://www.nyiso.com/public/about_nyiso/nyisoataglance/index.jsp 36http://energy.gov/oe/about-us
May 14, 2013 37
W E S T E R N E L E C T R I C I T Y C O O R D I N A T I N G C O U N C I L • W W W . W E C C . B I Z 1 5 5 N O R T H 4 0 0 W E S T • S U I T E 2 0 0 • S A L T L A K E C I T Y • U T A H • 8 4 1 0 3 - 1 1 1 4 • P H 8 0 1 . 5 8 2 . 0 3 5 3
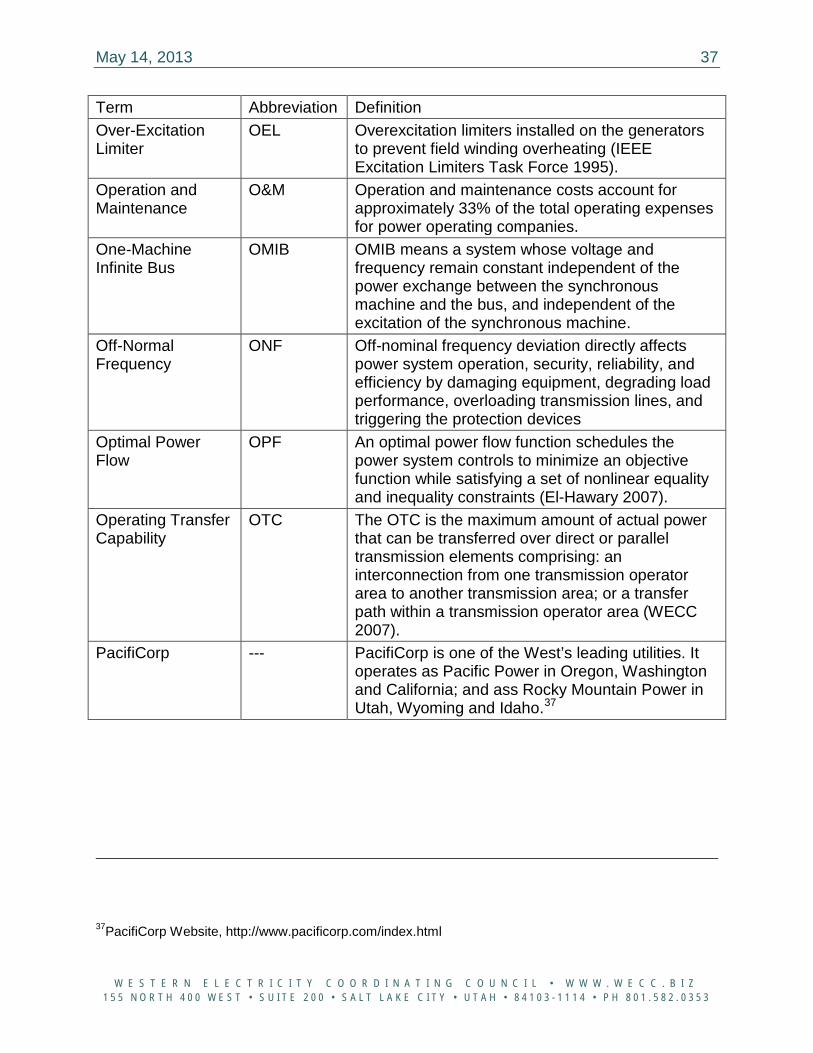
Term Abbreviation Definition Over-Excitation Limiter
OEL Overexcitation limiters installed on the generators to prevent field winding overheating (IEEE Excitation Limiters Task Force 1995).
Operation and Maintenance
O&M Operation and maintenance costs account for approximately 33% of the total operating expenses for power operating companies.
One-Machine Infinite Bus
OMIB OMIB means a system whose voltage and frequency remain constant independent of the power exchange between the synchronous machine and the bus, and independent of the excitation of the synchronous machine.
Off-Normal Frequency
ONF Off-nominal frequency deviation directly affects power system operation, security, reliability, and efficiency by damaging equipment, degrading load performance, overloading transmission lines, and triggering the protection devices
Optimal Power Flow
OPF An optimal power flow function schedules the power system controls to minimize an objective function while satisfying a set of nonlinear equality and inequality constraints (El-Hawary 2007).
Operating Transfer Capability
OTC The OTC is the maximum amount of actual power that can be transferred over direct or parallel transmission elements comprising: an interconnection from one transmission operator area to another transmission area; or a transfer path within a transmission operator area (WECC 2007).
PacifiCorp --- PacifiCorp is one of the West’s leading utilities. It operates as Pacific Power in Oregon, Washington and California; and ass Rocky Mountain Power in Utah, Wyoming and Idaho.37
37PacifiCorp Website, http://www.pacificorp.com/index.html
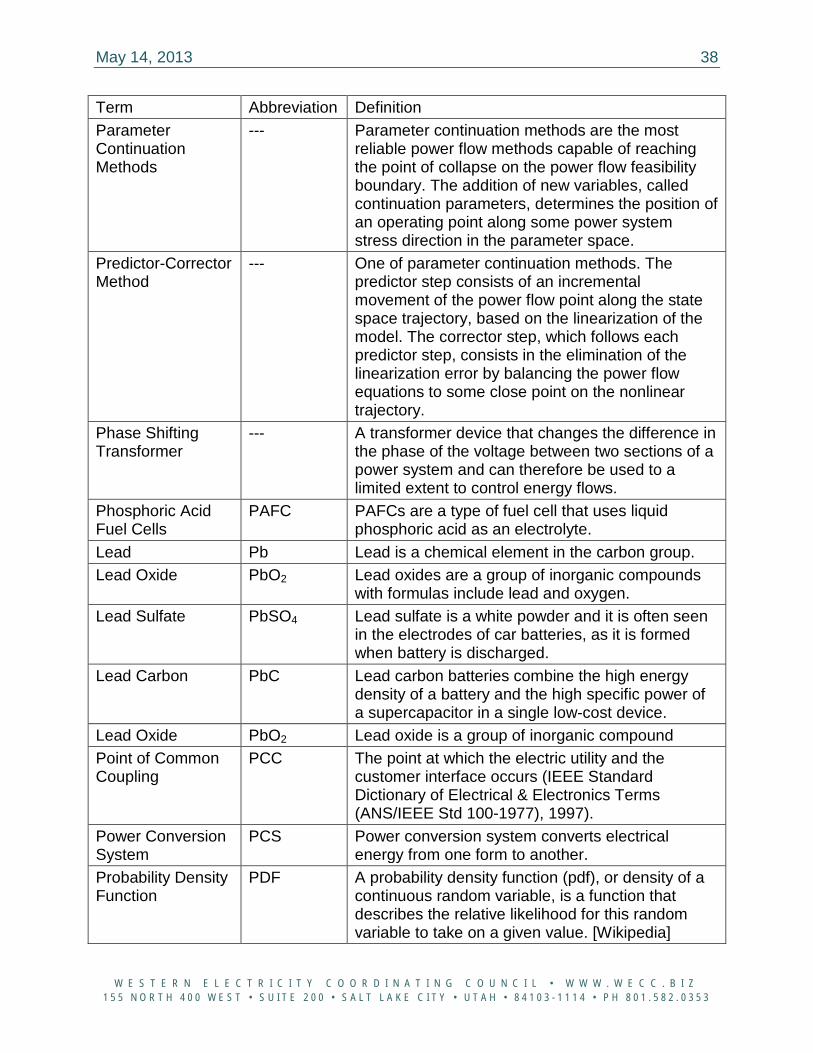
May 14, 2013 38
W E S T E R N E L E C T R I C I T Y C O O R D I N A T I N G C O U N C I L • W W W . W E C C . B I Z 1 5 5 N O R T H 4 0 0 W E S T • S U I T E 2 0 0 • S A L T L A K E C I T Y • U T A H • 8 4 1 0 3 - 1 1 1 4 • P H 8 0 1 . 5 8 2 . 0 3 5 3
Term Abbreviation Definition Parameter Continuation Methods
--- Parameter continuation methods are the most reliable power flow methods capable of reaching the point of collapse on the power flow feasibility boundary. The addition of new variables, called continuation parameters, determines the position of an operating point along some power system stress direction in the parameter space.
Predictor-Corrector Method
--- One of parameter continuation methods. The predictor step consists of an incremental movement of the power flow point along the state space trajectory, based on the linearization of the model. The corrector step, which follows each predictor step, consists in the elimination of the linearization error by balancing the power flow equations to some close point on the nonlinear trajectory.
Phase Shifting Transformer
--- A transformer device that changes the difference in the phase of the voltage between two sections of a power system and can therefore be used to a limited extent to control energy flows.
Phosphoric Acid Fuel Cells
PAFC PAFCs are a type of fuel cell that uses liquid phosphoric acid as an electrolyte.
Lead Pb Lead is a chemical element in the carbon group. Lead Oxide PbO2 Lead oxides are a group of inorganic compounds
with formulas include lead and oxygen. Lead Sulfate PbSO4 Lead sulfate is a white powder and it is often seen
in the electrodes of car batteries, as it is formed when battery is discharged.
Lead Carbon PbC Lead carbon batteries combine the high energy density of a battery and the high specific power of a supercapacitor in a single low-cost device.
Lead Oxide PbO2 Lead oxide is a group of inorganic compound Point of Common Coupling
PCC The point at which the electric utility and the customer interface occurs (IEEE Standard Dictionary of Electrical & Electronics Terms (ANS/IEEE Std 100-1977), 1997).
Power Conversion System
PCS Power conversion system converts electrical energy from one form to another.
Probability Density Function
PDF A probability density function (pdf), or density of a continuous random variable, is a function that describes the relative likelihood for this random variable to take on a given value. [Wikipedia]
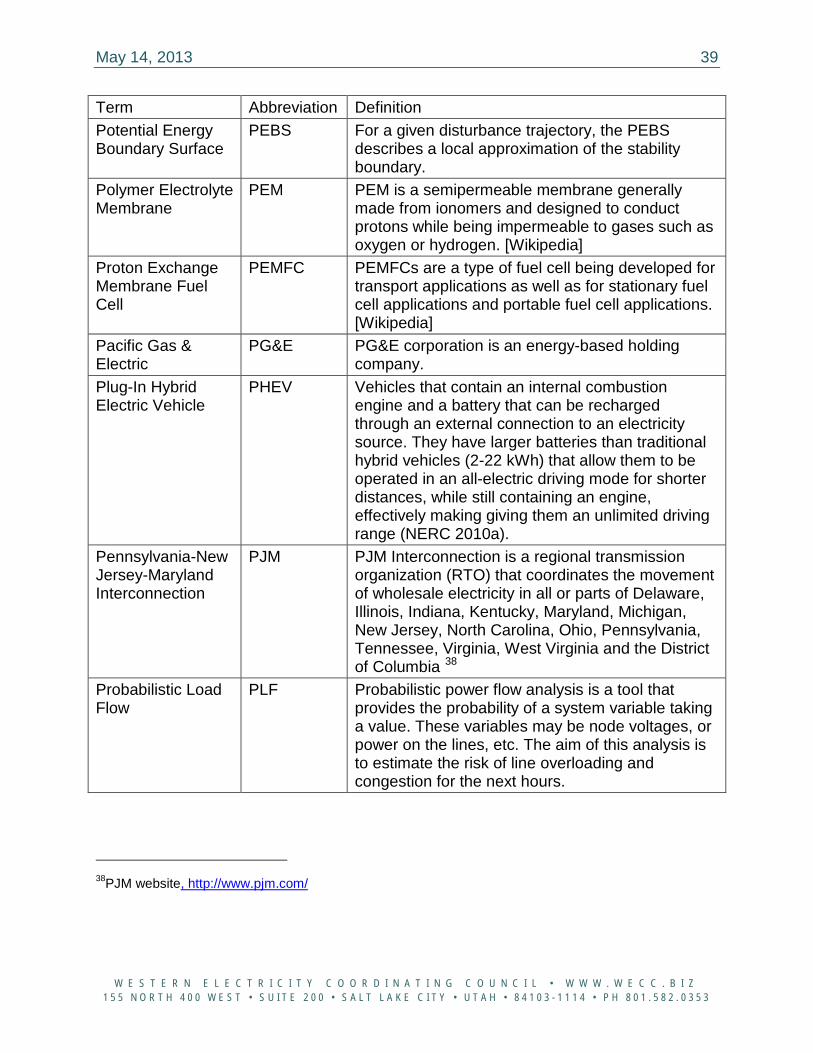
May 14, 2013 39
W E S T E R N E L E C T R I C I T Y C O O R D I N A T I N G C O U N C I L • W W W . W E C C . B I Z 1 5 5 N O R T H 4 0 0 W E S T • S U I T E 2 0 0 • S A L T L A K E C I T Y • U T A H • 8 4 1 0 3 - 1 1 1 4 • P H 8 0 1 . 5 8 2 . 0 3 5 3
Term Abbreviation Definition Potential Energy Boundary Surface
PEBS For a given disturbance trajectory, the PEBS describes a local approximation of the stability boundary.
Polymer Electrolyte Membrane
PEM PEM is a semipermeable membrane generally made from ionomers and designed to conduct protons while being impermeable to gases such as oxygen or hydrogen. [Wikipedia]
Proton Exchange Membrane Fuel Cell
PEMFC PEMFCs are a type of fuel cell being developed for transport applications as well as for stationary fuel cell applications and portable fuel cell applications. [Wikipedia]
Pacific Gas & Electric
PG&E PG&E corporation is an energy-based holding company.
Plug-In Hybrid Electric Vehicle
PHEV Vehicles that contain an internal combustion engine and a battery that can be recharged through an external connection to an electricity source. They have larger batteries than traditional hybrid vehicles (2-22 kWh) that allow them to be operated in an all-electric driving mode for shorter distances, while still containing an engine, effectively making giving them an unlimited driving range (NERC 2010a).
Pennsylvania-New Jersey-Maryland Interconnection
PJM PJM Interconnection is a regional transmission organization (RTO) that coordinates the movement of wholesale electricity in all or parts of Delaware, Illinois, Indiana, Kentucky, Maryland, Michigan, New Jersey, North Carolina, Ohio, Pennsylvania, Tennessee, Virginia, West Virginia and the District of Columbia 38
Probabilistic Load Flow
PLF Probabilistic power flow analysis is a tool that provides the probability of a system variable taking a value. These variables may be node voltages, or power on the lines, etc. The aim of this analysis is to estimate the risk of line overloading and congestion for the next hours.
38PJM website, http://www.pjm.com/
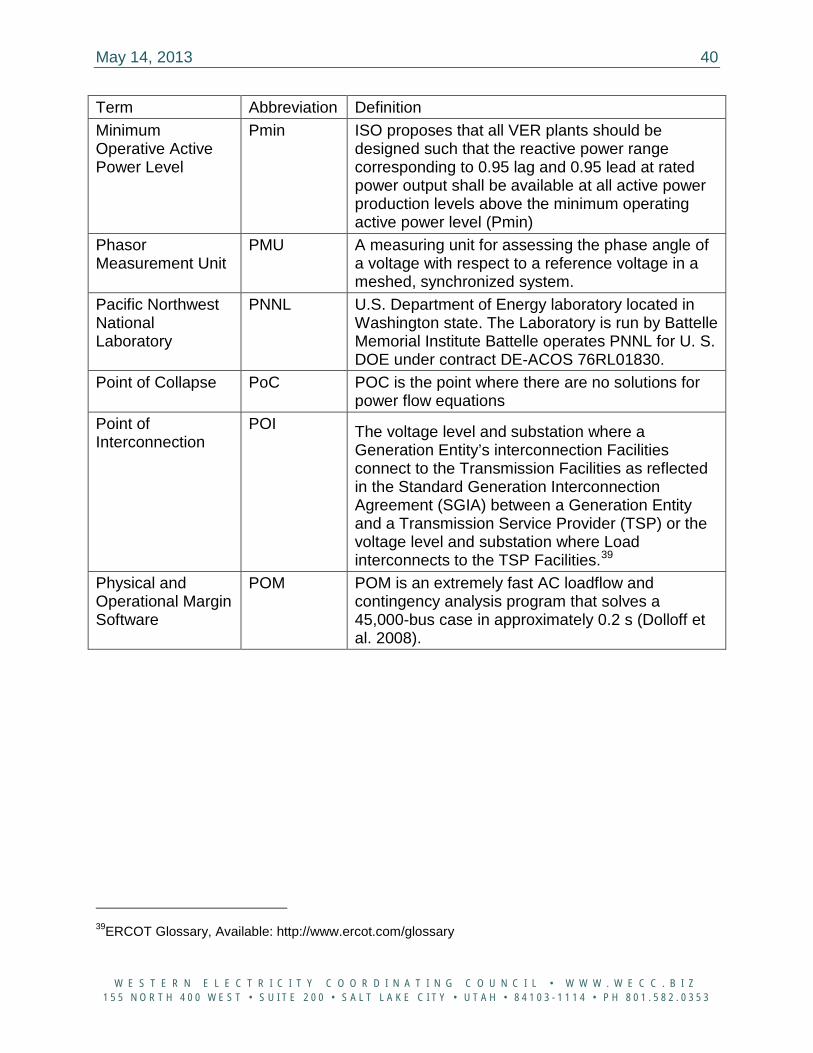
May 14, 2013 40
W E S T E R N E L E C T R I C I T Y C O O R D I N A T I N G C O U N C I L • W W W . W E C C . B I Z 1 5 5 N O R T H 4 0 0 W E S T • S U I T E 2 0 0 • S A L T L A K E C I T Y • U T A H • 8 4 1 0 3 - 1 1 1 4 • P H 8 0 1 . 5 8 2 . 0 3 5 3
Term Abbreviation Definition Minimum Operative Active Power Level
Pmin ISO proposes that all VER plants should be designed such that the reactive power range corresponding to 0.95 lag and 0.95 lead at rated power output shall be available at all active power production levels above the minimum operating active power level (Pmin)
Phasor Measurement Unit
PMU A measuring unit for assessing the phase angle of a voltage with respect to a reference voltage in a meshed, synchronized system.
Pacific Northwest National Laboratory
PNNL U.S. Department of Energy laboratory located in Washington state. The Laboratory is run by Battelle Memorial Institute Battelle operates PNNL for U. S. DOE under contract DE-ACOS 76RL01830.
Point of Collapse PoC
POC is the point where there are no solutions for power flow equations
Point of Interconnection
POI The voltage level and substation where a Generation Entity’s interconnection Facilities connect to the Transmission Facilities as reflected in the Standard Generation Interconnection Agreement (SGIA) between a Generation Entity and a Transmission Service Provider (TSP) or the voltage level and substation where Load interconnects to the TSP Facilities.39
Physical and Operational Margin Software
POM POM is an extremely fast AC loadflow and contingency analysis program that solves a 45,000-bus case in approximately 0.2 s (Dolloff et al. 2008).
39ERCOT Glossary, Available: http://www.ercot.com/glossary
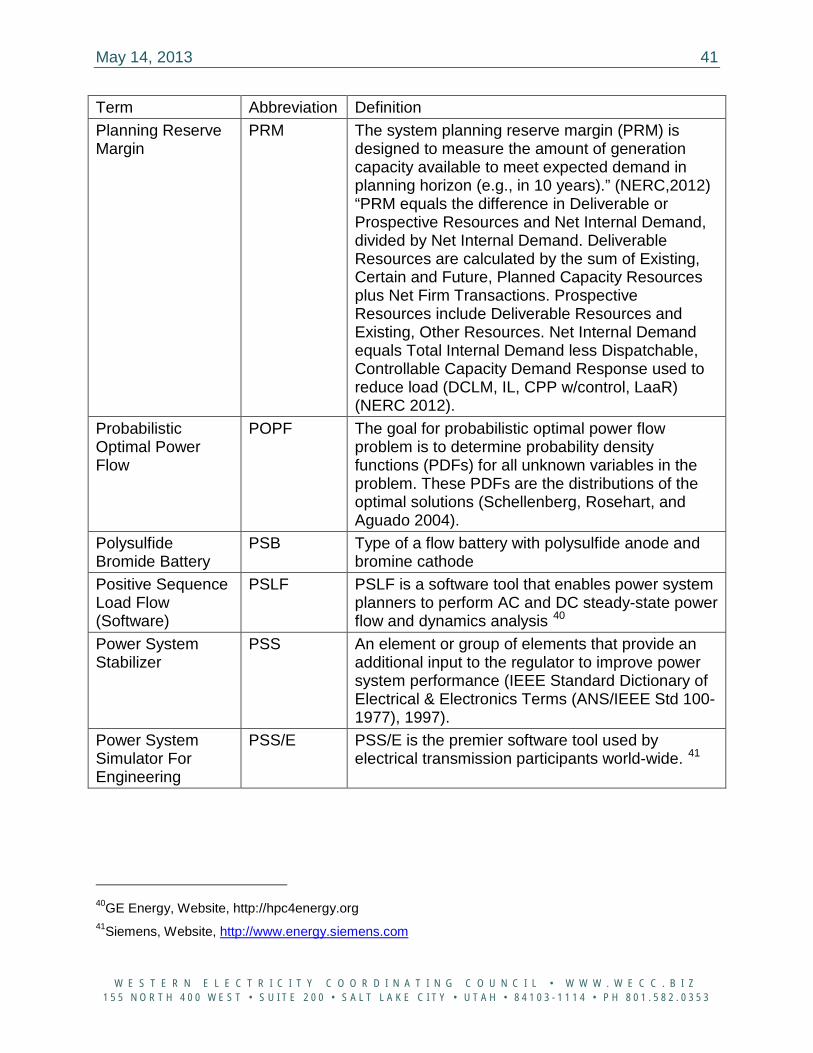
May 14, 2013 41
W E S T E R N E L E C T R I C I T Y C O O R D I N A T I N G C O U N C I L • W W W . W E C C . B I Z 1 5 5 N O R T H 4 0 0 W E S T • S U I T E 2 0 0 • S A L T L A K E C I T Y • U T A H • 8 4 1 0 3 - 1 1 1 4 • P H 8 0 1 . 5 8 2 . 0 3 5 3
Term Abbreviation Definition Planning Reserve Margin
PRM The system planning reserve margin (PRM) is designed to measure the amount of generation capacity available to meet expected demand in planning horizon (e.g., in 10 years).” (NERC,2012) “PRM equals the difference in Deliverable or Prospective Resources and Net Internal Demand, divided by Net Internal Demand. Deliverable Resources are calculated by the sum of Existing, Certain and Future, Planned Capacity Resources plus Net Firm Transactions. Prospective Resources include Deliverable Resources and Existing, Other Resources. Net Internal Demand equals Total Internal Demand less Dispatchable, Controllable Capacity Demand Response used to reduce load (DCLM, IL, CPP w/control, LaaR) (NERC 2012).
Probabilistic Optimal Power Flow
POPF The goal for probabilistic optimal power flow problem is to determine probability density functions (PDFs) for all unknown variables in the problem. These PDFs are the distributions of the optimal solutions (Schellenberg, Rosehart, and Aguado 2004).
Polysulfide Bromide Battery
PSB Type of a flow battery with polysulfide anode and bromine cathode
Positive Sequence Load Flow (Software)
PSLF PSLF is a software tool that enables power system planners to perform AC and DC steady-state power flow and dynamics analysis 40
Power System Stabilizer
PSS An element or group of elements that provide an additional input to the regulator to improve power system performance (IEEE Standard Dictionary of Electrical & Electronics Terms (ANS/IEEE Std 100-1977), 1997).
Power System Simulator For Engineering
PSS/E PSS/E is the premier software tool used by electrical transmission participants world-wide. 41
40GE Energy, Website, http://hpc4energy.org 41Siemens, Website, http://www.energy.siemens.com
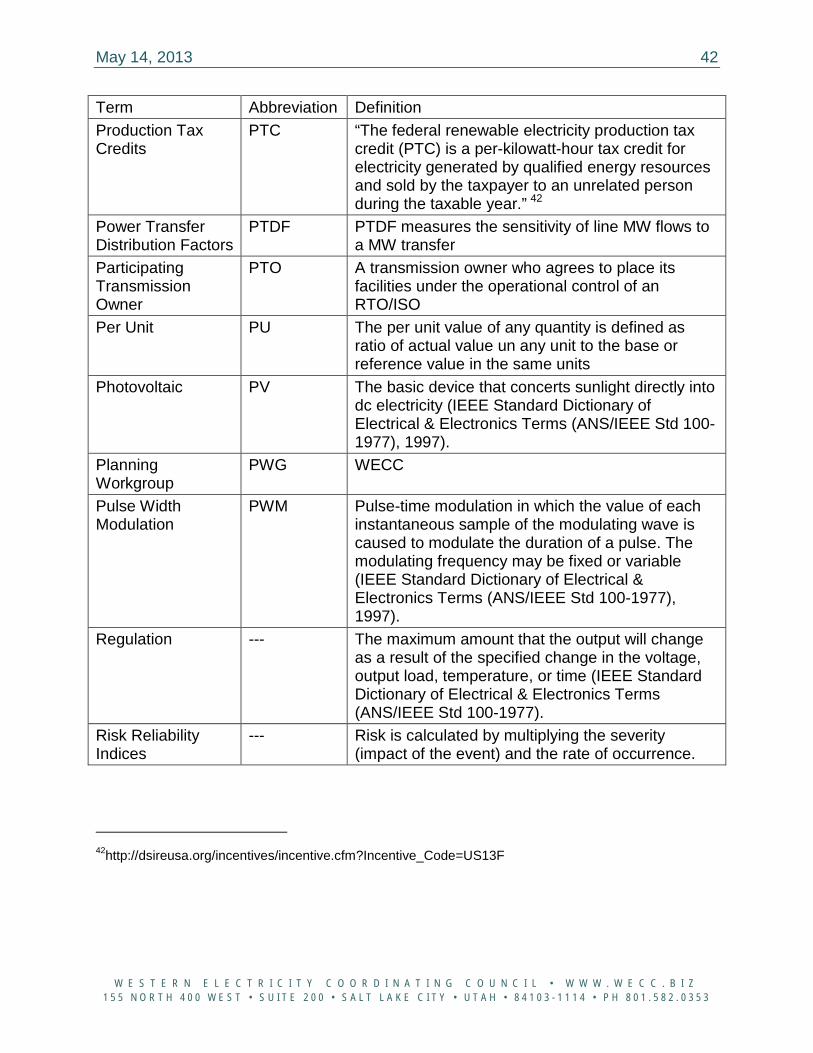
May 14, 2013 42
W E S T E R N E L E C T R I C I T Y C O O R D I N A T I N G C O U N C I L • W W W . W E C C . B I Z 1 5 5 N O R T H 4 0 0 W E S T • S U I T E 2 0 0 • S A L T L A K E C I T Y • U T A H • 8 4 1 0 3 - 1 1 1 4 • P H 8 0 1 . 5 8 2 . 0 3 5 3
Term Abbreviation Definition Production Tax Credits
PTC “The federal renewable electricity production tax credit (PTC) is a per-kilowatt-hour tax credit for electricity generated by qualified energy resources and sold by the taxpayer to an unrelated person during the taxable year.” 42
Power Transfer Distribution Factors
PTDF PTDF measures the sensitivity of line MW flows to a MW transfer
Participating Transmission Owner
PTO A transmission owner who agrees to place its facilities under the operational control of an RTO/ISO
Per Unit PU The per unit value of any quantity is defined as ratio of actual value un any unit to the base or reference value in the same units
Photovoltaic PV The basic device that concerts sunlight directly into dc electricity (IEEE Standard Dictionary of Electrical & Electronics Terms (ANS/IEEE Std 100-1977), 1997).
Planning Workgroup
PWG WECC
Pulse Width Modulation
PWM Pulse-time modulation in which the value of each instantaneous sample of the modulating wave is caused to modulate the duration of a pulse. The modulating frequency may be fixed or variable (IEEE Standard Dictionary of Electrical & Electronics Terms (ANS/IEEE Std 100-1977), 1997).
Regulation --- The maximum amount that the output will change as a result of the specified change in the voltage, output load, temperature, or time (IEEE Standard Dictionary of Electrical & Electronics Terms (ANS/IEEE Std 100-1977).
Risk Reliability Indices
--- Risk is calculated by multiplying the severity (impact of the event) and the rate of occurrence.
42http://dsireusa.org/incentives/incentive.cfm?Incentive_Code=US13F
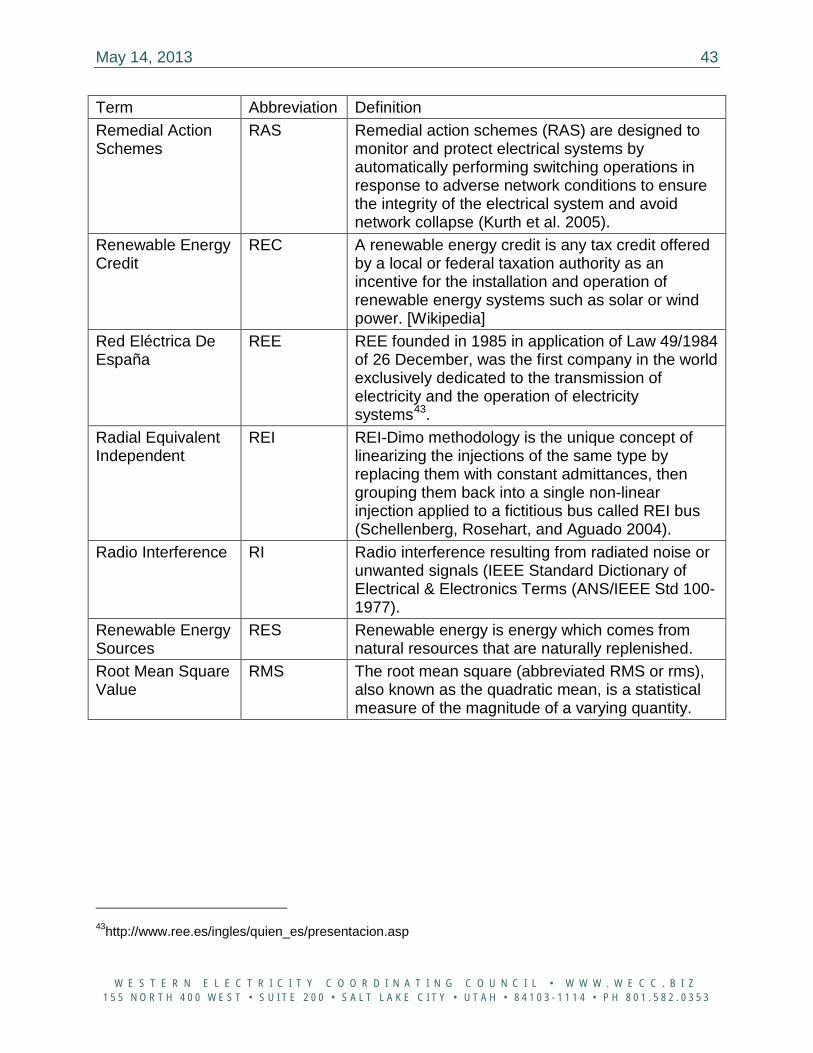
May 14, 2013 43
W E S T E R N E L E C T R I C I T Y C O O R D I N A T I N G C O U N C I L • W W W . W E C C . B I Z 1 5 5 N O R T H 4 0 0 W E S T • S U I T E 2 0 0 • S A L T L A K E C I T Y • U T A H • 8 4 1 0 3 - 1 1 1 4 • P H 8 0 1 . 5 8 2 . 0 3 5 3
Term Abbreviation Definition Remedial Action Schemes
RAS Remedial action schemes (RAS) are designed to monitor and protect electrical systems by automatically performing switching operations in response to adverse network conditions to ensure the integrity of the electrical system and avoid network collapse (Kurth et al. 2005).
Renewable Energy Credit
REC A renewable energy credit is any tax credit offered by a local or federal taxation authority as an incentive for the installation and operation of renewable energy systems such as solar or wind power. [Wikipedia]
Red Eléctrica De España
REE REE founded in 1985 in application of Law 49/1984 of 26 December, was the first company in the world exclusively dedicated to the transmission of electricity and the operation of electricity systems43.
Radial Equivalent Independent
REI REI-Dimo methodology is the unique concept of linearizing the injections of the same type by replacing them with constant admittances, then grouping them back into a single non-linear injection applied to a fictitious bus called REI bus (Schellenberg, Rosehart, and Aguado 2004).
Radio Interference RI Radio interference resulting from radiated noise or unwanted signals (IEEE Standard Dictionary of Electrical & Electronics Terms (ANS/IEEE Std 100-1977).
Renewable Energy Sources
RES Renewable energy is energy which comes from natural resources that are naturally replenished.
Root Mean Square Value
RMS The root mean square (abbreviated RMS or rms), also known as the quadratic mean, is a statistical measure of the magnitude of a varying quantity.
43http://www.ree.es/ingles/quien_es/presentacion.asp
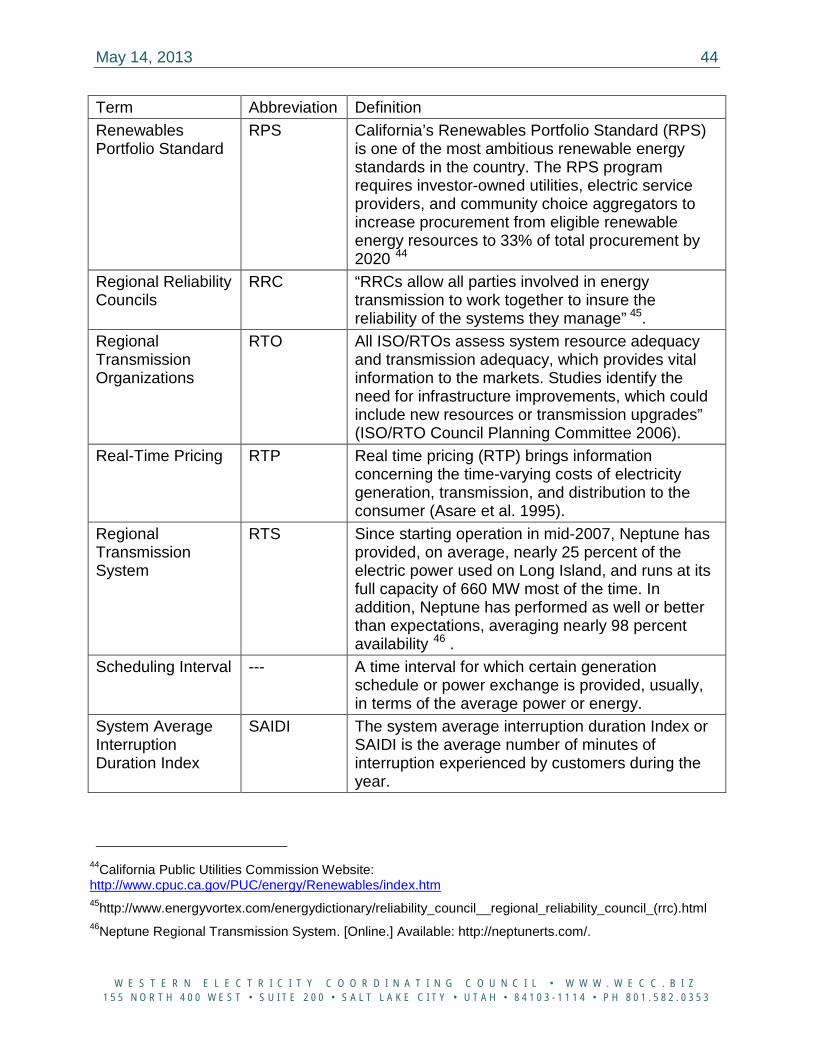
May 14, 2013 44
W E S T E R N E L E C T R I C I T Y C O O R D I N A T I N G C O U N C I L • W W W . W E C C . B I Z 1 5 5 N O R T H 4 0 0 W E S T • S U I T E 2 0 0 • S A L T L A K E C I T Y • U T A H • 8 4 1 0 3 - 1 1 1 4 • P H 8 0 1 . 5 8 2 . 0 3 5 3
Term Abbreviation Definition Renewables Portfolio Standard
RPS California’s Renewables Portfolio Standard (RPS) is one of the most ambitious renewable energy standards in the country. The RPS program requires investor-owned utilities, electric service providers, and community choice aggregators to increase procurement from eligible renewable energy resources to 33% of total procurement by 2020 44
Regional Reliability Councils
RRC “RRCs allow all parties involved in energy transmission to work together to insure the reliability of the systems they manage” 45.
Regional Transmission Organizations
RTO All ISO/RTOs assess system resource adequacy and transmission adequacy, which provides vital information to the markets. Studies identify the need for infrastructure improvements, which could include new resources or transmission upgrades” (ISO/RTO Council Planning Committee 2006).
Real-Time Pricing RTP Real time pricing (RTP) brings information concerning the time-varying costs of electricity generation, transmission, and distribution to the consumer (Asare et al. 1995).
Regional Transmission System
RTS Since starting operation in mid-2007, Neptune has provided, on average, nearly 25 percent of the electric power used on Long Island, and runs at its full capacity of 660 MW most of the time. In addition, Neptune has performed as well or better than expectations, averaging nearly 98 percent availability 46 .
Scheduling Interval --- A time interval for which certain generation schedule or power exchange is provided, usually, in terms of the average power or energy.
System Average Interruption Duration Index
SAIDI The system average interruption duration Index or SAIDI is the average number of minutes of interruption experienced by customers during the year.
44California Public Utilities Commission Website: http://www.cpuc.ca.gov/PUC/energy/Renewables/index.htm 45http://www.energyvortex.com/energydictionary/reliability_council__regional_reliability_council_(rrc).html 46Neptune Regional Transmission System. [Online.] Available: http://neptunerts.com/.
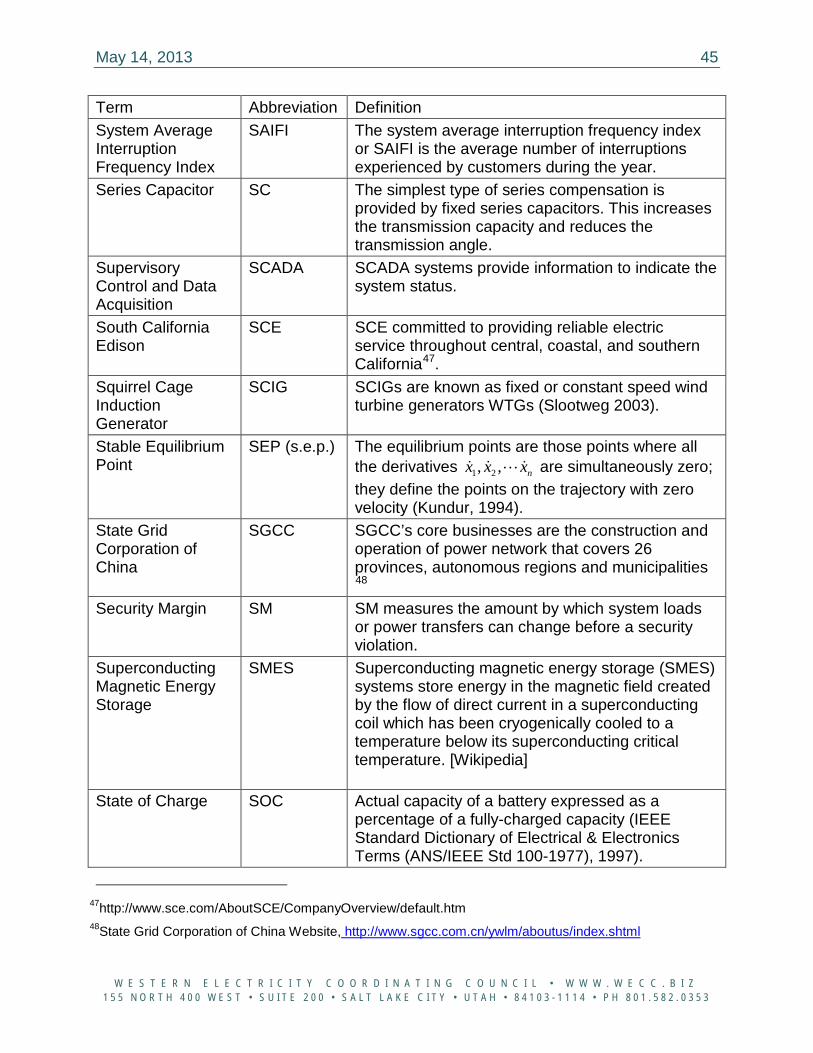
May 14, 2013 45
W E S T E R N E L E C T R I C I T Y C O O R D I N A T I N G C O U N C I L • W W W . W E C C . B I Z 1 5 5 N O R T H 4 0 0 W E S T • S U I T E 2 0 0 • S A L T L A K E C I T Y • U T A H • 8 4 1 0 3 - 1 1 1 4 • P H 8 0 1 . 5 8 2 . 0 3 5 3
Term Abbreviation Definition System Average Interruption Frequency Index
SAIFI The system average interruption frequency index or SAIFI is the average number of interruptions experienced by customers during the year.
Series Capacitor SC The simplest type of series compensation is provided by fixed series capacitors. This increases the transmission capacity and reduces the transmission angle.
Supervisory Control and Data Acquisition
SCADA SCADA systems provide information to indicate the system status.
South California Edison
SCE SCE committed to providing reliable electric service throughout central, coastal, and southern California47.
Squirrel Cage Induction Generator
SCIG SCIGs are known as fixed or constant speed wind turbine generators WTGs (Slootweg 2003).
Stable Equilibrium Point
SEP (s.e.p.) The equilibrium points are those points where all the derivatives 1 2, , nx x x
are simultaneously zero; they define the points on the trajectory with zero velocity (Kundur, 1994).
State Grid Corporation of China
SGCC SGCC’s core businesses are the construction and operation of power network that covers 26 provinces, autonomous regions and municipalities 48
Security Margin SM SM measures the amount by which system loads or power transfers can change before a security violation.
Superconducting Magnetic Energy Storage
SMES Superconducting magnetic energy storage (SMES) systems store energy in the magnetic field created by the flow of direct current in a superconducting coil which has been cryogenically cooled to a temperature below its superconducting critical temperature. [Wikipedia]
State of Charge SOC Actual capacity of a battery expressed as a percentage of a fully-charged capacity (IEEE Standard Dictionary of Electrical & Electronics Terms (ANS/IEEE Std 100-1977), 1997).
47http://www.sce.com/AboutSCE/CompanyOverview/default.htm 48State Grid Corporation of China Website, http://www.sgcc.com.cn/ywlm/aboutus/index.shtml
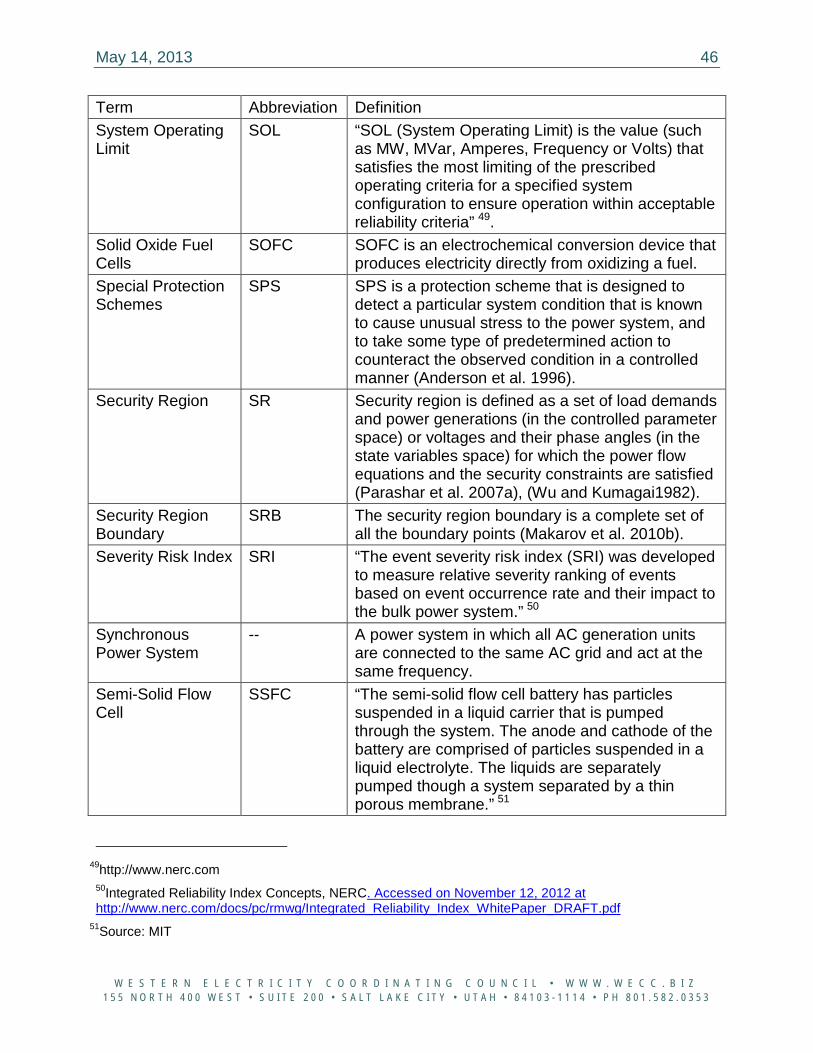
May 14, 2013 46
W E S T E R N E L E C T R I C I T Y C O O R D I N A T I N G C O U N C I L • W W W . W E C C . B I Z 1 5 5 N O R T H 4 0 0 W E S T • S U I T E 2 0 0 • S A L T L A K E C I T Y • U T A H • 8 4 1 0 3 - 1 1 1 4 • P H 8 0 1 . 5 8 2 . 0 3 5 3
Term Abbreviation Definition System Operating Limit
SOL “SOL (System Operating Limit) is the value (such as MW, MVar, Amperes, Frequency or Volts) that satisfies the most limiting of the prescribed operating criteria for a specified system configuration to ensure operation within acceptable reliability criteria” 49.
Solid Oxide Fuel Cells
SOFC SOFC is an electrochemical conversion device that produces electricity directly from oxidizing a fuel.
Special Protection Schemes
SPS SPS is a protection scheme that is designed to detect a particular system condition that is known to cause unusual stress to the power system, and to take some type of predetermined action to counteract the observed condition in a controlled manner (Anderson et al. 1996).
Security Region SR Security region is defined as a set of load demands and power generations (in the controlled parameter space) or voltages and their phase angles (in the state variables space) for which the power flow equations and the security constraints are satisfied (Parashar et al. 2007a), (Wu and Kumagai1982).
Security Region Boundary
SRB The security region boundary is a complete set of all the boundary points (Makarov et al. 2010b).
Severity Risk Index SRI “The event severity risk index (SRI) was developed to measure relative severity ranking of events based on event occurrence rate and their impact to the bulk power system.” 50
Synchronous Power System
-- A power system in which all AC generation units are connected to the same AC grid and act at the same frequency.
Semi-Solid Flow Cell
SSFC “The semi-solid flow cell battery has particles suspended in a liquid carrier that is pumped through the system. The anode and cathode of the battery are comprised of particles suspended in a liquid electrolyte. The liquids are separately pumped though a system separated by a thin porous membrane.” 51
49http://www.nerc.com
50Integrated Reliability Index Concepts, NERC. Accessed on November 12, 2012 at http://www.nerc.com/docs/pc/rmwg/Integrated_Reliability_Index_WhitePaper_DRAFT.pdf
51Source: MIT
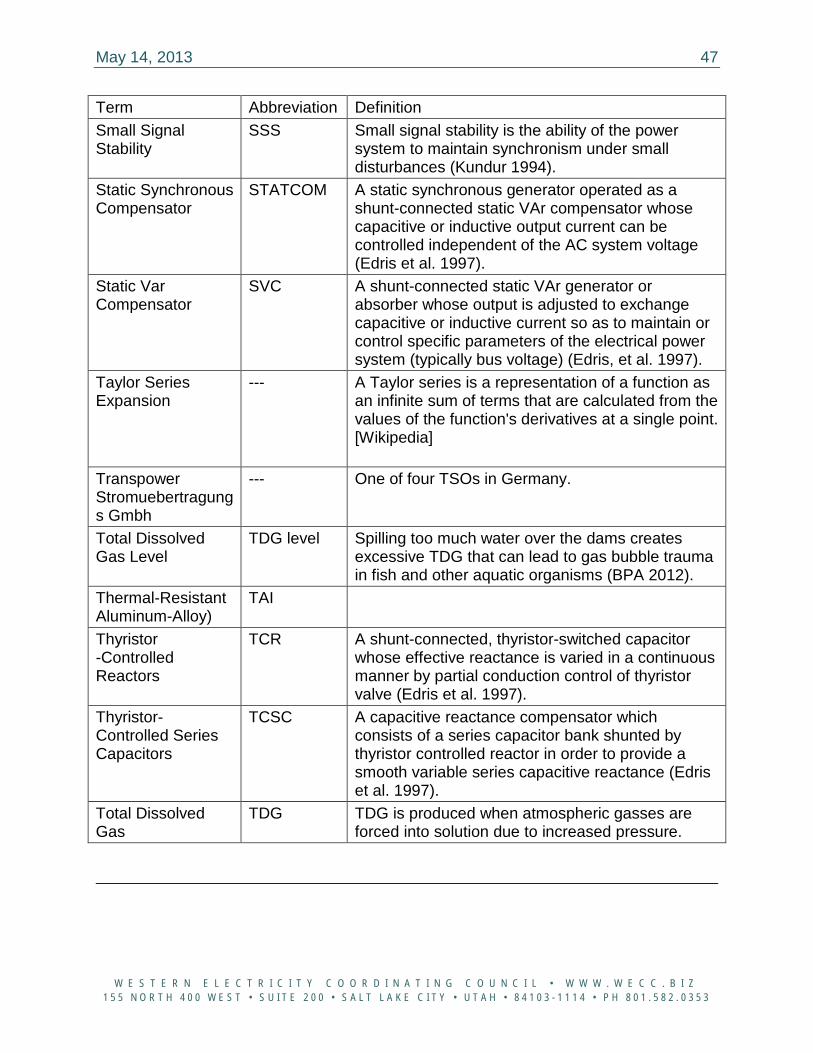
May 14, 2013 47
W E S T E R N E L E C T R I C I T Y C O O R D I N A T I N G C O U N C I L • W W W . W E C C . B I Z 1 5 5 N O R T H 4 0 0 W E S T • S U I T E 2 0 0 • S A L T L A K E C I T Y • U T A H • 8 4 1 0 3 - 1 1 1 4 • P H 8 0 1 . 5 8 2 . 0 3 5 3
Term Abbreviation Definition Small Signal Stability
SSS Small signal stability is the ability of the power system to maintain synchronism under small disturbances (Kundur 1994).
Static Synchronous Compensator
STATCOM A static synchronous generator operated as a shunt-connected static VAr compensator whose capacitive or inductive output current can be controlled independent of the AC system voltage (Edris et al. 1997).
Static Var Compensator
SVC A shunt-connected static VAr generator or absorber whose output is adjusted to exchange capacitive or inductive current so as to maintain or control specific parameters of the electrical power system (typically bus voltage) (Edris, et al. 1997).
Taylor Series Expansion
--- A Taylor series is a representation of a function as an infinite sum of terms that are calculated from the values of the function's derivatives at a single point. [Wikipedia]
Transpower Stromuebertragungs Gmbh
--- One of four TSOs in Germany.
Total Dissolved Gas Level
TDG level Spilling too much water over the dams creates excessive TDG that can lead to gas bubble trauma in fish and other aquatic organisms (BPA 2012).
Thermal-Resistant Aluminum-Alloy)
TAI
Thyristor -Controlled Reactors
TCR A shunt-connected, thyristor-switched capacitor whose effective reactance is varied in a continuous manner by partial conduction control of thyristor valve (Edris et al. 1997).
Thyristor-Controlled Series Capacitors
TCSC A capacitive reactance compensator which consists of a series capacitor bank shunted by thyristor controlled reactor in order to provide a smooth variable series capacitive reactance (Edris et al. 1997).
Total Dissolved Gas
TDG TDG is produced when atmospheric gasses are forced into solution due to increased pressure.
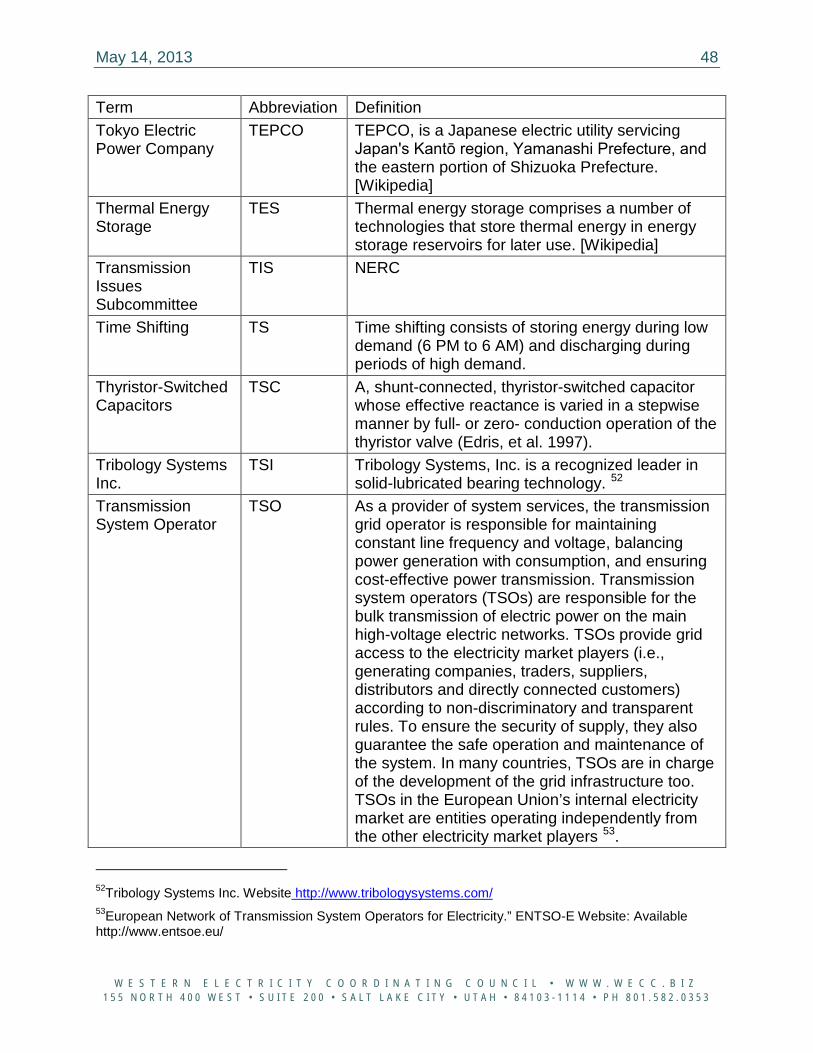
May 14, 2013 48
W E S T E R N E L E C T R I C I T Y C O O R D I N A T I N G C O U N C I L • W W W . W E C C . B I Z 1 5 5 N O R T H 4 0 0 W E S T • S U I T E 2 0 0 • S A L T L A K E C I T Y • U T A H • 8 4 1 0 3 - 1 1 1 4 • P H 8 0 1 . 5 8 2 . 0 3 5 3
Term Abbreviation Definition Tokyo Electric Power Company
TEPCO TEPCO, is a Japanese electric utility servicing Japan's Kantō region, Yamanashi Prefecture, and the eastern portion of Shizuoka Prefecture. [Wikipedia]
Thermal Energy Storage
TES Thermal energy storage comprises a number of technologies that store thermal energy in energy storage reservoirs for later use. [Wikipedia]
Transmission Issues Subcommittee
TIS NERC
Time Shifting TS Time shifting consists of storing energy during low demand (6 PM to 6 AM) and discharging during periods of high demand.
Thyristor-Switched Capacitors
TSC A, shunt-connected, thyristor-switched capacitor whose effective reactance is varied in a stepwise manner by full- or zero- conduction operation of the thyristor valve (Edris, et al. 1997).
Tribology Systems Inc.
TSI Tribology Systems, Inc. is a recognized leader in solid-lubricated bearing technology. 52
Transmission System Operator
TSO As a provider of system services, the transmission grid operator is responsible for maintaining constant line frequency and voltage, balancing power generation with consumption, and ensuring cost-effective power transmission. Transmission system operators (TSOs) are responsible for the bulk transmission of electric power on the main high-voltage electric networks. TSOs provide grid access to the electricity market players (i.e., generating companies, traders, suppliers, distributors and directly connected customers) according to non-discriminatory and transparent rules. To ensure the security of supply, they also guarantee the safe operation and maintenance of the system. In many countries, TSOs are in charge of the development of the grid infrastructure too. TSOs in the European Union’s internal electricity market are entities operating independently from the other electricity market players 53.
52Tribology Systems Inc. Website http://www.tribologysystems.com/ 53European Network of Transmission System Operators for Electricity.” ENTSO-E Website: Available http://www.entsoe.eu/
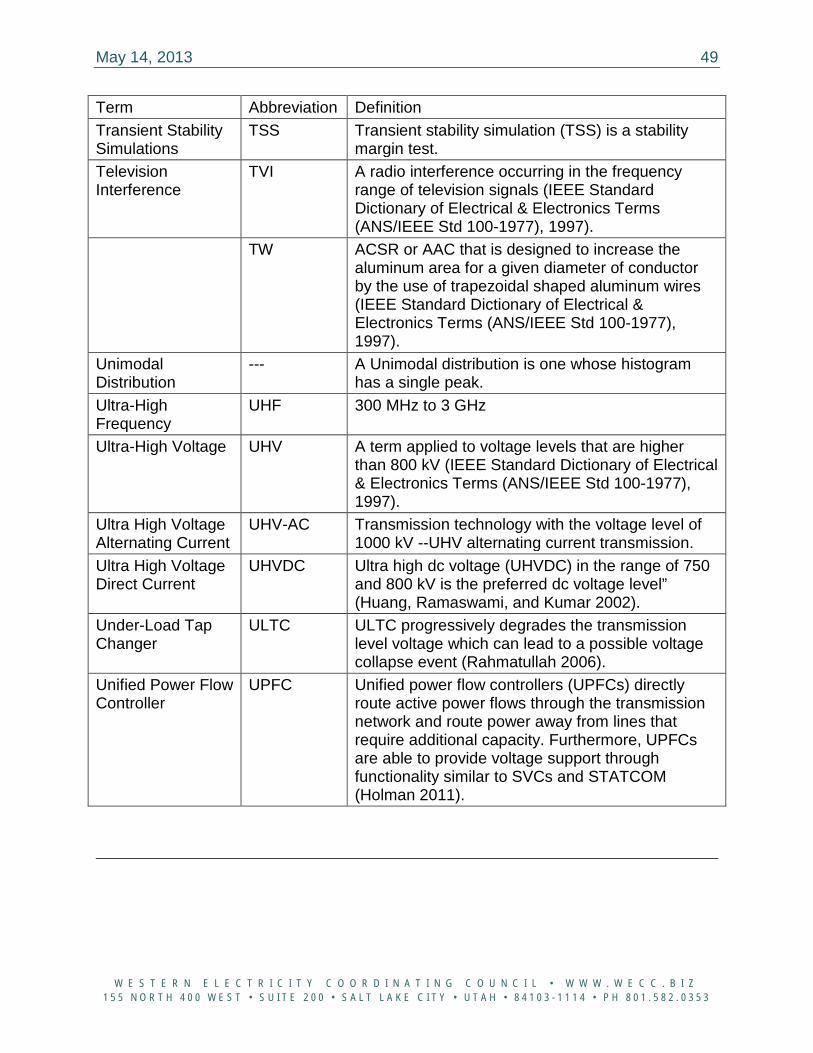
May 14, 2013 49
W E S T E R N E L E C T R I C I T Y C O O R D I N A T I N G C O U N C I L • W W W . W E C C . B I Z 1 5 5 N O R T H 4 0 0 W E S T • S U I T E 2 0 0 • S A L T L A K E C I T Y • U T A H • 8 4 1 0 3 - 1 1 1 4 • P H 8 0 1 . 5 8 2 . 0 3 5 3
Term Abbreviation Definition Transient Stability Simulations
TSS Transient stability simulation (TSS) is a stability margin test.
Television Interference
TVI A radio interference occurring in the frequency range of television signals (IEEE Standard Dictionary of Electrical & Electronics Terms (ANS/IEEE Std 100-1977), 1997).
TW ACSR or AAC that is designed to increase the aluminum area for a given diameter of conductor by the use of trapezoidal shaped aluminum wires (IEEE Standard Dictionary of Electrical & Electronics Terms (ANS/IEEE Std 100-1977), 1997).
Unimodal Distribution
--- A Unimodal distribution is one whose histogram has a single peak.
Ultra-High Frequency
UHF 300 MHz to 3 GHz
Ultra-High Voltage UHV A term applied to voltage levels that are higher than 800 kV (IEEE Standard Dictionary of Electrical & Electronics Terms (ANS/IEEE Std 100-1977), 1997).
Ultra High Voltage Alternating Current
UHV-AC Transmission technology with the voltage level of 1000 kV --UHV alternating current transmission.
Ultra High Voltage Direct Current
UHVDC Ultra high dc voltage (UHVDC) in the range of 750 and 800 kV is the preferred dc voltage level” (Huang, Ramaswami, and Kumar 2002).
Under-Load Tap Changer
ULTC ULTC progressively degrades the transmission level voltage which can lead to a possible voltage collapse event (Rahmatullah 2006).
Unified Power Flow Controller
UPFC Unified power flow controllers (UPFCs) directly route active power flows through the transmission network and route power away from lines that require additional capacity. Furthermore, UPFCs are able to provide voltage support through functionality similar to SVCs and STATCOM (Holman 2011).
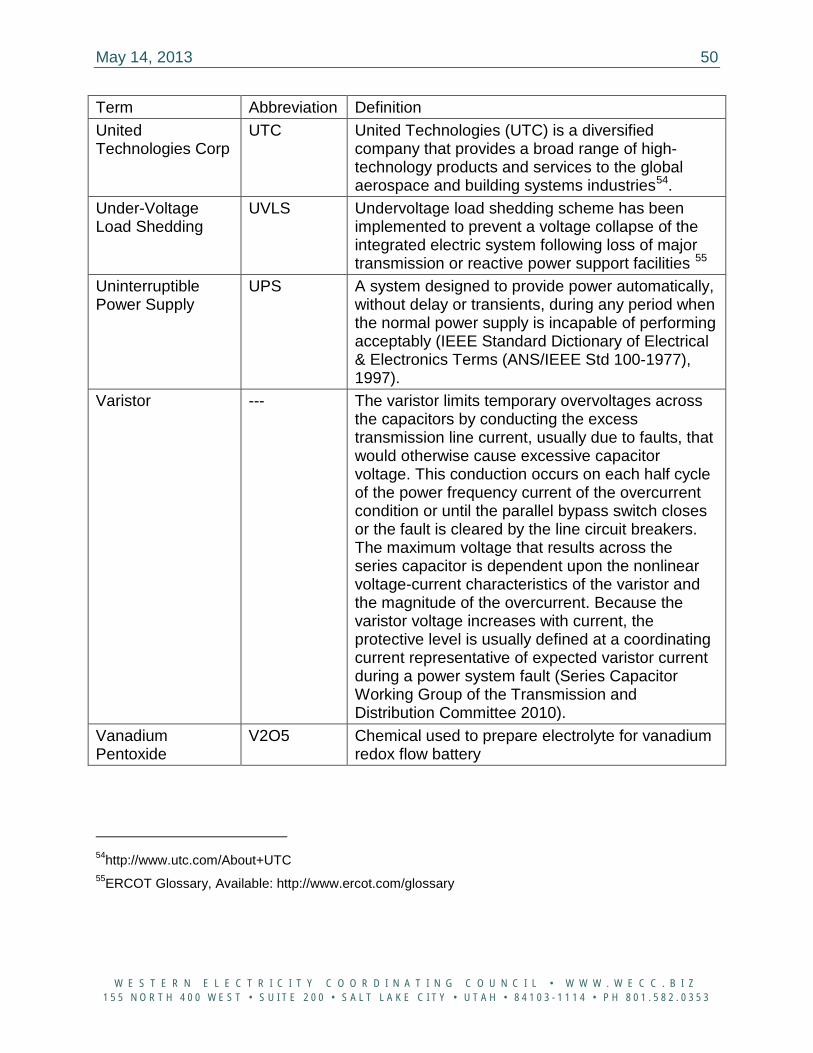
May 14, 2013 50
W E S T E R N E L E C T R I C I T Y C O O R D I N A T I N G C O U N C I L • W W W . W E C C . B I Z 1 5 5 N O R T H 4 0 0 W E S T • S U I T E 2 0 0 • S A L T L A K E C I T Y • U T A H • 8 4 1 0 3 - 1 1 1 4 • P H 8 0 1 . 5 8 2 . 0 3 5 3
Term Abbreviation Definition United Technologies Corp
UTC United Technologies (UTC) is a diversified company that provides a broad range of high-technology products and services to the global aerospace and building systems industries54.
Under-Voltage Load Shedding
UVLS Undervoltage load shedding scheme has been implemented to prevent a voltage collapse of the integrated electric system following loss of major transmission or reactive power support facilities 55
Uninterruptible Power Supply
UPS A system designed to provide power automatically, without delay or transients, during any period when the normal power supply is incapable of performing acceptably (IEEE Standard Dictionary of Electrical & Electronics Terms (ANS/IEEE Std 100-1977), 1997).
Varistor --- The varistor limits temporary overvoltages across the capacitors by conducting the excess transmission line current, usually due to faults, that would otherwise cause excessive capacitor voltage. This conduction occurs on each half cycle of the power frequency current of the overcurrent condition or until the parallel bypass switch closes or the fault is cleared by the line circuit breakers. The maximum voltage that results across the series capacitor is dependent upon the nonlinear voltage-current characteristics of the varistor and the magnitude of the overcurrent. Because the varistor voltage increases with current, the protective level is usually defined at a coordinating current representative of expected varistor current during a power system fault (Series Capacitor Working Group of the Transmission and Distribution Committee 2010).
Vanadium Pentoxide
V2O5 Chemical used to prepare electrolyte for vanadium redox flow battery
54http://www.utc.com/About+UTC 55ERCOT Glossary, Available: http://www.ercot.com/glossary
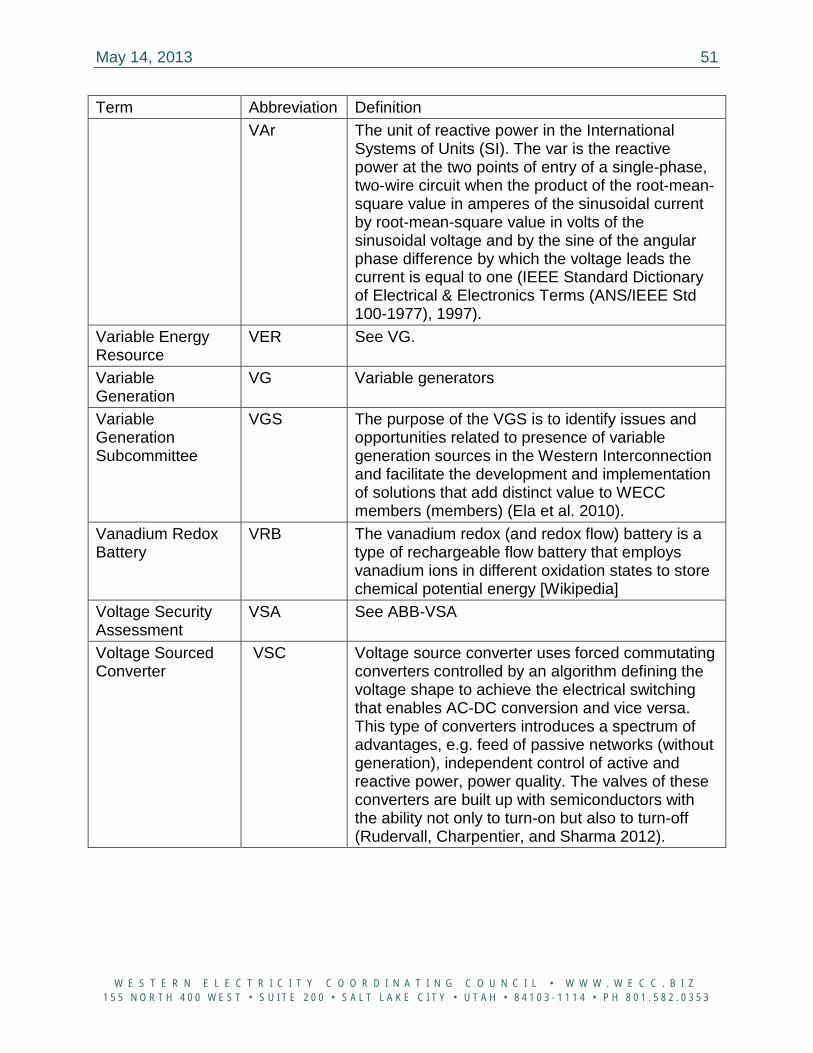
May 14, 2013 51
W E S T E R N E L E C T R I C I T Y C O O R D I N A T I N G C O U N C I L • W W W . W E C C . B I Z 1 5 5 N O R T H 4 0 0 W E S T • S U I T E 2 0 0 • S A L T L A K E C I T Y • U T A H • 8 4 1 0 3 - 1 1 1 4 • P H 8 0 1 . 5 8 2 . 0 3 5 3
Term Abbreviation Definition VAr The unit of reactive power in the International
Systems of Units (SI). The var is the reactive power at the two points of entry of a single-phase, two-wire circuit when the product of the root-mean-square value in amperes of the sinusoidal current by root-mean-square value in volts of the sinusoidal voltage and by the sine of the angular phase difference by which the voltage leads the current is equal to one (IEEE Standard Dictionary of Electrical & Electronics Terms (ANS/IEEE Std 100-1977), 1997).
Variable Energy Resource
VER See VG.
Variable Generation
VG Variable generators
Variable Generation Subcommittee
VGS The purpose of the VGS is to identify issues and opportunities related to presence of variable generation sources in the Western Interconnection and facilitate the development and implementation of solutions that add distinct value to WECC members (members) (Ela et al. 2010).
Vanadium Redox Battery
VRB The vanadium redox (and redox flow) battery is a type of rechargeable flow battery that employs vanadium ions in different oxidation states to store chemical potential energy [Wikipedia]
Voltage Security Assessment
VSA See ABB-VSA
Voltage Sourced Converter
VSC Voltage source converter uses forced commutating converters controlled by an algorithm defining the voltage shape to achieve the electrical switching that enables AC-DC conversion and vice versa. This type of converters introduces a spectrum of advantages, e.g. feed of passive networks (without generation), independent control of active and reactive power, power quality. The valves of these converters are built up with semiconductors with the ability not only to turn-on but also to turn-off (Rudervall, Charpentier, and Sharma 2012).
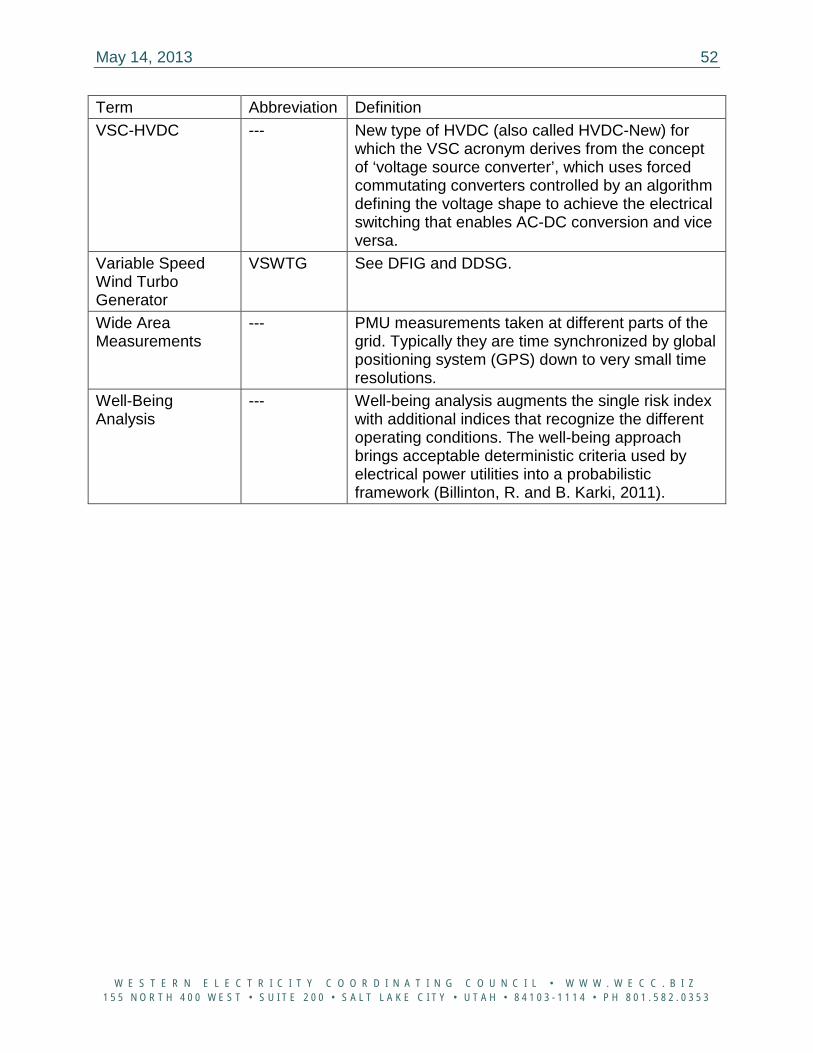
May 14, 2013 52
W E S T E R N E L E C T R I C I T Y C O O R D I N A T I N G C O U N C I L • W W W . W E C C . B I Z 1 5 5 N O R T H 4 0 0 W E S T • S U I T E 2 0 0 • S A L T L A K E C I T Y • U T A H • 8 4 1 0 3 - 1 1 1 4 • P H 8 0 1 . 5 8 2 . 0 3 5 3
Term Abbreviation Definition VSC-HVDC --- New type of HVDC (also called HVDC-New) for
which the VSC acronym derives from the concept of ‘voltage source converter’, which uses forced commutating converters controlled by an algorithm defining the voltage shape to achieve the electrical switching that enables AC-DC conversion and vice versa.
Variable Speed Wind Turbo Generator
VSWTG See DFIG and DDSG.
Wide Area Measurements
--- PMU measurements taken at different parts of the grid. Typically they are time synchronized by global positioning system (GPS) down to very small time resolutions.
Well-Being Analysis
--- Well-being analysis augments the single risk index with additional indices that recognize the different operating conditions. The well-being approach brings acceptable deterministic criteria used by electrical power utilities into a probabilistic framework (Billinton, R. and B. Karki, 2011).
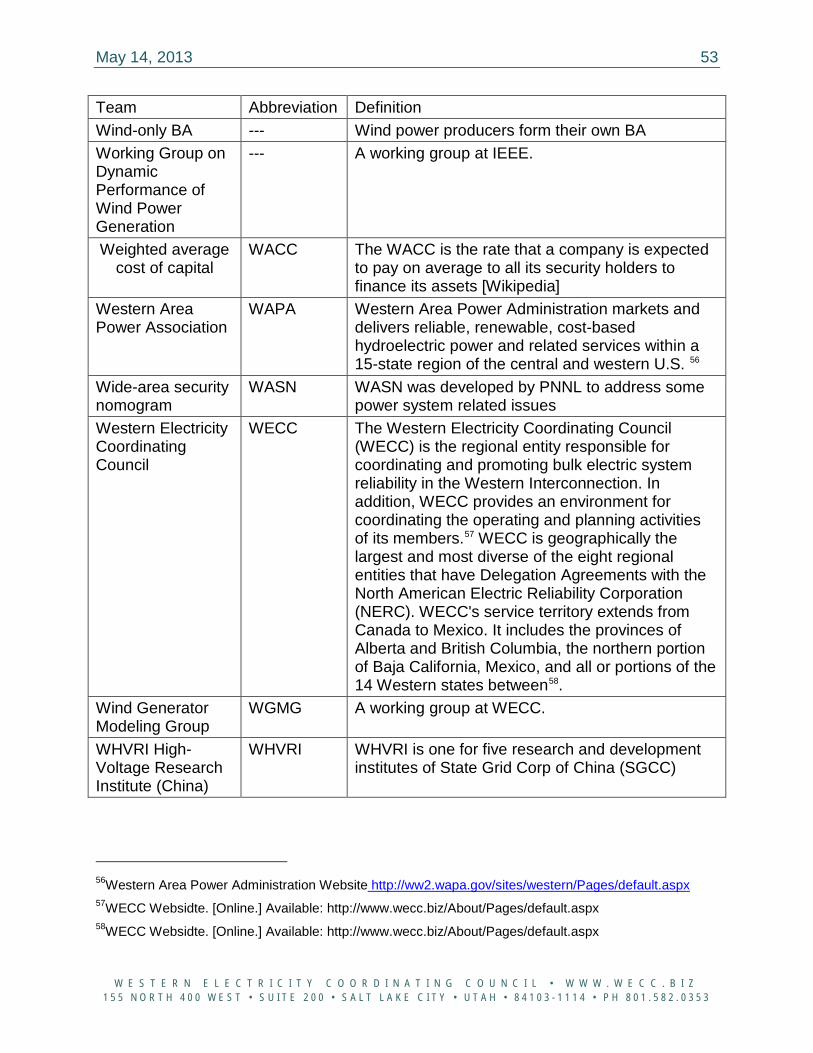
May 14, 2013 53
W E S T E R N E L E C T R I C I T Y C O O R D I N A T I N G C O U N C I L • W W W . W E C C . B I Z 1 5 5 N O R T H 4 0 0 W E S T • S U I T E 2 0 0 • S A L T L A K E C I T Y • U T A H • 8 4 1 0 3 - 1 1 1 4 • P H 8 0 1 . 5 8 2 . 0 3 5 3
Team Abbreviation Definition Wind-only BA --- Wind power producers form their own BA Working Group on Dynamic Performance of Wind Power Generation
--- A working group at IEEE.
Weighted average cost of capital
WACC The WACC is the rate that a company is expected to pay on average to all its security holders to finance its assets [Wikipedia]
Western Area Power Association
WAPA Western Area Power Administration markets and delivers reliable, renewable, cost-based hydroelectric power and related services within a 15-state region of the central and western U.S. 56
Wide-area security nomogram
WASN WASN was developed by PNNL to address some power system related issues
Western Electricity Coordinating Council
WECC The Western Electricity Coordinating Council (WECC) is the regional entity responsible for coordinating and promoting bulk electric system reliability in the Western Interconnection. In addition, WECC provides an environment for coordinating the operating and planning activities of its members.57 WECC is geographically the largest and most diverse of the eight regional entities that have Delegation Agreements with the North American Electric Reliability Corporation (NERC). WECC's service territory extends from Canada to Mexico. It includes the provinces of Alberta and British Columbia, the northern portion of Baja California, Mexico, and all or portions of the 14 Western states between58.
Wind Generator Modeling Group
WGMG A working group at WECC.
WHVRI High-Voltage Research Institute (China)
WHVRI WHVRI is one for five research and development institutes of State Grid Corp of China (SGCC)
56Western Area Power Administration Website http://ww2.wapa.gov/sites/western/Pages/default.aspx 57WECC Websidte. [Online.] Available: http://www.wecc.biz/About/Pages/default.aspx 58WECC Websidte. [Online.] Available: http://www.wecc.biz/About/Pages/default.aspx
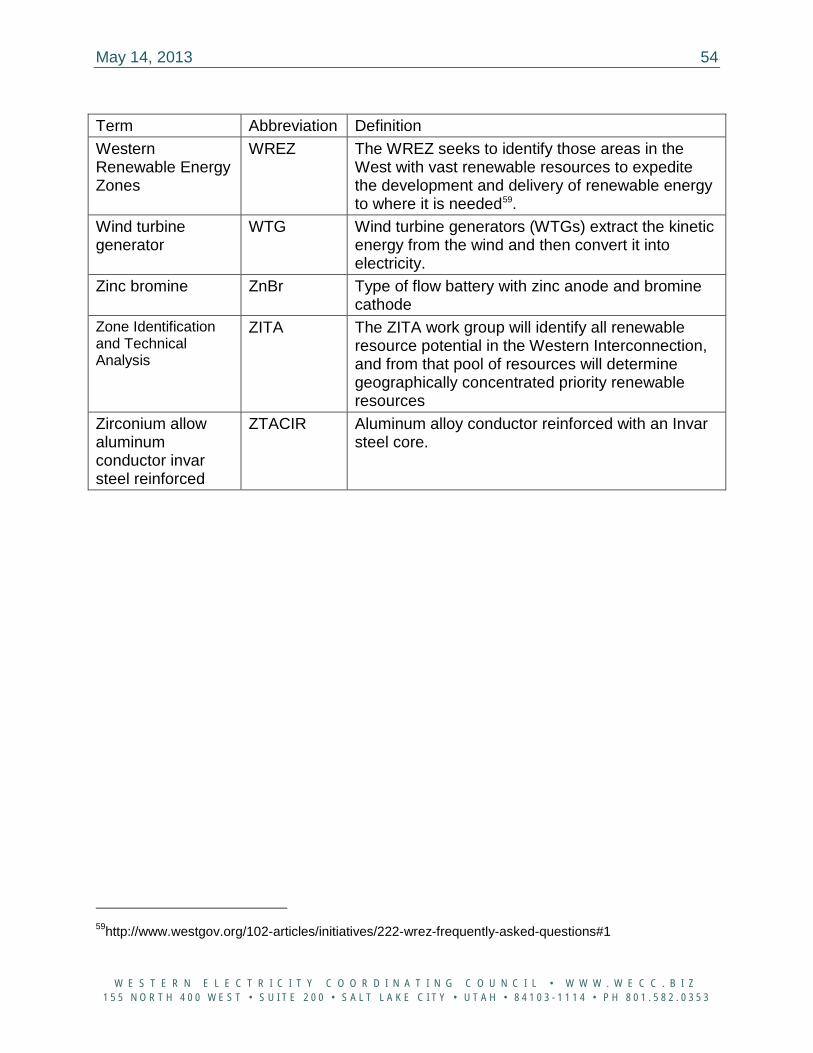
May 14, 2013 54
W E S T E R N E L E C T R I C I T Y C O O R D I N A T I N G C O U N C I L • W W W . W E C C . B I Z 1 5 5 N O R T H 4 0 0 W E S T • S U I T E 2 0 0 • S A L T L A K E C I T Y • U T A H • 8 4 1 0 3 - 1 1 1 4 • P H 8 0 1 . 5 8 2 . 0 3 5 3
Term Abbreviation Definition Western Renewable Energy Zones
WREZ The WREZ seeks to identify those areas in the West with vast renewable resources to expedite the development and delivery of renewable energy to where it is needed59.
Wind turbine generator
WTG Wind turbine generators (WTGs) extract the kinetic energy from the wind and then convert it into electricity.
Zinc bromine ZnBr Type of flow battery with zinc anode and bromine cathode
Zone Identification and Technical Analysis
ZITA The ZITA work group will identify all renewable resource potential in the Western Interconnection, and from that pool of resources will determine geographically concentrated priority renewable resources
Zirconium allow aluminum conductor invar steel reinforced
ZTACIR Aluminum alloy conductor reinforced with an Invar steel core.
59http://www.westgov.org/102-articles/initiatives/222-wrez-frequently-asked-questions#1
May 14, 2013 55
W E S T E R N E L E C T R I C I T Y C O O R D I N A T I N G C O U N C I L • W W W . W E C C . B I Z 1 5 5 N O R T H 4 0 0 W E S T • S U I T E 2 0 0 • S A L T L A K E C I T Y • U T A H • 8 4 1 0 3 - 1 1 1 4 • P H 8 0 1 . 5 8 2 . 0 3 5 3
APPENDIX 2
Recent Approaches to the Probabilistic Load Flow Problems60
60 Contributed by Jian Ma, PNNL.
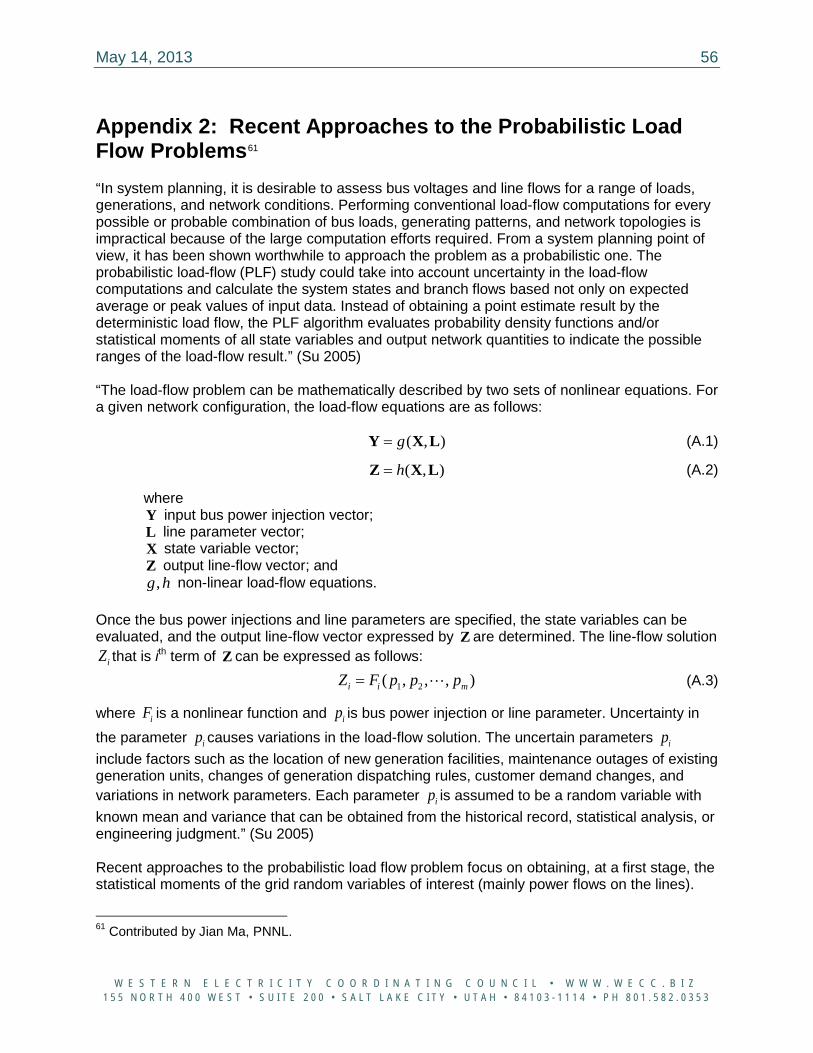
May 14, 2013 56
W E S T E R N E L E C T R I C I T Y C O O R D I N A T I N G C O U N C I L • W W W . W E C C . B I Z 1 5 5 N O R T H 4 0 0 W E S T • S U I T E 2 0 0 • S A L T L A K E C I T Y • U T A H • 8 4 1 0 3 - 1 1 1 4 • P H 8 0 1 . 5 8 2 . 0 3 5 3
Appendix 2: Recent Approaches to the Probabilistic Load Flow Problems61 “In system planning, it is desirable to assess bus voltages and line flows for a range of loads, generations, and network conditions. Performing conventional load-flow computations for every possible or probable combination of bus loads, generating patterns, and network topologies is impractical because of the large computation efforts required. From a system planning point of view, it has been shown worthwhile to approach the problem as a probabilistic one. The probabilistic load-flow (PLF) study could take into account uncertainty in the load-flow computations and calculate the system states and branch flows based not only on expected average or peak values of input data. Instead of obtaining a point estimate result by the deterministic load flow, the PLF algorithm evaluates probability density functions and/or statistical moments of all state variables and output network quantities to indicate the possible ranges of the load-flow result.” (Su 2005) “The load-flow problem can be mathematically described by two sets of nonlinear equations. For a given network configuration, the load-flow equations are as follows: ( , )g=Y X L (A.1)
( , )h=Z X L (A.2)
where Y input bus power injection vector; L line parameter vector; X state variable vector; Z output line-flow vector; and
,g h non-linear load-flow equations.
Once the bus power injections and line parameters are specified, the state variables can be evaluated, and the output line-flow vector expressed by Z are determined. The line-flow solution
iZ that is ith term of Z can be expressed as follows: 1 2( , , , )i i mZ F p p p= (A.3)
where iF is a nonlinear function and ip is bus power injection or line parameter. Uncertainty in the parameter ip causes variations in the load-flow solution. The uncertain parameters ipinclude factors such as the location of new generation facilities, maintenance outages of existing generation units, changes of generation dispatching rules, customer demand changes, and variations in network parameters. Each parameter ip is assumed to be a random variable with known mean and variance that can be obtained from the historical record, statistical analysis, or engineering judgment.” (Su 2005) Recent approaches to the probabilistic load flow problem focus on obtaining, at a first stage, the statistical moments of the grid random variables of interest (mainly power flows on the lines).
61 Contributed by Jian Ma, PNNL.
May 14, 2013 57
W E S T E R N E L E C T R I C I T Y C O O R D I N A T I N G C O U N C I L • W W W . W E C C . B I Z 1 5 5 N O R T H 4 0 0 W E S T • S U I T E 2 0 0 • S A L T L A K E C I T Y • U T A H • 8 4 1 0 3 - 1 1 1 4 • P H 8 0 1 . 5 8 2 . 0 3 5 3
Once the moments of the distributions of output variables have been obtained, the probability of surpassing a limit (e.g., maximum power flows) is estimated. Point estimate method is one of these approaches. This method gives good results when the input variables (uncertainties of loads and wind power predictions) are independent. It is; however, difficult to generalize this formulation for dependent random variables. Neglecting this dependence could yield sizeable errors. Series expansion methods, such as Fast Fourier transform (FFT), Taylor series, Gram-Charlier A series or Cornish-Fisher series have also been proposed to solve the probabilistic power flow problem. FFT techniques were proposed to reduce the computational burden (Allan et al. 1981), but this method is linked to the convolution technique, and does not solve the problem efficiently. In the early references, it was the uncertainty of the load that was considered. Hatziargyriou et al. (1993) proposed the use of FFT and convolution in distribution networks, and makes a simplified estimation of the PDF for short-term wind power prediction. A recent proposal is the point estimate method (Su 2005) that approximates the moments of the system variables of interest. The point estimate method intends to approximate the mean (and higher-order moments) by a linear combination of the value of Taylor expansion series in several points. This method can be extended to more points. This implies a higher order approximation. The enhanced linear method (ELM) uses the properties of a linear combination of random variables. ELM can be used both for dependent and independent variables. In both cases, the final results of these methods are the distribution moments of power flow variables. It is necessary to estimate the cumulative distribution function (CDF) of the resulting magnitudes to know the probability of the line flow to surpass the line flow limits. Thus, a method should be used to build this CDF from the obtained moments. The use of cumulants and the approximation of a PDF by orthogonal series (Gram-Charlier A expansion series) have been recently proposed (Zhang, Lee 2004). It has interesting properties, and is computationally inexpensive. For large transmission networks it seems that this approach is very adequate because of the low computational requirements. It has the disadvantage of the necessary linearization, but it may be easily generalized for dependent random variables. However, for non-Gaussian PDF, the Gram-Charlier A expansion series has serious convergence problems, and other approaches, such as Cornish-Fisher expansion, could give better results, without more computational burden (Usaola 2008). Usaola (2008) proposed a method for probabilistic load flow in networks with wind generation, where the uncertainty of the production is non-Gaussian. The method is based on the properties of the cumulants of the PDF and the Cornish–Fisher expansion. The Cornish-Fisher expansion series seem to behave better with non-Gaussian functions (such as those of interest in this study). This approximation yields a good fit for unimodal distributions. Absolute errors are small, and relative errors appear to also have low values. Some of the PDFs of the random variables may be multimodal. This circumstance poses some additional difficulties to the percentile calculation problem. The uncertainty of system load in optimal dispatch (OD) problems was considered in Vivian and Heydt (1981), where Gram-Charlier series were used to represent the PDF of the system load. A gradient technique is used to solve the optimization problem. A more general formulation of the probabilistic optimal power flow (POPF) problem is presented in El-Hawary and Mbamalu (1991), where assumed random perturbations in system load can be represented as random perturbation in all power flow variables. Thus, the POPF problem is reformulated as a perturbed problem. The system load is considered as independent variables (this is actually a disadvantage).
May 14, 2013 58
W E S T E R N E L E C T R I C I T Y C O O R D I N A T I N G C O U N C I L • W W W . W E C C . B I Z 1 5 5 N O R T H 4 0 0 W E S T • S U I T E 2 0 0 • S A L T L A K E C I T Y • U T A H • 8 4 1 0 3 - 1 1 1 4 • P H 8 0 1 . 5 8 2 . 0 3 5 3
However, none of these pioneering researches have pointed out that any linear or non-linear OD problem that contains inequalities is a general stochastic programming problem; this type of problem is the most challenging one (West 1996). Madrigal et al. (1998) presented a formulation of a POPF problem that treats system load as correlated random variables. Although the statistics at a given optimal solution can be calculated, the resulting stochastic non-linear programming problem is not known to have a procedure to find its analytical solution. The central idea of this approach is to treat optimality conditions as a general nonlinear probabilistic transformation that, in turn, can be studied using the first-order, second-moment method. Once the mean values and variances of all solution variables are computed, the same can be done for any functional combination of them (systems losses, cost, reactive generation, etc.).
May 14, 2013 59
W E S T E R N E L E C T R I C I T Y C O O R D I N A T I N G C O U N C I L • W W W . W E C C . B I Z 1 5 5 N O R T H 4 0 0 W E S T • S U I T E 2 0 0 • S A L T L A K E C I T Y • U T A H • 8 4 1 0 3 - 1 1 1 4 • P H 8 0 1 . 5 8 2 . 0 3 5 3
APPENDIX 3
Additional Useful Frequently-Used Probabilistic Reliability Indices
May 14, 2013 60
W E S T E R N E L E C T R I C I T Y C O O R D I N A T I N G C O U N C I L • W W W . W E C C . B I Z 1 5 5 N O R T H 4 0 0 W E S T • S U I T E 2 0 0 • S A L T L A K E C I T Y • U T A H • 8 4 1 0 3 - 1 1 1 4 • P H 8 0 1 . 5 8 2 . 0 3 5 3
Appendix 3: Additional Useful Frequently-Used Probabilistic Reliability Indices 62 NERC’s white paper (NERC 2010) significantly expands the list of possible probabilistic reliability indices. It introduces the severity, risk, and high-impact low-frequency (HILF) indices.
3.1 Severity Risk Indices (SRI) (NERC 2010d, 11-12)
The severity of an event has a number of key characteristics that are reflected in the ALR definition:
1) Duration of event (hours); 2) Amount of demand (MW) lost during the event; 3) Number of bulk power system components forced out of service during the event; and 4) Unacceptable facility damage.
These measures provide a numerical ranking to determine which events are more important to maintaining system reliability. In other words, the metrics are an integrated risk measurement system that classifies an event’s impact.
One approach is to establish an SRI that could serve as an indicator of severity of the major impacts into one measure. The SRI measures the change to system reliability from each event, based on transmission, generation, and load outage data. Relative weights, based on industry judgment, can be used to develop prioritized measures. The value of the severity is calculated based on impact of risk-significant events and the relative weightings. For example:
event ( ) ( ) ( ) ( ) ( )L L T T G G D D E ESRI w MW w N w N w H w N= ∗ + ∗ + ∗ + ∗ + ∗ (A.4)
where:
eventSRI = severity risk index for specified event; wL = weighting of load loss; MWL = normalized MW of load loss in percent; wT = weighting of transmission lines lost; NT = normalized number of transmission lines lost in percent; wG = weighting of generators lost, integrated bulk power system risk assessment; NG = normalized number of generators lost in percent; wD = weighting of duration of event; HD = normalized duration of the event in percent, wE = weighting of equipment damage; and NE = normalized number of equipment damaged in percent.
3.2 Risk Indices (NERC 2010d, p. 14)
Risk is calculated by multiplying the severity (impact of the event) and the rate of occurrence:
Risk (associated with an event) = Severity (of the event) * Rate of occurrence 62 Contributed by Yuri Makarov, PNNL.
May 14, 2013 61
W E S T E R N E L E C T R I C I T Y C O O R D I N A T I N G C O U N C I L • W W W . W E C C . B I Z 1 5 5 N O R T H 4 0 0 W E S T • S U I T E 2 0 0 • S A L T L A K E C I T Y • U T A H • 8 4 1 0 3 - 1 1 1 4 • P H 8 0 1 . 5 8 2 . 0 3 5 3
APPENDIX 4
High-impact Low-frequency (HILF) Events
May 14, 2013 62
W E S T E R N E L E C T R I C I T Y C O O R D I N A T I N G C O U N C I L • W W W . W E C C . B I Z 1 5 5 N O R T H 4 0 0 W E S T • S U I T E 2 0 0 • S A L T L A K E C I T Y • U T A H • 8 4 1 0 3 - 1 1 1 4 • P H 8 0 1 . 5 8 2 . 0 3 5 3
Appendix 4: High-impact Low-frequency (HILF) Events (NERC 2010d, 15-16) HILF events have recently become a renewed focus for risk managers. These risks have the potential to cause catastrophic impacts on the electric power system, but either rarely occur, or, in some cases, have never occurred. Examples of HILF risks include coordinated cyber, physical, and blended attacks,; the high-altitude detonation of a nuclear weapon, and major natural disasters like earthquakes, tsunamis, large hurricanes, pandemics, and geomagnetic disturbances caused by solar weather. HILF events truly transcend other risks due to their magnitude of impact and the scope of the impact (in many cases) reaching beyond the limits of the industry sector, and the relatively limited operational experience in addressing them. Deliberate attacks (including acts of war, terrorism, and coordinated criminal activity) pose especially unique scenarios due to their inherent unpredictability and significant national security implications. It is impossible to fully protect the system from every threat. Sound management of these and all risks to the sector must focus on determining the appropriate balance of resilience, protection, and restoration. Further, HILF risks present unique challenges to risk managers. They fall into a category of “macro-prudential” risk, which behaves differently than most forms of business risk. Macro-prudential risk is non-transferrable and cannot be fully insured against, diversified, or hedged at the individual firm level. The strength of the individual firm also does not dilute the risk to the firm from these events, as risks still exist from other players in the same sector. Therefore, this form of risk must be considered on a sector-wide basis, particularly in sectors (like the electric sector) formed of entities that are highly interconnected and interdependent. The risks associated with the electric sector have a number of characteristics in common:
• HILF risks have the potential to cause widespread or catastrophic impact to the sector—whether through impact to the workforce in the case of a pandemic, or through widespread physical damage to key system components in the case of a high-altitude electromagnetic pulse event.
• HILF risks generally originate through external forces outside the control of the sector. For example, actions can be taken to avoid vegetation contact with a transmission line. However, no amount of preemptive action will reduce the likelihood of a geomagnetic storm or pandemic.
• HILF events can occur very quickly and reach maximum impact with little warning or prior indication of an imminent risk. Effective response and restoration from HILF events require fast initiation and mobilization exercised through thorough planning.
• Little real-world operational experience generally exists with respect to responding to HILF risks, for the simple reason that they do not regularly occur.
• Probability of HILF risks’ occurrence and impact is difficult to quantify. Historical occurrence and severity do not provide a strong indicator of potential future frequency or impacts
May 14, 2013 63
W E S T E R N E L E C T R I C I T Y C O O R D I N A T I N G C O U N C I L • W W W . W E C C . B I Z 1 5 5 N O R T H 4 0 0 W E S T • S U I T E 2 0 0 • S A L T L A K E C I T Y • U T A H • 8 4 1 0 3 - 1 1 1 4 • P H 8 0 1 . 5 8 2 . 0 3 5 3
Understanding and effectively managing HILF risks therefore require a different approach to viewing risk. A complete risk landscape includes three primary categories of threats and hazards – natural, human-caused (both intentional and unintentional), and technological. A technological event is not typically thought to be a HILF event since traditionally, it had the most controls applied, in the form of standards, quality controls, protections, etc., which would limit the likelihood or the impact of a failure. The risks for the other two HILF-type events (natural disasters and deliberate attacks) differ remarkably and require different approaches and considerations to appropriately address them. Each risk presents unique, though sometimes overlapping, concerns and a different profile of existing preparedness across the electric sector. It may be useful to consider categorizing these risks into these two categories as further work on other HILF risks proceeds. The impact of HILF risks may be measured by several factors, including, but not limited to, population affected (number of customers without power), geographic area affected (region with no electricity in terms of square miles), time taken to restore power, potential for repeat incidents, intangibles (loss of perception of secure image), and various cost quantifiers (cost of repairing damage; cost of re-fortifying systems to ensure no repeat incidents; cost to consumers; cost to industry due to lost productivity, products, or services; cost to government and taxpayers; cost of increased insurance). Once a risk has been identified and assessed, effort turns to its management and mitigation. Risk management builds on the risk assessment process by seeking answers to several questions: What can be done and what options are available? What are the associated tradeoffs in terms of all costs, benefits, and risks? And what are the impacts of current management decisions on future options? As mitigating options are further considered, it is impossible to fully protect the system from every threat or threat actor. Sound management of these and all risks must focus on determining the appropriate balance of resilience, protection, and restoration. A successful risk management approach will begin by identifying the threat environment and protection goals for the system, balancing expected outcomes against the costs associated with proposed mitigations.
May 14, 2013 64
W E S T E R N E L E C T R I C I T Y C O O R D I N A T I N G C O U N C I L • W W W . W E C C . B I Z 1 5 5 N O R T H 4 0 0 W E S T • S U I T E 2 0 0 • S A L T L A K E C I T Y • U T A H • 8 4 1 0 3 - 1 1 1 4 • P H 8 0 1 . 5 8 2 . 0 3 5 3
APPENDIX 5
Examples of Wide-area Nomograms
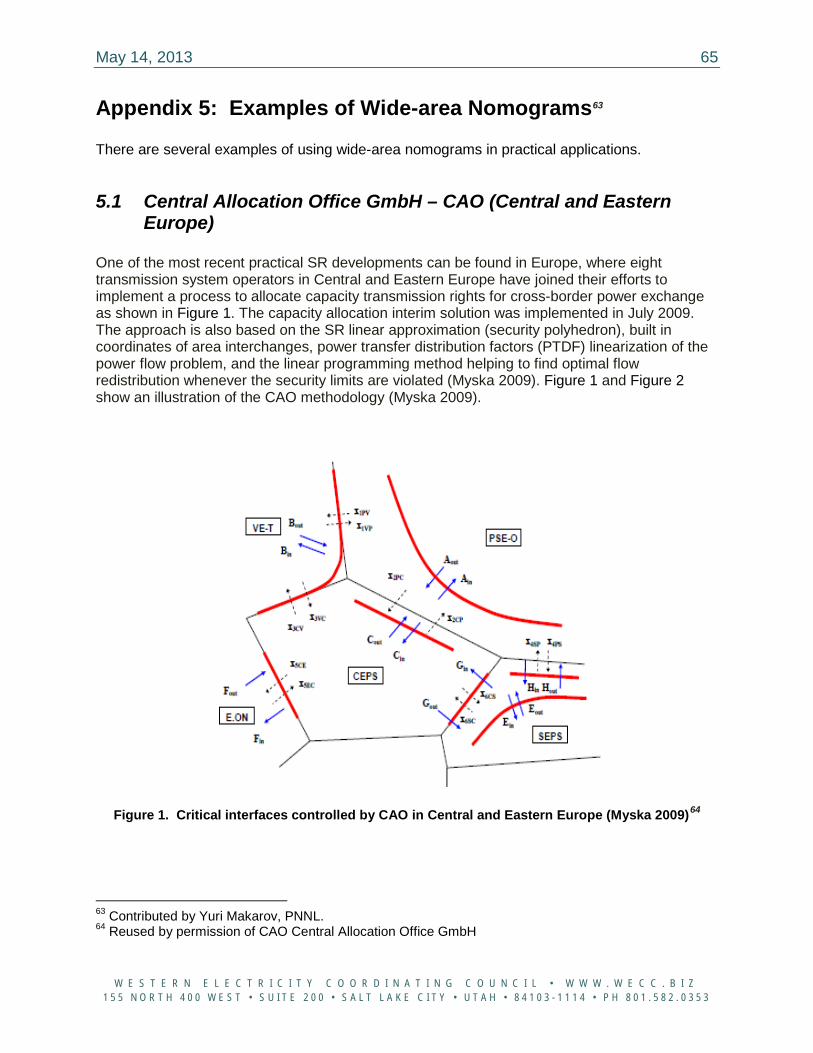
May 14, 2013 65
W E S T E R N E L E C T R I C I T Y C O O R D I N A T I N G C O U N C I L • W W W . W E C C . B I Z 1 5 5 N O R T H 4 0 0 W E S T • S U I T E 2 0 0 • S A L T L A K E C I T Y • U T A H • 8 4 1 0 3 - 1 1 1 4 • P H 8 0 1 . 5 8 2 . 0 3 5 3
Appendix 5: Examples of Wide-area Nomograms63 There are several examples of using wide-area nomograms in practical applications.
5.1 Central Allocation Office GmbH – CAO (Central and Eastern Europe)
One of the most recent practical SR developments can be found in Europe, where eight transmission system operators in Central and Eastern Europe have joined their efforts to implement a process to allocate capacity transmission rights for cross-border power exchange as shown in Figure 1. The capacity allocation interim solution was implemented in July 2009. The approach is also based on the SR linear approximation (security polyhedron), built in coordinates of area interchanges, power transfer distribution factors (PTDF) linearization of the power flow problem, and the linear programming method helping to find optimal flow redistribution whenever the security limits are violated (Myska 2009). Figure 1 and Figure 2 show an illustration of the CAO methodology (Myska 2009).
Figure 1. Critical interfaces controlled by CAO in Central and Eastern Europe (Myska 2009)64
63 Contributed by Yuri Makarov, PNNL. 64 Reused by permission of CAO Central Allocation Office GmbH
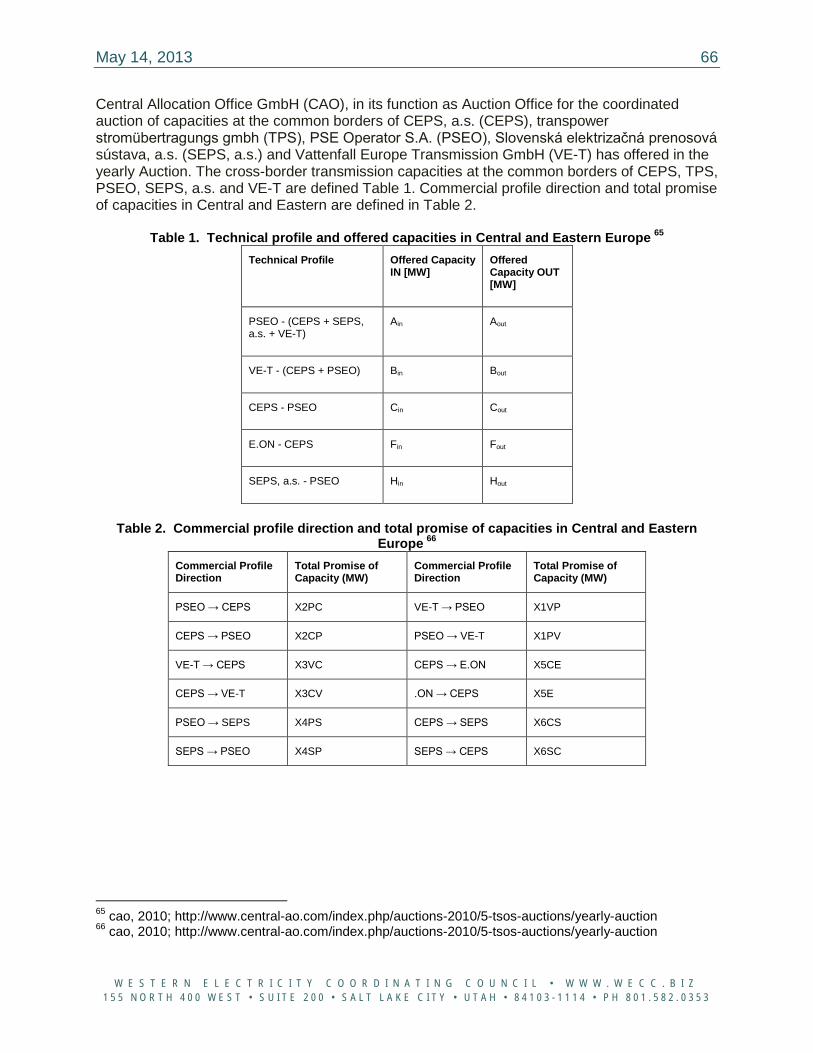
May 14, 2013 66
W E S T E R N E L E C T R I C I T Y C O O R D I N A T I N G C O U N C I L • W W W . W E C C . B I Z 1 5 5 N O R T H 4 0 0 W E S T • S U I T E 2 0 0 • S A L T L A K E C I T Y • U T A H • 8 4 1 0 3 - 1 1 1 4 • P H 8 0 1 . 5 8 2 . 0 3 5 3
Central Allocation Office GmbH (CAO), in its function as Auction Office for the coordinated auction of capacities at the common borders of CEPS, a.s. (CEPS), transpower stromübertragungs gmbh (TPS), PSE Operator S.A. (PSEO), Slovenská elektrizačná prenosová sústava, a.s. (SEPS, a.s.) and Vattenfall Europe Transmission GmbH (VE-T) has offered in the yearly Auction. The cross-border transmission capacities at the common borders of CEPS, TPS, PSEO, SEPS, a.s. and VE-T are defined Table 1. Commercial profile direction and total promise of capacities in Central and Eastern are defined in Table 2.
Table 1. Technical profile and offered capacities in Central and Eastern Europe 65 Technical Profile Offered Capacity
IN [MW] Offered Capacity OUT [MW]
PSEO - (CEPS + SEPS, a.s. + VE-T)
Ain Aout
VE-T - (CEPS + PSEO) Bin Bout
CEPS - PSEO Cin Cout
E.ON - CEPS Fin Fout
SEPS, a.s. - PSEO Hin Hout
Table 2. Commercial profile direction and total promise of capacities in Central and Eastern
Europe 66 Commercial Profile Direction
Total Promise of Capacity (MW)
Commercial Profile Direction
Total Promise of Capacity (MW)
PSEO → CEPS X2PC VE-T → PSEO X1VP
CEPS → PSEO X2CP PSEO → VE-T X1PV
VE-T → CEPS X3VC CEPS → E.ON X5CE
CEPS → VE-T X3CV .ON → CEPS X5E
PSEO → SEPS X4PS CEPS → SEPS X6CS
SEPS → PSEO X4SP SEPS → CEPS X6SC
65 cao, 2010; http://www.central-ao.com/index.php/auctions-2010/5-tsos-auctions/yearly-auction 66 cao, 2010; http://www.central-ao.com/index.php/auctions-2010/5-tsos-auctions/yearly-auction
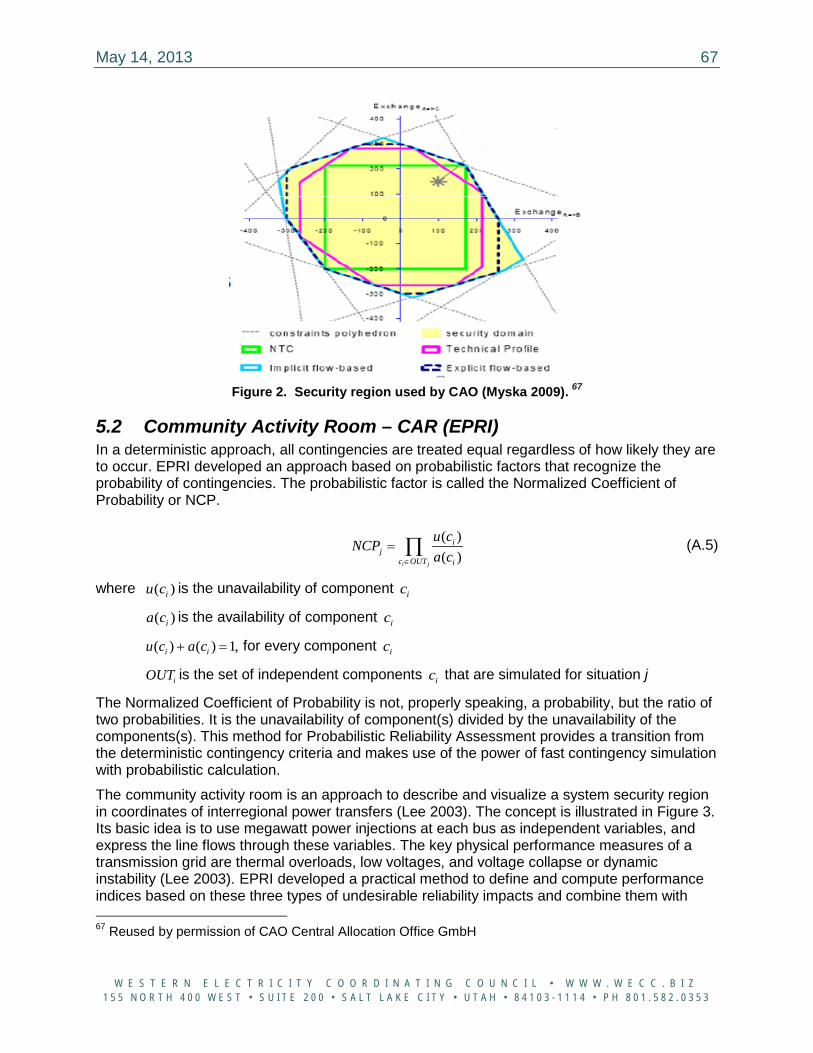
May 14, 2013 67
W E S T E R N E L E C T R I C I T Y C O O R D I N A T I N G C O U N C I L • W W W . W E C C . B I Z 1 5 5 N O R T H 4 0 0 W E S T • S U I T E 2 0 0 • S A L T L A K E C I T Y • U T A H • 8 4 1 0 3 - 1 1 1 4 • P H 8 0 1 . 5 8 2 . 0 3 5 3
Figure 2. Security region used by CAO (Myska 2009). 67
5.2 Community Activity Room – CAR (EPRI) In a deterministic approach, all contingencies are treated equal regardless of how likely they are to occur. EPRI developed an approach based on probabilistic factors that recognize the probability of contingencies. The probabilistic factor is called the Normalized Coefficient of Probability or NCP.
( )( )
i j
ij
c OUT i
u cNCPa c∈
= ∏ (A.5)
where ( )iu c is the unavailability of component ic
( )ia c is the availability of component ic
( ) ( ) 1,i iu c a c+ = for every component ic
iOUT is the set of independent components ic that are simulated for situation j
The Normalized Coefficient of Probability is not, properly speaking, a probability, but the ratio of two probabilities. It is the unavailability of component(s) divided by the unavailability of the components(s). This method for Probabilistic Reliability Assessment provides a transition from the deterministic contingency criteria and makes use of the power of fast contingency simulation with probabilistic calculation.
The community activity room is an approach to describe and visualize a system security region in coordinates of interregional power transfers (Lee 2003). The concept is illustrated in Figure 3. Its basic idea is to use megawatt power injections at each bus as independent variables, and express the line flows through these variables. The key physical performance measures of a transmission grid are thermal overloads, low voltages, and voltage collapse or dynamic instability (Lee 2003). EPRI developed a practical method to define and compute performance indices based on these three types of undesirable reliability impacts and combine them with 67 Reused by permission of CAO Central Allocation Office GmbH
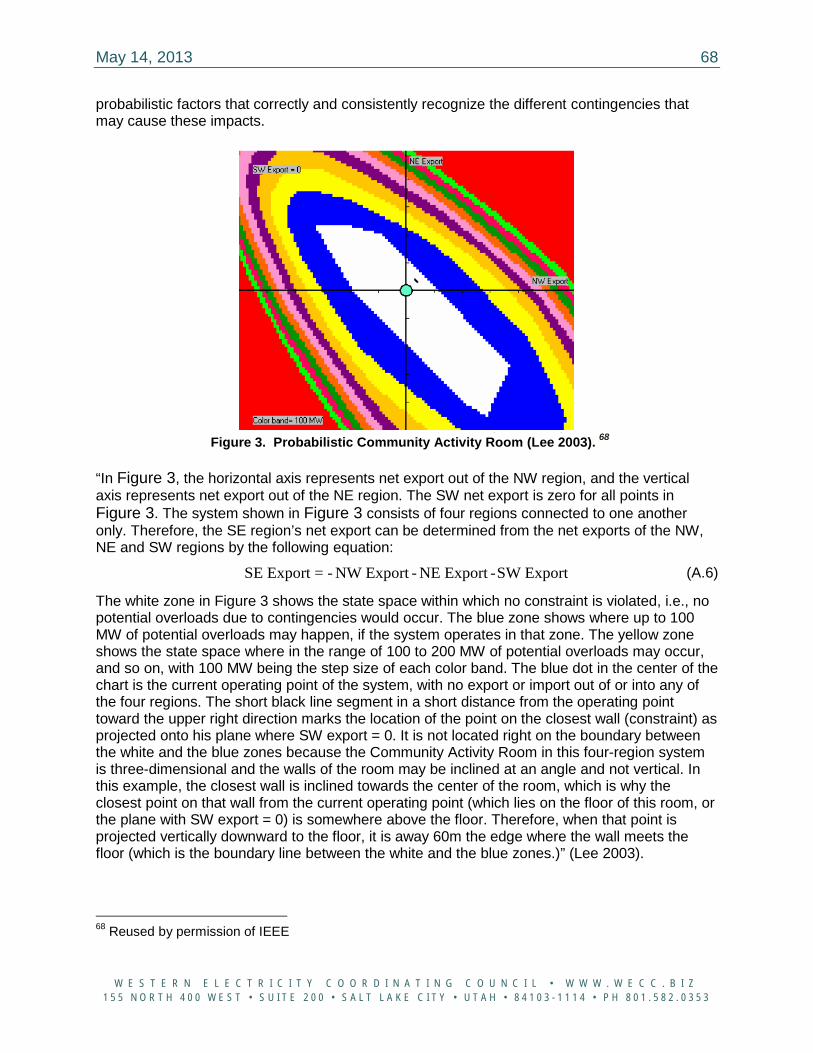
May 14, 2013 68
W E S T E R N E L E C T R I C I T Y C O O R D I N A T I N G C O U N C I L • W W W . W E C C . B I Z 1 5 5 N O R T H 4 0 0 W E S T • S U I T E 2 0 0 • S A L T L A K E C I T Y • U T A H • 8 4 1 0 3 - 1 1 1 4 • P H 8 0 1 . 5 8 2 . 0 3 5 3
probabilistic factors that correctly and consistently recognize the different contingencies that may cause these impacts.
Figure 3. Probabilistic Community Activity Room (Lee 2003). 68
“In Figure 3, the horizontal axis represents net export out of the NW region, and the vertical axis represents net export out of the NE region. The SW net export is zero for all points in Figure 3. The system shown in Figure 3 consists of four regions connected to one another only. Therefore, the SE region’s net export can be determined from the net exports of the NW, NE and SW regions by the following equation:
SE Export = - NW Export - NE Export -SW Export (A.6)
The white zone in Figure 3 shows the state space within which no constraint is violated, i.e., no potential overloads due to contingencies would occur. The blue zone shows where up to 100 MW of potential overloads may happen, if the system operates in that zone. The yellow zone shows the state space where in the range of 100 to 200 MW of potential overloads may occur, and so on, with 100 MW being the step size of each color band. The blue dot in the center of the chart is the current operating point of the system, with no export or import out of or into any of the four regions. The short black line segment in a short distance from the operating point toward the upper right direction marks the location of the point on the closest wall (constraint) as projected onto his plane where SW export = 0. It is not located right on the boundary between the white and the blue zones because the Community Activity Room in this four-region system is three-dimensional and the walls of the room may be inclined at an angle and not vertical. In this example, the closest wall is inclined towards the center of the room, which is why the closest point on that wall from the current operating point (which lies on the floor of this room, or the plane with SW export = 0) is somewhere above the floor. Therefore, when that point is projected vertically downward to the floor, it is away 60m the edge where the wall meets the floor (which is the boundary line between the white and the blue zones.)” (Lee 2003).
68 Reused by permission of IEEE
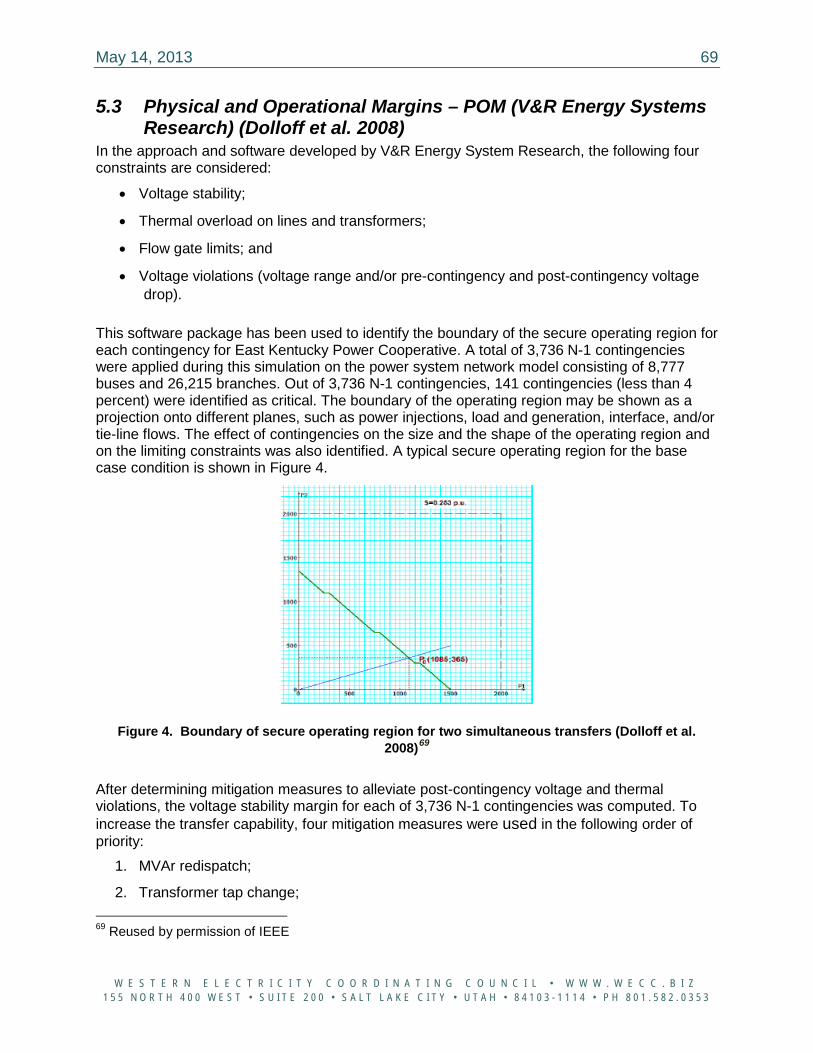
May 14, 2013 69
W E S T E R N E L E C T R I C I T Y C O O R D I N A T I N G C O U N C I L • W W W . W E C C . B I Z 1 5 5 N O R T H 4 0 0 W E S T • S U I T E 2 0 0 • S A L T L A K E C I T Y • U T A H • 8 4 1 0 3 - 1 1 1 4 • P H 8 0 1 . 5 8 2 . 0 3 5 3
5.3 Physical and Operational Margins – POM (V&R Energy Systems Research) (Dolloff et al. 2008)
In the approach and software developed by V&R Energy System Research, the following four constraints are considered:
• Voltage stability;
• Thermal overload on lines and transformers;
• Flow gate limits; and
• Voltage violations (voltage range and/or pre-contingency and post-contingency voltage drop).
This software package has been used to identify the boundary of the secure operating region for each contingency for East Kentucky Power Cooperative. A total of 3,736 N-1 contingencies were applied during this simulation on the power system network model consisting of 8,777 buses and 26,215 branches. Out of 3,736 N-1 contingencies, 141 contingencies (less than 4 percent) were identified as critical. The boundary of the operating region may be shown as a projection onto different planes, such as power injections, load and generation, interface, and/or tie-line flows. The effect of contingencies on the size and the shape of the operating region and on the limiting constraints was also identified. A typical secure operating region for the base case condition is shown in Figure 4.
Figure 4. Boundary of secure operating region for two simultaneous transfers (Dolloff et al. 2008)69
After determining mitigation measures to alleviate post-contingency voltage and thermal violations, the voltage stability margin for each of 3,736 N-1 contingencies was computed. To increase the transfer capability, four mitigation measures were used in the following order of priority:
1. MVAr redispatch;
2. Transformer tap change; 69 Reused by permission of IEEE
May 14, 2013 70
W E S T E R N E L E C T R I C I T Y C O O R D I N A T I N G C O U N C I L • W W W . W E C C . B I Z 1 5 5 N O R T H 4 0 0 W E S T • S U I T E 2 0 0 • S A L T L A K E C I T Y • U T A H • 8 4 1 0 3 - 1 1 1 4 • P H 8 0 1 . 5 8 2 . 0 3 5 3
3. Capacitor and reactor switching; and
4. Line switching.
5.4 Wide-area Security Nomograms (PNNL)70 (Makarov et al. 2010b) With the increasing penetration of intermittent renewable generation and the increasing variability of generation dispatches caused by variable resources and energy market forces, the power flow patterns become increasingly diverse and deviate from the pre-designed conditions that are embedded into the existing transmission system structure and parameters. To mitigate the impacts of renewable resources on the system, new wide-area Balancing Authority (BA) coordination and cooperation schemes have been implemented or are currently under evaluation. These could lead to wide-area redistributions of power flows and their growing additional variability. In this situation, it becomes evident that the transmission system constraints should be determined on a wide-area system level rather than ignoring the mutual effects of multiple transmission tie-lines as current practice does. To address the aforementioned issue, a practical method has been developed by PNNL to determine the wide-area security nomogram (WASN) of an electrical power system. The nonlinear region’s boundary is approximated by hyperplanes or equivalently by linear inequalities applied to critical system parameters, such as power flows on critical paths and phase angle differences. Offline computer simulations are conducted to build the security region. All essential constraints, including thermal, voltage stability, transient stability, and small signal stability, can be incorporated into the proposed framework. The hyperplanes can be used offline for grid planning, or applied in real-time along with state estimation data and/or phasor information to implement the following functions – see Figure 5:
• Distinguish secure and insecure conditions; • Monitor power system security margin (distance to insecurity); • Detect weak elements of the system responsible for insecurity; • Provide actionable information on system redispatch to increase security margin,
including coordinated redispatches among WECC Balancing Authorities, and • Predict possible violations and abnormal conditions ahead of time.
70 Contributed by Pengwei Du and Yuri Makarov, PNNL.
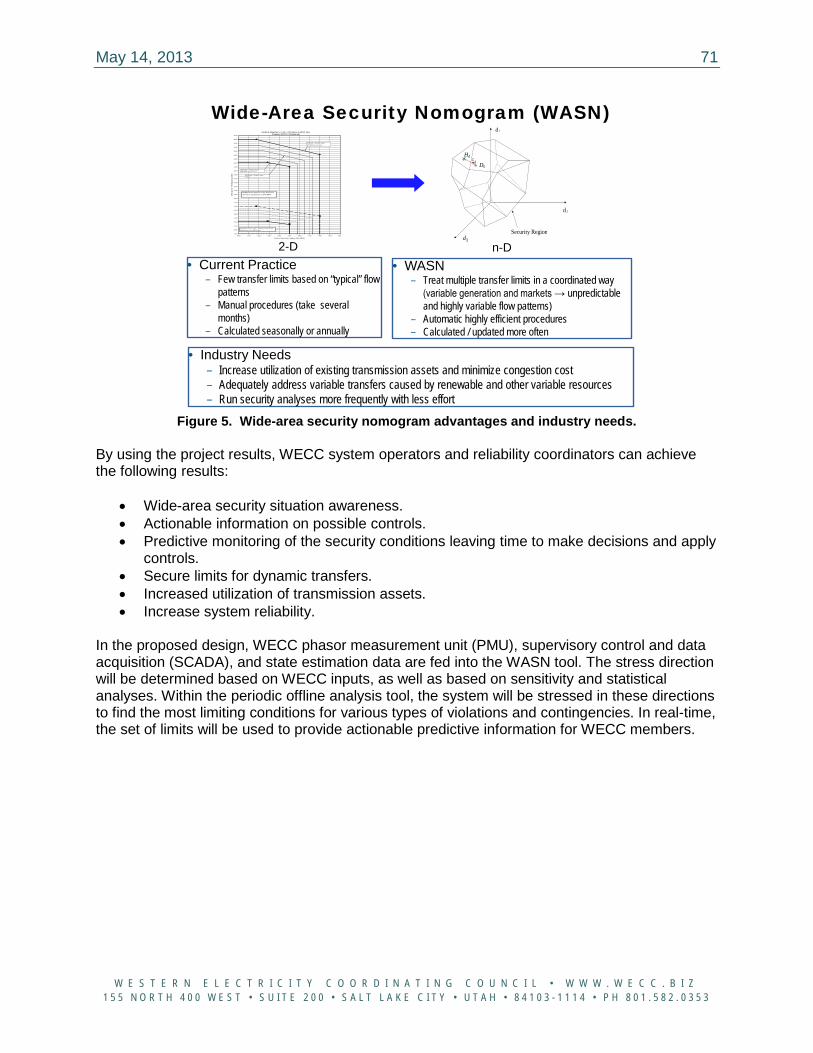
May 14, 2013 71
W E S T E R N E L E C T R I C I T Y C O O R D I N A T I N G C O U N C I L • W W W . W E C C . B I Z 1 5 5 N O R T H 4 0 0 W E S T • S U I T E 2 0 0 • S A L T L A K E C I T Y • U T A H • 8 4 1 0 3 - 1 1 1 4 • P H 8 0 1 . 5 8 2 . 0 3 5 3
Figure 5. Wide-area security nomogram advantages and industry needs.
By using the project results, WECC system operators and reliability coordinators can achieve the following results:
• Wide-area security situation awareness. • Actionable information on possible controls. • Predictive monitoring of the security conditions leaving time to make decisions and apply
controls. • Secure limits for dynamic transfers. • Increased utilization of transmission assets. • Increase system reliability.
In the proposed design, WECC phasor measurement unit (PMU), supervisory control and data acquisition (SCADA), and state estimation data are fed into the WASN tool. The stress direction will be determined based on WECC inputs, as well as based on sensitivity and statistical analyses. Within the periodic offline analysis tool, the system will be stressed in these directions to find the most limiting conditions for various types of violations and contingencies. In real-time, the set of limits will be used to provide actionable predictive information for WECC members.
Wide-Area Security Nomogram (WASN)
• Current Practice– Few transfer limits based on “typical” flow
patterns– Manual procedures (take several
months)– Calculated seasonally or annually
North of John Day vs. COI + NW/Sierra or PDCI Flow(Summer 2008 N-S Nomogram)
2400
2500
2600
2700
2800
2900
3000
3100
3200
3300
3400
3500
3600
3700
3800
3900
4000
4100
4200
4300
4400
4500
4600
4700
4800
4900
7000 7100 7200 7300 7400 7500 7600 7700 7800 7900 8000
North of John Day Cutplane Flow (MW)
PDCI
or C
OI +
NW/Si
erra
Flow
(MW
)
Midpoint - Summer Lake400 MW East to West MW E W
Midpoint - Summer Lake400 MW West to East
Midpoint - Summer Lake0 MW
Midpoint to Summer Lake flows are shown in increments of 200 MW
Solid lines are for COI + NW/Sierra limits and Dashed line is for PDCI limit.
2-D
Security Region
d 1
d 3
d 2
ξd D0
Hd
n-D• WASN
– Treat multiple transfer limits in a coordinated way (variable generation and markets → unpredictable and highly variable flow patterns)
– Automatic highly efficient procedures– Calculated / updated more often
• Industry Needs– Increase utilization of existing transmission assets and minimize congestion cost– Adequately address variable transfers caused by renewable and other variable resources– Run security analyses more frequently with less effort
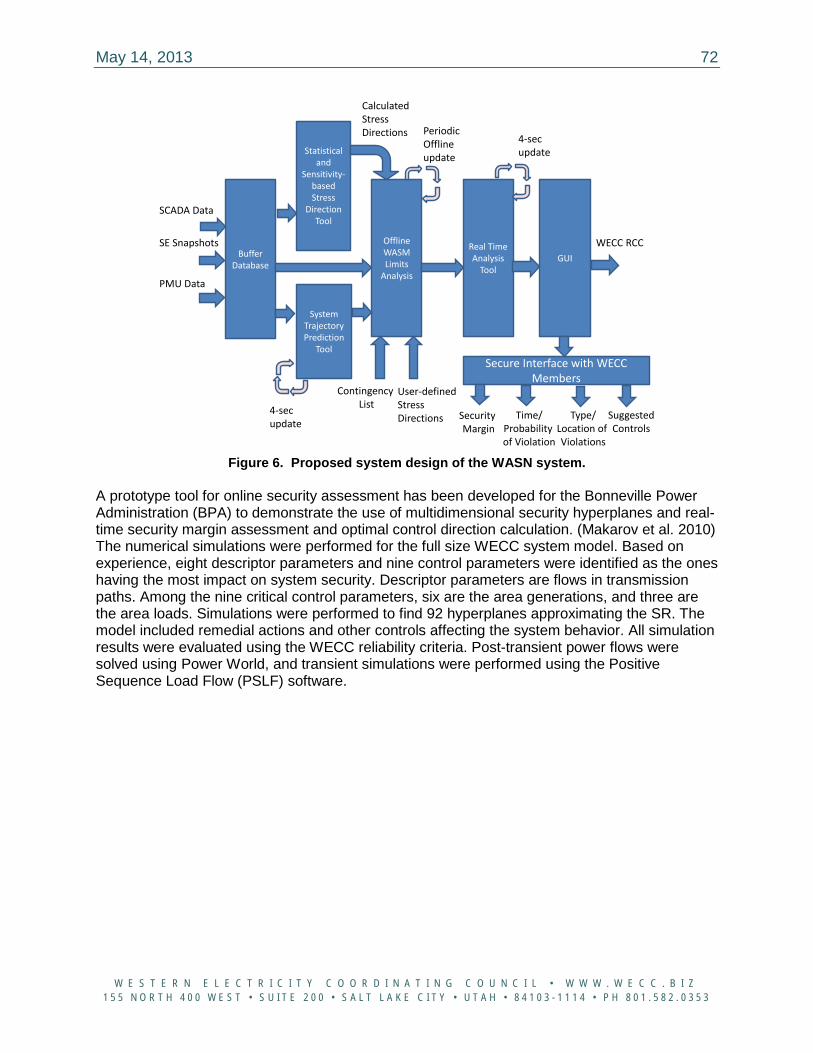
May 14, 2013 72
W E S T E R N E L E C T R I C I T Y C O O R D I N A T I N G C O U N C I L • W W W . W E C C . B I Z 1 5 5 N O R T H 4 0 0 W E S T • S U I T E 2 0 0 • S A L T L A K E C I T Y • U T A H • 8 4 1 0 3 - 1 1 1 4 • P H 8 0 1 . 5 8 2 . 0 3 5 3
Figure 6. Proposed system design of the WASN system.
A prototype tool for online security assessment has been developed for the Bonneville Power Administration (BPA) to demonstrate the use of multidimensional security hyperplanes and real-time security margin assessment and optimal control direction calculation. (Makarov et al. 2010) The numerical simulations were performed for the full size WECC system model. Based on experience, eight descriptor parameters and nine control parameters were identified as the ones having the most impact on system security. Descriptor parameters are flows in transmission paths. Among the nine critical control parameters, six are the area generations, and three are the area loads. Simulations were performed to find 92 hyperplanes approximating the SR. The model included remedial actions and other controls affecting the system behavior. All simulation results were evaluated using the WECC reliability criteria. Post-transient power flows were solved using Power World, and transient simulations were performed using the Positive Sequence Load Flow (PSLF) software.
BufferDatabase
SE Snapshots
SCADA Data
PMU Data
Statistical and
Sensitivity-based Stress
Direction Tool
Offline WASM Limits
Analysis
Periodic Offline update
User-definedStress Directions
Contingency List
Calculated Stress Directions
Real Time Analysis
Tool
4-sec update
System Trajectory Prediction
Tool
4-sec update
GUIWECC RCC
Secure Interface with WECC Members
Security Margin
Time/Probability of Violation
Type/Location of Violations
SuggestedControls
May 14, 2013 73
W E S T E R N E L E C T R I C I T Y C O O R D I N A T I N G C O U N C I L • W W W . W E C C . B I Z 1 5 5 N O R T H 4 0 0 W E S T • S U I T E 2 0 0 • S A L T L A K E C I T Y • U T A H • 8 4 1 0 3 - 1 1 1 4 • P H 8 0 1 . 5 8 2 . 0 3 5 3
APPENDIX 6
Elements of the Theory Behind Transmission Line Ratings
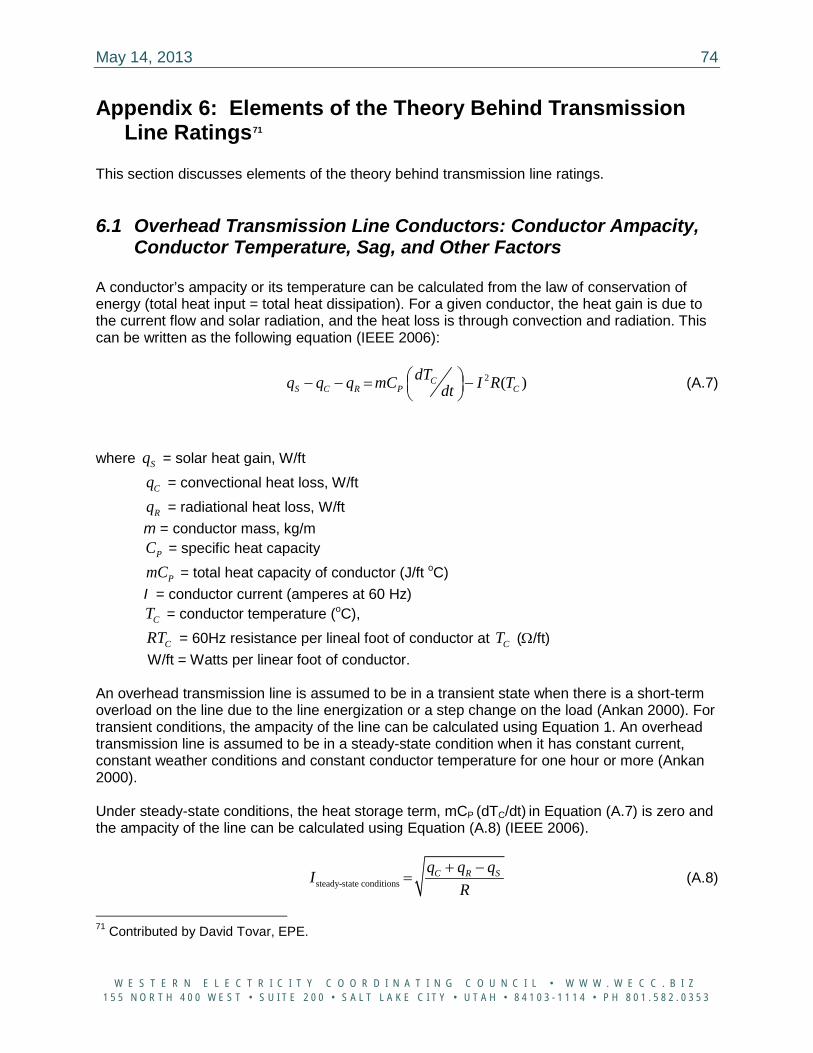
May 14, 2013 74
W E S T E R N E L E C T R I C I T Y C O O R D I N A T I N G C O U N C I L • W W W . W E C C . B I Z 1 5 5 N O R T H 4 0 0 W E S T • S U I T E 2 0 0 • S A L T L A K E C I T Y • U T A H • 8 4 1 0 3 - 1 1 1 4 • P H 8 0 1 . 5 8 2 . 0 3 5 3
Appendix 6: Elements of the Theory Behind Transmission Line Ratings71
This section discusses elements of the theory behind transmission line ratings.
6.1 Overhead Transmission Line Conductors: Conductor Ampacity, Conductor Temperature, Sag, and Other Factors
A conductor’s ampacity or its temperature can be calculated from the law of conservation of energy (total heat input = total heat dissipation). For a given conductor, the heat gain is due to the current flow and solar radiation, and the heat loss is through convection and radiation. This can be written as the following equation (IEEE 2006):
2 ( )CS C R P C
dTq q q mC I R Tdt − − = −
(A.7)
where Sq = solar heat gain, W/ft
Cq = convectional heat loss, W/ft
Rq = radiational heat loss, W/ft m = conductor mass, kg/m
PC = specific heat capacity
PmC = total heat capacity of conductor (J/ft oC) I = conductor current (amperes at 60 Hz)
CT = conductor temperature (oC),
CRT = 60Hz resistance per lineal foot of conductor at CT (Ω/ft) W/ft = Watts per linear foot of conductor.
An overhead transmission line is assumed to be in a transient state when there is a short-term overload on the line due to the line energization or a step change on the load (Ankan 2000). For transient conditions, the ampacity of the line can be calculated using Equation 1. An overhead transmission line is assumed to be in a steady-state condition when it has constant current, constant weather conditions and constant conductor temperature for one hour or more (Ankan 2000). Under steady-state conditions, the heat storage term, mCP (dTC/dt) in Equation (A.7) is zero and the ampacity of the line can be calculated using Equation (A.8) (IEEE 2006).
steady-state conditionsC R Sq q qI
R+ −
= (A.8)
71 Contributed by David Tovar, EPE.
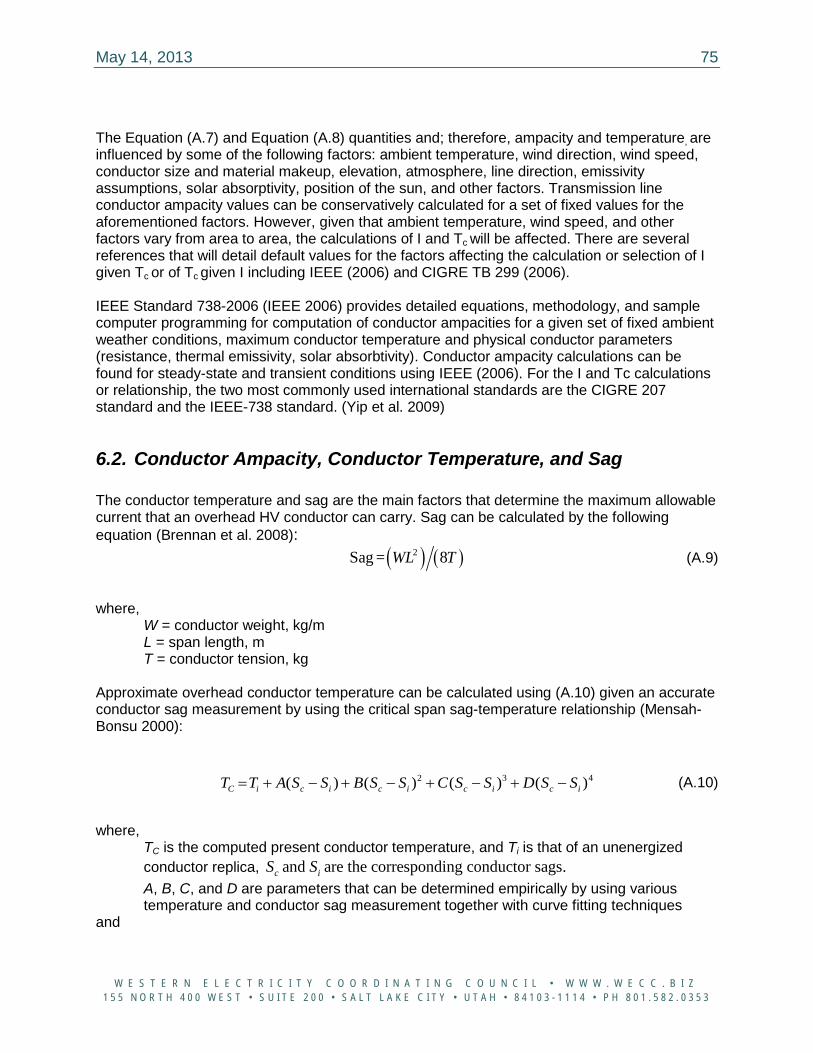
May 14, 2013 75
W E S T E R N E L E C T R I C I T Y C O O R D I N A T I N G C O U N C I L • W W W . W E C C . B I Z 1 5 5 N O R T H 4 0 0 W E S T • S U I T E 2 0 0 • S A L T L A K E C I T Y • U T A H • 8 4 1 0 3 - 1 1 1 4 • P H 8 0 1 . 5 8 2 . 0 3 5 3
The Equation (A.7) and Equation (A.8) quantities and; therefore, ampacity and temperature, are influenced by some of the following factors: ambient temperature, wind direction, wind speed, conductor size and material makeup, elevation, atmosphere, line direction, emissivity assumptions, solar absorptivity, position of the sun, and other factors. Transmission line conductor ampacity values can be conservatively calculated for a set of fixed values for the aforementioned factors. However, given that ambient temperature, wind speed, and other factors vary from area to area, the calculations of I and Tc will be affected. There are several references that will detail default values for the factors affecting the calculation or selection of I given Tc or of Tc given I including IEEE (2006) and CIGRE TB 299 (2006). IEEE Standard 738-2006 (IEEE 2006) provides detailed equations, methodology, and sample computer programming for computation of conductor ampacities for a given set of fixed ambient weather conditions, maximum conductor temperature and physical conductor parameters (resistance, thermal emissivity, solar absorbtivity). Conductor ampacity calculations can be found for steady-state and transient conditions using IEEE (2006). For the I and Tc calculations or relationship, the two most commonly used international standards are the CIGRE 207 standard and the IEEE-738 standard. (Yip et al. 2009)
6.2. Conductor Ampacity, Conductor Temperature, and Sag The conductor temperature and sag are the main factors that determine the maximum allowable current that an overhead HV conductor can carry. Sag can be calculated by the following equation (Brennan et al. 2008): ( ) ( )2Sag = 8WL T (A.9)
where,
W = conductor weight, kg/m L = span length, m T = conductor tension, kg
Approximate overhead conductor temperature can be calculated using (A.10) given an accurate conductor sag measurement by using the critical span sag-temperature relationship (Mensah-Bonsu 2000):
2 3 4( ) ( ) ( ) ( )C i c i c i c i c iT T A S S B S S C S S D S S= + − + − + − + − (A.10)
where,
TC is the computed present conductor temperature, and Ti is that of an unenergized conductor replica, and are the corresponding conductor sags.c iS S A, B, C, and D are parameters that can be determined empirically by using various temperature and conductor sag measurement together with curve fitting techniques
and
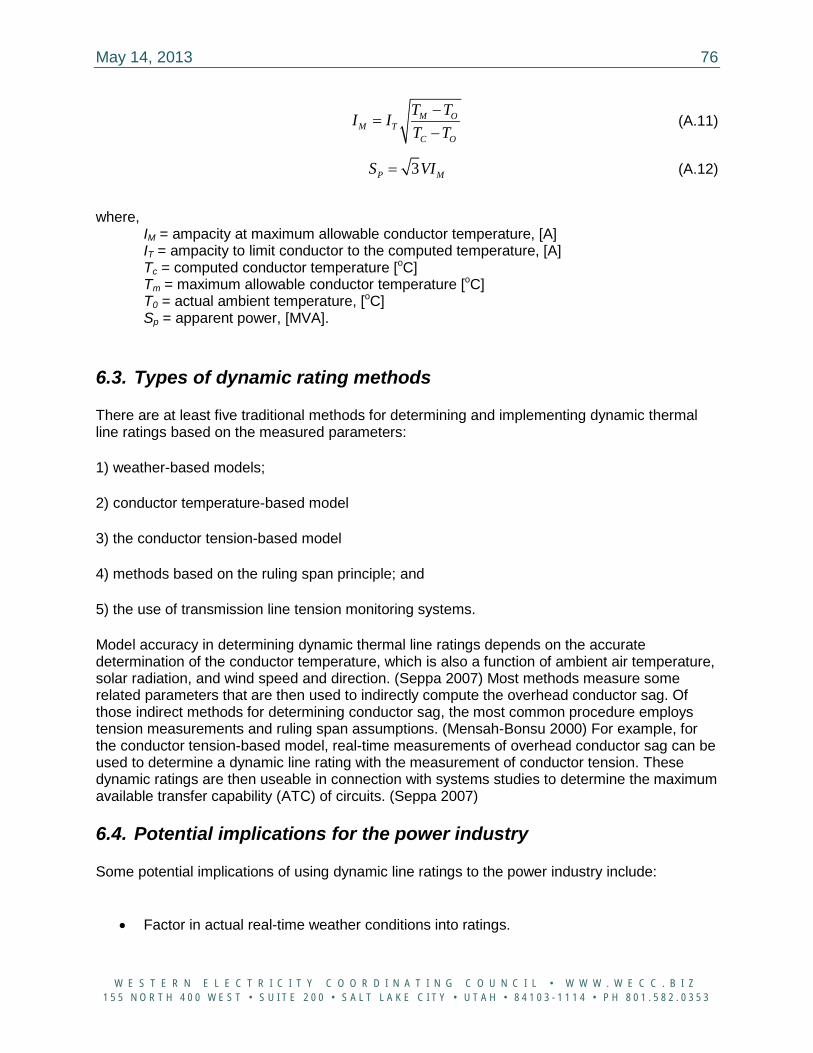
May 14, 2013 76
W E S T E R N E L E C T R I C I T Y C O O R D I N A T I N G C O U N C I L • W W W . W E C C . B I Z 1 5 5 N O R T H 4 0 0 W E S T • S U I T E 2 0 0 • S A L T L A K E C I T Y • U T A H • 8 4 1 0 3 - 1 1 1 4 • P H 8 0 1 . 5 8 2 . 0 3 5 3
M OM T
C O
T TI IT T
−=
− (A.11)
3P MS VI= (A.12)
where, IM = ampacity at maximum allowable conductor temperature, [A] IT = ampacity to limit conductor to the computed temperature, [A] Tc = computed conductor temperature [oC] Tm = maximum allowable conductor temperature [oC] T0 = actual ambient temperature, [oC] Sp = apparent power, [MVA].
6.3. Types of dynamic rating methods
There are at least five traditional methods for determining and implementing dynamic thermal line ratings based on the measured parameters:
1) weather-based models;
2) conductor temperature-based model
3) the conductor tension-based model
4) methods based on the ruling span principle; and
5) the use of transmission line tension monitoring systems.
Model accuracy in determining dynamic thermal line ratings depends on the accurate determination of the conductor temperature, which is also a function of ambient air temperature, solar radiation, and wind speed and direction. (Seppa 2007) Most methods measure some related parameters that are then used to indirectly compute the overhead conductor sag. Of those indirect methods for determining conductor sag, the most common procedure employs tension measurements and ruling span assumptions. (Mensah-Bonsu 2000) For example, for the conductor tension-based model, real-time measurements of overhead conductor sag can be used to determine a dynamic line rating with the measurement of conductor tension. These dynamic ratings are then useable in connection with systems studies to determine the maximum available transfer capability (ATC) of circuits. (Seppa 2007)
6.4. Potential implications for the power industry
Some potential implications of using dynamic line ratings to the power industry include:
• Factor in actual real-time weather conditions into ratings.
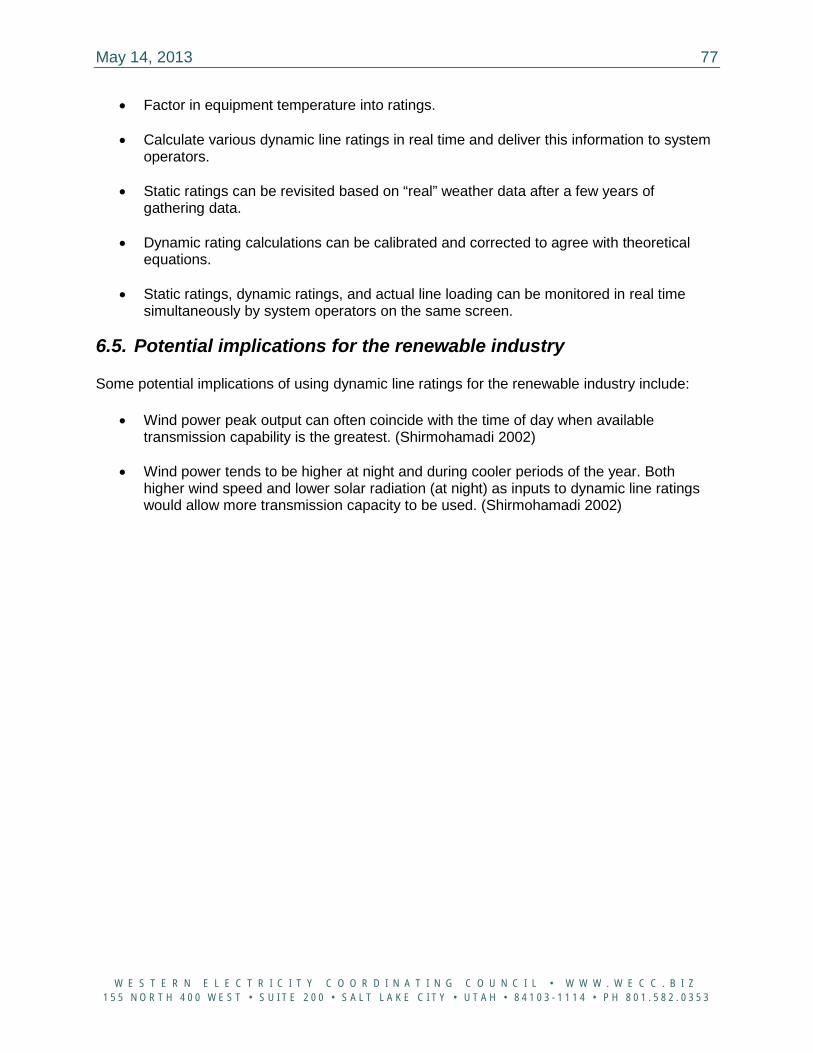
May 14, 2013 77
W E S T E R N E L E C T R I C I T Y C O O R D I N A T I N G C O U N C I L • W W W . W E C C . B I Z 1 5 5 N O R T H 4 0 0 W E S T • S U I T E 2 0 0 • S A L T L A K E C I T Y • U T A H • 8 4 1 0 3 - 1 1 1 4 • P H 8 0 1 . 5 8 2 . 0 3 5 3
• Factor in equipment temperature into ratings.
• Calculate various dynamic line ratings in real time and deliver this information to system operators.
• Static ratings can be revisited based on “real” weather data after a few years of gathering data.
• Dynamic rating calculations can be calibrated and corrected to agree with theoretical equations.
• Static ratings, dynamic ratings, and actual line loading can be monitored in real time simultaneously by system operators on the same screen.
6.5. Potential implications for the renewable industry
Some potential implications of using dynamic line ratings for the renewable industry include:
• Wind power peak output can often coincide with the time of day when available transmission capability is the greatest. (Shirmohamadi 2002)
• Wind power tends to be higher at night and during cooler periods of the year. Both higher wind speed and lower solar radiation (at night) as inputs to dynamic line ratings would allow more transmission capacity to be used. (Shirmohamadi 2002)
May 14, 2013 78
W E S T E R N E L E C T R I C I T Y C O O R D I N A T I N G C O U N C I L • W W W . W E C C . B I Z 1 5 5 N O R T H 4 0 0 W E S T • S U I T E 2 0 0 • S A L T L A K E C I T Y • U T A H • 8 4 1 0 3 - 1 1 1 4 • P H 8 0 1 . 5 8 2 . 0 3 5 3
APPENDIX 7
Relative Costs per MW-km of Different Transmission Technologies
May 14, 2013 79
W E S T E R N E L E C T R I C I T Y C O O R D I N A T I N G C O U N C I L • W W W . W E C C . B I Z 1 5 5 N O R T H 4 0 0 W E S T • S U I T E 2 0 0 • S A L T L A K E C I T Y • U T A H • 8 4 1 0 3 - 1 1 1 4 • P H 8 0 1 . 5 8 2 . 0 3 5 3
Appendix 7: Relative Costs per MW-km of Different Transmission Technologies Alberta Energy performed engineering studies for cost estimates of various transmission technologies. Graphical representation of the summary results of cost estimates for transmission technologies can be found in Alberta Energy (2009).
May 14, 2013 80
W E S T E R N E L E C T R I C I T Y C O O R D I N A T I N G C O U N C I L • W W W . W E C C . B I Z 1 5 5 N O R T H 4 0 0 W E S T • S U I T E 2 0 0 • S A L T L A K E C I T Y • U T A H • 8 4 1 0 3 - 1 1 1 4 • P H 8 0 1 . 5 8 2 . 0 3 5 3
APPENDIX 8
National and International Experience in UHV Transmission
May 14, 2013 81
W E S T E R N E L E C T R I C I T Y C O O R D I N A T I N G C O U N C I L • W W W . W E C C . B I Z 1 5 5 N O R T H 4 0 0 W E S T • S U I T E 2 0 0 • S A L T L A K E C I T Y • U T A H • 8 4 1 0 3 - 1 1 1 4 • P H 8 0 1 . 5 8 2 . 0 3 5 3
Appendix 8: National and International Experience in UHV Transmission
8.1 United States
“In the United States, transmission voltages above 1,000 kV were considered by two utilities: American Electric Power (AEP) and Bonneville Power Administration (BPA). In both cases, the purpose of the new transmission systems was to transmit large amounts of power, improve system stability, and reduce environmental impact. Three separate research and test facilities were built to evaluate the technical feasibility of transmission lines above 1,000 kV:
1. The AEP test facility, located near South Bend, Indiana, had the capability of testing single-phase conductor bundles corresponding to transmission system voltages up to, and even beyond, 1,500 kV. A single-phase experimental line and two test cages were used to evaluate the corona performance of large conductor bundles.
2. At BPA, a full scale three–phase, 1,200-kV prototype test line near Lyons, Oregon, was used to evaluate the long-term corona performance of an eight-conductor bundle. In addition, the facility at Carey High Voltage Laboratory was used for studies on air insulation, while conductor vibration and galloping studies were carried out at the Moro mechanical test line.
3. The General Electric (GE)/EPRI Project UHV comprised a three-phase experimental line, a test cage, and a pollution chamber. The facility had the capability of testing the corona performance of conductor bundles, withstand strength of air gaps, and the pollution performance of line and station.
Data on the corona performance of several bundles, with up to 18 subconductors, were obtained at the AEP/ASEA test facility (Scherer et al. 1980). The results obtained at BPA included switching surge withstanding strength of air gaps, pollution performance characteristics of ceramic and nonceramic insulator strings, and corona performance (Perry et al. 1979) of a seven- and an eight-conductor bundle. Eleven different conductor bundles, with subconductor diameters varying from 3.3 to 5.6 cm and the number of subconductors from 6 to 16, were tested at the GE/EPRI Project UHV at system voltages from 950 to 1450 kV to obtain a vast amount of data on the corona performance (EPRI 1982).” (Lings 2005)
8.2 Russia
“In the 1970s, in order to satisfy the need for strengthening the electrical links between integrated power systems as well as the need for transfer of large quantities of power over long distances, the USSR had an in-depth study on the insulation system, line, and equipment of UHV-AC transmission at voltages in the range of 1,150 to 1,500 kV.
A circuit of three phases 1.17-km long 1150-kV test line was constructed at the Bely Rast Substation. Test data were obtained on the corona performance of conductor bundles. Tests of the air insulation, insulation of equipment, studies of switching over-voltage, audible noise (AN), radio interference (RI), electric fields in a substation, and installation, operation and maintenance of equipment were also carried out.
May 14, 2013 82
W E S T E R N E L E C T R I C I T Y C O O R D I N A T I N G C O U N C I L • W W W . W E C C . B I Z 1 5 5 N O R T H 4 0 0 W E S T • S U I T E 2 0 0 • S A L T L A K E C I T Y • U T A H • 8 4 1 0 3 - 1 1 1 4 • P H 8 0 1 . 5 8 2 . 0 3 5 3
2362-km 1150-kV AC transmission lines were constructed successively in the USSR from the end of 1980s through the beginning of 1990s. Three substations and two segments were put into service, but the line, after a few years of operation at the design voltage of 1,150 kV, has been operated at the lower level of 500 kV because of a steady decline in load growth following the energy crisis.” (Huang et al. 2009)
8.3 Japan
Japan began study on UHV transmission technology in 1973. The need for overcoming stability problems of the existing 500-kV network and obviating the problems of excessive short-circuit currents led to the consideration of transmission above 1,000 kV to overlay the existing network. And UHV research was carried out at Central Research Institute of Electric Power Industry (CRIEPI), Tokyo Electric Power Company (TEPCO), and the NGK Insulator Company. The testing facilities of CRIEPI have a UHV fog chamber for testing of polluted insulators, a facility for insulator testing while being continuously energized with phase-to-ground voltages up to 900 kV, a corona cage used for AN test, and a double-circuit 600-m long test line of voltage 1,000-kV AC (convertible to a ±500- to ±650-kV DC). On the UHV test line, the behavior of 8-, 10-, and 12-conductor bundles and towers under strong wind and earthquake were investigated. Construction and maintenance techniques, AN, RI and television interference (TVI), as well as studies of the effects of electric fields, were also investigated.
TEPCO began construction of the 1,000-kV transmission project in 1988, and the Sin-Haruna UHV equipment test field was constructed in 1996. The construction of 427-km, 1,000-kV double-circuit transmission line on the same tower was completed in 1999, but the line has been operated at 500 kV because it was energized, and is planned to be upgraded to 1,000-kV AC around 2015.” (Huang et al. 2009)
8.4 Canada
“In Canada, the need for transmission systems above 1,000 kV was foreseen in the provinces of British Columbia and Québec to bring large blocks of power from remote hydroelectric projects to the load centers. The main research and test facilities for studies at system voltages above 1000 kV were located at the Institut de Recherche d’Hydro-Québec (IREQ), Hydro-Québec’s research institute. The test facilities at IREQ (Hylten-Cavallius and Train 1974) comprised a large indoor high-voltage laboratory, with capabilities for air insulation studies on tower window mockups for system voltages up to 1,500 kV, a large pollution chamber for studies on insulators, and an outdoor experimental line and test cages for corona studies. A test line was also built at Magdalen Islands to study vibration performance of conductor bundles and development of spacer dampers. Phase-to-ground and phase-to-phase air insulation tests on-line and substation configurations at IREQ provided a large amount of data necessary for determining air gap clearances for transmission lines and substations at system voltages of 1,200 and 1,500 kV. Corona studies were carried out in the test cages on six- and eight-conductor bundles, and the 6 x 46.53 mm conductor bundle was selected for 1,200-kV lines.” (Lings 2005)
8.5 Italy
“In the middle of 1970s, Italy began study on UHV transmission technology, and the purpose was to transmit large blocks of power from large power generation facilities to the load centers far away. The UHV transmission studies were carried out in Italy at several testing stations and
May 14, 2013 83
W E S T E R N E L E C T R I C I T Y C O O R D I N A T I N G C O U N C I L • W W W . W E C C . B I Z 1 5 5 N O R T H 4 0 0 W E S T • S U I T E 2 0 0 • S A L T L A K E C I T Y • U T A H • 8 4 1 0 3 - 1 1 1 4 • P H 8 0 1 . 5 8 2 . 0 3 5 3
laboratories. At the Suvereto 1,000-kV Project, a 1-km long test line was used for air insulation and corona studies; a 40-m outdoor test cage was also used for corona studies. Switching impulse behavior of air clearances, behavior of surface insulation of UHV system in polluted atmosphere, performance of SF6 insulation, and development of nonconventional insulators were carried out. Studies on the interference levels produced by UHV insulators and fittings were also carried out.
A test line at Pradarena Pass was used for icing and wind loading studies in winter and vibration, sub-span galloping, and spacer performance studies in summer. Studies on air insulation and performance of polluted insulators were carried out at the CESI laboratories in Milan. The research generated a large amount of data for determining phase-to-ground and phase-to-phase air clearances, selecting ceramic and non-ceramic insulator strings, and selecting conductor bundles for a 1,050-kV prototype transmission line. The test data were also used in the development of vibration dampers, spacers, and nonconventional tower structures and foundations for 1,050-kV transmission lines.” (Huang et al. 2009)
8.6 China
“WHVRI, CEPRI, EPCRI of State Grid Corporation of China (SGCC) and some universities began study on the UHV transmission technology in 1986. Since 1986, the UHV transmission research was included in the mega-projects of Scientific Research for 7th Five-Year plan, 8th Five-Year plan and 10th Five-Year plan in China. Some subject research had been developed, including the prophase research of UHV AC transmission (1986–1990) structured by Importance Project Ministry of State Council; demonstration on long distance transmission and voltage level (1990–1995) structured by Importance Project Ministry of State Council; the feasibility study on 1,000 kV AC transmission (1990–1995) and the prophase demonstration on UHV AC transmission (1997–1999) structured by Ministry of Science and Technology of China; UHV AC test line (1994–1996), the effects on environment of UHV AC transmission line (1997–1999) and the generation of long front switching wave by using power frequency test equipment (1997–1999) structured by Ministry of Power Industry of China; the background factor of UHV AC transmission technology development (1998–2000) and external insulation characteristics of UHV AC transmission line (1999–2001) structured by State Power Corporation; higher voltage level application in Southern Power Grid (2003–2004) structured by China Southern Power Grid Corporation (CSG); the economical feasibility study on 1,000 kV AC transmission (2003–2004) structured by SGCC. Test facilities of WHVRI of SGCC comprising a 450 m × 120 m outdoor test yard, a 5.4 MV, 530-kJ impulse generator, a 24 m × 24 m × 26 m artificial pollution chamber with a 800-kV (phase-earth) rated voltage wall bushing, a 3 × 750 kV, 4-A transformer cascade, 2,250-kVA regulator, 7,500-kVA synchronous generation voltage regulation unit; and a 1,000-kV 200-m long test line that was constructed at WHVRI of SGCC in 1994. Test facilities of CEPRI comprise a 6-MV, 300-kJ impulse generator and a transformer cascade. A tower test site was constructed at ECPRI of SGCC in 2004.” (Huang et al. 2009)
“The Jindognan – Nanyang – Jingmen UHV AC transmission project began commercial operation in January 2009. The 650 km long line has two segments: a 360-km line from Jindognan in the northern province of Shaanxi to Nanyang, and a 290-km line from Nanyang to Jingmen in the central province of Hubei. The project includes a 3.7-km line crossing the Yellow river and a 2.9-km line crossing the Hanjiang River. The UHV AC has been built by the country's largest transmission utility, State Grid Corporation of China (SGCC), at an estimated cost of

May 14, 2013 84
W E S T E R N E L E C T R I C I T Y C O O R D I N A T I N G C O U N C I L • W W W . W E C C . B I Z 1 5 5 N O R T H 4 0 0 W E S T • S U I T E 2 0 0 • S A L T L A K E C I T Y • U T A H • 8 4 1 0 3 - 1 1 1 4 • P H 8 0 1 . 5 8 2 . 0 3 5 3
CNY 5.7 billion. The project, which began in 2006, took 28 months to complete and about 168 hours of test runs to be capable of commercial operation.” (Global Transmission Report 2009)
May 14, 2013 85
W E S T E R N E L E C T R I C I T Y C O O R D I N A T I N G C O U N C I L • W W W . W E C C . B I Z 1 5 5 N O R T H 4 0 0 W E S T • S U I T E 2 0 0 • S A L T L A K E C I T Y • U T A H • 8 4 1 0 3 - 1 1 1 4 • P H 8 0 1 . 5 8 2 . 0 3 5 3
APPENDIX 9
Additional Information on HVDC Line Design Considerations
May 14, 2013 86
W E S T E R N E L E C T R I C I T Y C O O R D I N A T I N G C O U N C I L • W W W . W E C C . B I Z 1 5 5 N O R T H 4 0 0 W E S T • S U I T E 2 0 0 • S A L T L A K E C I T Y • U T A H • 8 4 1 0 3 - 1 1 1 4 • P H 8 0 1 . 5 8 2 . 0 3 5 3
Appendix 9: Additional Information on HVDC Line Design Considerations “HVDC system for 750 to 800 kV has been often identified as advantageous for transmitting large power over long distances.” (Huang 2002) This section provides additional information on HVDC projects.
9.1 Advantages of DC systems over AC systems The following advantages of DC systems over AC systems for integration of renewable energy are listed in the available literature:
• Interconnection of non-synchronous systems. “HVDC technology can be used to transport electricity over long distances or to interconnect different power systems whose grid frequencies are not synchronized.” (Alstom Grid 2010) “There are also HVDC links between networks with different nominal frequencies (50 and 60 Hz) in Japan and South America.” (Larruskain et al. 2007)
• “Multi-terminal DC system configuration helps to “identify the most suitable multi-terminal DC system architecture in terms of increasing operation flexibility, availability and reliability, enhancing the controllability and power transfer capability, and increasing network observability to better exploit and predict system operation stability limits.” (Alstom Grid 2010)
• Investment cost. “An HVDC transmission line costs less than an AC line for the same transmission capacity. However, the terminal stations are more expensive in the HVDC case because they must perform the conversion from AC to DC and vice versa…Above a certain distance, the so called "break-even distance", the HVDC alternative will always give the lowest cost. The break-even-distance is much smaller for submarine cables (typically about 50 km) than for an overhead line transmission. The distance depends on several factors, such as transmission medium, different local aspects (permits, cost of local labor etc.), and an analysis must be made for each individual case.” (Larruskain et al. 2007). Figure 7 shows an example of total cost analysis for DC and AC transmission cost depending on distance, cost of transmission, terminal cost and losses.
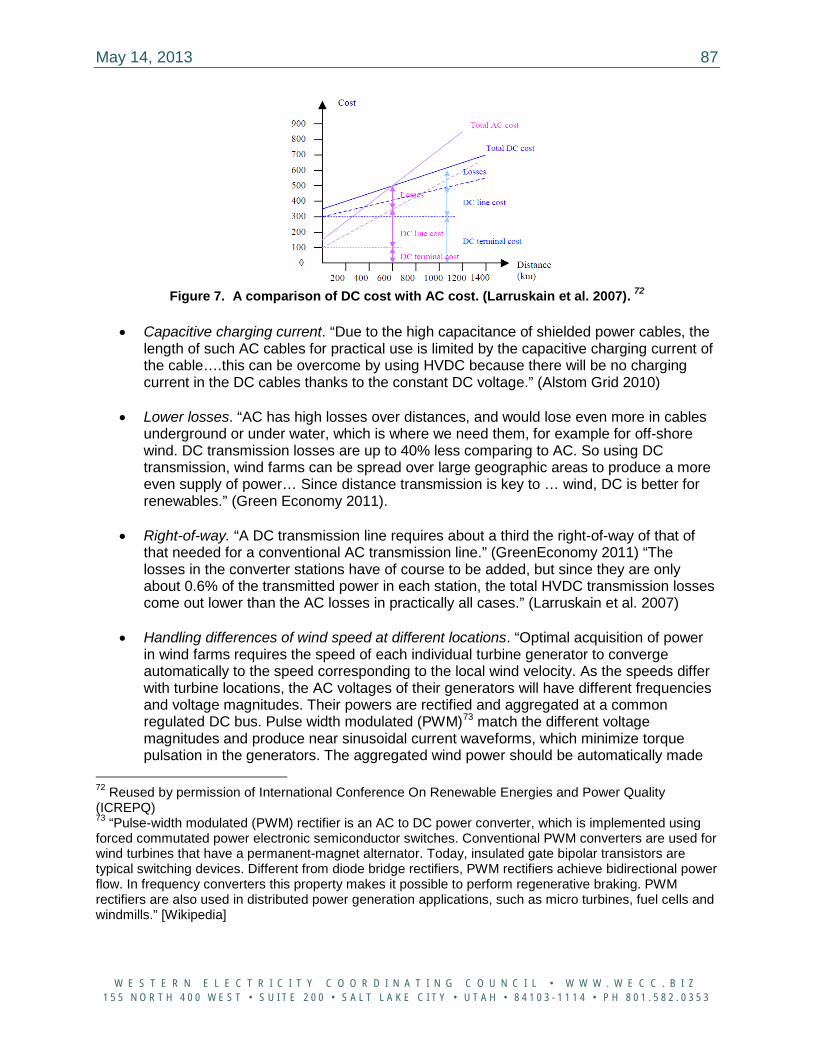
May 14, 2013 87
W E S T E R N E L E C T R I C I T Y C O O R D I N A T I N G C O U N C I L • W W W . W E C C . B I Z 1 5 5 N O R T H 4 0 0 W E S T • S U I T E 2 0 0 • S A L T L A K E C I T Y • U T A H • 8 4 1 0 3 - 1 1 1 4 • P H 8 0 1 . 5 8 2 . 0 3 5 3
Figure 7. A comparison of DC cost with AC cost. (Larruskain et al. 2007). 72
• Capacitive charging current. “Due to the high capacitance of shielded power cables, the
length of such AC cables for practical use is limited by the capacitive charging current of the cable….this can be overcome by using HVDC because there will be no charging current in the DC cables thanks to the constant DC voltage.” (Alstom Grid 2010)
• Lower losses. “AC has high losses over distances, and would lose even more in cables underground or under water, which is where we need them, for example for off-shore wind. DC transmission losses are up to 40% less comparing to AC. So using DC transmission, wind farms can be spread over large geographic areas to produce a more even supply of power… Since distance transmission is key to … wind, DC is better for renewables.” (Green Economy 2011).
• Right-of-way. “A DC transmission line requires about a third the right-of-way of that of
that needed for a conventional AC transmission line.” (GreenEconomy 2011) “The losses in the converter stations have of course to be added, but since they are only about 0.6% of the transmitted power in each station, the total HVDC transmission losses come out lower than the AC losses in practically all cases.” (Larruskain et al. 2007)
• Handling differences of wind speed at different locations. “Optimal acquisition of power in wind farms requires the speed of each individual turbine generator to converge automatically to the speed corresponding to the local wind velocity. As the speeds differ with turbine locations, the AC voltages of their generators will have different frequencies and voltage magnitudes. Their powers are rectified and aggregated at a common regulated DC bus. Pulse width modulated (PWM)73 match the different voltage magnitudes and produce near sinusoidal current waveforms, which minimize torque pulsation in the generators. The aggregated wind power should be automatically made
72 Reused by permission of International Conference On Renewable Energies and Power Quality (ICREPQ) 73 “Pulse-width modulated (PWM) rectifier is an AC to DC power converter, which is implemented using forced commutated power electronic semiconductor switches. Conventional PWM converters are used for wind turbines that have a permanent-magnet alternator. Today, insulated gate bipolar transistors are typical switching devices. Different from diode bridge rectifiers, PWM rectifiers achieve bidirectional power flow. In frequency converters this property makes it possible to perform regenerative braking. PWM rectifiers are also used in distributed power generation applications, such as micro turbines, fuel cells and windmills.” [Wikipedia]
May 14, 2013 88
W E S T E R N E L E C T R I C I T Y C O O R D I N A T I N G C O U N C I L • W W W . W E C C . B I Z 1 5 5 N O R T H 4 0 0 W E S T • S U I T E 2 0 0 • S A L T L A K E C I T Y • U T A H • 8 4 1 0 3 - 1 1 1 4 • P H 8 0 1 . 5 8 2 . 0 3 5 3
available to the AC utility grid in a form that meets frequency, voltage regulation and harmonic distortion standards.” (Lu and Ooi 2001)
• Controllability and power modulation capability. “An HVDC transmission has the advantage, compared to an AC transmission system -- the power can be accurately controlled at all times. This can be used to modulate the power to stabilize the surrounding AC system. One typical such application is to modulate the DC power based on a frequency measurement. This is of course also possible to implement in a multi-terminal HVDC installation, if only the balance requirement is fulfilled. It is also possible to apply modulation to several converters simultaneously, as long as the other terminals have the current capability to facilitate the current order request.” (Lescale et al. 2008)
• Long distance water crossing. “In a long AC cable transmission, the reactive power flow due to the large cable capacitance will limit the maximum transmission distance. With HVDC, there is no such limitation, why, for long cable links, HVDC is the only viable technical alternative.” (Larruskain et al. 2007)
• Environment. Improved energy transmission possibilities contribute to a more efficient utilization of existing power plants. The land coverage and the associated right-of-way cost for a HVDC overhead transmission line is not as high as for an AC line. This reduces the visual impact. It is also possible to increase the power.
• Low impact of geomagnetic storms. “Low-frequency induced voltage due to geomagnetic storms do not impact DC lines because the induced voltage is negligible compared with the converter voltages.” (Lescale et al. 2008)
The HVDC systems can also pose some serious negative system impacts and/or design implications that should be taken into consideration:
• Cost. The cost of converter stations makes DC lines less cost-effective for short distances.
• Reliability. “Due to the large amount of power transmitted by multi-terminal, ultra high voltage direct current (UHVDC) transmissions reliability is the most important challenge. This concerns both the traditional reliability and availability related to outages and transient reliability related to performance during and recovery after temporary faults and disturbances.” (Lescale et al. 2008)
• Additional stress due to multi-terminal operation. “The most significant additional stress due to multi-terminal is the increased transient and temporary overcurrent in the inverters at any type of disturbances and faults as all parallel converters contribute to the current overshot. In the case that faults in a multi-terminal network are cleared by full size HVDC breakers, switching type over-voltages is introduced into the DC system.” (Lescale et al. 2008) “With the present state of the art, development of large terminal HVDC networks with many terminals is problematic due to the spread out of disturbances.” (Lescale et al. 2008)
• DC circuit breakers for DC grid protection. “High-voltage DC circuit breakers still need to be developed and validated at full scale to operate a multi-terminal DC network. They
May 14, 2013 89
W E S T E R N E L E C T R I C I T Y C O O R D I N A T I N G C O U N C I L • W W W . W E C C . B I Z 1 5 5 N O R T H 4 0 0 W E S T • S U I T E 2 0 0 • S A L T L A K E C I T Y • U T A H • 8 4 1 0 3 - 1 1 1 4 • P H 8 0 1 . 5 8 2 . 0 3 5 3
are vital in case of faults, since the DC circuit breaker must dissipate the energy stored in the cable or line and withstand the system voltage. Their task is even more demanding if the AC-DC conversion is performed by voltage-sourced converter (VSC). The current rises very rapidly in case of DC short circuits due to the rapid discharge of DC capacitors, so a DC breaker has to break much faster than an AC breaker.” (Alstom Grid 2010)
• “Operation and control strategies for multi-terminal DC grid voltage control, power sharing and dispatch among the connected AC grids, voltage and frequency support of the connected AC grids, etc.” (Alstom Grid 2010)
• Environment. “There are…some environmental issues which must be considered for the converter stations, such as: audible noise, visual impact, electromagnetic compatibility and use of ground or sea return path in monopolar operation.” (Larruskain et al. 2007)
• Telecommunications. Operating HVDC requires intensive telecommunication activity. (Lescale et al. 2008)
9.2 Characteristics of VSC-HVDC The characteristics of VSC-HVDC have been investigated in Arrillaga et al. (2007), Asplund (2000), ABB (2012), Zhang (2004), Angeles-Camacho et al. (2003), and other papers. The key advantages of VSC-HVDC, in comparison with the classic HVDC that is based on current source converters, are described in Arrillaga et al. (2007), Asplund (2000), and ABB (2012). VSC-HVDC can control both active and reactive power independently, and generate or consume reactive power within a wider range than a conventional HVDC. This is because VSC-HVDC converter stations employ state-of-the-art power semiconductors. VSC-HVDC can create any voltage phase angle or amplitude almost instantaneously, and operate even at zero active power, and still provide the full range of reactive power. VSC-HVDC is based on a modular concept with standardized sizes for the converter stations. The converter station with VSC is more compact and has a smaller footprint. Modular systems can be installed in different stages to meet the capacity demand. VSC-HVDC allows connecting substations to a generic point of the line. Costs are naturally lower when the new substation is not sized to carry the full load. VSC technology facilitates the connection of several converters to a common bipolar DC bus because the voltage polarity is not reversed when changing the power direction. Naturally, the VSC-HVDC technology also presents some drawbacks when compared to conventional HVDC. As a result of higher cost of the converter stations, VSC-HVDC technology is more expensive than traditional HVDC. VSC-HVDC technology shows higher converter losses than traditional HVDC. Consequently, for a given transmission capacity, the cable length that equals the AC overhead line systems losses is higher than that for HVDC. VSC-HVDC is by nature bipolar because the DC circuit is not connected to ground. Differently from traditional bipolar HVDC, VSC-HVDC has no possibility to execute emergency power transfer via one pole when the other pole trips. DC line-to-ground faults are more critical with VSC-HVDC. However, considering the intrinsic features of VSC-HVDC and the steady advances in such technological fields, it is expected that some disadvantages can be quickly scaled down and others overcome.
May 14, 2013 90
W E S T E R N E L E C T R I C I T Y C O O R D I N A T I N G C O U N C I L • W W W . W E C C . B I Z 1 5 5 N O R T H 4 0 0 W E S T • S U I T E 2 0 0 • S A L T L A K E C I T Y • U T A H • 8 4 1 0 3 - 1 1 1 4 • P H 8 0 1 . 5 8 2 . 0 3 5 3
9.3 Additional information on the selection of rated current in HVDC projects
For long-distance bulk-power transmission projects, the losses are highly dependent upon the operating current level, especially as these are related to the square of current. The losses can be reduced by either reducing the resistance (i.e., increasing the size or number of conductors) or by reducing the current (i.e., increasing the voltage). The reduction of losses beyond a certain level by reducing resistance or current becomes counterproductive due to increased cost of equipment and transmission line. The long-term (from minutes to several hours) and short-term (generally for few seconds) overload capability of the project are critical to take care of outages in the DC as well as AC system and to maintain AC system stability following faults and disturbances. Further, since the operating voltage in a long distance project is more or less fixed, the variations in power over the link have to be adopted by varying the current, which means margins in the capability to go for higher current must be available in the equipment. Any restriction on the overload capability of the project as required by the system (for example, due to current limitations) is therefore not desirable. The project must have transient overload current requirements over the continuous current requirements. The usual values for long-term overload may be 10 to 30 percent and for short-term, these may be up to 50 percent of the normal range. At the levels of currents of 3,500-4,000 amps, with the present day technology, the limiting component in the design of HVDC projects from current point of view is likely to be the thyristor. Therefore, the choice of thyristor has to be such that sufficient margins are left after meeting the system requirements. The modern 5-in. thyristors have a voltage capability of 8 kV and a continuous current capability up to 4 kA, depending on the transient current requirements and cooling conditions. Higher currents can be managed by the thyristors with lower voltage capability (for example 4.5 kA / 5.5 kV). However, this will increase the number of thyristors and the valve tower sizes significantly. The rated DC currents in the range of 3-3.5 kA can fit better into the current capability of the 8-kV thyristors. A greater amount of rated current may also have impact on the design and location of the ground electrode because ,during the outage of a DC line, the pole connected to the other line has to be operated in the ground return mode. This may, depending on the selected power and voltage level, require currents higher than 3 kA through the ground for long durations. Experience has shown that impacts of injecting high amounts of DC current through ground are not always entirely predictable. Thus, relatively speaking, the ground return mode operation is more demanding in the configuration wherein the current through the ground is over 3000 A. Wherever multiple HVDC projects are located close to each other, several other considerations and studies may be necessary for their mutual effects, including the effect of simultaneous operation in ground return mode. Due to the practical limits on the operating current, required developments on the maximum operating voltage and system requirements, it seems that the maximum continuous power with present day technology of a single bipolar UHVDC project with two series converters is about 6000 MW.
May 14, 2013 91
W E S T E R N E L E C T R I C I T Y C O O R D I N A T I N G C O U N C I L • W W W . W E C C . B I Z 1 5 5 N O R T H 4 0 0 W E S T • S U I T E 2 0 0 • S A L T L A K E C I T Y • U T A H • 8 4 1 0 3 - 1 1 1 4 • P H 8 0 1 . 5 8 2 . 0 3 5 3
9.4 Selection of rated voltage, current, and project configuration While the losses of the overhead lines reduce with increased operating voltage at a given power, the converter losses of the converter station will remain within in the same range (approximately 1.5 percent of both stations) due to voltage-dependent portions of load losses. With increased line length, the power rating and the optimal operating voltage will be higher. However, the selected rated voltage shall be based on the optimization results, taking overall capitalized cost of losses into account, together with cost of equipment and materials. As the power level increases, various options should be evaluated to arrive at the final configuration of the transmission system. The first impact of increase in power transmission requirements of more than 3,000-3,500 MW (say 3,500-4,500 MW) may be reflected in the increase in the size of converter transformers beyond the transportation limits of certain locations. The solution may be to adopt single-phase, two-winding converter transformers, which would result in smaller converter transformers, but increased an number of them. However, keeping in view the increasing losses of the system, there would be high motivation to increase the operating voltage of the project above ± 500 kV. Therefore, with power levels approaching 5,000 MW, there may be a need to further split the converter transformers from the transportation point of view with consequent emergence of multiple valve groups per pole; either in series or parallel form. When the need for multiple groups arises, the series group may tend to be adopted mainly because the series groups maintain balance in the two-pole currents even during outages of a series group, so there are potentially no ground currents even when one of the series groups is out. In case of parallel groups, there would be ground currents when one of the groups has suffered an outage. However, in case the requirements of high power transmission force the thyristors to reach their current limitations, parallel groups (or additional bipoles) may be the choice. The parallel groups also have lower losses as compared to series groups when there is an outage of a valve group. Further, the parallel groups are highly adaptable to stage wise development of a project as parallel groups can easily be added to an existing pole with minimum disturbance. This advantage of parallel groups may be attractive whenever staging is required, even when the power rating of a project is low in spite of the fact that certain equipment (e.g., smoothing reactor and valves) may increase in number. The parallel group option is like a multi-terminal project and thus the parallel groups can easily be located at different places and may be used to reduce the cost of the AC transmission system by collecting and delivering power at different locations in the grid. This may have several system related advantages.” (Huang 2002) “In case the requirements of power transmission are not above the capabilities of valves, alternative solutions may be considered for evaluation whereby the converter transformers may be kept out in the switchyard where valve side wye and delta connections can be formed and final connections taken inside the valve hall. Perhaps a small reservation with this alternative is due to a complicated bus works that contains combined AC and DC voltages in the AC switchyard that is exposed to environment.” (Huang 2002) “The operating voltage and configuration of project, i.e. the number and type of converter transformers and adoption of series and parallel groups are strongly influenced by the amount of power that has to be transmitted. With increasing power level a likely transition may be:
• A bipole with single valve group and single-phase three-winding transformer • A bipole with single valve group and single-phase two-winding transformer
May 14, 2013 92
W E S T E R N E L E C T R I C I T Y C O O R D I N A T I N G C O U N C I L • W W W . W E C C . B I Z 1 5 5 N O R T H 4 0 0 W E S T • S U I T E 2 0 0 • S A L T L A K E C I T Y • U T A H • 8 4 1 0 3 - 1 1 1 4 • P H 8 0 1 . 5 8 2 . 0 3 5 3
• A bipole with series valve group and single-phase two-winding transformer • A bipole with parallel valve groups and single-phase two-winding transformer.
The above, by no means, is a complete list of possible options. For example, due to some requirements of reliability for HVDC line, a decision may be made to go for an additional bipole.”
9.5 National and international HVDC projects74 “Large HVDC transmission schemes having power transmission capacities of 4,000-6,000 MW and distance up to 2000 km are currently under planning for various large hydropower stations in China, India and other regions. Ultra high DC voltage (UHVDC) in the range of 750 and 800 kV is the preferred DC voltage level for these applications. In the last decades, the HVDC developed into a mature and proven technology for bulk power transmissions. Many HVDC projects have been realized for power rating in the range of 2,000 to 3,000 MW at 500-kV voltage levels. The first HVDC project with voltage above 500 kV is the Cahora – Bassa between Mozambique and South Africa (533 kV, 1,920 MW), which was built almost 30 years ago. The second HVDC project with voltage over 500 kV is the Itaipu HVDC project (600 kV, 3,150 MW) constructed about 20 years ago.” (Huang et al. undated) There are many different reasons as to why HVDC was chosen. A few of the reasons in selected projects by Rudervall et al. (2012) are:
• Itaipu, Brazil: HVDC was chosen to supply 50-Hz power into a 60 Hz system and to economically transmit large amounts of hydropower (6,300 MW) over large distances (800 km).
• Leyte-Luzon Project in the Philippines: HVDC was chosen to enable supply of bulk geothermal power across an island interconnection, and to improve stability to the Manila AC network.
• Rihand-Delhi Project in India: HVDC was chosen to transmit bulk (thermal) power (1,500 MW) to Delhi to ensure minimum losses, the least amount right-of-way needed, and better stability and control.
• Garabi, an independent transmission project (ITP) transferring power from Argentina to Brazil: an HVDC back-to-back system was chosen to ensure supply of 50-Hz bulk (1000-MW) power to a 60-Hz system under a 20-year power supply contract.
• Gotland, Sweden: HVDC was chosen to connect a newly-developed wind power site to the main city of Visby, in consideration of the environmental sensitivity of the project area (an archaeological and tourist area) and improve power quality.
• Queensland, Australia: HVDC was chosen in an ITP to interconnect two independent grids (of New South Wales and Queensland) to enable electricity trading between the two systems (including change of direction of power flow), ensure very low environmental impact and reduce construction time.
74 Contributed by Yuri Makarov, PNNL.
May 14, 2013 93
W E S T E R N E L E C T R I C I T Y C O O R D I N A T I N G C O U N C I L • W W W . W E C C . B I Z 1 5 5 N O R T H 4 0 0 W E S T • S U I T E 2 0 0 • S A L T L A K E C I T Y • U T A H • 8 4 1 0 3 - 1 1 1 4 • P H 8 0 1 . 5 8 2 . 0 3 5 3
9.6 Atlantic Wind Connection (AWC) Project “The Mid-Atlantic region offers more than 60,000 MW of offshore wind potential in the relatively shallow waters of the outer continental shelf. These shallow waters, which extend miles out to sea, allow for the development of large, distant wind farms, mitigating visibility issues and allowing for greater energy capture from stronger winds. With few other renewable energy options ideally suited for the Atlantic coast, this transmission project will help states meet their renewable energy goals and standards by enabling the local offshore wind industry to deploy thousands of megawatts of clean, cost-effective energy. Without a transmission backbone, offshore wind developers would be forced to bring energy to land via radial lines that can make balancing the region’s existing grid more difficult. In addition, a single offshore backbone with a limited number of landfall points will minimize the environmental impacts of building multiple individual radial lines to shore. The AWC project not only reduces the need to build many lower-capacity transmission lines, but relieves grid congestion in one of two National Interest Electric Transmission Corridors, which were deemed to have significant transmission network congestion and need speedy creation of transmission capacity. When complete, the AWC backbone will be able to connect up to 7,000 MW of offshore wind. The system is also scalable and can be expanded to accommodate additional offshore wind energy as the industry further develops. The use of high-voltage direct current (HVDC) technology allows for easier integration and control of multiple wind farms while avoiding the electrical losses associated with more typical high-voltage alternating current (HVAC) lines. With this strong backbone in place, larger and more energy efficient wind farms can connect to offshore power hubs further out to sea. These power hubs will in turn be connected via sub-sea cables to the strongest, highest capacity parts of the land-based transmission system.” (Atlantic Wind Connection. 2012)
9.7 Iowa Rock Island Clean Line “The Rock Island Clean Line, is a proposal to construct and operate a roughly 500-mile overhead electrical transmission line across Iowa to Illinois. The project represents a potential investment of $1.7 billion to construct the HVDC transmission line. It also has potential to influence up to $7 billion in new wind-farm construction in the region… It was decided a more direct line would be most economical and efficient to construct and operate, as well as having less of an impact on communities and landowners.
After determining a final route, the corridor will be narrowed to a right-of-way easement of 150 to 200-ft wide, with landowners retaining full property ownership and rights to use the land for farming and other purposes. A difference for the Rock Island Clean Line is that it is a DC transmission line rather than AC. HVDC generally works more efficiently over long distances and stray voltage issues don’t occur with DC lines as they do with AC lines. What’s more, a DC transmission line requires about one-third the right–of-way of that needed for a conventional AC transmission line.
O’Brien and Cherokee counties are being considered for a 65-acre, $250 million station that will convert the AC current from wind farms into DC for transmission to a similar station in northern
May 14, 2013 94
W E S T E R N E L E C T R I C I T Y C O O R D I N A T I N G C O U N C I L • W W W . W E C C . B I Z 1 5 5 N O R T H 4 0 0 W E S T • S U I T E 2 0 0 • S A L T L A K E C I T Y • U T A H • 8 4 1 0 3 - 1 1 1 4 • P H 8 0 1 . 5 8 2 . 0 3 5 3
Illinois. Studies show that most power on a DC line would come from wind sources located within 50 to 100 miles of a converter station. Costs for the Clean Line are about $2 million per mile. The proposed line will deliver about 3,500 MW to points east, an amount equal to that now generated by existing wind turbines in Iowa… Construction would begin in 2014. The Rock Island Clean Line is one of four such projects proposed by Clean Line. Similar projects are being proposed for the Grain Belt Express from Kansas into eastern Missouri, the Plains and Eastern Line from Oklahoma into Arkansas and Tennessee, and the Centennial West Line from New Mexico into Arizona and California.” (Dvorak 2011)
9.8 Pittsburg-San Francisco Transbay cable
“Transbay, erected by Siemens Energy, transmits 400 MW of electrical output at a transmission voltage of ±200 kV with low losses and high energy efficiency via an 88-kilometer (53-mile) marine cable link from Pittsburg, California, to San Francisco.” (Green Economy 2011) The project has been operational since late 2010. (Martin 2010)
9.9 China
“China’s State Grid Corporation had entered into commercial service a 1,000-kV UHV AC project (and 800 kV in DC). The Jindongnan – Nanyang – Jingmen project connects the North China Power Grid and Central China Power Grid, starting from Jindongnan Substation in the coal-rich Shanxi Province. It passes through Nanyang Switch Station in Henan Province, and ends at Jingmen Substation in hydropower-abundant Hubei Province. The transmission capacity is 3,000 MVA . State Grid Corporation will now build 17,600 km of UHV lines by 2012” (Powernews 2009). “State Grid Corporation plans to build a network of ultra-high-voltage power transmission lines by 2020, linking major energy production bases with the nation's power-guzzling regions. The company will complete the construction of a network of UHV lines in northern, eastern and central China. Most of the country's coal mines are located in northern China, and a large part of the country's water resources are in southwestern regions. Power generated in these regions can be sent to the high energy-consuming eastern and southern regions more effectively through UHV lines. Construction of UHV lines has evoked intense debate in the country. Some analysts said it is not worthwhile to build such projects, which are very costly. State Grid said earlier it planned to invest 100 billion Yuan ($14.7 billion) in building UHV projects over the next 4 years.” (China Dailey 2010)
9.10 Neptune Regional Transmission System (RTS)
“Neptune RTS operates the Neptune Project, a 65-mile undersea and underground high-voltage direct current transmission line that extends under water and underground from Sayreville, New Jersey to Nassau County on Long Island (Figure 8). Neptune provides up to 660 MW of power to Long Island electricity consumers and supplies more than 20% of Long Island’s typical electricity demand. Neptune was completed in June 2007.” (Martin 2010, Neptune Regional Transmission System).
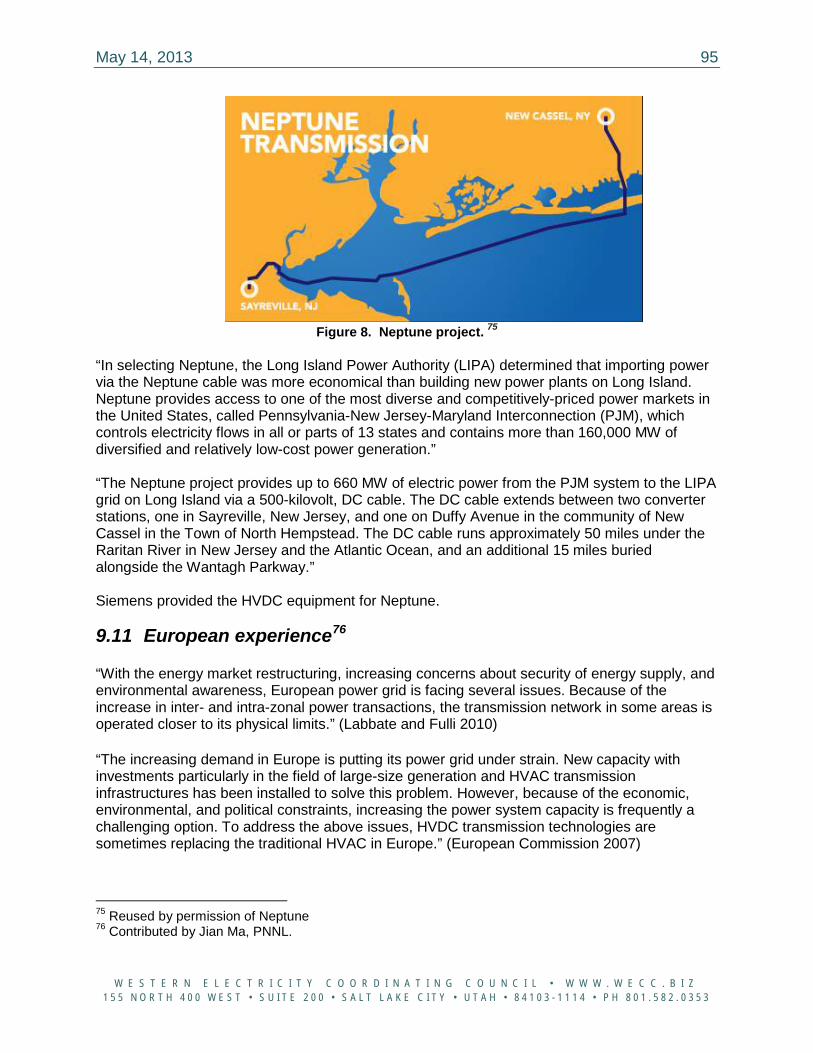
May 14, 2013 95
W E S T E R N E L E C T R I C I T Y C O O R D I N A T I N G C O U N C I L • W W W . W E C C . B I Z 1 5 5 N O R T H 4 0 0 W E S T • S U I T E 2 0 0 • S A L T L A K E C I T Y • U T A H • 8 4 1 0 3 - 1 1 1 4 • P H 8 0 1 . 5 8 2 . 0 3 5 3
Figure 8. Neptune project. 75
“In selecting Neptune, the Long Island Power Authority (LIPA) determined that importing power via the Neptune cable was more economical than building new power plants on Long Island. Neptune provides access to one of the most diverse and competitively-priced power markets in the United States, called Pennsylvania-New Jersey-Maryland Interconnection (PJM), which controls electricity flows in all or parts of 13 states and contains more than 160,000 MW of diversified and relatively low-cost power generation.” “The Neptune project provides up to 660 MW of electric power from the PJM system to the LIPA grid on Long Island via a 500-kilovolt, DC cable. The DC cable extends between two converter stations, one in Sayreville, New Jersey, and one on Duffy Avenue in the community of New Cassel in the Town of North Hempstead. The DC cable runs approximately 50 miles under the Raritan River in New Jersey and the Atlantic Ocean, and an additional 15 miles buried alongside the Wantagh Parkway.” Siemens provided the HVDC equipment for Neptune.
9.11 European experience76
“With the energy market restructuring, increasing concerns about security of energy supply, and environmental awareness, European power grid is facing several issues. Because of the increase in inter- and intra-zonal power transactions, the transmission network in some areas is operated closer to its physical limits.” (Labbate and Fulli 2010)
“The increasing demand in Europe is putting its power grid under strain. New capacity with investments particularly in the field of large-size generation and HVAC transmission infrastructures has been installed to solve this problem. However, because of the economic, environmental, and political constraints, increasing the power system capacity is frequently a challenging option. To address the above issues, HVDC transmission technologies are sometimes replacing the traditional HVAC in Europe.” (European Commission 2007)
75 Reused by permission of Neptune 76 Contributed by Jian Ma, PNNL.
May 14, 2013 96
W E S T E R N E L E C T R I C I T Y C O O R D I N A T I N G C O U N C I L • W W W . W E C C . B I Z 1 5 5 N O R T H 4 0 0 W E S T • S U I T E 2 0 0 • S A L T L A K E C I T Y • U T A H • 8 4 1 0 3 - 1 1 1 4 • P H 8 0 1 . 5 8 2 . 0 3 5 3
Recent advances in the power electronics coupled with traditional features of HVDC may lead to the improvement in operation of the European transmission grid. The HVDC technology based on VSCs (VSC-HVDC) has been recently applied to increase the robustness of the European transmission system (Arrillaga et al. 2007, Asplund 2000). VSC-HVDC units currently range from a few megawatts to several hundred megawatts and can reach ±300-kV voltages. One recent installation of VSC-HVDC in Europe has been the submarine link between Finland and Estonia (Estlink),77 while more projects are planned. The traditional HVDC technology has been deployed, especially for overhead bulk power transmission over long distances and undersea cable connections. The HVDC links present in Europe are mostly under water cables connecting various power system portions separated by sea (e.g., Scandinavia - mainland Europe, UK - France, UK - Ireland, Italy - Greece). For overhead transmission, the HVAC lines have so far offered a more viable techno-economic solution with respect to HVDC to cover small and medium distances (below some 100 km). (Arrillaga et al. 2007, Asplund 2000)
77 ABB website, HVDC and HVDC Light http://www.abb.com/hvdc
May 14, 2013 97
W E S T E R N E L E C T R I C I T Y C O O R D I N A T I N G C O U N C I L • W W W . W E C C . B I Z 1 5 5 N O R T H 4 0 0 W E S T • S U I T E 2 0 0 • S A L T L A K E C I T Y • U T A H • 8 4 1 0 3 - 1 1 1 4 • P H 8 0 1 . 5 8 2 . 0 3 5 3
APPENDIX 10
Additional Information on Rewiring
May 14, 2013 98
W E S T E R N E L E C T R I C I T Y C O O R D I N A T I N G C O U N C I L • W W W . W E C C . B I Z 1 5 5 N O R T H 4 0 0 W E S T • S U I T E 2 0 0 • S A L T L A K E C I T Y • U T A H • 8 4 1 0 3 - 1 1 1 4 • P H 8 0 1 . 5 8 2 . 0 3 5 3
Appendix 10: Additional Information on Rewiring “The thermal rating of an existing line can be increased by about 50% by using a replacement conductor that has twice the aluminum area of the original conductor. The larger conductor doubles the original strain structure tension loads and increases transverse wind/ice conductor loads on suspension structures by about 40%. Such large load increases typically would require structure reinforcement or replacement. This drawback to the use of a larger conductor may be avoided by using the high-temperature, low-sag (HTLS) conductor, which can be operated at temperatures above 100°C while exhibiting stable tensile strength and creep elongation properties.” (Larruskain et al. 2007) “Practical temperature limits of up to 200°C have been specified for some conductors. Using the HTLS conductor, which has the same diameter as the original, at 180°C increases the line rating by 50% but without any significant change in structure loads. If the replacement conductor has a lower thermal elongation rate than the original, then the structures will not have to be raised. Although the use of a larger conductor provides a reduction in losses over the life of the line while operating temperatures remain at a modest level, the use of the HTLS conductor reduces capital investment by avoiding structure modifications. In either case, replacing the existing conductors should improve the reliability of the line because the conductor, connectors, and hardware will all be new.” (Larruskain et al. 2007) “Replacing original ACSR conductors with HTLS conductors with approximately the same diameter is one method of increasing transmission line thermal rating. HTLS conductors are effective because they are capable of:
High-temperature, continuous operation above 100°C without loss of tensile strength or permanent sag-increase so that line current can be increased.
Low-sag at high-temperature so that ground and under build clearances can still be met without raising or rebuilding structures.” (Larruskain et al. 2007)
“The original conductor's “initial installed sag” increases to a final “everyday sag”, typically at 16°C with no ice or wind, as a result of both occasional wind/ice loading and the normal aluminum strand creep elongation that is a result of tension over time. This final sag may increase occasionally because of ice/wind loading or high electrical loads, but these effects are reversible. For most transmission lines, maximum final sag is the result of electrical rather than mechanical loads. It is important that any replacement conductor is installed so its final sag under maximum electrical or mechanical load does not exceed the original conductor's final sag and the existing structures need not be raised or new structures added. Under these circumstances, where structure reinforcement or replacement is to be avoided, HTLS conductors are used to advantage.” (Larruskain et al. 2007)
May 14, 2013 99
W E S T E R N E L E C T R I C I T Y C O O R D I N A T I N G C O U N C I L • W W W . W E C C . B I Z 1 5 5 N O R T H 4 0 0 W E S T • S U I T E 2 0 0 • S A L T L A K E C I T Y • U T A H • 8 4 1 0 3 - 1 1 1 4 • P H 8 0 1 . 5 8 2 . 0 3 5 3
APPENDIX 11
Types of HTLS Conductors
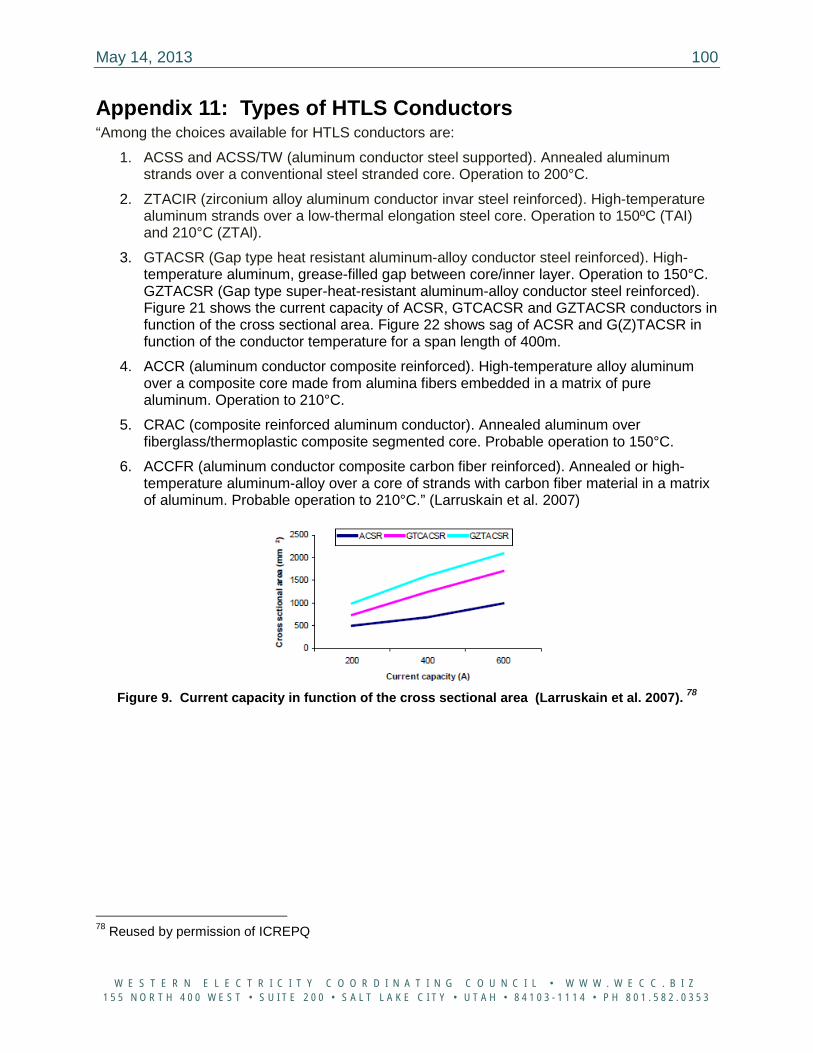
May 14, 2013 100
W E S T E R N E L E C T R I C I T Y C O O R D I N A T I N G C O U N C I L • W W W . W E C C . B I Z 1 5 5 N O R T H 4 0 0 W E S T • S U I T E 2 0 0 • S A L T L A K E C I T Y • U T A H • 8 4 1 0 3 - 1 1 1 4 • P H 8 0 1 . 5 8 2 . 0 3 5 3
Appendix 11: Types of HTLS Conductors “Among the choices available for HTLS conductors are:
1. ACSS and ACSS/TW (aluminum conductor steel supported). Annealed aluminum strands over a conventional steel stranded core. Operation to 200°C.
2. ZTACIR (zirconium alloy aluminum conductor invar steel reinforced). High-temperature aluminum strands over a low-thermal elongation steel core. Operation to 150ºC (TAI) and 210°C (ZTAl).
3. GTACSR (Gap type heat resistant aluminum-alloy conductor steel reinforced). High-temperature aluminum, grease-filled gap between core/inner layer. Operation to 150°C. GZTACSR (Gap type super-heat-resistant aluminum-alloy conductor steel reinforced). Figure 21 shows the current capacity of ACSR, GTCACSR and GZTACSR conductors in function of the cross sectional area. Figure 22 shows sag of ACSR and G(Z)TACSR in function of the conductor temperature for a span length of 400m.
4. ACCR (aluminum conductor composite reinforced). High-temperature alloy aluminum over a composite core made from alumina fibers embedded in a matrix of pure aluminum. Operation to 210°C.
5. CRAC (composite reinforced aluminum conductor). Annealed aluminum over fiberglass/thermoplastic composite segmented core. Probable operation to 150°C.
6. ACCFR (aluminum conductor composite carbon fiber reinforced). Annealed or high-temperature aluminum-alloy over a core of strands with carbon fiber material in a matrix of aluminum. Probable operation to 210°C.” (Larruskain et al. 2007)
Figure 9. Current capacity in function of the cross sectional area (Larruskain et al. 2007). 78
78 Reused by permission of ICREPQ
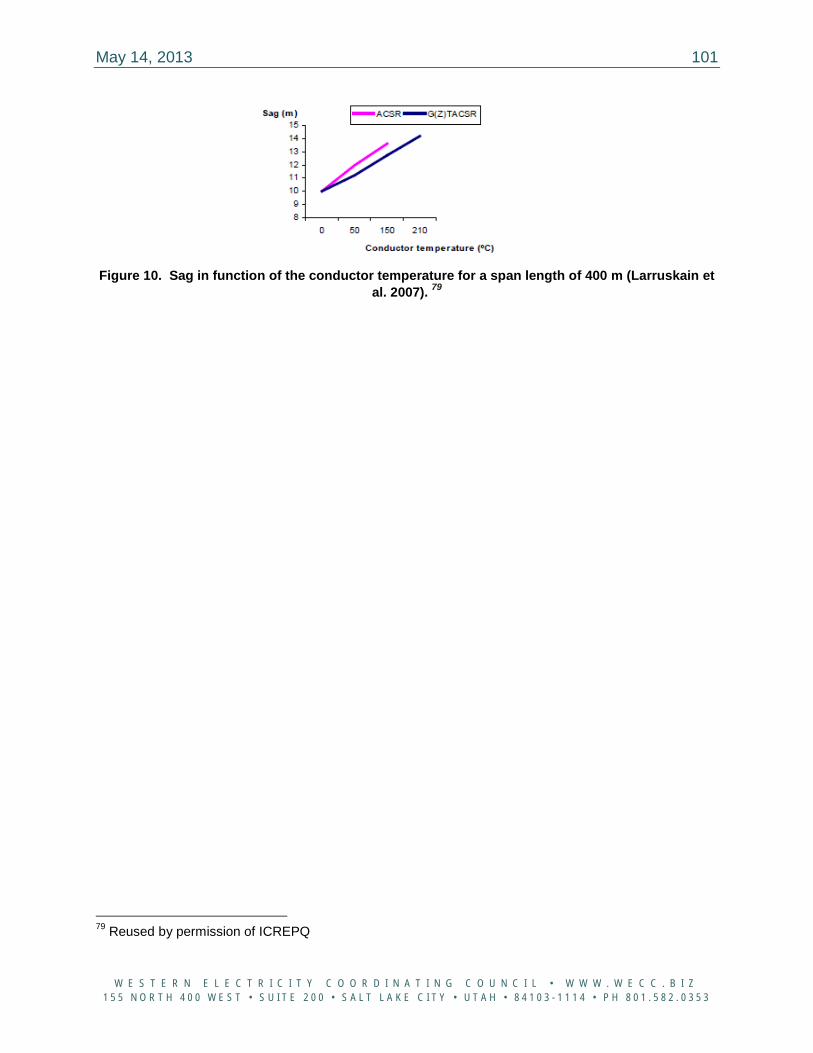
May 14, 2013 101
W E S T E R N E L E C T R I C I T Y C O O R D I N A T I N G C O U N C I L • W W W . W E C C . B I Z 1 5 5 N O R T H 4 0 0 W E S T • S U I T E 2 0 0 • S A L T L A K E C I T Y • U T A H • 8 4 1 0 3 - 1 1 1 4 • P H 8 0 1 . 5 8 2 . 0 3 5 3
Figure 10. Sag in function of the conductor temperature for a span length of 400 m (Larruskain et
al. 2007). 79
79 Reused by permission of ICREPQ
May 14, 2013 102
W E S T E R N E L E C T R I C I T Y C O O R D I N A T I N G C O U N C I L • W W W . W E C C . B I Z 1 5 5 N O R T H 4 0 0 W E S T • S U I T E 2 0 0 • S A L T L A K E C I T Y • U T A H • 8 4 1 0 3 - 1 1 1 4 • P H 8 0 1 . 5 8 2 . 0 3 5 3
APPENDIX 12
Direct Method and Energy Functions Transient Stability Analysis
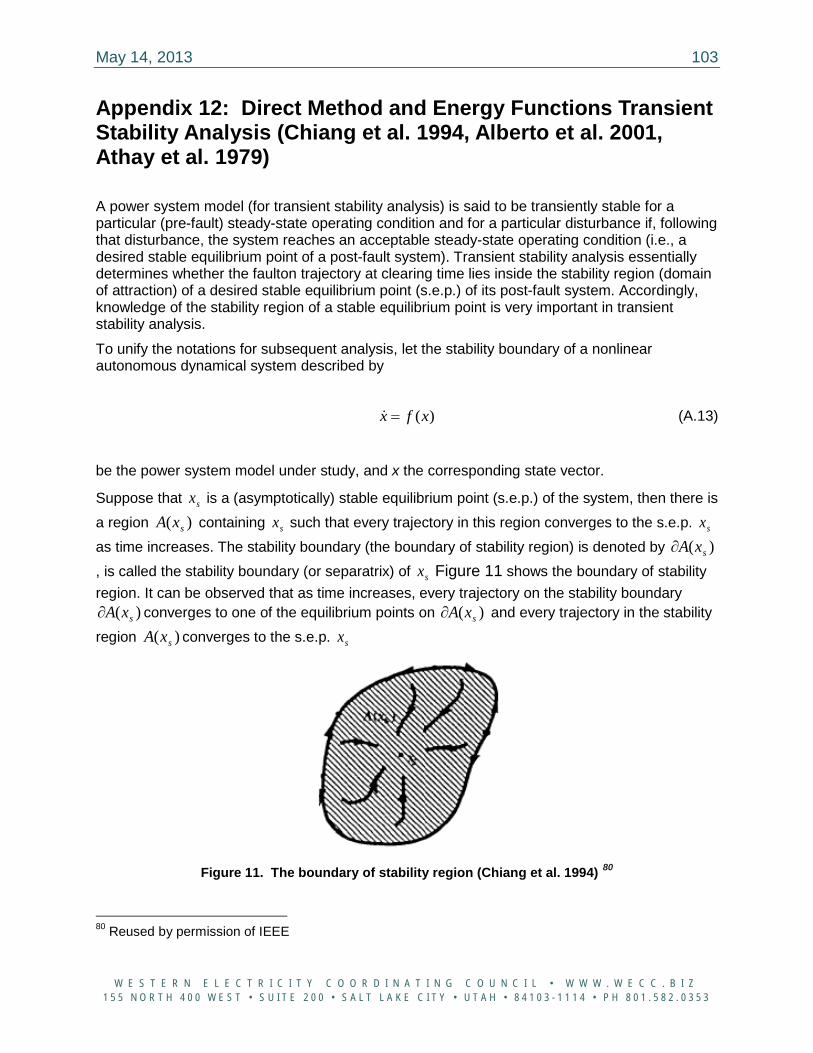
May 14, 2013 103
W E S T E R N E L E C T R I C I T Y C O O R D I N A T I N G C O U N C I L • W W W . W E C C . B I Z 1 5 5 N O R T H 4 0 0 W E S T • S U I T E 2 0 0 • S A L T L A K E C I T Y • U T A H • 8 4 1 0 3 - 1 1 1 4 • P H 8 0 1 . 5 8 2 . 0 3 5 3
Appendix 12: Direct Method and Energy Functions Transient Stability Analysis (Chiang et al. 1994, Alberto et al. 2001, Athay et al. 1979)
A power system model (for transient stability analysis) is said to be transiently stable for a particular (pre-fault) steady-state operating condition and for a particular disturbance if, following that disturbance, the system reaches an acceptable steady-state operating condition (i.e., a desired stable equilibrium point of a post-fault system). Transient stability analysis essentially determines whether the faulton trajectory at clearing time lies inside the stability region (domain of attraction) of a desired stable equilibrium point (s.e.p.) of its post-fault system. Accordingly, knowledge of the stability region of a stable equilibrium point is very important in transient stability analysis.
To unify the notations for subsequent analysis, let the stability boundary of a nonlinear autonomous dynamical system described by
( )x f x= (A.13)
be the power system model under study, and x the corresponding state vector.
Suppose that is a (asymptotically) stable equilibrium point (s.e.p.) of the system, then there is a region containing such that every trajectory in this region converges to the s.e.p. as time increases. The stability boundary (the boundary of stability region) is denoted by , is called the stability boundary (or separatrix) of Figure 11 shows the boundary of stability region. It can be observed that as time increases, every trajectory on the stability boundary
converges to one of the equilibrium points on and every trajectory in the stability region converges to the s.e.p.
Figure 11. The boundary of stability region (Chiang et al. 1994) 80
80 Reused by permission of IEEE
sx)( sxA sx sx
)( sxA∂
sx
)( sxA∂ )( sxA∂)( sxA sx
May 14, 2013 104
W E S T E R N E L E C T R I C I T Y C O O R D I N A T I N G C O U N C I L • W W W . W E C C . B I Z 1 5 5 N O R T H 4 0 0 W E S T • S U I T E 2 0 0 • S A L T L A K E C I T Y • U T A H • 8 4 1 0 3 - 1 1 1 4 • P H 8 0 1 . 5 8 2 . 0 3 5 3
Energy functions play an important role in direct methods for transient stability analysis. A function ( )V x is said to be an energy function for system (A.13) if it satisfies the following three conditions:
1. ( ( )) 0V x t ≤ , (i.e. energy functions are non-increasing along any trajectory),
2. the set has measure zero in
, for any non-trivial trajectory ( )x t and
3. If ( ( ))V x t is bounded in positive time, then is bounded in positive time. The first two properties imply that energy functions are strictly decreasing along system trajectories. The third property is a characterization of stability boundary of the system.
12.1 System model and energy function (Athay et al. 1979)
This section describes the development and evaluation of an analytical method for the direct determination of transient stability. The method developed is based on the analysis of transient energy and accounts for the nature of the system disturbance as well as for the effects of transfer conductance on system behavior. The system equations of motion in the model are as follows:
i i i eiM P Pω = − (A.14)
1,2i i i nδ ω= =
(A.15)
where
2i mi i iiP P E G= −
ij i j ijC E E B=
ij i j ijD E E G=
and, for unit i ,
: = mechanical power input
= driving point conductance = constant voltage behind the direct axis transient reactance
0))((: =∈ txVRt
R
)),(( txV Φ ),( txΦ
1sin( ) sin( )
n
ij i j ij i jji
C Dδ δ δ δ=
≠
− + − ∑
miP
iiG
iE
May 14, 2013 105
W E S T E R N E L E C T R I C I T Y C O O R D I N A T I N G C O U N C I L • W W W . W E C C . B I Z 1 5 5 N O R T H 4 0 0 W E S T • S U I T E 2 0 0 • S A L T L A K E C I T Y • U T A H • 8 4 1 0 3 - 1 1 1 4 • P H 8 0 1 . 5 8 2 . 0 3 5 3
, = generator rotor speed and angle deviation, respectively = moment of inertia
= transfer susceptance and conductance in the reduced bus admittance matrix. Equations (A.14) and (A.15) are written with respect to an arbitrary synchronous reference frame. The transformation of these equations into the center of angle coordinates not only offers physical insight to the transient stability problem formulation in general, but in particular provides a concise framework for the analysis of systems with transfer conductances. Referring to (1) define:
o1
1n
T i ii
M Mδ δ∆
=
= ∑ (A.16)
1
n
T ii
M M∆
=
=∑ (A.17)
Then
1
o COA1 1 1 1
o o
2 cosn n n n
T i ei i ij iji i i j i
M P P P D Pω δ
δ ω
−
= = = = +
= − = −
=
∑ ∑ ∑∑
(A.18)
The dynamics of the center of angle (or center of inertia) reference are governed by (A.18). By defining new angles and speeds relative to this reference, the new angles and speeds relative to this reference are
i i oθ δ δ∆
= − (A.19)
i i oω ω ω∆
= − (A.20)
The system equations of motion become
COA/
1,i i i ei i T
i i
M P P M M P
i n
ω
θ ω
= − −
= =
(A.21)
This transformation not only offers physical insight to the transient stability problem formulation in general, but in particular provides a concise framework for the analysis of the system with transfer conductance. Expressed in these new definitions, the transient energy function can be written as
iω iδ
iM
ijB ijG
May 14, 2013 106
W E S T E R N E L E C T R I C I T Y C O O R D I N A T I N G C O U N C I L • W W W . W E C C . B I Z 1 5 5 N O R T H 4 0 0 W E S T • S U I T E 2 0 0 • S A L T L A K E C I T Y • U T A H • 8 4 1 0 3 - 1 1 1 4 • P H 8 0 1 . 5 8 2 . 0 3 5 3
( )
( )( )
12
1 1 1 1
cos cos1/ 2
cosi j
s si j
sn n n n ij ij ij
si i i i i
i i i j i ij ij i j
k p
CV M P
D d
V V
θ θ
θ θ
θ θω θ θ
θ θ θ
−
+= = = = +
+
− = − − − − +
= +
∑ ∑ ∑∑∫
(A.22)
where the kinetic energy is and the potential energy is
The physical interpretation of the terms of the transient energy function (all changes are with respect to the stable equilibrium point)can be found in Athay et al. (1979). The transient energy function lays down a foundation for direct methods and stability margin assessment.
12.2 Potential energy boundary surface (PEBS) (Alberto et al. 2001)
The Potential Energy Boundary Surface (PEBS) method is intended to circumvent the problem of determining the controlling unstable equilibrium point. For a given fault on trajectory, the method finds a “local” approximation of the stability boundary as depicted in Figure 12. The process of finding this local approximation is associated with the determination of the stability boundary of lower dimensional system and is computationally rather efficient. In Figure 12. (a)
1 2,x x are equilibrium points on the stability boundary ( )sA x∂ for the post-fault system. If the initial state of the post-fault system x lies inside the stability boundary, then the post-fault system trajectory will be stable. In Figure 12.(b) the connected component containing sx of the set
: ( )x V x v< , as a local approximation of the stability boundary.
∑=
=n
iiik MV
1
2~2/1 ω
])(cos)cos(cos[)(1
1 11∫∑ ∑∑
+
+
−
= +==
+−−−−= ji
sj
si
jiijij
n
i
n
ij
sijijij
n
i
siiip dDCPV
θθ
θθθθθθθθθ
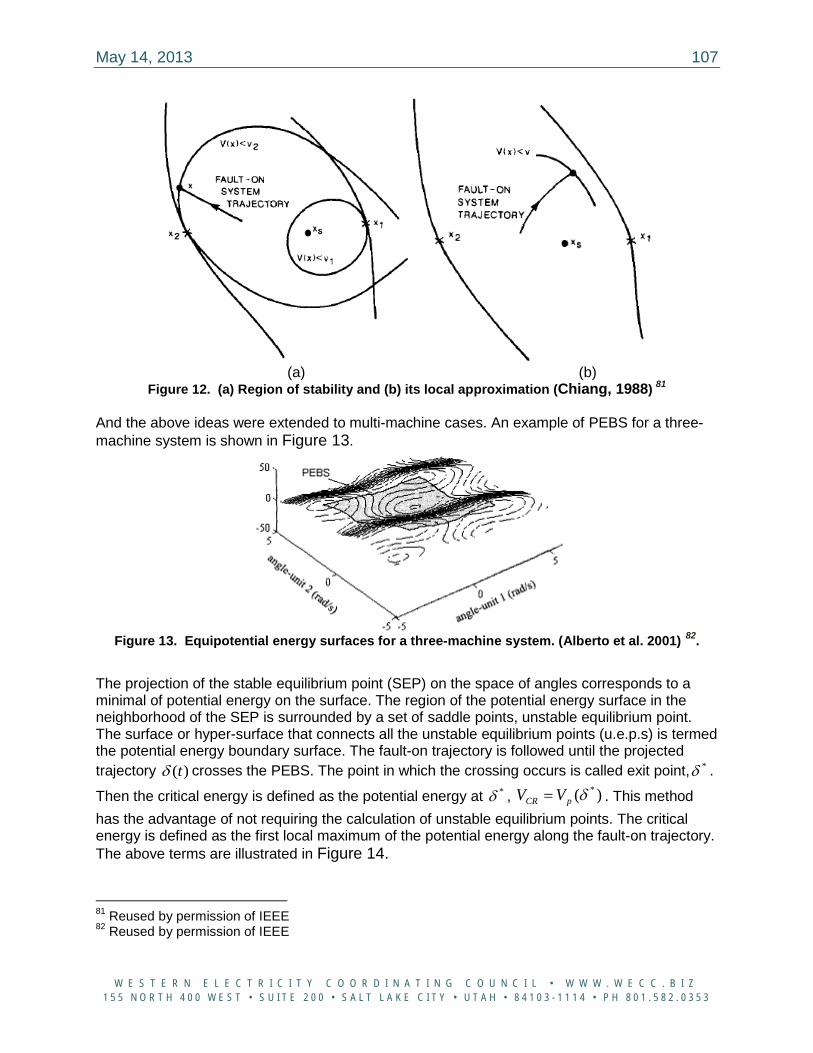
May 14, 2013 107
W E S T E R N E L E C T R I C I T Y C O O R D I N A T I N G C O U N C I L • W W W . W E C C . B I Z 1 5 5 N O R T H 4 0 0 W E S T • S U I T E 2 0 0 • S A L T L A K E C I T Y • U T A H • 8 4 1 0 3 - 1 1 1 4 • P H 8 0 1 . 5 8 2 . 0 3 5 3
(a) (b)
Figure 12. (a) Region of stability and (b) its local approximation (Chiang, 1988) 81
And the above ideas were extended to multi-machine cases. An example of PEBS for a three-machine system is shown in Figure 13.
Figure 13. Equipotential energy surfaces for a three-machine system. (Alberto et al. 2001) 82.
The projection of the stable equilibrium point (SEP) on the space of angles corresponds to a minimal of potential energy on the surface. The region of the potential energy surface in the neighborhood of the SEP is surrounded by a set of saddle points, unstable equilibrium point. The surface or hyper-surface that connects all the unstable equilibrium points (u.e.p.s) is termed the potential energy boundary surface. The fault-on trajectory is followed until the projected trajectory crosses the PEBS. The point in which the crossing occurs is called exit point, .
Then the critical energy is defined as the potential energy at , . This method has the advantage of not requiring the calculation of unstable equilibrium points. The critical energy is defined as the first local maximum of the potential energy along the fault-on trajectory. The above terms are illustrated in Figure 14.
81 Reused by permission of IEEE 82 Reused by permission of IEEE
)(tδ *δ*δ )( *δpCR VV =
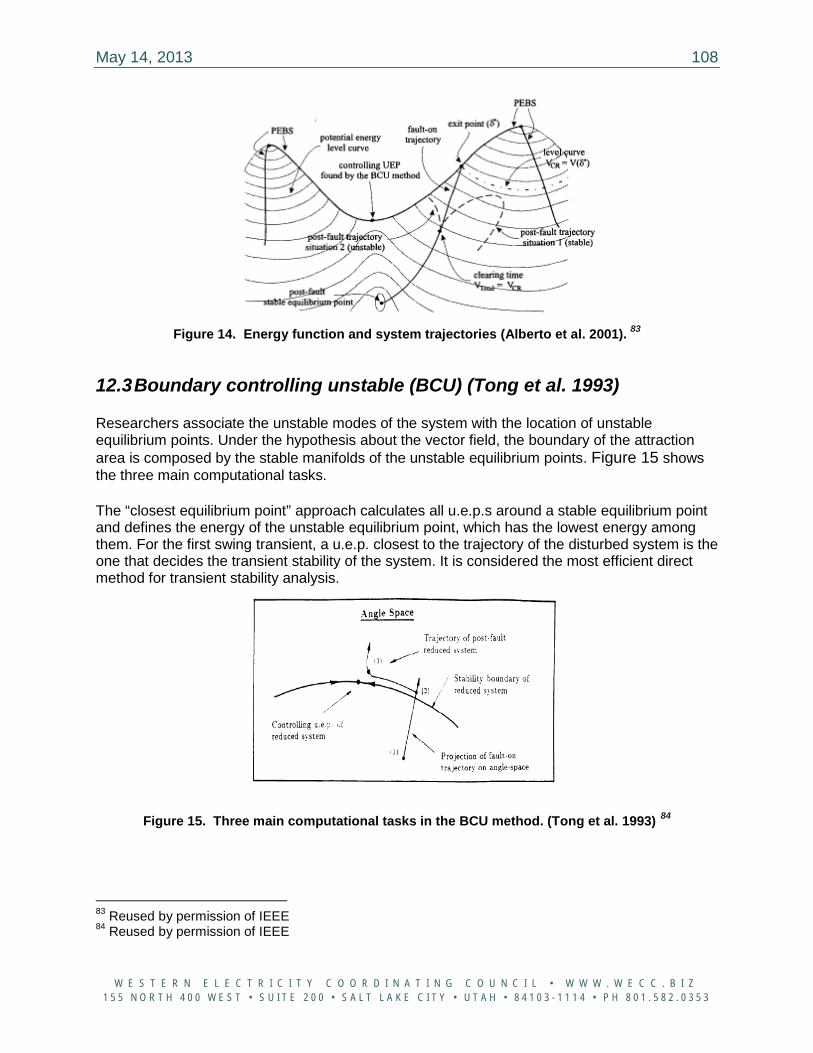
May 14, 2013 108
W E S T E R N E L E C T R I C I T Y C O O R D I N A T I N G C O U N C I L • W W W . W E C C . B I Z 1 5 5 N O R T H 4 0 0 W E S T • S U I T E 2 0 0 • S A L T L A K E C I T Y • U T A H • 8 4 1 0 3 - 1 1 1 4 • P H 8 0 1 . 5 8 2 . 0 3 5 3
Figure 14. Energy function and system trajectories (Alberto et al. 2001). 83
12.3 Boundary controlling unstable (BCU) (Tong et al. 1993)
Researchers associate the unstable modes of the system with the location of unstable equilibrium points. Under the hypothesis about the vector field, the boundary of the attraction area is composed by the stable manifolds of the unstable equilibrium points. Figure 15 shows the three main computational tasks.
The “closest equilibrium point” approach calculates all u.e.p.s around a stable equilibrium point and defines the energy of the unstable equilibrium point, which has the lowest energy among them. For the first swing transient, a u.e.p. closest to the trajectory of the disturbed system is the one that decides the transient stability of the system. It is considered the most efficient direct method for transient stability analysis.
Figure 15. Three main computational tasks in the BCU method. (Tong et al. 1993) 84
83 Reused by permission of IEEE 84 Reused by permission of IEEE
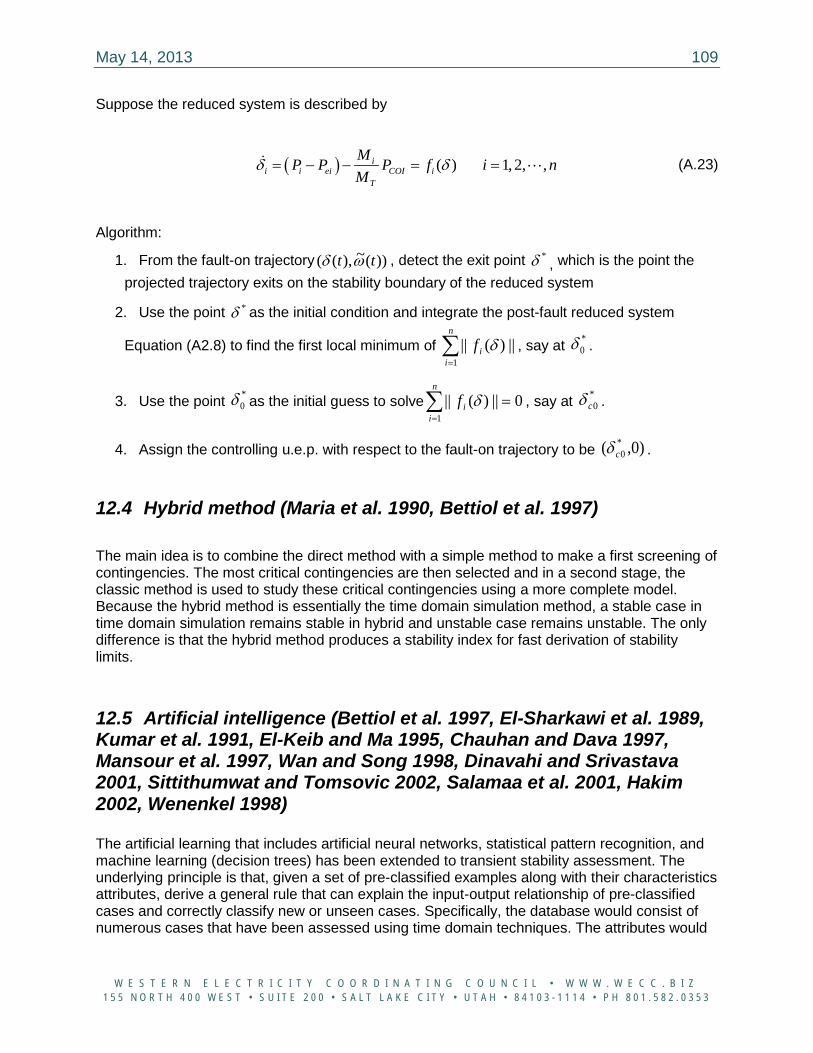
May 14, 2013 109
W E S T E R N E L E C T R I C I T Y C O O R D I N A T I N G C O U N C I L • W W W . W E C C . B I Z 1 5 5 N O R T H 4 0 0 W E S T • S U I T E 2 0 0 • S A L T L A K E C I T Y • U T A H • 8 4 1 0 3 - 1 1 1 4 • P H 8 0 1 . 5 8 2 . 0 3 5 3
Suppose the reduced system is described by
( ) ( ) 1, 2, ,ii i ei COI i
T
MP P P f i nM
δ δ= − − = =
(A.23)
Algorithm:
1. From the fault-on trajectory , detect the exit point , which is the point the projected trajectory exits on the stability boundary of the reduced system
2. Use the point as the initial condition and integrate the post-fault reduced system
Equation (A2.8) to find the first local minimum of , say at .
3. Use the point as the initial guess to solve , say at .
4. Assign the controlling u.e.p. with respect to the fault-on trajectory to be .
12.4 Hybrid method (Maria et al. 1990, Bettiol et al. 1997)
The main idea is to combine the direct method with a simple method to make a first screening of contingencies. The most critical contingencies are then selected and in a second stage, the classic method is used to study these critical contingencies using a more complete model. Because the hybrid method is essentially the time domain simulation method, a stable case in time domain simulation remains stable in hybrid and unstable case remains unstable. The only difference is that the hybrid method produces a stability index for fast derivation of stability limits.
12.5 Artificial intelligence (Bettiol et al. 1997, El-Sharkawi et al. 1989, Kumar et al. 1991, El-Keib and Ma 1995, Chauhan and Dava 1997, Mansour et al. 1997, Wan and Song 1998, Dinavahi and Srivastava 2001, Sittithumwat and Tomsovic 2002, Salamaa et al. 2001, Hakim 2002, Wenenkel 1998) The artificial learning that includes artificial neural networks, statistical pattern recognition, and machine learning (decision trees) has been extended to transient stability assessment. The underlying principle is that, given a set of pre-classified examples along with their characteristics attributes, derive a general rule that can explain the input-output relationship of pre-classified cases and correctly classify new or unseen cases. Specifically, the database would consist of numerous cases that have been assessed using time domain techniques. The attributes would
))(~),(( tt ωδ *δ
*δ
∑=
n
iif
1||)(|| δ *
0δ
*0δ 0||)(||
1=∑
=
n
iif δ *
0cδ
)0,( *0cδ
May 14, 2013 110
W E S T E R N E L E C T R I C I T Y C O O R D I N A T I N G C O U N C I L • W W W . W E C C . B I Z 1 5 5 N O R T H 4 0 0 W E S T • S U I T E 2 0 0 • S A L T L A K E C I T Y • U T A H • 8 4 1 0 3 - 1 1 1 4 • P H 8 0 1 . 5 8 2 . 0 3 5 3
consist of parameters such as generator outputs, critical line flows and relative phase angles. The output could be a stability margin or a simple classification (secure/insecure).
May 14, 2013 111
W E S T E R N E L E C T R I C I T Y C O O R D I N A T I N G C O U N C I L • W W W . W E C C . B I Z 1 5 5 N O R T H 4 0 0 W E S T • S U I T E 2 0 0 • S A L T L A K E C I T Y • U T A H • 8 4 1 0 3 - 1 1 1 4 • P H 8 0 1 . 5 8 2 . 0 3 5 3
APPENDIX 13
Blackouts Caused by Voltage Instability
May 14, 2013 112
W E S T E R N E L E C T R I C I T Y C O O R D I N A T I N G C O U N C I L • W W W . W E C C . B I Z 1 5 5 N O R T H 4 0 0 W E S T • S U I T E 2 0 0 • S A L T L A K E C I T Y • U T A H • 8 4 1 0 3 - 1 1 1 4 • P H 8 0 1 . 5 8 2 . 0 3 5 3
Appendix 13: Blackouts Caused by Voltage Instability85 Many system blackouts and “near misses” worldwide were related to voltage instability and voltage collapse problems. Among these, the following major events can be mentioned – see Kundur (1994), Lindahl (2004), NERC (2004), Doorman et al. (2004), Kurita and Sakurai (1988), Bullock (1990), U.S. DOE (1996), NERC (1996), Dizdarevic et al. (2004), NERC (2004), Elkraft (2003), Svenska Kraftnat (2003), Union for the Coordination of Transmission of Electricity UCTE (2003), Gestore Rete Transmissione (2003), Vournas (2005), and CIGRE Task Force 1993 for more details:
1. 1965: Eastern United States and Canada 2. 1970: Japan and New York Power Pool 3. 1977: New York City and Jacksonville, Florida 4. 1978: France 5. 1982: Belgium and Florida 6. 1983: Sweden 7. 1987: Tokyo, Japan, Western Tennessee, France 8. 1989, 1993-1994: Italy 9. 1996: U.S. Western Interconnection (two events) 10. 1997: The Netherlands 11. 1998: Atlanta, San Francisco Area, Upper Midwest United States 12. 1999: Northeast United States (two events) 13. 2003: Croatia and Bosnia Herzegovina, Eastern United States and Canada,
Denmark and Sweden, and Italy 14. 2004: Western Norway and Southern Greece 15. 2005: Moscow Region, Russia.
These also include the following blackouts or “near blackouts” related to voltage collapse in the Western Interconnection:
1. U.S. Western Interconnection Blackout, July 2, 1996, started with loss of two 345-kV transmission lines from Jim Bridger to Kinport and subsequent tripping of two Jim Bridger units in the southern Idaho-Montana region. This initiated a blackout in 14 western states, two Canadian provinces, and the northern portion of Baja California, Mexico (U.S. D0E 1996).
2. U.S. Western Interconnection Blackout on August 10, 1996. This disturbance effectively began with the loss of the Keeler-Allston 500-kV line in the Portland, Oregon area. The WECC system was separated into four islands, interrupting service to 7.5 million customers for periods ranging from several minutes to about 9 hours (NERC 1996).
3. California ISO system disturbance (in San Francisco Area), December 8, 1998. The disturbance was caused by a Pacific Gas & Electric (PG&E) construction crew and by the substation operators failing to follow standard procedures at San Mateo substation. The blackout affected more than 456,000 customers and nearly 1 million people (CAISO 1998).
85 Contributed by Yuri Makarov, PNNL
May 14, 2013 113
W E S T E R N E L E C T R I C I T Y C O O R D I N A T I N G C O U N C I L • W W W . W E C C . B I Z 1 5 5 N O R T H 4 0 0 W E S T • S U I T E 2 0 0 • S A L T L A K E C I T Y • U T A H • 8 4 1 0 3 - 1 1 1 4 • P H 8 0 1 . 5 8 2 . 0 3 5 3
13.1 Summary of recommendations by WECC86
In response to the June 2-3, 1996, major blackout in the WECC system, the Department of Energy recommended the following measures to be implemented by WECC members to prevent future voltage collapse incidents (U.S. DOE 1996) “WECC shall review the need for a security monitor function in the Western Interconnection to monitor operating conditions on a regional scale. WECC shall review the need for tools such as on-line power flow and stability programs and real-time data monitors that can assess primary reliability indicators for frequency and voltage performance in real-time.”
These tools should have a look-ahead capability to leave time for real-time dispatchers to recognize the situation and apply preventive remedial actions. On October 18, 1996, the WECC investigation team analyzing August 10, 1996, blackout strongly recommended the following measure (NERC 1996). “WECC shall pursue implementation of on-line power flow and security analysis, and recommend appropriate actions to increase the monitoring of key system parameters that would allow operators to identify potential problem outages and take corrective actions.” Similar recommendations were formulated by the analytical teams investigating voltage collapse related blackouts in the other countries.
Summarizing the outcome of the previous blackout investigations, the U.S.-Canada Power System Outage Task Force that conducted the analysis of the August 14, 2003, blackout reiterated that “The current processes for assessing the potential for voltage instability and the need to enhance the existing operator training programs, operational tools, and annual technical assessments should be reviewed to improve the ability to predict future voltage stability problems prior to their occurrence, and to mitigate the potential for adverse effects on a regional scale.” The task force also indicated that the blackout on August 14, 2003, had several causes or contributing factors in common with the earlier outages, including:
• Failure to ensure operation within secure limits;
• Failure to identify emergency conditions and communicate that status to neighboring systems; and
• Inadequate regional scale visibility over the power system.
Despite the long history of similar requests to develop real-time dispatcher tools to monitor the available voltage security, voltage stability, and reactive power margins; those recommendations are not completely met by the majority of the U.S. power system control centers. The Consortium for Electric Reliability Technology Solutions (CERTS) survey (Sauer et al. 2004) revealed that the “voltage collapse issues were only evaluated when the full AC power flow indicated an unusual operating conditions, such as questionable voltage profiles. When voltage collapse or transient stability problems were suspected, the analysis was transferred to operations planners for detailed analysis. Some operators were guided by seasonal nomograms. In some cases, this lack of dynamic security analysis activity was caused by a lack of problems, or a lack of interest in these phenomena. In other cases, it was due to a lack of efficient and integrated tools.”
Besides the dispatchers’ situation awareness and advisory purposes, there is a potential to develop automatic systems to prevent voltage instability and restore depressed voltages in the grid. This opportunity becomes especially important when the voltage collapse development
86 Contributed by Yuri Makarov, PNNL

May 14, 2013 114
W E S T E R N E L E C T R I C I T Y C O O R D I N A T I N G C O U N C I L • W W W . W E C C . B I Z 1 5 5 N O R T H 4 0 0 W E S T • S U I T E 2 0 0 • S A L T L A K E C I T Y • U T A H • 8 4 1 0 3 - 1 1 1 4 • P H 8 0 1 . 5 8 2 . 0 3 5 3
process does not cause the human dispatchers to recognize the situation and apply adequate control measures. Controllable system separation could prevent a widespread system failure.
May 14, 2013 115
W E S T E R N E L E C T R I C I T Y C O O R D I N A T I N G C O U N C I L • W W W . W E C C . B I Z 1 5 5 N O R T H 4 0 0 W E S T • S U I T E 2 0 0 • S A L T L A K E C I T Y • U T A H • 8 4 1 0 3 - 1 1 1 4 • P H 8 0 1 . 5 8 2 . 0 3 5 3
APPENDIX 14
Algorithm for Parameter Continuation Predictor-corrector Methods
May 14, 2013 116
W E S T E R N E L E C T R I C I T Y C O O R D I N A T I N G C O U N C I L • W W W . W E C C . B I Z 1 5 5 N O R T H 4 0 0 W E S T • S U I T E 2 0 0 • S A L T L A K E C I T Y • U T A H • 8 4 1 0 3 - 1 1 1 4 • P H 8 0 1 . 5 8 2 . 0 3 5 3
Appendix 14: Algorithm for Parameter Continuation Predictor-corrector Methods “Parameter continuation predictor-corrector method is capable of reaching the vicinity of point of collapse on the power flow feasibility boundary. The addition of new variables called continuation parameters determines the position of an operating point along some power system stress direction in the parameter space. The predictor step consists of an incremental movement of the power flow point along the state space trajectory, based on the linearization of the model. The corrector step, which follows each predictor step, consists in the elimination of the linearization error by balancing the power flow equations to some close point on the nonlinear trajectory”(CERTS, 2008).
Prediction step:
The unit vector that is tangent to the feasible boundary at is given by
where is the Jacobian . The prediction of the next point on the curve is
where is a scalar control parameter.
Correction step:
The Euler method is used to correct to a point on the curve by solving for the point of intersection of the curve and a hyperplane that passes through and that is orthogonal to . The point of intersection of the curve and the hyperplane is then given by
Together, the two equations above form a set of 2n+2 equations in 2n+2 unknowns. They can be solved using a standard technique such as Newton-Raphson (Makarov et al. 2010b).
Direct methods for finding the PoC in a given direction combine a parametric description of the system stress, based on the specified loading vector in the parameter space, and a scalar parameter describing a position of an operating point along the loading trajectory and the power flow singularity condition expressed with the help of the Jacobian matrix multiplied by a nonzero right or the left eigenvector that nullifies the Jacobian matrix at the collapse point. Unlike the power flow problem, this reformulated problem does not become singular at the point of collapse and can produce the bifurcation point very accurately. In principle, the direct method allows finding the bifurcation points without implementing a loading procedure. There is; however, a problem of finding the initial guesses of the state variables and the eigenvector that may be resolved by initial loading of the system along the stress direction. By doing so, the initial guess of state variables can be obtained. To evaluate the initial guess for the eigenvector,
22 +∈ nRν 1z
0|1
== νφ ZZZ
1=ν
Zφ )22()12( +×+ nn z∂∂ /φ
τν+= 1zz p
τ
zpz ν
0)( =zφ
0)( =− νtpzz
May 14, 2013 117
W E S T E R N E L E C T R I C I T Y C O O R D I N A T I N G C O U N C I L • W W W . W E C C . B I Z 1 5 5 N O R T H 4 0 0 W E S T • S U I T E 2 0 0 • S A L T L A K E C I T Y • U T A H • 8 4 1 0 3 - 1 1 1 4 • P H 8 0 1 . 5 8 2 . 0 3 5 3
the Lanczos or inverse iteration87 methods can be applied to calculate the eigenvector corresponding to the minimum real eigenvalue (Jarjis and Galiana 1981, Kontorovich et al. 1988, Canizares and Alvarado 1991, Van Cutsem 1991, Canizares et al. 1992, Dobson 1992). Optimization methods are based on maximization of a scalar parameter describing the position of an operating point along the loading trajectory subject to the power flow balance constraints. The maximum point achieved by the approach corresponds to the point of collapse met on the selected stress trajectory. The solution of this constrained optimization problem is determined by the Karush-Khun-Tucker conditions88 that produce a set of equations similar to the ones used in the direct method in its variant employing the left eigenvector; Lagrange multipliers89 of this problem actually is the left eigenvector nullifying the power flow Jacobian matrix at the point of collapse. The collapse point can be found directly by solving the set of equations, which is very similar to the direct method, or by applying an optimization method such as the interior point method90 or an alternative AEMPFAST optimization91 procedure that is proven to be able to get very close to the point of collapse of concern (Van Cutsem and Vournas 1998, Parker et al. 1996, Irisarri et al. 1997). Approaches analyzed in this section assume that the system stress directions are known and reflect some typical load and generation patterns. In the market-driven systems, the generator dispatches are based on their energy bids and transmission congestion, and they may be very different from one dispatch interval to another. Therefore several system stress directions may need to be separately or jointly considered.
87 Algorithms for computing eigenvector and eigenvectors of the Jacobian matrix. For more information and references see Eric W. Weisstein. "Lanczos Algorithm." From MathWorld--A Wolfram Web Resource. http://mathworld.wolfram.com/LanczosAlgorithm.html 88 The Karush-Khun-Tucker conditions define properties of a constraint optimization problem solution that can be used to find the optimal point without performing an optimization procedure – see Eric W. Weisstein. "Kuhn-Tucker Theorem." From MathWorld-- A Wolfram Web Resource. http://mathworld.wolfram.com/Kuhn-TuckerTheorem.html 89 Lagrange multipliers are variables that help to present a constraint optimization problem an unconstraint optimization problem under certain conditions – see Eric W. Weisstein. "Lagrange Multiplier." From MathWorld--A Wolfram Web Resource. http://mathworld.wolfram.com/LagrangeMultiplier.html 90 The interior point method is a linear or nonlinear programming method that achieves optimization by going through the middle of the solid defined by the problem rather than around its surface - see Eric W. Weisstein, "Interior Point Method." From MathWorld--A Wolfram Web Resource. http://mathworld.wolfram.com/InteriorPointMethod.html. 91 The AEMPFAST algorithm has been developed by Optimal Technologies, Inc. The AEMPFAST software was extensively tested and evaluated by the California ISO. More information on the AEMPFAST can be found in U.S. DOE (CERTS) (2003).
May 14, 2013 118
W E S T E R N E L E C T R I C I T Y C O O R D I N A T I N G C O U N C I L • W W W . W E C C . B I Z 1 5 5 N O R T H 4 0 0 W E S T • S U I T E 2 0 0 • S A L T L A K E C I T Y • U T A H • 8 4 1 0 3 - 1 1 1 4 • P H 8 0 1 . 5 8 2 . 0 3 5 3
APPENDIX 15
Approximation Techniques for Security Regions
May 14, 2013 119
W E S T E R N E L E C T R I C I T Y C O O R D I N A T I N G C O U N C I L • W W W . W E C C . B I Z 1 5 5 N O R T H 4 0 0 W E S T • S U I T E 2 0 0 • S A L T L A K E C I T Y • U T A H • 8 4 1 0 3 - 1 1 1 4 • P H 8 0 1 . 5 8 2 . 0 3 5 3
Appendix 15: Approximation Techniques for Security Regions 92 Hyperplane and quadratic approximations of the security region: One of the important problems that power system analysts and operators face when they use the concept of the power system security region, is describing the security region’s boundary. The simple tabular description is not adequate for the purposes of visualization and practical use by system operators and in the automated VSA systems. There is a need for an analytical description and/or approximation of the boundary. The analytical description usually means the use of linear or nonlinear inequalities applied to a certain number of critical parameters such as power flows, load levels, or voltage magnitudes. If all inequalities are satisfied, the analyzed operating point is considered inside the security region. If any of the inequalities are violated, the point is considered to be outside the security region. The approximation means a sort of interpolation between the boundary points obtained by any of the methods considered in this section. It can be used as a part of the analytical boundary description (for the automated VSA systems), or separately for the purpose of visualization. The simplest approximation uses linear inequalities. The first known use of the approximation ideas was apparently related to the operating nomograms – see McCalley et al. (1997) for more details. The operating nomograms are usually represented visually as piecewise linear contours on a plane of two critical parameters. If three critical parameters are involved, the nomogram is represented by a number of contour lines; each of them corresponding to a certain value of the third parameter. It becomes difficult to visualize a nomogram for four or more critical parameters. The natural extension of the linearized stability nomograms for three or more critical parameters is based on the use of hyperplanes - the planes that are defined in the multidimensional parameter space as approximations of the stability boundary. These efforts are described in Su et al. (2002) (voltage stability boundary approximation), Zeng and Yu (2002), Djukanovic et al. (1993), and Yu et al. (2004) (transient/dynamic stability boundary approximation), and other works. In Russia, in a number of emergency control algorithms, a nonlinear approximation was successfully used to provide an analytical description of the stability boundary (Sovalov and Semenov 1988). These approaches employ quadratic inequalities. The inequalities are applied to the nodal power injections, cutset power flows, and other parameters. The coefficients of these inequalities are pre-calculated offline based on multiple-time domain or steady-state stability simulations. The hyperplane and quadratic approximations have a number of significant advantages:
• They allow one to quickly analyze the stability margin in real-time; and
• Because of their formal mathematical nature, they allow one to simultaneously consider thermal, voltage stability, transient stability, and other constraints within the same framework.
92 Contributed by Yuri Makarov, PNNL
May 14, 2013 120
W E S T E R N E L E C T R I C I T Y C O O R D I N A T I N G C O U N C I L • W W W . W E C C . B I Z 1 5 5 N O R T H 4 0 0 W E S T • S U I T E 2 0 0 • S A L T L A K E C I T Y • U T A H • 8 4 1 0 3 - 1 1 1 4 • P H 8 0 1 . 5 8 2 . 0 3 5 3
Artificial Neural Networks (ANN)-based techniques (Sauer et al. 2004, McCalley et al. 1997, Djukanovic et al. 1993, El-Sharkawi et al. 1989, Kumar et al. 1991, El-Keib and Ma 1995, Chauhan and Dava 1997, Mansour et al. 1997, Wan and Song 1989, Dinavahi and Srivastava 2001, Sittihumwat and Tomsovic 2002, Salamaa et al. 2001). The idea behind the techniques based on the artificial neural networks is to select a set of critical parameters such as power flows, loads, and generator limits, and then train an ANN on a set of simulation data to estimate the security margin. The ANN model de-facto provides an approximation of the stability boundary. The advantages of the ANN models include their ability to accommodate nonlinearities, and they are very fast while performing in real-time. At the same time, there are difficulties associated with building the training datasets and ANN training. Pattern recognition methods establish a relationship between some selected parameters and the location of the system operating point with respect to the stability boundary. Initially, training sets of stable and unstable operating points are generated, and a space reduction process is applied to reduce the dimensionality of the system model. Then the classifier functions (decision rules) are determined using voltage security assessment (VSA) algorithms. QuickStab algorithm is an alternative method to quickly and approximately evaluate the voltage stability margin in a given loading direction. The idea of this technology was originally developed by Paul Dimo. It includes the voltage stability practical criterion dQ/dV < 0 and Dimo’s network nodal equivalents (so called zero power balance networks or radial equivalent independent (REI) equivalents). Dimo’s finding is that under certain modeling assumptions, the practical stability margin can be expressed as a straightforward formula applied to the nodal equivalents (Aldea and Savulescu 2004, Dimo 1971). There is a progression from one-directional methods estimating the voltage stability margin in a specified direction to multi-directional methods evaluating the distances to instability, and further from the multidirectional methods to the methods exploring the entire voltage security region in the parameter space. In market-driven systems where the generation dispatches vary, the interactions between the various stresses can be accounted for by sensitivity methods or multi-directional and voltage security region techniques. The use of power flow existence criterion bears a potential danger of overestimating the actual voltage security margin in situations where the saddle node bifurcation, Hopf bifurcation, or transient stability conditions are violated before the power flow equations become inconsistent. Due to this consideration, the state-of-the-art methodology should be based on more precise voltage stability criteria.
May 14, 2013 121
W E S T E R N E L E C T R I C I T Y C O O R D I N A T I N G C O U N C I L • W W W . W E C C . B I Z 1 5 5 N O R T H 4 0 0 W E S T • S U I T E 2 0 0 • S A L T L A K E C I T Y • U T A H • 8 4 1 0 3 - 1 1 1 4 • P H 8 0 1 . 5 8 2 . 0 3 5 3
APPENDIX 16
Impact of Wind Power on Power System Small Signals Stability
May 14, 2013 122
W E S T E R N E L E C T R I C I T Y C O O R D I N A T I N G C O U N C I L • W W W . W E C C . B I Z 1 5 5 N O R T H 4 0 0 W E S T • S U I T E 2 0 0 • S A L T L A K E C I T Y • U T A H • 8 4 1 0 3 - 1 1 1 4 • P H 8 0 1 . 5 8 2 . 0 3 5 3
Appendix 16: Impact of Wind Power on Power System Small Signals Stability In recent years, several research efforts have been devoted to address the impact of wind power on power system small signals stability. As the WTGs aforementioned are not synchronously connected to the grid, they themselves do not participate in what are usually called electromechanical oscillations (Slootweg and Kling 2003, Vowles et al. 2008, Gautam et al. 2009). Furthermore, the penetration of wind power is likely to affect the system damping by three primary mechanisms (Vowles et al. 2008, Gautam et al. 2009):
i) replacing synchronous generators that are involved in electromechanical oscillations by WTGs, thus affecting the electromechanical modes;
ii) controllers of WTGs interacting with synchronous generators such that damping torques are partly influenced; and
iii) altering the dispatch of conventional generation and profile of power flow thereby exerting an influence on the power system damping.
The first mechanism is often related to the scenarios where conventional generation is supplanted by wind generation, while the system's topology and power flow almost remain unchanged. And the first two mechanisms depend upon the particular types of WTGs to a great extent. Conversely, the last one has no direct dependence on wind power technology. “From the present literature, the constant speed wind turbo generator (CSWTG’s) impact on small signal stability is uncontested mostly because there does not exist any controllers in their electrical subsystems. Nevertheless, it is not the case where variable speed wind turbo generators (VSWTGs) are installed. By reason of different dynamic characteristics, opinions with respect to VSWTGs' effects on small signal stability vary. Actually as VSWTGs, double-fed induction generators (DFIGs) and double-drive induction generators (DDSGs) have practically identical effect on the damping of power systems in that they are partially or fully decoupled from grid, with similar abilities to control active and reactive power” (Sun et al. 2010). In 2003, Slootweg et al. initiated the issue that there is an impact of CSWTGs and VSWTGs on small signal stability of power systems (Slootweg and Kling 2003). Later, more researchers started to concentrate on this subject by the means of modal analysis or time domain simulations. As for CSWTGs, it is generally agreed that they tend to dampen the electromechanical oscillations (Slootweg and Kling 2003, Vowles et al. 2008, Hagstrom et al. 2005, Anaya-Lara et al. 2006). The above references hypothesize that synchronous generators have been replaced by equivalent ratings of CSWTGs in the same area. However, there is not such a generalization when VSWTGs are analyzed. The Nordic Grid studies by Hagstrom et al. show that the DFIGs and DDSGs slightly decrease the damping of inter-area oscillations (Hagstrom et al. 2005). In contrast, Anaya-Lara et al. believe that DFIGs are capable of improving system damping for a typical three-generator system (Anaya-Lara et al. 2006, Hughes et al. 2006). In like manner, Muljadi et al. find that DFIGs can provide a good damping performance in a weak grid (Muljadi 2007). These conclusions are confirmed by Tsourakis et al. (2009a, 2009b), which also indicate that although voltage control schemes may reduce damping, the general trend for DFIGs is still to increase inter-area oscillation damping. Further, Slootweg et al. point out that the beneficial effect of VSWTGs on system damping should be discussed according to the types of oscillations (Slootweg and Kling 2003).
May 14, 2013 123
W E S T E R N E L E C T R I C I T Y C O O R D I N A T I N G C O U N C I L • W W W . W E C C . B I Z 1 5 5 N O R T H 4 0 0 W E S T • S U I T E 2 0 0 • S A L T L A K E C I T Y • U T A H • 8 4 1 0 3 - 1 1 1 4 • P H 8 0 1 . 5 8 2 . 0 3 5 3
Differing from the above results, Ullah et al. claim that the influence of voltage and constant power factor control mode of DDSGs on the inter-area oscillation rests upon the locations of wind farms, and it can be either detrimental or beneficial (Ullah and Thiringer 2008). Likewise, in Gautam et al. (2009), the results of eigenvalue sensitivity to inertia analysis demonstrate that the integration of DFIG-based wind farms has both favorable and negative impacts on small signal stability. Moreover, Vowles et al. deem that the effect of different types of WTGs on damping of the New Zealand system is indeed minimal (Vowles et al. 2008). On the basis of the prior research, it is seen that the views about the impact of VSWTGs on damping are controversial. Factors that may cause these contentions among studies mainly include:
i) types of electromechanical oscillations;
ii) locations, manners and levels of wind power penetration;
iii) the loading level of system; and
iv) different control modes of VSWTGs. the first three factors are applicable to CSWTGs as well.
The analysis results probably vary with types of oscillation modes (Slootweg and Kling 2003). And the substitution of synchronous generators with higher participation factors in electromechanical oscillations by VSWTGs might raise the damping, while the replacement of others may reduce the damping. In practice, it is not necessary for wind farms to supersede the synchronous generators with equivalent capacity, although most of the researchers presume this so. And the wind farms can be erected in other appropriate locations in a way that the profile of power flow is ultimately changed. In addition, the system loading level and penetration level of wind power also play an important role in WTGs' effect on power system damping. For VSWTGs, tracking the maximum power with unity power factor is a basic active power control strategy. Actually, not very much damping contribution is expected from VSWTGs because they cannot inject oscillating power to suppress low-frequency oscillations under this control mode. On the other hand, voltage or reactive power control schemes of VSWTGs have a latent impact on system damping, although they are not widely used. Regardless, the analytical findings have not yet been obtained and thus conclusions cannot be yielded (Morton 2009). The above discussions do not involve the problem whether new oscillation modes with weak damping will be introduced by WTGs. Because of the flexibility or torsional spring characteristic, the shaft system of a WTG should be described by a two-mass model (Ramtharan et al. 2007, Hansen et al. 2007). In this case, disturbances such as a drop of terminal voltage will possibly excite torsional oscillations of shaft systems, frequencies of which are typically in the range from 0.1 to 10 Hz (Hansen et al. 2007). The torsional oscillations decay very quickly because the steep torque versus slip characteristic of CSWTGs (Hansen et al. 2007), i.e., the torsional oscillations are inherently dampened so they do not necessitate extra damping controllers. By contrast, DFIGs and DDSGs require supplementary controllers to damp torsional oscillations. A power system stabilizer (PSS) device, a unit attached to generator controls, can be used to help provide sufficient damping to these small signal stability electrical power system oscillations (Bragason 2005). Damping controllers/PSS in WTGs can be used to help WTGs provide some damping of small signal stability electrical power system oscillations either through electrical control or mechanical control (Sun et al. 2010).
May 14, 2013 124
W E S T E R N E L E C T R I C I T Y C O O R D I N A T I N G C O U N C I L • W W W . W E C C . B I Z 1 5 5 N O R T H 4 0 0 W E S T • S U I T E 2 0 0 • S A L T L A K E C I T Y • U T A H • 8 4 1 0 3 - 1 1 1 4 • P H 8 0 1 . 5 8 2 . 0 3 5 3
APPENDIX 17
Additional Information on FIDVR Events and Grid Planning Solutions
May 14, 2013 125
W E S T E R N E L E C T R I C I T Y C O O R D I N A T I N G C O U N C I L • W W W . W E C C . B I Z 1 5 5 N O R T H 4 0 0 W E S T • S U I T E 2 0 0 • S A L T L A K E C I T Y • U T A H • 8 4 1 0 3 - 1 1 1 4 • P H 8 0 1 . 5 8 2 . 0 3 5 3
Appendix 17: Additional Information on FIDVR Events and Grid Planning Solutions If the recovery of the system voltage above a certain threshold is delayed for more than a few seconds, the system will compensate for the low voltage through capacitor banks or other reactive reserves. There is a concern that when the load trips because of being undervoltage, it will result in a substantial excess in system reactive power injection, causing generation to trip offline because of being overvoltage. This phenomenon, it is suspected, could lead to a system blackout. To be able to capture this phenomenon in planning studies, dynamic simulations need to take into account load dynamics (in particular that of induction motors), driving reciprocating loads, and other loads with complicated torque-speed characteristics. The inability to adequately model load dynamics in the past had increased system vulnerability to such events. FIDVR is more severe when there is a concentration of “stall-prone” motors in a region. Small heating, ventilation, and air conditioning (HVAC) units are prone to stalling and may not have protection that will trip them when stalling occurs. (Large HVAC units normally have protection that is more favorable with regard the recovery of system voltage.) The mechanical torque of the compressor for these small units varies greatly through the compressor stroke and makes these motors more prone to stalling even when a voltage depression is kept very brief by transmission protection. Once the motor stalls in the event of a fault, it remains stalled in the majority of cases (even if the voltage recovers) because the compressor is unable to restart against the full head of pressure. It can take one-to-five minutes before pressure is equalized so that the motor can restart. The motor typically draws five-to-six times its normal steady-state current in this locked-rotor condition until it is tripped by the thermal overload. The result is that system voltage can be significantly depressed for many seconds after the fault is cleared, further aggravating the initial fault voltage depression. Without prompt recovery of voltage, additional induction motors can stall and create a voltage cascade. The WECC Load Modeling Task Force (LMTF) is in its final stages of developing a composite load model that includes a performance model that captures the stalled behavior of alternating current (AC) motors.
17.1 Faster clearing of faults
Fault duration and location are critical factors that drive FIDVR risk. Strategies to reduce expected fault duration at critical locations can be part of a cost-effective plan to manage FIDVR exposures. This could include the reduction of breaker failure operation times, installation of relays selected primarily for their operating speed for faults determined to be critical, application of pilot or transfer trip relaying schemes, use of faster breakers, or replacement of gang-operated breakers with independent pole-operated breakers. However, this is not a solution for those events in which three-cycle clearing resulted in FIDVR.
17.2 Special protection schemes (SPS)
Special protection schemes may be used as a safety net to confine the area impacted by FIDVR. If a voltage collapse develops in a load center because of a multi-contingency event, an SPS can contain the disturbance from spreading to larger grid.
May 14, 2013 126
W E S T E R N E L E C T R I C I T Y C O O R D I N A T I N G C O U N C I L • W W W . W E C C . B I Z 1 5 5 N O R T H 4 0 0 W E S T • S U I T E 2 0 0 • S A L T L A K E C I T Y • U T A H • 8 4 1 0 3 - 1 1 1 4 • P H 8 0 1 . 5 8 2 . 0 3 5 3
However, use of an SPS for FIDVR mitigation would not comply with TPL-001-1 as now drafted because the SPS action would initiate non-consequential load loss. So, while this action would be taken to benefit system reliability, it would constitute non-compliance. In fact, the proposed requirements for non-consequential load loss will almost certainly be an issue for FIDVR regardless of whether an SPS is employed. For example, PGE experienced a sustained three-phase fault-on the Newark—Ravenswood 230-kV line on July 12, 2008. The fault cleared within five cycles, but the 500-kV voltage near the fault experienced a decrease of more than 100-kV, and 350 to 440 MW of non-consequential load loss resulted. This loss was attributed to stalled motor loads.
17.3 Limiting impacted load
Strategies to limit the amount of load subjected to low voltage should be considered for the most critical FIDVR fault locations. This could be accomplished through sectionalizing a tightly-coupled transmission system. The impact on other limits, such as thermal and voltage levels, would also have to be considered in the analysis.
17.4 Addition of reactive sources or relocation of reactive sources relative to critical load
Following the Hassayampa event, APS added significant new combustion turbine generation in the heart of Phoenix to provide voltage support. The 10-year plan developed for metropolitan Atlanta following the Union City event includes installation of a 260-MVAr static VAr compensator (SVC), as well as relocation of key generating units to lower system voltage-level interconnections. Similarly, Center Point Energy is in process of installing two 140-MVAr SVCs in the Houston metropolitan area to mitigate FIDVR events, and Georgia Transmission Company (GTC) has installed a 260-MVAr unit planned by Southern Company in the Atlanta metropolitan area.
The use of SVCs, static synchronous compensators (STATCOMs), or even fast-switched capacitors for additional dynamic support can be appropriate. However, because of their ability to contribute above their steady-state, MVAr capability during transient fault events, generators are superior dynamic MVAr sources. Also, SVCs and STATCOMs must be applied with particular attention to station service configuration and low-voltage ride through capability. This attention has been given to the installations noted above. New-generation or transmission can reduce FIDVR vulnerability. However, in some cases, new transmission can also allow a fault to reduce voltage over a wider area during the fault, so each situation needs to be carefully analyzed. The effectiveness of dynamic support is very dependent on its location. Dynamic simulation studies should be conducted to determine sites where dynamic support will provide optimal FIDVR mitigation. This information can be used to install transmission-based dynamic MVArs, or for targeting regions for potential new-generation.
May 14, 2013 127
W E S T E R N E L E C T R I C I T Y C O O R D I N A T I N G C O U N C I L • W W W . W E C C . B I Z 1 5 5 N O R T H 4 0 0 W E S T • S U I T E 2 0 0 • S A L T L A K E C I T Y • U T A H • 8 4 1 0 3 - 1 1 1 4 • P H 8 0 1 . 5 8 2 . 0 3 5 3
17.5 Under-voltage Load Shedding (UVLS)
An undervoltage load shedding scheme (UVLS) can be an effective component in a strategy to manage FIDVR risk and limit the size of any potential disturbance. This should be viewed as a safety net. UVLS is generally viewed as ineffective in preventing fast-voltage collapse, but quite effective in preventing slow-voltage collapse. Because changing system conditions may transform a fast-collapse scenario into a slow-collapse scenario, the UVLS option may still be considered when addressing NERC Technical Reference Paper on fault-induced delayed voltage recovery identified fast-collapse vulnerability. To be effective, UVLS schemes need to trip load as soon as possible while ensuring security with backup relaying schemes.
17.6 Promoting energy-saving devices to reduce demand
Energy-saving devices can cost-effectively lower the total amount of load being served, perhaps reducing the likelihood of a FIDVR. However, this could also increase the AC percent of total load with the opposite effect.
17.7 Unit-level solutions
As mentioned earlier, promotion of grid-friendly AC units with undervoltage protection could greatly reduce the likelihood of FIDVR over the long term.
Long-term, unit-level solutions have two categories:
1) Relays that disconnect AC compressor motors when they stall; this method requires reliable detection of the stall condition to prevent customer inconvenience.
2) Devices that allow AC compressor motors to ride through transmission faults; this method would require design changes for compressor motors or addition of power electronic interfaces.
May 14, 2013 128
W E S T E R N E L E C T R I C I T Y C O O R D I N A T I N G C O U N C I L • W W W . W E C C . B I Z 1 5 5 N O R T H 4 0 0 W E S T • S U I T E 2 0 0 • S A L T L A K E C I T Y • U T A H • 8 4 1 0 3 - 1 1 1 4 • P H 8 0 1 . 5 8 2 . 0 3 5 3
APPENDIX 18
FACTS Controllers
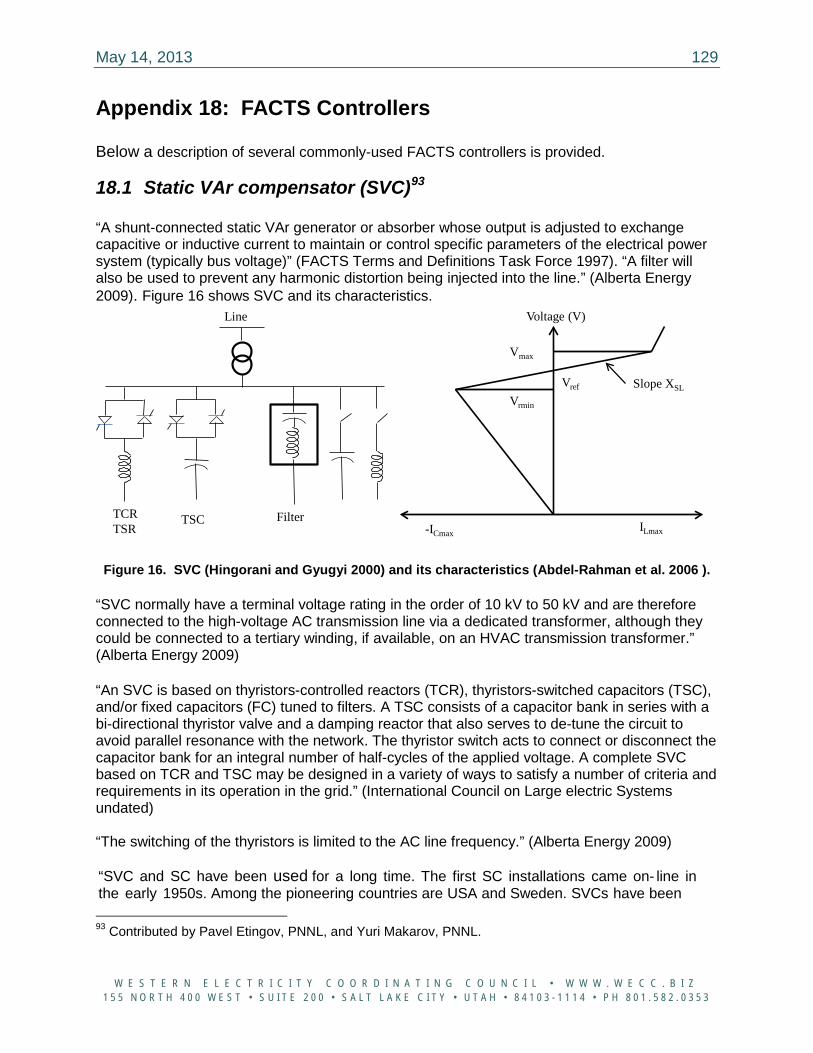
May 14, 2013 129
W E S T E R N E L E C T R I C I T Y C O O R D I N A T I N G C O U N C I L • W W W . W E C C . B I Z 1 5 5 N O R T H 4 0 0 W E S T • S U I T E 2 0 0 • S A L T L A K E C I T Y • U T A H • 8 4 1 0 3 - 1 1 1 4 • P H 8 0 1 . 5 8 2 . 0 3 5 3
Appendix 18: FACTS Controllers Below a description of several commonly-used FACTS controllers is provided.
18.1 Static VAr compensator (SVC)93 “A shunt-connected static VAr generator or absorber whose output is adjusted to exchange capacitive or inductive current to maintain or control specific parameters of the electrical power system (typically bus voltage)” (FACTS Terms and Definitions Task Force 1997). “A filter will also be used to prevent any harmonic distortion being injected into the line.” (Alberta Energy 2009). Figure 16 shows SVC and its characteristics.
Figure 16. SVC (Hingorani and Gyugyi 2000) and its characteristics (Abdel-Rahman et al. 2006 ).
“SVC normally have a terminal voltage rating in the order of 10 kV to 50 kV and are therefore connected to the high-voltage AC transmission line via a dedicated transformer, although they could be connected to a tertiary winding, if available, on an HVAC transmission transformer.” (Alberta Energy 2009) “An SVC is based on thyristors-controlled reactors (TCR), thyristors-switched capacitors (TSC), and/or fixed capacitors (FC) tuned to filters. A TSC consists of a capacitor bank in series with a bi-directional thyristor valve and a damping reactor that also serves to de-tune the circuit to avoid parallel resonance with the network. The thyristor switch acts to connect or disconnect the capacitor bank for an integral number of half-cycles of the applied voltage. A complete SVC based on TCR and TSC may be designed in a variety of ways to satisfy a number of criteria and requirements in its operation in the grid.” (International Council on Large electric Systems undated) “The switching of the thyristors is limited to the AC line frequency.” (Alberta Energy 2009) “SVC and SC have been used for a long time. The first SC installations came on- line in the early 1950s. Among the pioneering countries are USA and Sweden. SVCs have been 93 Contributed by Pavel Etingov, PNNL, and Yuri Makarov, PNNL.
TCRTSR
TSC Filter
Line Voltage (V)
Vmax
Vref Slope XSL
Vrmin
-ICmax ILmax
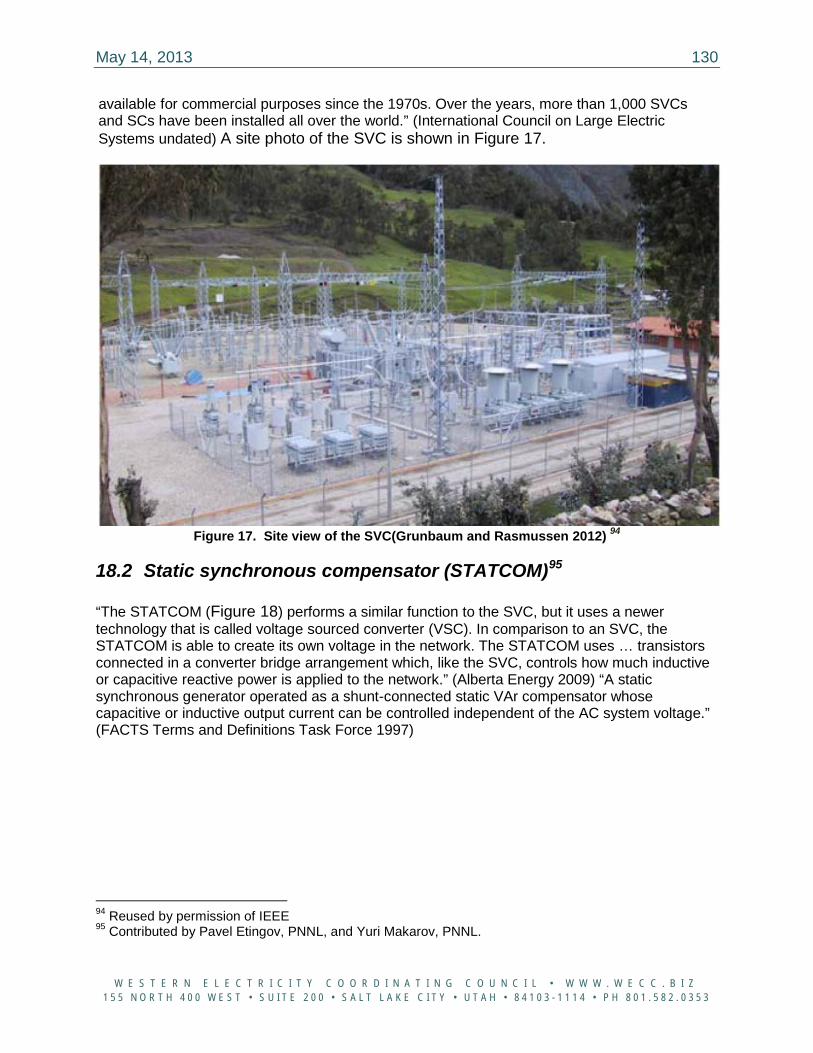
May 14, 2013 130
W E S T E R N E L E C T R I C I T Y C O O R D I N A T I N G C O U N C I L • W W W . W E C C . B I Z 1 5 5 N O R T H 4 0 0 W E S T • S U I T E 2 0 0 • S A L T L A K E C I T Y • U T A H • 8 4 1 0 3 - 1 1 1 4 • P H 8 0 1 . 5 8 2 . 0 3 5 3
available for commercial purposes since the 1970s. Over the years, more than 1,000 SVCs and SCs have been installed all over the world.” (International Council on Large Electric Systems undated) A site photo of the SVC is shown in Figure 17.
Figure 17. Site view of the SVC(Grunbaum and Rasmussen 2012) 94
18.2 Static synchronous compensator (STATCOM)95 “The STATCOM (Figure 18) performs a similar function to the SVC, but it uses a newer technology that is called voltage sourced converter (VSC). In comparison to an SVC, the STATCOM is able to create its own voltage in the network. The STATCOM uses … transistors connected in a converter bridge arrangement which, like the SVC, controls how much inductive or capacitive reactive power is applied to the network.” (Alberta Energy 2009) “A static synchronous generator operated as a shunt-connected static VAr compensator whose capacitive or inductive output current can be controlled independent of the AC system voltage.” (FACTS Terms and Definitions Task Force 1997)
94 Reused by permission of IEEE 95 Contributed by Pavel Etingov, PNNL, and Yuri Makarov, PNNL.
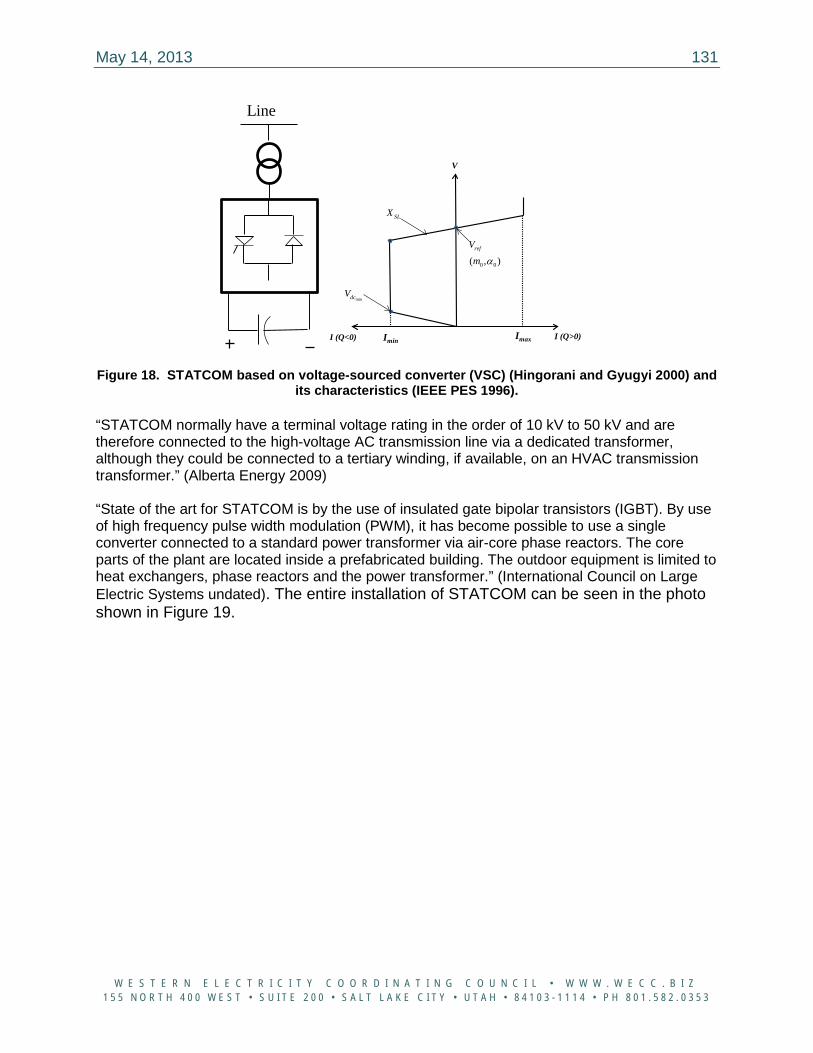
May 14, 2013 131
W E S T E R N E L E C T R I C I T Y C O O R D I N A T I N G C O U N C I L • W W W . W E C C . B I Z 1 5 5 N O R T H 4 0 0 W E S T • S U I T E 2 0 0 • S A L T L A K E C I T Y • U T A H • 8 4 1 0 3 - 1 1 1 4 • P H 8 0 1 . 5 8 2 . 0 3 5 3
Figure 18. STATCOM based on voltage-sourced converter (VSC) (Hingorani and Gyugyi 2000) and its characteristics (IEEE PES 1996).
“STATCOM normally have a terminal voltage rating in the order of 10 kV to 50 kV and are therefore connected to the high-voltage AC transmission line via a dedicated transformer, although they could be connected to a tertiary winding, if available, on an HVAC transmission transformer.” (Alberta Energy 2009) “State of the art for STATCOM is by the use of insulated gate bipolar transistors (IGBT). By use of high frequency pulse width modulation (PWM), it has become possible to use a single converter connected to a standard power transformer via air-core phase reactors. The core parts of the plant are located inside a prefabricated building. The outdoor equipment is limited to heat exchangers, phase reactors and the power transformer.” (International Council on Large Electric Systems undated). The entire installation of STATCOM can be seen in the photo shown in Figure 19.
Line
V
Imin Imax I (Q>0)I (Q<0)
SLX
0 0( , )refVm α
mindcV
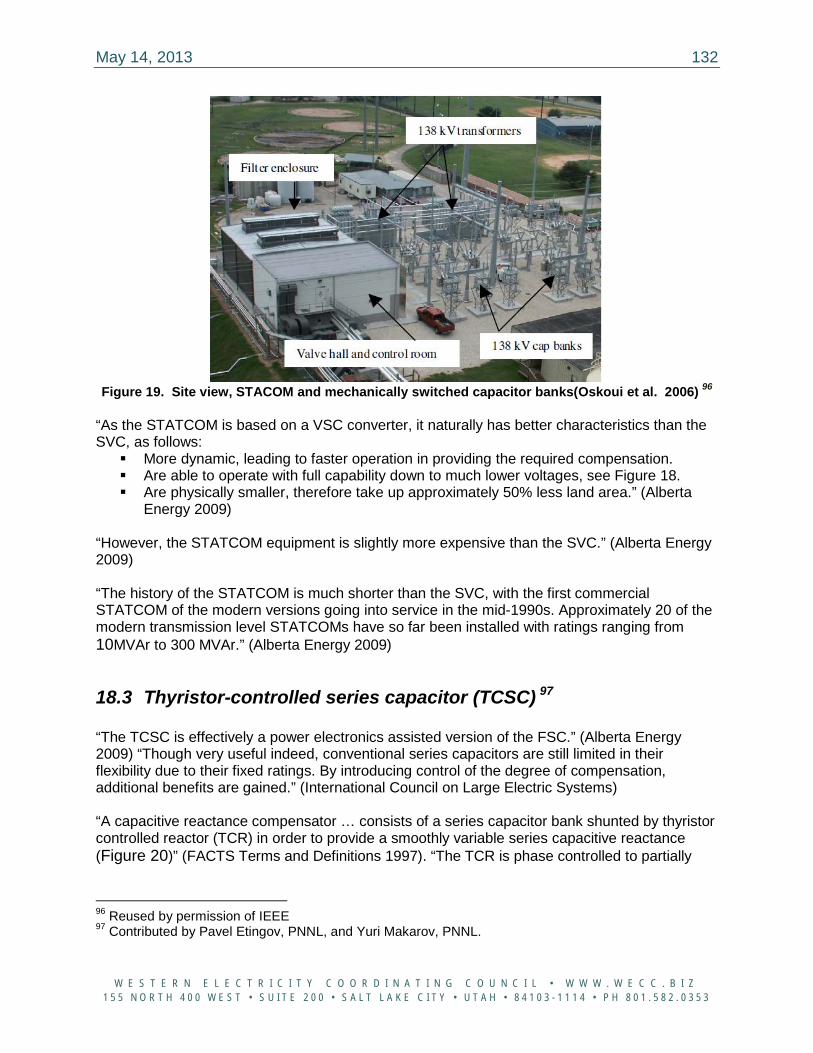
May 14, 2013 132
W E S T E R N E L E C T R I C I T Y C O O R D I N A T I N G C O U N C I L • W W W . W E C C . B I Z 1 5 5 N O R T H 4 0 0 W E S T • S U I T E 2 0 0 • S A L T L A K E C I T Y • U T A H • 8 4 1 0 3 - 1 1 1 4 • P H 8 0 1 . 5 8 2 . 0 3 5 3
Figure 19. Site view, STACOM and mechanically switched capacitor banks(Oskoui et al. 2006) 96
“As the STATCOM is based on a VSC converter, it naturally has better characteristics than the SVC, as follows: More dynamic, leading to faster operation in providing the required compensation. Are able to operate with full capability down to much lower voltages, see Figure 18. Are physically smaller, therefore take up approximately 50% less land area.” (Alberta
Energy 2009)
“However, the STATCOM equipment is slightly more expensive than the SVC.” (Alberta Energy 2009) “The history of the STATCOM is much shorter than the SVC, with the first commercial STATCOM of the modern versions going into service in the mid-1990s. Approximately 20 of the modern transmission level STATCOMs have so far been installed with ratings ranging from 10MVAr to 300 MVAr.” (Alberta Energy 2009)
18.3 Thyristor-controlled series capacitor (TCSC) 97 “The TCSC is effectively a power electronics assisted version of the FSC.” (Alberta Energy 2009) “Though very useful indeed, conventional series capacitors are still limited in their flexibility due to their fixed ratings. By introducing control of the degree of compensation, additional benefits are gained.” (International Council on Large Electric Systems) “A capacitive reactance compensator … consists of a series capacitor bank shunted by thyristor controlled reactor (TCR) in order to provide a smoothly variable series capacitive reactance (Figure 20)” (FACTS Terms and Definitions 1997). “The TCR is phase controlled to partially
96 Reused by permission of IEEE 97 Contributed by Pavel Etingov, PNNL, and Yuri Makarov, PNNL.
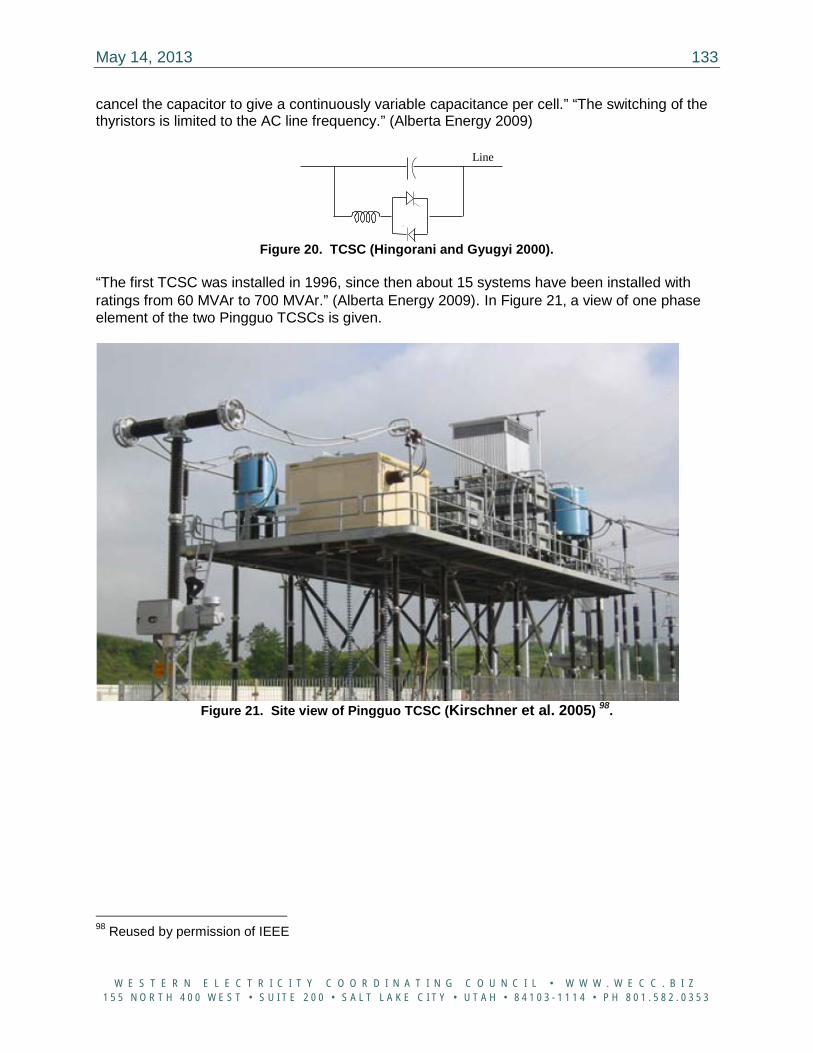
May 14, 2013 133
W E S T E R N E L E C T R I C I T Y C O O R D I N A T I N G C O U N C I L • W W W . W E C C . B I Z 1 5 5 N O R T H 4 0 0 W E S T • S U I T E 2 0 0 • S A L T L A K E C I T Y • U T A H • 8 4 1 0 3 - 1 1 1 4 • P H 8 0 1 . 5 8 2 . 0 3 5 3
cancel the capacitor to give a continuously variable capacitance per cell.” “The switching of the thyristors is limited to the AC line frequency.” (Alberta Energy 2009)
Figure 20. TCSC (Hingorani and Gyugyi 2000).
“The first TCSC was installed in 1996, since then about 15 systems have been installed with ratings from 60 MVAr to 700 MVAr.” (Alberta Energy 2009). In Figure 21, a view of one phase element of the two Pingguo TCSCs is given.
Figure 21. Site view of Pingguo TCSC (Kirschner et al. 2005) 98.
98 Reused by permission of IEEE
Line
May 14, 2013 134
W E S T E R N E L E C T R I C I T Y C O O R D I N A T I N G C O U N C I L • W W W . W E C C . B I Z 1 5 5 N O R T H 4 0 0 W E S T • S U I T E 2 0 0 • S A L T L A K E C I T Y • U T A H • 8 4 1 0 3 - 1 1 1 4 • P H 8 0 1 . 5 8 2 . 0 3 5 3
APPENDIX 19
European Standards and Practice
May 14, 2013 135
W E S T E R N E L E C T R I C I T Y C O O R D I N A T I N G C O U N C I L • W W W . W E C C . B I Z 1 5 5 N O R T H 4 0 0 W E S T • S U I T E 2 0 0 • S A L T L A K E C I T Y • U T A H • 8 4 1 0 3 - 1 1 1 4 • P H 8 0 1 . 5 8 2 . 0 3 5 3
Appendix 19: European Standards and Practice (Ernst et al. 2010, Makarov et al. 2008)
“Primary regulation (frequency response) responds to frequency variations in a continuous automatic manner. It is provided by generators based on a decentralized principle. All European systems are obligated to provide a total of 3,000 MW of the primary reserve capacity, which should be capable of deploying within 30 seconds. (This corresponds to the outage of two major nuclear power plants with the capacity of 1,500 MW each.) The 3,000-MW primary regulation capacity requirement is distributed to each TSO depending on the size of its served load. Secondary reserve (regulation) has a 5-minute deployment requirement. Tertiary reserve (load following) must meet a 15-minute deployment requirement. Transmission system operators (TSOs) do not have or use the contingency reserve. Power plants must provide reserves to the TSO in emergency situations.” (Ernst et al. 2010)
19.1 Germany (Ernst et al. 2010) Primary regulation (frequency response). The German share in the European primary reserve is 630 MW. The primary regulation is procured as capacity reserve based on a market mechanism. Resources providing primary regulation service are paid for their capacity allocated to this purpose, based on the market price. They are not paid for the energy component of this service. “Secondary reserve (regulation). The German TSOs procure about 4,900 MW (-2,200 MW for the regulation down, and +2,700 MW for the regulation up capacity)…Secondary regulation is provided by power plants connected to the automatic generation control (AGC) system. These are mainly hydropower plants and pumped hydro plants. It is interesting that the system operators decide if and when a hydro unit should be started or stopped to provide more or less spinning regulation capacity, which is the regulation resource (not necessarily spinning). The secondary regulation resources are paid the market price for both the procured capacity and actual energy provided for regulation. Four German TSOs implemented a shared secondary reserve utilization scheme that helps to minimize the regulation needs in their control areas… The scheme is similar to the area control error (ACE) diversity interchange scheme used in the United States, but it is more advanced as a result of sharing of regulation resources between areas and because of the optimization algorithm helping to select the most economical solution in a wide area. Tertiary reserve (load following)… German TSOs procure 2,400 MW of the downward and +2,300 MW of the upward tertiary reserve capacity… The tertiary regulation resources are paid the market price for both the procured capacity and actual energy provided. Some TSOs procure a limited wind reserve. It has a 45-minute deployment characteristic that is activated infrequently. TSOs pay the market price for … reserves. The energy cost is recovered from the imbalance account, created using payments for deviations from the bilateral schedules by responsible
May 14, 2013 136
W E S T E R N E L E C T R I C I T Y C O O R D I N A T I N G C O U N C I L • W W W . W E C C . B I Z 1 5 5 N O R T H 4 0 0 W E S T • S U I T E 2 0 0 • S A L T L A K E C I T Y • U T A H • 8 4 1 0 3 - 1 1 1 4 • P H 8 0 1 . 5 8 2 . 0 3 5 3
energy market participants. The capacity payments are recovered from the network utilization charges that are collected from the consumers. In the case of wind and solar resources, the TSOs themselves are the responsible parties and are charged for deviations. The renewable energy sources (RES) are excluded from these deviation charges.
19.2 Spain (Makarov et al. 2008) [Frequency response.] All generators operate with a reserve margin of 1.5%. Should a generator decide to operate at full capacity it could contract for this service from the other resources. Wind generation is also required to procure primary regulation which is approximately 1.5% of the plant’s installed capacity. Wind plants typically buy their frequency response obligation from other units. Regulation resources in Spain include many fast-responsive hydropower generators. Secondary regulation…is a market-driven service, which is provided by licensed units on automatic generation control (AGC). [REE procures less than ± 1,000 MW of the secondary regulation reserve to balance its system in real-time.] Tertiary regulation. REE carries as much as 3,000 MW of tertiary reserves. This service is manual and is dispatched 15 minutes before the beginning of an operating hour, or within the hour if required. When dispatched, the energy must be sustainable for 2 hours if required. This service is mandatory (generators are mandated to offer all available power), and is market-driven. Deviations reserve. This reserve helps to balance big differences (> 300 MW) between scheduled generation and forecast demand. The foreseen deviations include unavailability or justified changes communicated from generation. Generation and pumping units provide this reserve.
May 14, 2013 137
W E S T E R N E L E C T R I C I T Y C O O R D I N A T I N G C O U N C I L • W W W . W E C C . B I Z 1 5 5 N O R T H 4 0 0 W E S T • S U I T E 2 0 0 • S A L T L A K E C I T Y • U T A H • 8 4 1 0 3 - 1 1 1 4 • P H 8 0 1 . 5 8 2 . 0 3 5 3
APPENDIX 20
International Experience
May 14, 2013 138
W E S T E R N E L E C T R I C I T Y C O O R D I N A T I N G C O U N C I L • W W W . W E C C . B I Z 1 5 5 N O R T H 4 0 0 W E S T • S U I T E 2 0 0 • S A L T L A K E C I T Y • U T A H • 8 4 1 0 3 - 1 1 1 4 • P H 8 0 1 . 5 8 2 . 0 3 5 3
Appendix 20: International Experience
20.1 Germany
Wind generators in Germany are not curtailed because of the over generation situation. Over generation results in negative market prices; sometimes these prices reach extreme values.
Wind and solar energy producers in Germany get remunerated by the TSOs at fixed tariff prices for the energy actually produced. The tariffs vary depending upon generation types (e.g., offshore wind, onshore wind, and photovoltaic (PV) solar energy). The price depends on the quality of the site; very good sites have a higher digression of the price, i.e., their feed-in tariff is reduced compared to sites with lower potential. For example, 50-HzT pays an average of 80 Euro per megawatt-hour for onshore wind. In the case of wind and solar resources, the TSOs are the responsible parties and are charged for deviations. The RES are excluded from these deviation charges. An operator of a renewable energy source can choose between two ways of payment:
- RES Option 1. Fixed price for energy. TSOs are obligated to sell the energy on the EEX market and are responsible for the balancing function. Under RES option 1, for selling wind and solar energy, there is a centralized market run by TSOs. Wind and solar power plants produce “must take” energy except for a few cases when the wind power production is curtailed because of "system security conditions," which do not include over generation. - RES Option 2. RES operators act as market participants and need to sell the energy by themselves via bilateral trading or trading at the energy exchange. They are responsible for any imbalances. To cover the difference between market costs versus generation costs and costs of imbalances, RES operators get an additional payment per megawatt-hour depending on the kind of RES. TSOs are responsible for placing the volume of wind energy on the market. Therefore, the TSOs sell wind and solar energy on the power exchange. If the market price is lower than the tariff purchase price, the TSOs ultimately charge the difference to consumers based on an annual settlement period. This charge to consumers is not a pass through cost and must be approved by regulators. The TSOs are expected to make an optimal marketing decision and may not be reimbursed for “bad judgment” in the execution of trades to sell “must take” energy.
20.2 Spain
REE has sufficient flexible generation to manage over generation issues. REE also has authority to curtail excessive conventional and wind generation during low-load periods. Because there is a minimum value for manageable generation (technical minimum power output of generating units, flowing hydropower plants…), sometimes it is necessary to shut down conventional power generation during off-peak hours and reconnect it several hours later in real-time. Power plants that are needed for daily peak loads have longer startup times and must remain connected during off-peak periods. Because of this and the need to deliver ancillary

May 14, 2013 139
W E S T E R N E L E C T R I C I T Y C O O R D I N A T I N G C O U N C I L • W W W . W E C C . B I Z 1 5 5 N O R T H 4 0 0 W E S T • S U I T E 2 0 0 • S A L T L A K E C I T Y • U T A H • 8 4 1 0 3 - 1 1 1 4 • P H 8 0 1 . 5 8 2 . 0 3 5 3
services, there is a ratio above which wind power reduction is unavoidable. (Makarov et al. 2008) In case of real-time curtailments, which is the most common, loss of profits is not covered; only in the case of planned reductions, 15 percent of the hourly price can be recovered by the affected energy producer.
May 14, 2013 140
W E S T E R N E L E C T R I C I T Y C O O R D I N A T I N G C O U N C I L • W W W . W E C C . B I Z 1 5 5 N O R T H 4 0 0 W E S T • S U I T E 2 0 0 • S A L T L A K E C I T Y • U T A H • 8 4 1 0 3 - 1 1 1 4 • P H 8 0 1 . 5 8 2 . 0 3 5 3
APPENDIX 21
Inertia and Frequency Response
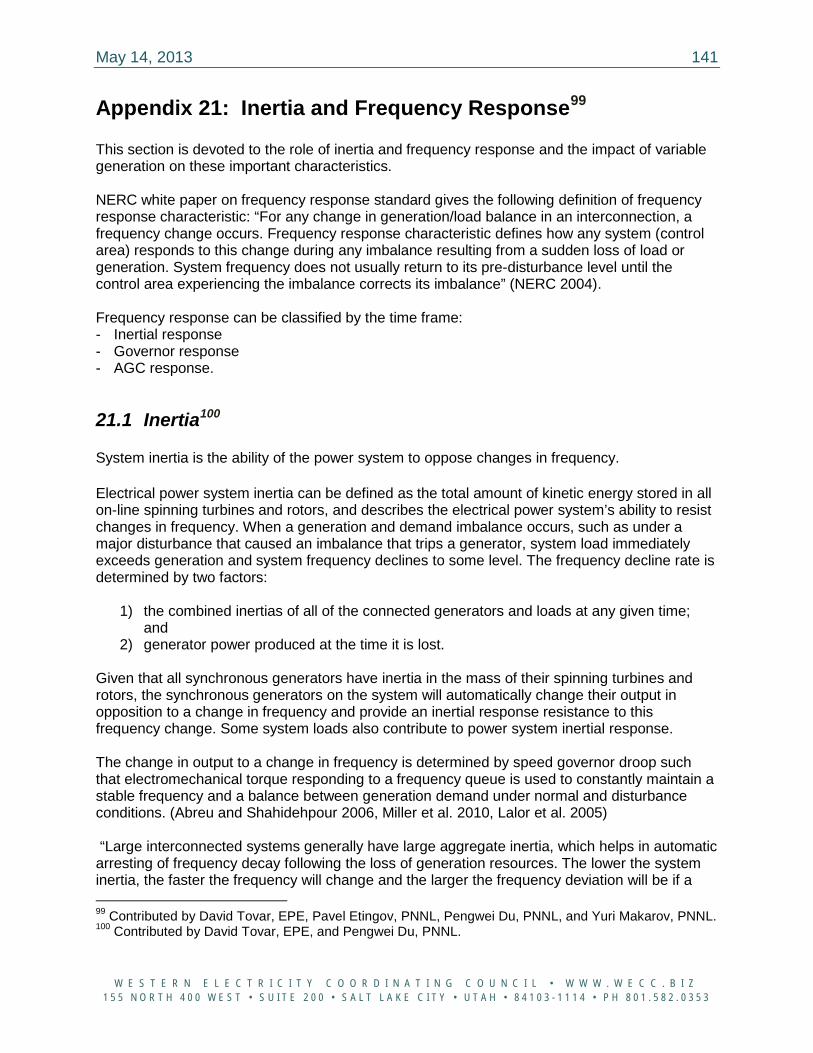
May 14, 2013 141
W E S T E R N E L E C T R I C I T Y C O O R D I N A T I N G C O U N C I L • W W W . W E C C . B I Z 1 5 5 N O R T H 4 0 0 W E S T • S U I T E 2 0 0 • S A L T L A K E C I T Y • U T A H • 8 4 1 0 3 - 1 1 1 4 • P H 8 0 1 . 5 8 2 . 0 3 5 3
Appendix 21: Inertia and Frequency Response99 This section is devoted to the role of inertia and frequency response and the impact of variable generation on these important characteristics. NERC white paper on frequency response standard gives the following definition of frequency response characteristic: “For any change in generation/load balance in an interconnection, a frequency change occurs. Frequency response characteristic defines how any system (control area) responds to this change during any imbalance resulting from a sudden loss of load or generation. System frequency does not usually return to its pre-disturbance level until the control area experiencing the imbalance corrects its imbalance” (NERC 2004). Frequency response can be classified by the time frame: - Inertial response - Governor response - AGC response.
21.1 Inertia100
System inertia is the ability of the power system to oppose changes in frequency.
Electrical power system inertia can be defined as the total amount of kinetic energy stored in all on-line spinning turbines and rotors, and describes the electrical power system’s ability to resist changes in frequency. When a generation and demand imbalance occurs, such as under a major disturbance that caused an imbalance that trips a generator, system load immediately exceeds generation and system frequency declines to some level. The frequency decline rate is determined by two factors:
1) the combined inertias of all of the connected generators and loads at any given time; and
2) generator power produced at the time it is lost. Given that all synchronous generators have inertia in the mass of their spinning turbines and rotors, the synchronous generators on the system will automatically change their output in opposition to a change in frequency and provide an inertial response resistance to this frequency change. Some system loads also contribute to power system inertial response. The change in output to a change in frequency is determined by speed governor droop such that electromechanical torque responding to a frequency queue is used to constantly maintain a stable frequency and a balance between generation demand under normal and disturbance conditions. (Abreu and Shahidehpour 2006, Miller et al. 2010, Lalor et al. 2005) “Large interconnected systems generally have large aggregate inertia, which helps in automatic arresting of frequency decay following the loss of generation resources. The lower the system inertia, the faster the frequency will change and the larger the frequency deviation will be if a 99 Contributed by David Tovar, EPE, Pavel Etingov, PNNL, Pengwei Du, PNNL, and Yuri Makarov, PNNL. 100 Contributed by David Tovar, EPE, and Pengwei Du, PNNL.
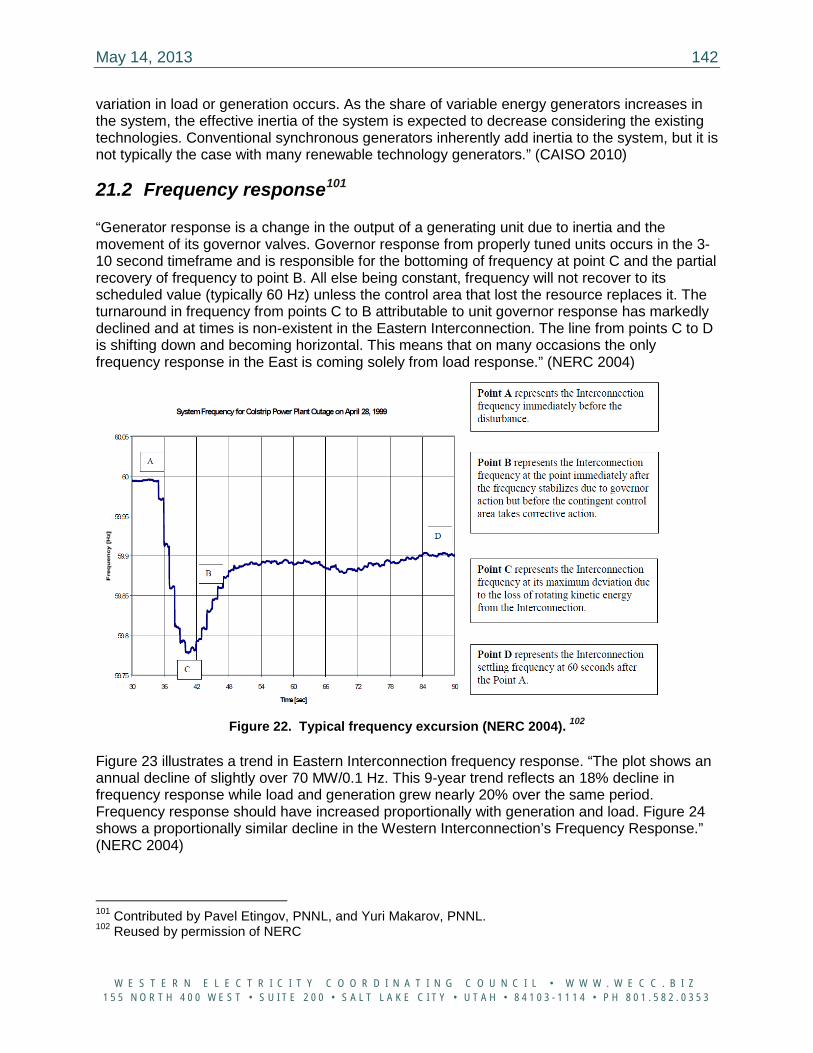
May 14, 2013 142
W E S T E R N E L E C T R I C I T Y C O O R D I N A T I N G C O U N C I L • W W W . W E C C . B I Z 1 5 5 N O R T H 4 0 0 W E S T • S U I T E 2 0 0 • S A L T L A K E C I T Y • U T A H • 8 4 1 0 3 - 1 1 1 4 • P H 8 0 1 . 5 8 2 . 0 3 5 3
variation in load or generation occurs. As the share of variable energy generators increases in the system, the effective inertia of the system is expected to decrease considering the existing technologies. Conventional synchronous generators inherently add inertia to the system, but it is not typically the case with many renewable technology generators.” (CAISO 2010)
21.2 Frequency response101
“Generator response is a change in the output of a generating unit due to inertia and the movement of its governor valves. Governor response from properly tuned units occurs in the 3-10 second timeframe and is responsible for the bottoming of frequency at point C and the partial recovery of frequency to point B. All else being constant, frequency will not recover to its scheduled value (typically 60 Hz) unless the control area that lost the resource replaces it. The turnaround in frequency from points C to B attributable to unit governor response has markedly declined and at times is non-existent in the Eastern Interconnection. The line from points C to D is shifting down and becoming horizontal. This means that on many occasions the only frequency response in the East is coming solely from load response.” (NERC 2004)
Figure 22. Typical frequency excursion (NERC 2004). 102
Figure 23 illustrates a trend in Eastern Interconnection frequency response. “The plot shows an annual decline of slightly over 70 MW/0.1 Hz. This 9-year trend reflects an 18% decline in frequency response while load and generation grew nearly 20% over the same period. Frequency response should have increased proportionally with generation and load. Figure 24 shows a proportionally similar decline in the Western Interconnection’s Frequency Response.” (NERC 2004)
101 Contributed by Pavel Etingov, PNNL, and Yuri Makarov, PNNL. 102 Reused by permission of NERC
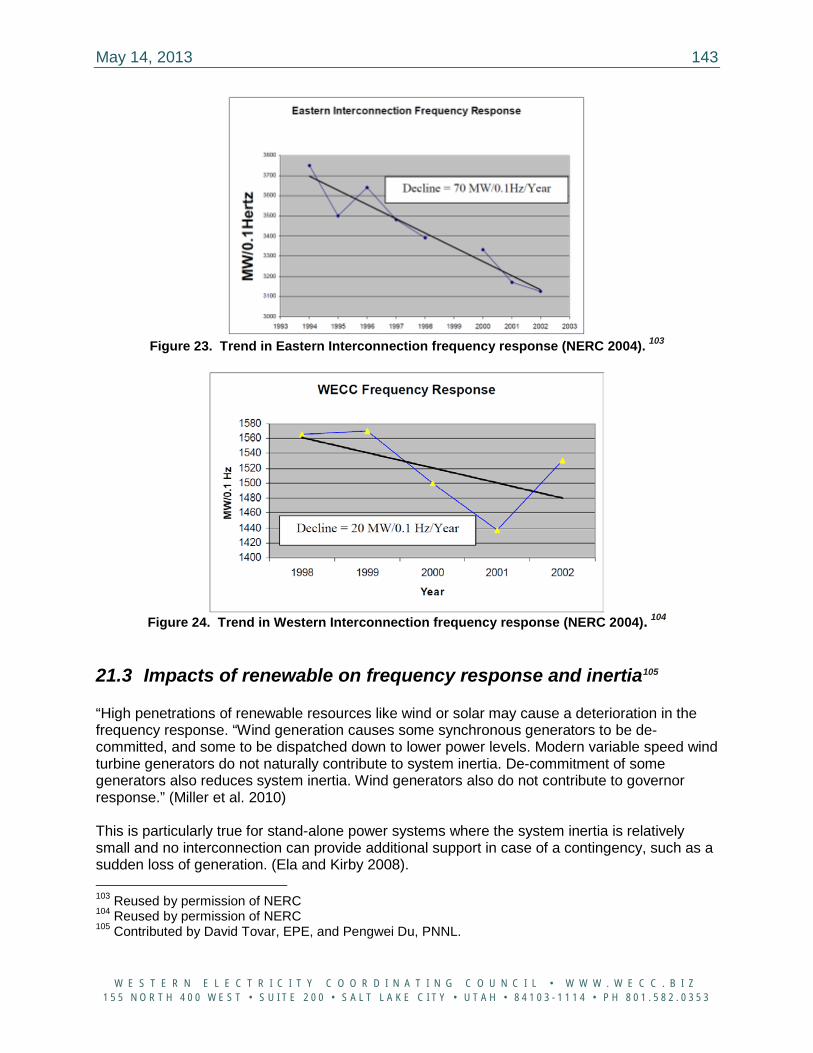
May 14, 2013 143
W E S T E R N E L E C T R I C I T Y C O O R D I N A T I N G C O U N C I L • W W W . W E C C . B I Z 1 5 5 N O R T H 4 0 0 W E S T • S U I T E 2 0 0 • S A L T L A K E C I T Y • U T A H • 8 4 1 0 3 - 1 1 1 4 • P H 8 0 1 . 5 8 2 . 0 3 5 3
Figure 23. Trend in Eastern Interconnection frequency response (NERC 2004). 103
Figure 24. Trend in Western Interconnection frequency response (NERC 2004). 104
21.3 Impacts of renewable on frequency response and inertia105
“High penetrations of renewable resources like wind or solar may cause a deterioration in the frequency response. “Wind generation causes some synchronous generators to be de-committed, and some to be dispatched down to lower power levels. Modern variable speed wind turbine generators do not naturally contribute to system inertia. De-commitment of some generators also reduces system inertia. Wind generators also do not contribute to governor response.” (Miller et al. 2010) This is particularly true for stand-alone power systems where the system inertia is relatively small and no interconnection can provide additional support in case of a contingency, such as a sudden loss of generation. (Ela and Kirby 2008). 103 Reused by permission of NERC 104 Reused by permission of NERC 105 Contributed by David Tovar, EPE, and Pengwei Du, PNNL.
May 14, 2013 144
W E S T E R N E L E C T R I C I T Y C O O R D I N A T I N G C O U N C I L • W W W . W E C C . B I Z 1 5 5 N O R T H 4 0 0 W E S T • S U I T E 2 0 0 • S A L T L A K E C I T Y • U T A H • 8 4 1 0 3 - 1 1 1 4 • P H 8 0 1 . 5 8 2 . 0 3 5 3
“Wind generation causes some synchronous generators to be de-committed, and some to be dispatched down to lower power levels. Modern variable speed wind turbine generators do not naturally contribute to system inertia. De-commitment of some generators also reduces system inertia. Wind generators also do not contribute to governor response.” (Miller et al. 2010) If more synchronous machines are displaced by wind generation, the system inertia decreases, making power system more sensitive to generation-load imbalances. This is particularly true for stand-alone power systems, where the system inertia is relatively small and no interconnection can provide additional support in case of a contingency, such as a sudden loss of generation. (Lee et al. 2010) In the study initiated by FERC’s Office of Electric Reliability and prepared by the Lawrence Berkeley National Laboratory, the impacts of integration of renewables over the system’s frequency response are summarized as follows: (Eto et al. 2010)
• Lower system inertia (lower impact compared to the three below)
• Displacement of primary frequency control reserves.
• Affect the location of primary frequency control reserves.
• Place increased requirements on the adequacy of secondary frequency control reserves to ensure primary frequency control is always available.
As such, the report concluded that there is a strong need for the use of frequency response metrics to assess the planning and operating requirements for reliable integration of variable renewable generation.
May 14, 2013 145
W E S T E R N E L E C T R I C I T Y C O O R D I N A T I N G C O U N C I L • W W W . W E C C . B I Z 1 5 5 N O R T H 4 0 0 W E S T • S U I T E 2 0 0 • S A L T L A K E C I T Y • U T A H • 8 4 1 0 3 - 1 1 1 4 • P H 8 0 1 . 5 8 2 . 0 3 5 3
APPENDIX 22
Western Renewable Energy Zones Initiative Renewable Energy Generating Capacity Summary (Western Governors’
Association and U.S. Department of Energy 2009)
May 14, 2013 146
W E S T E R N E L E C T R I C I T Y C O O R D I N A T I N G C O U N C I L • W W W . W E C C . B I Z 1 5 5 N O R T H 4 0 0 W E S T • S U I T E 2 0 0 • S A L T L A K E C I T Y • U T A H • 8 4 1 0 3 - 1 1 1 4 • P H 8 0 1 . 5 8 2 . 0 3 5 3
Appendix 22: Western Renewable Energy Zones Initiative Renewable Energy Generating Capacity Summary The Western Renewable Energy Zones (WREZ) initiative renewable energy generating capacity and generation summaries are presented in Table 3 and Table 4, respectively. (Western Governors’ Association and U.S. Department of Energy 2009) These tables quantify within each hub the energy generating capacity in megawatts and the theoretical annual energy generation in gigawatt-hours per year for the following resources: wind, solar, convention discovered geothermal energy, small and large hydropower in Canada, and incremental hydropower in the U.S.
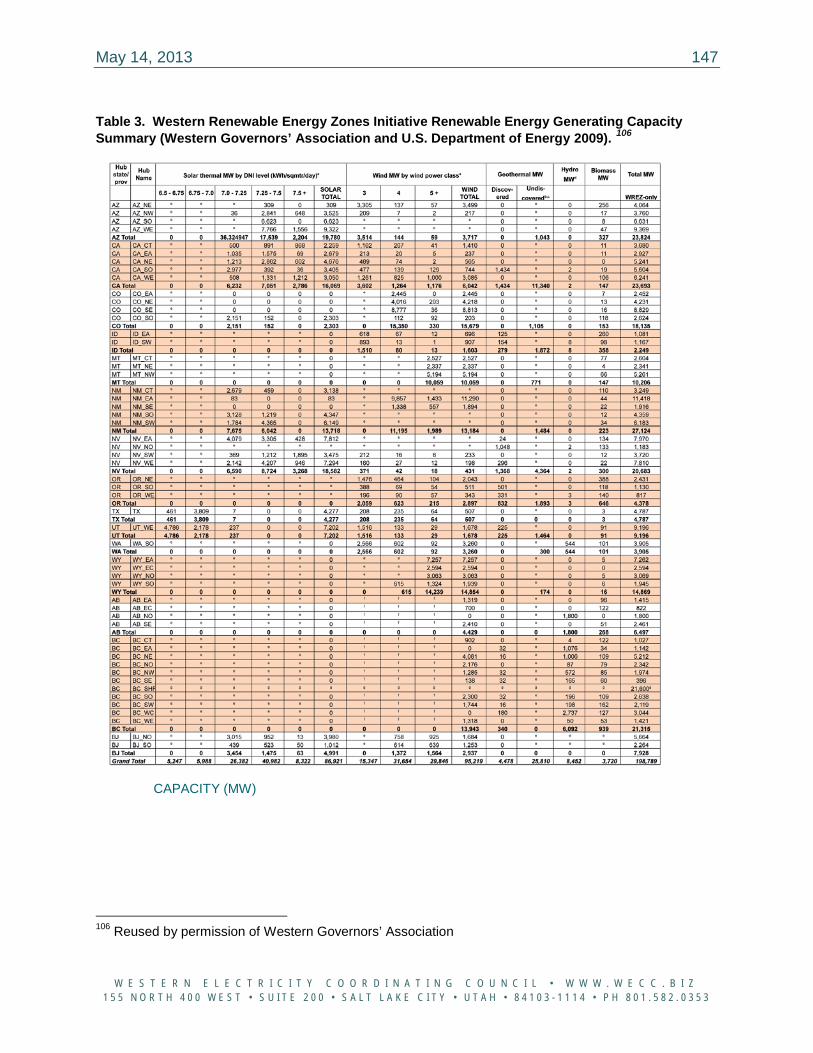
May 14, 2013 147
W E S T E R N E L E C T R I C I T Y C O O R D I N A T I N G C O U N C I L • W W W . W E C C . B I Z 1 5 5 N O R T H 4 0 0 W E S T • S U I T E 2 0 0 • S A L T L A K E C I T Y • U T A H • 8 4 1 0 3 - 1 1 1 4 • P H 8 0 1 . 5 8 2 . 0 3 5 3
Table 3. Western Renewable Energy Zones Initiative Renewable Energy Generating Capacity Summary (Western Governors’ Association and U.S. Department of Energy 2009). 106
CAPACITY (MW)
106 Reused by permission of Western Governors’ Association
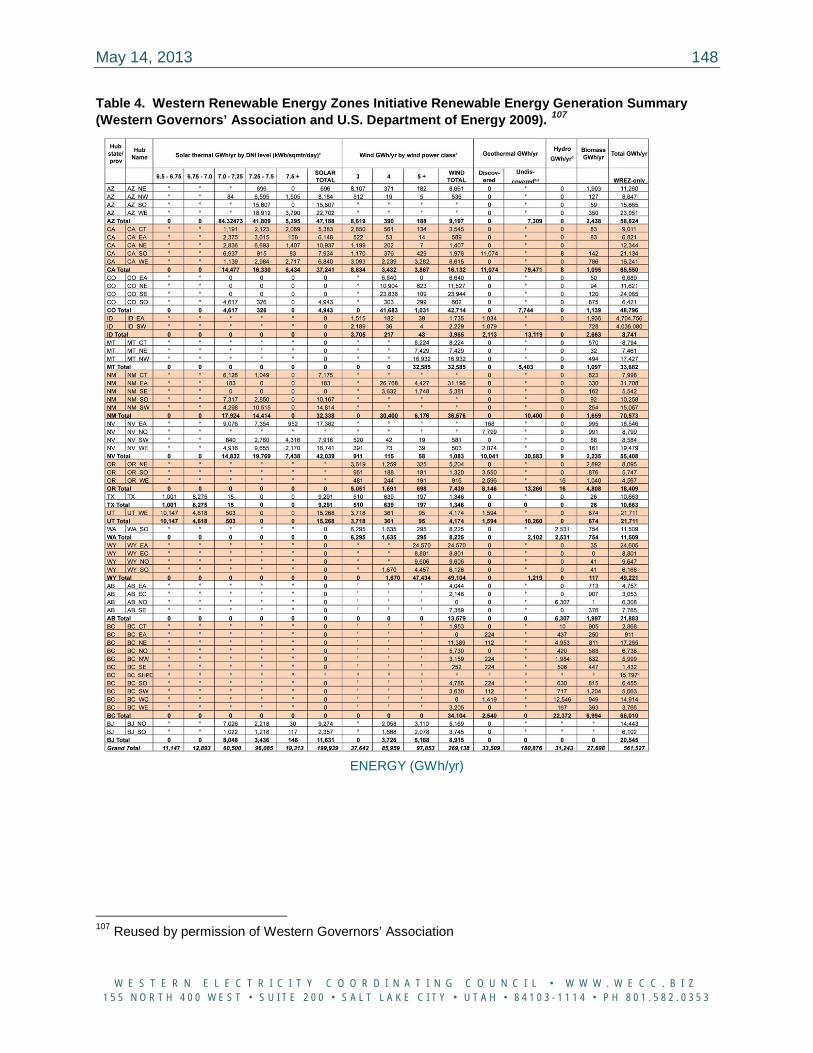
May 14, 2013 148
W E S T E R N E L E C T R I C I T Y C O O R D I N A T I N G C O U N C I L • W W W . W E C C . B I Z 1 5 5 N O R T H 4 0 0 W E S T • S U I T E 2 0 0 • S A L T L A K E C I T Y • U T A H • 8 4 1 0 3 - 1 1 1 4 • P H 8 0 1 . 5 8 2 . 0 3 5 3
Table 4. Western Renewable Energy Zones Initiative Renewable Energy Generation Summary (Western Governors’ Association and U.S. Department of Energy 2009). 107
ENERGY (GWh/yr)
107 Reused by permission of Western Governors’ Association
May 14, 2013 149
W E S T E R N E L E C T R I C I T Y C O O R D I N A T I N G C O U N C I L • W W W . W E C C . B I Z 1 5 5 N O R T H 4 0 0 W E S T • S U I T E 2 0 0 • S A L T L A K E C I T Y • U T A H • 8 4 1 0 3 - 1 1 1 4 • P H 8 0 1 . 5 8 2 . 0 3 5 3
“Endnotes supporting Table 3 and Table 4 a Only the best classes of wind and solar resources in each state were quantified. Quantifications for wind resources represent each state’s minimum wind power class and higher, and for solar resources each state’s minimum direct normal insolation level and higher. In Canada, renewable energy resources were quantified using a different methodology. It assessed resources at the site level as opposed to using raw resource data, therefore, the ‘best in state’ criteria are not applied and Canadian resources are not discounted. Wind potential was not quantified in QRAs with less than 100 MW of total wind resource potential. Additional information is available at (Western Governors’ Association and U.S. Department of Energy 2009). b Undiscovered geothermal resources are believed to exist in certain areas because of the presence of geologic systems that have been correlated with geothermal resource potential in other areas. This undiscovered potential has not yet been quantified at specific locations where a geothermal plant could be built, but it can be estimated at the state level with different levels of confidence. As a result, these resources are not quantified at the QRA level or included in the economic modeling of QRAs. When undiscovered geothermal potential is believed to exist in a QRA, it will be noted, even though it will not be quantified. The mean estimated potential from these resources by state is quantified in this table by state and province. It is not captured in the QRA MW total, because these resources are not being quantified at the QRA level. U.S. estimates are from the U.S. Geological Survey, and Canadian estimates are from the Canadian Geothermal Energy Association. c Data on undiscovered geothermal resources were not available for Baja California Norte and Texas at the time of publication. d Small and large hydropower are quantified in Canada. Incremental additions to powered or non-powered dams are quantified in the US. e These resources may exist, but they are not quantified in this study. f As noted above, a different resource assessment methodology is used to quantify the MW of renewable energy resources available in Canada. Data on the wind power class in British Columbia and Alberta are not available from this assessment. As a result, only the total potential of wind resources is shown here and is not broken down into different wind class categories. g British Columbia voluntarily provided a hub on the British Columbia-Washington border to the WREZ process. This represents a 16,000 gigawatt-hour per year shaped energy product that British Columbia could provide to load serving entities (LSEs) at the border. The intention of this additional hub and associated cost curve is not to represent a specific product offered to LSEs at the border, but to illustrate the benefits of a shaped and firmed decarbonized energy product to encourage further discussion. This hub and its energy and production profile will be selectable when using the Generation and Transmission Modeling tool. The energy resources that make up this cost curve are not specified, therefore, they are not broken down by resource type or class. The generation available from this additional QRA is not included in the B.C. subtotal or the grand total on this table.” (Western Governors Association and U.S. Department of Energy 2009).
May 14, 2013 150
W E S T E R N E L E C T R I C I T Y C O O R D I N A T I N G C O U N C I L • W W W . W E C C . B I Z 1 5 5 N O R T H 4 0 0 W E S T • S U I T E 2 0 0 • S A L T L A K E C I T Y • U T A H • 8 4 1 0 3 - 1 1 1 4 • P H 8 0 1 . 5 8 2 . 0 3 5 3
APPENDIX 23
Energy Storage
May 14, 2013 151
W E S T E R N E L E C T R I C I T Y C O O R D I N A T I N G C O U N C I L • W W W . W E C C . B I Z 1 5 5 N O R T H 4 0 0 W E S T • S U I T E 2 0 0 • S A L T L A K E C I T Y • U T A H • 8 4 1 0 3 - 1 1 1 4 • P H 8 0 1 . 5 8 2 . 0 3 5 3
Appendix 23: Energy Storage This section provides an additional information on various electrochemical capacitors, fuel cells, batteries, and flywheels.
23.1. Electrochemical Capacitors In the field of energy storage, electrochemical capacitors have been an important development in the recent years. This section provides comparison of performance of various types of electrochemical capacitors.
23.1.1 Chemistry and Physics of Electrochemical Capacitors
Electrochemical capacitors or supercapacitors store charge at the surface of the electrode, with the electrode materials being high surface-area carbons (double-layer capacitors), electroactive polymers, and transition metal oxides and nitrides (Long 2008, Conway 1999, Zhang et al. 2009). Electroactive polymers and transition metal oxides and nitrides also have a highly reversible redox reaction, exhibiting pseudo-capacitive behavior. As an example, RuO2 has a capacitance of 800ºF/g with excellent cycle life (Long 2008). Since it is too expensive, efforts are underway to develop more cost-effective materials and hybrids of graphene-based double-layer capacitors with transition metal oxides and electroactive polymers (Hou et al. 2001).
Electrical double-layer capacitors do not have a conventional dielectric (Intrator et al. 2011). The carbon electrodes are separated by a separator soaked with electrolyte. The electrolytes range from aqueous, non-aqueous, polymer and ionic liquids. This allows electrochemical capacitors to have a wide range of power and energy density. While high-power batteries using nanomaterials exhibit pseudo-capacitance, the electrochemical capacitors typically charge and discharge in seconds, have a sloping voltage profile and have nearly two orders of magnitude higher cycle life. An excellent review of the fundamentals of electrochemical capacitors, along with novel materials used and their real-world applications was provided by various articles in the spring 2008 Issue of the Interface. The first generation of electrochemical capacitors used aqueous electrolytes with an operating voltage of 1.2 V/cell, while the second generation used an organic electrolyte such as ammonium salt dissolved in propylene carbonate or acetonitrile, thus giving a unit cell voltage of 2.5 V. Cell construction is typically spiral-wound or a prismatic jelly-roll. Asymmetric capacitors use a capacitor electrode and an electrode with pseudo capacitance (Kazaryan et al. 2006, Balducci et al. 2005). As a variation, one electrode is a battery electrode, while the second electrode sometimes has a battery electrode in parallel with a capacitor as an ultra battery, which will be discussed later. The advantage is higher operating voltage, resulting in higher energy density over electrochemical capacitors, and higher cycle life compared to batteries. The capacitance of an electrode is given by
May 14, 2013 152
W E S T E R N E L E C T R I C I T Y C O O R D I N A T I N G C O U N C I L • W W W . W E C C . B I Z 1 5 5 N O R T H 4 0 0 W E S T • S U I T E 2 0 0 • S A L T L A K E C I T Y • U T A H • 8 4 1 0 3 - 1 1 1 4 • P H 8 0 1 . 5 8 2 . 0 3 5 3
AC
dε
= (A.24)
where ε is the electrolyte dielectric constant. A the electrode surface area accessible to ions, and d the distance between the center of the ion and the carbon surface. While surface area can be controlled by increasing the porosity and decreasing pore size of the electrode, control of the pore size and pore size distribution has a greater effect on electrode capacitance. For carbon electrodes, the area-specific, double-layer capacitance is 5-20 μF/cm2. Activated carbons have a high specific surface area of 3000 m2/g, with a usable area in the 1000-2000 m2/g range due to poor control of pore size distribution. Most commercial devices use activated carbon-based electrodes in organic electrolytes, with a capacitance of 100 F/g and 50 F/cm3. While the capacitance in aqueous electrolyte can reach 200ºF/g, the cell lower cell voltage negates this advantage. Activated carbon fabrics can be used directly without binders, and have a usable surface area in the 1000-2000 m2/g range. As a result of high cost, these are not used widely. Carbon nanotubes, while highly conductive, have a low specific capacitance of 20-80ºF/g due to their hydrophobicity. While surface functionalization leads to pseudo capacitance, cycle life is poor. Carbon aerogels can be prepared with a controlled pore size and uniform interconnected mesoporous pore distribution in the 2-50 nm range. The ordered and interconnected pore structure leads to high power density; however, the low specific capacitance 50ºF/g due to their low surface area (400-900 m2/g) negatively impacts specific energy (see equation below). A typical design of an electrochemical capacitor is shown below in Figure 25. The electrode thickness is 100-300 microns with a porosity of 65 to 75 percent. The energy density of the capacitor is given by, assuming cycling between Vo and Vo/2.
( )23 8 3.6Wh C Vokg
= × × ÷ ∗ (A.25)
where Vo is open circuit voltage at 100 percent SOC. The maximum power density is given by Vo2/4R, where R is the internal resistance. The power density is also measured at 95 percent efficiency pulses.
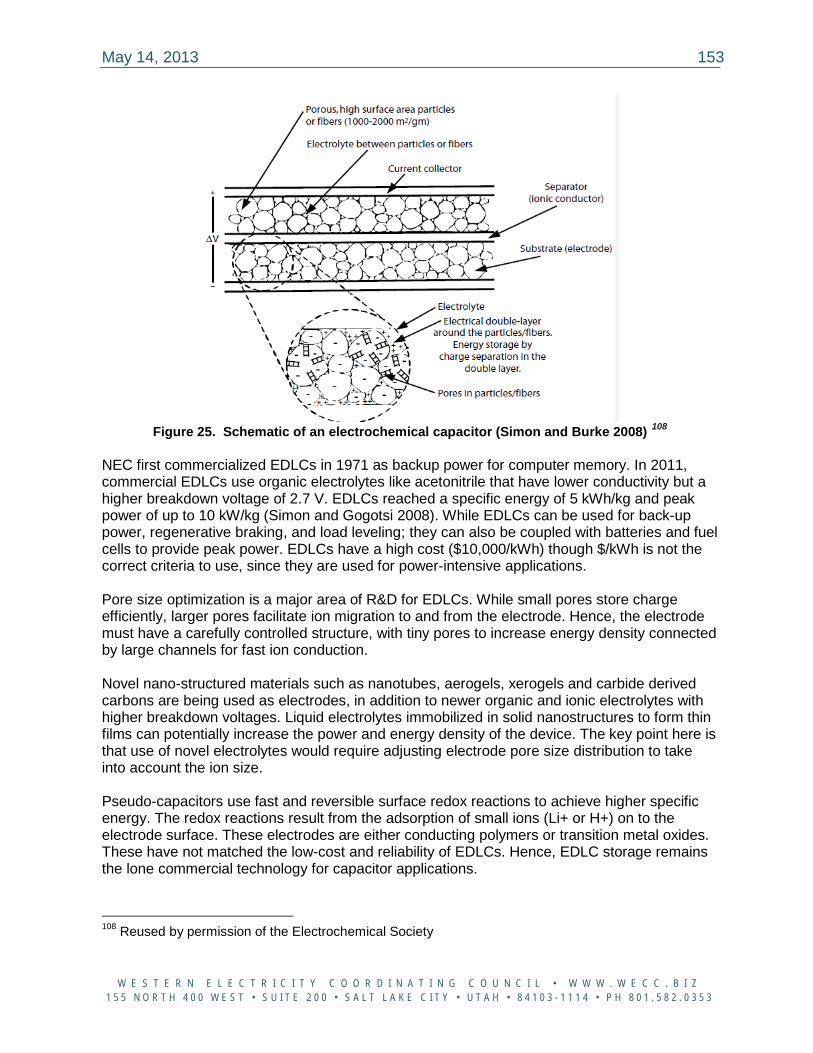
May 14, 2013 153
W E S T E R N E L E C T R I C I T Y C O O R D I N A T I N G C O U N C I L • W W W . W E C C . B I Z 1 5 5 N O R T H 4 0 0 W E S T • S U I T E 2 0 0 • S A L T L A K E C I T Y • U T A H • 8 4 1 0 3 - 1 1 1 4 • P H 8 0 1 . 5 8 2 . 0 3 5 3
Figure 25. Schematic of an electrochemical capacitor (Simon and Burke 2008) 108
NEC first commercialized EDLCs in 1971 as backup power for computer memory. In 2011, commercial EDLCs use organic electrolytes like acetonitrile that have lower conductivity but a higher breakdown voltage of 2.7 V. EDLCs reached a specific energy of 5 kWh/kg and peak power of up to 10 kW/kg (Simon and Gogotsi 2008). While EDLCs can be used for back-up power, regenerative braking, and load leveling; they can also be coupled with batteries and fuel cells to provide peak power. EDLCs have a high cost ($10,000/kWh) though $/kWh is not the correct criteria to use, since they are used for power-intensive applications. Pore size optimization is a major area of R&D for EDLCs. While small pores store charge efficiently, larger pores facilitate ion migration to and from the electrode. Hence, the electrode must have a carefully controlled structure, with tiny pores to increase energy density connected by large channels for fast ion conduction. Novel nano-structured materials such as nanotubes, aerogels, xerogels and carbide derived carbons are being used as electrodes, in addition to newer organic and ionic electrolytes with higher breakdown voltages. Liquid electrolytes immobilized in solid nanostructures to form thin films can potentially increase the power and energy density of the device. The key point here is that use of novel electrolytes would require adjusting electrode pore size distribution to take into account the ion size. Pseudo-capacitors use fast and reversible surface redox reactions to achieve higher specific energy. The redox reactions result from the adsorption of small ions (Li+ or H+) on to the electrode surface. These electrodes are either conducting polymers or transition metal oxides. These have not matched the low-cost and reliability of EDLCs. Hence, EDLC storage remains the lone commercial technology for capacitor applications.
108 Reused by permission of the Electrochemical Society
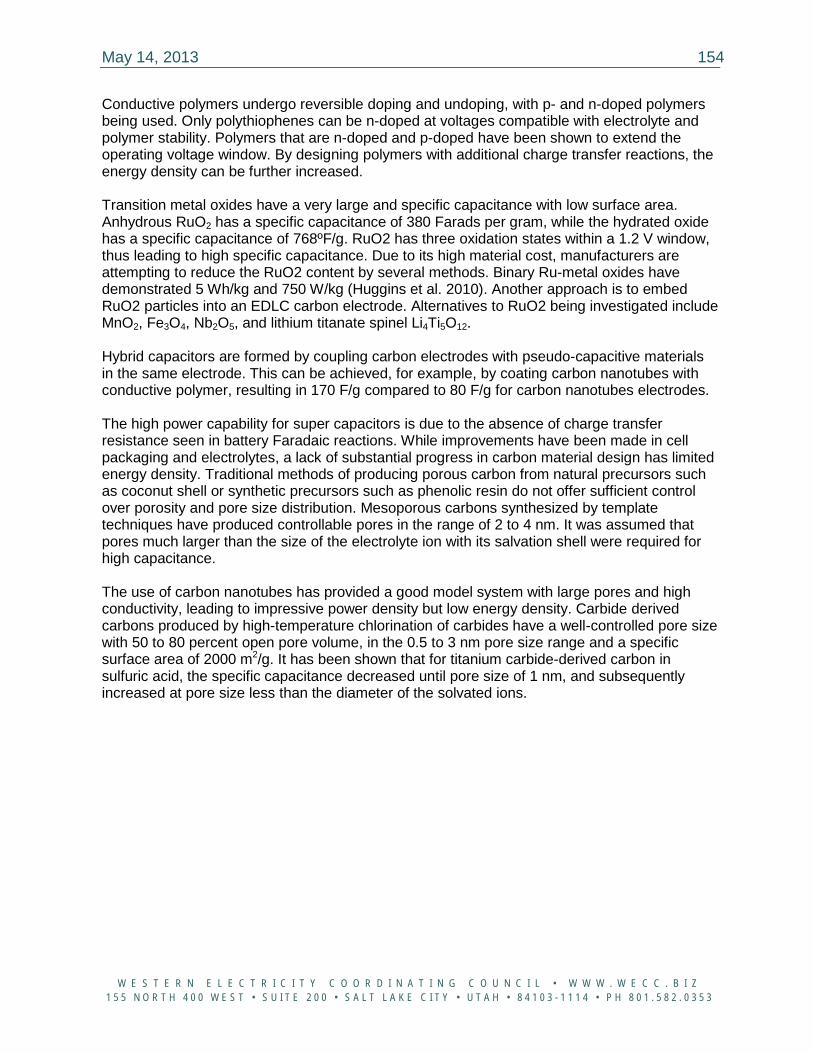
May 14, 2013 154
W E S T E R N E L E C T R I C I T Y C O O R D I N A T I N G C O U N C I L • W W W . W E C C . B I Z 1 5 5 N O R T H 4 0 0 W E S T • S U I T E 2 0 0 • S A L T L A K E C I T Y • U T A H • 8 4 1 0 3 - 1 1 1 4 • P H 8 0 1 . 5 8 2 . 0 3 5 3
Conductive polymers undergo reversible doping and undoping, with p- and n-doped polymers being used. Only polythiophenes can be n-doped at voltages compatible with electrolyte and polymer stability. Polymers that are n-doped and p-doped have been shown to extend the operating voltage window. By designing polymers with additional charge transfer reactions, the energy density can be further increased. Transition metal oxides have a very large and specific capacitance with low surface area. Anhydrous RuO2 has a specific capacitance of 380 Farads per gram, while the hydrated oxide has a specific capacitance of 768ºF/g. RuO2 has three oxidation states within a 1.2 V window, thus leading to high specific capacitance. Due to its high material cost, manufacturers are attempting to reduce the RuO2 content by several methods. Binary Ru-metal oxides have demonstrated 5 Wh/kg and 750 W/kg (Huggins et al. 2010). Another approach is to embed RuO2 particles into an EDLC carbon electrode. Alternatives to RuO2 being investigated include MnO2, Fe3O4, Nb2O5, and lithium titanate spinel Li4Ti5O12. Hybrid capacitors are formed by coupling carbon electrodes with pseudo-capacitive materials in the same electrode. This can be achieved, for example, by coating carbon nanotubes with conductive polymer, resulting in 170 F/g compared to 80 F/g for carbon nanotubes electrodes. The high power capability for super capacitors is due to the absence of charge transfer resistance seen in battery Faradaic reactions. While improvements have been made in cell packaging and electrolytes, a lack of substantial progress in carbon material design has limited energy density. Traditional methods of producing porous carbon from natural precursors such as coconut shell or synthetic precursors such as phenolic resin do not offer sufficient control over porosity and pore size distribution. Mesoporous carbons synthesized by template techniques have produced controllable pores in the range of 2 to 4 nm. It was assumed that pores much larger than the size of the electrolyte ion with its salvation shell were required for high capacitance. The use of carbon nanotubes has provided a good model system with large pores and high conductivity, leading to impressive power density but low energy density. Carbide derived carbons produced by high-temperature chlorination of carbides have a well-controlled pore size with 50 to 80 percent open pore volume, in the 0.5 to 3 nm pore size range and a specific surface area of 2000 m2/g. It has been shown that for titanium carbide-derived carbon in sulfuric acid, the specific capacitance decreased until pore size of 1 nm, and subsequently increased at pore size less than the diameter of the solvated ions.
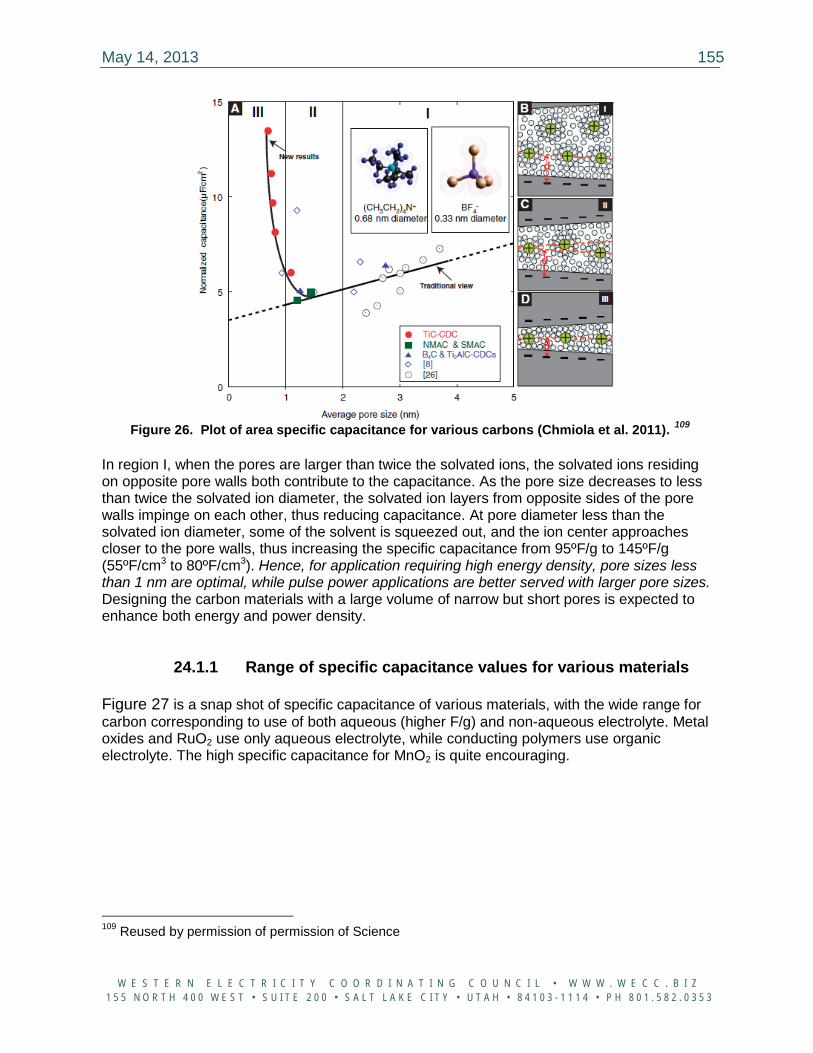
May 14, 2013 155
W E S T E R N E L E C T R I C I T Y C O O R D I N A T I N G C O U N C I L • W W W . W E C C . B I Z 1 5 5 N O R T H 4 0 0 W E S T • S U I T E 2 0 0 • S A L T L A K E C I T Y • U T A H • 8 4 1 0 3 - 1 1 1 4 • P H 8 0 1 . 5 8 2 . 0 3 5 3
Figure 26. Plot of area specific capacitance for various carbons (Chmiola et al. 2011). 109
In region I, when the pores are larger than twice the solvated ions, the solvated ions residing on opposite pore walls both contribute to the capacitance. As the pore size decreases to less than twice the solvated ion diameter, the solvated ion layers from opposite sides of the pore walls impinge on each other, thus reducing capacitance. At pore diameter less than the solvated ion diameter, some of the solvent is squeezed out, and the ion center approaches closer to the pore walls, thus increasing the specific capacitance from 95ºF/g to 145ºF/g (55ºF/cm3 to 80ºF/cm3). Hence, for application requiring high energy density, pore sizes less than 1 nm are optimal, while pulse power applications are better served with larger pore sizes. Designing the carbon materials with a large volume of narrow but short pores is expected to enhance both energy and power density.
24.1.1 Range of specific capacitance values for various materials
Figure 27 is a snap shot of specific capacitance of various materials, with the wide range for carbon corresponding to use of both aqueous (higher F/g) and non-aqueous electrolyte. Metal oxides and RuO2 use only aqueous electrolyte, while conducting polymers use organic electrolyte. The high specific capacitance for MnO2 is quite encouraging.
109 Reused by permission of permission of Science
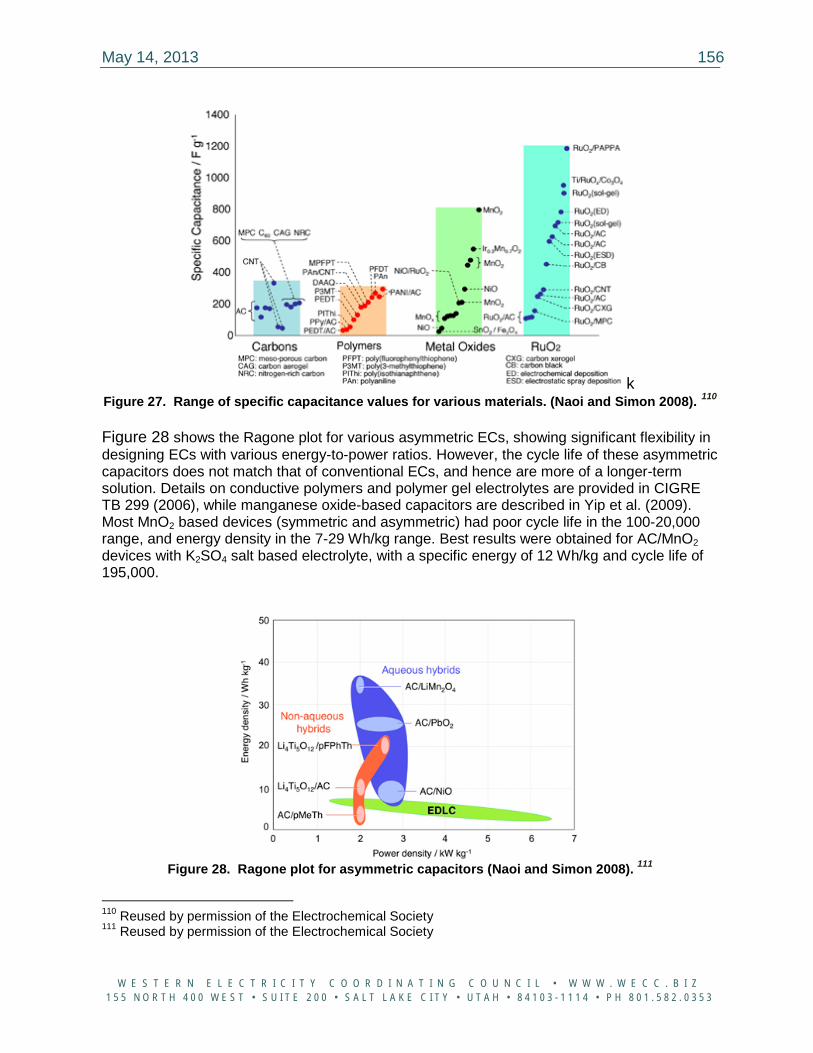
May 14, 2013 156
W E S T E R N E L E C T R I C I T Y C O O R D I N A T I N G C O U N C I L • W W W . W E C C . B I Z 1 5 5 N O R T H 4 0 0 W E S T • S U I T E 2 0 0 • S A L T L A K E C I T Y • U T A H • 8 4 1 0 3 - 1 1 1 4 • P H 8 0 1 . 5 8 2 . 0 3 5 3
k Figure 27. Range of specific capacitance values for various materials. (Naoi and Simon 2008). 110 Figure 28 shows the Ragone plot for various asymmetric ECs, showing significant flexibility in designing ECs with various energy-to-power ratios. However, the cycle life of these asymmetric capacitors does not match that of conventional ECs, and hence are more of a longer-term solution. Details on conductive polymers and polymer gel electrolytes are provided in CIGRE TB 299 (2006), while manganese oxide-based capacitors are described in Yip et al. (2009). Most MnO2 based devices (symmetric and asymmetric) had poor cycle life in the 100-20,000 range, and energy density in the 7-29 Wh/kg range. Best results were obtained for AC/MnO2 devices with K2SO4 salt based electrolyte, with a specific energy of 12 Wh/kg and cycle life of 195,000.
Figure 28. Ragone plot for asymmetric capacitors (Naoi and Simon 2008). 111
110 Reused by permission of the Electrochemical Society 111 Reused by permission of the Electrochemical Society
May 14, 2013 157
W E S T E R N E L E C T R I C I T Y C O O R D I N A T I N G C O U N C I L • W W W . W E C C . B I Z 1 5 5 N O R T H 4 0 0 W E S T • S U I T E 2 0 0 • S A L T L A K E C I T Y • U T A H • 8 4 1 0 3 - 1 1 1 4 • P H 8 0 1 . 5 8 2 . 0 3 5 3
Ioxus Inc. has launched a new family of large-cell prismatic electrochemical double-layer capacitors (EDLC) for transportation and utility applications.112 Their ultra capacitors are also used in wind applications for both pitch control and power conditioning (electronic shock absorber). Their superior life, faster response time, and lighter weight afford advantages over batteries, especially for pitch control where they are located in the rotating assembly. Various carbon types and their effects on performance were summarized by Kim et al. Use of nanocrystaline lithium titanates have also been investigated (Naoi 2010). Other types of Li-ion capacitors include activated carbon anode and LiFePO4 cathode (Bockenfeld et al. 2011). In these hybrids, the energy density is only 10 Wh/kg at 400 W/kg, much lower than that available from Li-ion batteries. This family of hybrid capacitors is still under development. It remains to be seen if they can offer higher energy density while providing comparable power density and cycle life as EDLCs. Otherwise, they will just be another low energy density battery with poorer cycle life and power capability compared to EDLCs. As seen above, the specific capacitance of a carbon is a function of how it is prepared and the electrolyte used. Typically, the area specific capacitance for carbon is 20 uF/cm2. Hence, for a carbon with BET surface area of 1500 m2/g, the maximum estimated capacitance is expected to be 300 Farads/g, much higher than the measured values. Part of the reason for this is BET surface area overestimates the area of the active pores and the specific capacitance could vary with pore size. Also, the specific capacitance decreases with increase in current density. Hence, it is important to know at what current/power density the specific capacitance values are reported. A comparison of various types of capacitors can be found in Burke 2007. The cost for EDLC is highly sensitive to carbon price. At a unit price of $10/kg, it is significantly more expensive than PbO2/C, whose cost was estimated by using a higher price of $4.5/kg compared to the $2-4/kg for lead-acid batteries. Hence the cost advantage of PbO2/C is self-evident. For unit price of $10/kg, the device price can be kept at 0.2 cents per Farad for 2.7 V/cell, which is lower than the 0.5 cents per Farad quoted as reasonable for carbon/carbon devices using acetonitrile as the electrolyte. It should be noted that the Ioxus capacitors were quoted at 5 cents/Farad for high volume 1000 F capacitor and 2.3 cents/Farad for high volume 3000 Farad capacitor113,114. The Maxwell 56 V/130 F modules cost $1000 for large quantities, corresponding to a unit cell 1.8 cents per Farad, and cost of $100/kW and $23500/kWh. . Their unit costs for 3000 F Ioxus capacitors are $90 and $70 for low and high volume respectively, corresponding to $30,000/kWh and $23,000/kWh, respectively.
112 http://www.eetimes.com/electronics-news/4198483/Ultracapacitors-with-increased-energy-and-power-density-seek-to-drive-high-power-applications?pageNumber=3 created 1/31/2010 and accessed January 11, 2012. 113 http://www.ioxus.com/ 114 http://www.eetimes.com/electronics-news/4198483/Ultracapacitors-with-increased-energy-and-power-density-seek-to-drive-high-power-applications?pageNumber=3 created 1/31/2010 and accessed January 11, 2012.
May 14, 2013 158
W E S T E R N E L E C T R I C I T Y C O O R D I N A T I N G C O U N C I L • W W W . W E C C . B I Z 1 5 5 N O R T H 4 0 0 W E S T • S U I T E 2 0 0 • S A L T L A K E C I T Y • U T A H • 8 4 1 0 3 - 1 1 1 4 • P H 8 0 1 . 5 8 2 . 0 3 5 3
23.2. Regenerative and conventional fuel cells
This section provides information on progress in regenerative fuel cells and deployment of fuel cells for various stationary applications.
23.2.1 Progress in regenerative fuel cells Work done at Lawrence Livermore National Laboratory (LLNL) in collaboration with the Hamilton Standard Division of United Technologies showed high current density of 1A/cm2 for polymer electrolyte membrane (PEM) based unitized regenerative fuel cells, but required 4 mg/cm2 precious metal catalyst.115 Burke (2003) described the developments through 2003 in this area, with some details provided on water management and balance of plant design to improve system energy density. The advantage of a system is reduction of hardware, reduction of balance of plant in terms of piping, valving and fluid handling systems, and lower parasitic loss by eliminating the need to keep two stacks at the desired operation temperature. The first URFC was tested by GE in 1972 for power management in a space satellite (Larruskain et al. 2005, Long 2008). LLNL and AeroVironment continued work in the nineties (CAISO 2009, Larruskain et al. 2005, Conway 1999 ), with a reversible system having a specific energy of 450 Wh/kg) CAISO 2009, Larruskain et al. 2005). LLNL and Hamilton Standard (a unit of United Technologies) investigated cars powered by URFCs (CAISO 2009). Commercially available modules have been developed by Proton Energy Systems (formerly Distributed Energy Systems) since 1998. Modules consuming 15-kW in electrolysis mode and producing up to 5 kW of electric power in fuel cell mode have been deployed in demonstration projects as decentralized power supply units (Kazaryan et al. 2006), in high-altitude planes (20-30 km) and also in naval air base in California (Balducci et al. 2005). Other organizations that have performed research in this area are Green Volt Power Corp (Simon and Burke 2008, Simon and Gogotski 2008), Lynntech Inc., NASA Glenn Research Center (Huggins 2011).
NASA supported R&D on RFCs for high-altitude long endurance (HALE) solar rechargeable aircraft (SRA) under its Environmental Research Aircraft and Sensors Technology (ERAST) program in the 90s. This effort was leveraged with the U.S. DOE to develop similar systems for transportation and stationary (utility) applications. URFCs with 40 percent round trip efficiency on a cell basis were developed, while H2/halogen URFCs had 80 percent efficiency. However, the latter were an order of magnitude heavier and also had corrosive acids. (Mitlitsky et al. 1998)
The latest development in this area is the development of bifunctional catalysts that can provide reasonable performance (Ranjbari et al. 2010, Zhang et al. 2010, Grigoriev 2010). As seen in Figure 29, the single cell efficiency is 50 percent at 500 mA/cm2 and about 44 percent at 1000 mA/cm2 for Pt supported on IrO2 and mixed with Pt black. Accounting for balance of plant operation, the round trip efficiency is expected to be about 45 percent and 40 percent, respectively, at these current densities provided the higher round-trip efficiency of 42.3 percent, with the Iridium layer next to the membrane. The anode loading was 1.5 mg/cm2 total Pt and Ir, while the cathode loading was 0.35 mg Pt/cm2 (Grigorier 2010). Other novel supports such as TiO2 doped with Nb are in the laboratory stage of investigation (Chen et al. 2002). The
115 https://www.llnl.gov/str/Mitlit.html
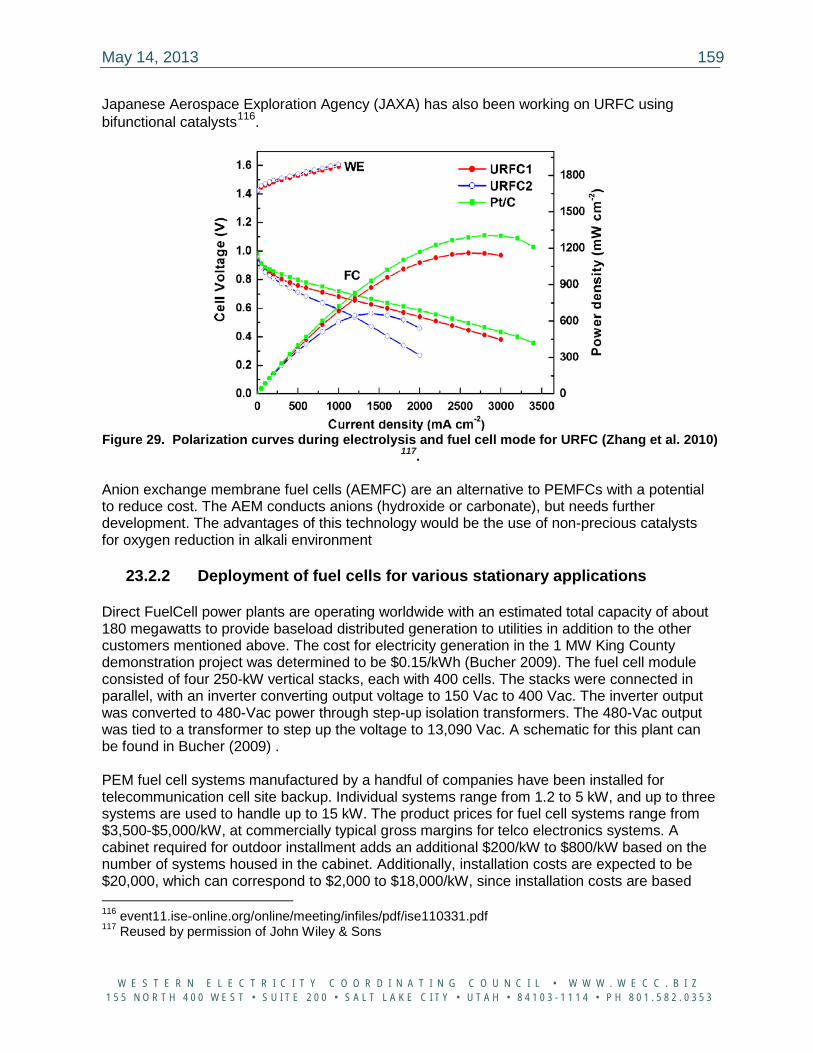
May 14, 2013 159
W E S T E R N E L E C T R I C I T Y C O O R D I N A T I N G C O U N C I L • W W W . W E C C . B I Z 1 5 5 N O R T H 4 0 0 W E S T • S U I T E 2 0 0 • S A L T L A K E C I T Y • U T A H • 8 4 1 0 3 - 1 1 1 4 • P H 8 0 1 . 5 8 2 . 0 3 5 3
Japanese Aerospace Exploration Agency (JAXA) has also been working on URFC using bifunctional catalysts116.
Figure 29. Polarization curves during electrolysis and fuel cell mode for URFC (Zhang et al. 2010)
117. Anion exchange membrane fuel cells (AEMFC) are an alternative to PEMFCs with a potential to reduce cost. The AEM conducts anions (hydroxide or carbonate), but needs further development. The advantages of this technology would be the use of non-precious catalysts for oxygen reduction in alkali environment
23.2.2 Deployment of fuel cells for various stationary applications Direct FuelCell power plants are operating worldwide with an estimated total capacity of about 180 megawatts to provide baseload distributed generation to utilities in addition to the other customers mentioned above. The cost for electricity generation in the 1 MW King County demonstration project was determined to be $0.15/kWh (Bucher 2009). The fuel cell module consisted of four 250-kW vertical stacks, each with 400 cells. The stacks were connected in parallel, with an inverter converting output voltage to 150 Vac to 400 Vac. The inverter output was converted to 480-Vac power through step-up isolation transformers. The 480-Vac output was tied to a transformer to step up the voltage to 13,090 Vac. A schematic for this plant can be found in Bucher (2009) . PEM fuel cell systems manufactured by a handful of companies have been installed for telecommunication cell site backup. Individual systems range from 1.2 to 5 kW, and up to three systems are used to handle up to 15 kW. The product prices for fuel cell systems range from $3,500-$5,000/kW, at commercially typical gross margins for telco electronics systems. A cabinet required for outdoor installment adds an additional $200/kW to $800/kW based on the number of systems housed in the cabinet. Additionally, installation costs are expected to be $20,000, which can correspond to $2,000 to $18,000/kW, since installation costs are based 116 event11.ise-online.org/online/meeting/infiles/pdf/ise110331.pdf 117 Reused by permission of John Wiley & Sons
May 14, 2013 160
W E S T E R N E L E C T R I C I T Y C O O R D I N A T I N G C O U N C I L • W W W . W E C C . B I Z 1 5 5 N O R T H 4 0 0 W E S T • S U I T E 2 0 0 • S A L T L A K E C I T Y • U T A H • 8 4 1 0 3 - 1 1 1 4 • P H 8 0 1 . 5 8 2 . 0 3 5 3
more on labor and square footage, and only slightly on power (due to current carrying capacity of cabling). Further cost reductions are driven primarily by increased demand for PEMFC, which will drive down electronics board costs with higher degree of automation. The MEA costs from suppliers have already been driven down by a factor of 2, and are beginning to approach asymptotic reductions on future cost reduction with current MEA technology. Due to capital costs on a per kilowatt basis, and the logistics and practicalities of using hydrogen, low-temperature, hydrogen fuel cells designed specifically for backup power do not scale well to megawatt-class applications, and therefore are not appropriate for megawatt-scale base-load generation. (Maxwell and Cohen 2011).118 NREL is the prime contractor for deployment of 1,000 fuel cell systems used in material handling, back-up, portable power, and stationary power.119 By December 2010, 557 systems were developed and 483 were in operation. The $40 million investment by the DOE through the ARRA program is expected to enable fuel cell market penetration. Plug Power has deployed more than 800 fuel cell systems worldwide. Its prime power systems used for backup power have produced 6.5 GWh of electricity and accumulated more than 2.5 million operating hours (Rohr 2011). The low-temperature GenSys 5-kW fuel cell system provides power where grid power is unreliable or does not exist. As part of an ARRA effort, Plug Power is installing its fuel cell systems in various U.S. Air Force Bases. Plug Power is also performing demonstrations of its high-temperature GenSys Blue 5-kW systems for CHP in residential and light commercial applications (Rohr 2011). The fleet has logged over 30,000 hours of stack operation producing over 50 MWh of electricity and 417 MWh of heat. The electrical efficiency was 30 percent while the overall efficiency was 85 percent. Stack life has doubled from an average of 1,500 hours to 3,800 hours based on long-term tests conducted in their laboratories. Ballard has signed a letter of intent to provide fuel cell modules (FCvelocityTM-HD6) for 25 clean energy hydrogen fuel cell buses in Sao Paulo, Brazil, with delivery planned for 2012 in preparation for the 2014 World Cup and 2016 Summer Olympic Games to be held in Brazil. Ballard has also announced an agreement to supply 21 modules to power buses in Europe. Ballard has also participated in other European fuel cell bus field tests, including the Clean Urban Transport for Europe (CUTE) and HyFKEET projects.120
23.3. High-temperature sodium beta batteries
This section presents some details on sodium batteries.
23.3.1 Sodium-sulfur batteries availability Denmark’s Amplex has an agreement with NGK to purchase all its batteries for the next five years. It plans to build the world’s largest energy storage system (1 GW) in the Silicon Border‘s Science Park. The site was chosen due to its proximity to the Baja California Power grid and
118 Telephone conversation with Mark Cohen of ReLion December 15, 2011 119 www.hydrogen.energy.gov/pdfs/progress11/xii_7_kurtz_2011.pdf 120http://www.globalenergywatch.com/news/3123/Ballard_Signs_LOI_To_Power_25_Clean_Energy_Hydrogen_Fuel_Cell_Buses_in_Sao_Paulo,_Brazil.htm created December 27, 2011, accessed Jan 6, 2012.

May 14, 2013 161
W E S T E R N E L E C T R I C I T Y C O O R D I N A T I N G C O U N C I L • W W W . W E C C . B I Z 1 5 5 N O R T H 4 0 0 W E S T • S U I T E 2 0 0 • S A L T L A K E C I T Y • U T A H • 8 4 1 0 3 - 1 1 1 4 • P H 8 0 1 . 5 8 2 . 0 3 5 3
the U.S. grid, including the new Sunrise Power Grid expansion. NGK is also required to locate some of its manufacturing at the site. The project is funded by Japan’s export/import bank.121 If this comes to fruition, there could be a potential shortage of Na-S in future. Five months later, the project appeared to proceed as planned, though there was no claim that the entire NGK capacity has been bought out. 122 On September 21, 2011, a fire occurred at the Tsukuba Plant of Mitsubishi, the batteries being owned by The Tokyo Electric Power Company (TEPKO). The cause of the fire has not yet been determined, with production halted until this is resolved. Customers have been requested not to use the batteries until the cause of the fire has been determined. It is not clear if Amplex has gone through with the agreement to purchase all of NGK’s batteries after this incident.
23.3.2 Sodium metal halide battery “The Zebra battery (whose name originates from the Zeolite Battery Research Africa Project) is an evolution of the NaS battery. Like the NaS battery, it has a molten sodium anode and a beta-alumina solid electrolyte, but the cathode is molten sodium chloraluminate impregnated in porous nickel chloride structures (NiCl2). Additionally, the mechanical design is somewhat different from that of the NaS battery, with the cathode in the center and the anode around it, separated by the electrolyte. The basic principle of operation is the same as for the NaS battery, i.e., sodium ions migrate from the anode to the cathode, resulting in surplus electrons at the anode, that in turn generate an electric current when they travel to the cathode outside the battery. At the cathode, sodium ions and electrons react with the nickel chloride (NiCl2) to form nickel (Ni) and sodium chloride (NaCl). Some of the corrosion problems with NaS batteries are mitigated by the Zebra design. However, until now, maturing technology has mainly been focused on special applications such as electric vehicles and submarines, where the energy density is of high concern. Future will show, if this technology is to be mature for electric utility applications.” (Makarov et al. 2008)
23.3.2.1 Cost estimate for ZEBRA battery The high specific energy makes it a good candidate for traction in electric buses, hybrid buses, and vans. The total material cost for a 38 Ah 2.85V cell was estimated at $2.77, corresponding to $28/kWh. About 60 percent of the cost is for nickel, while iron (powder + sheet) comprises 17 percent and the beta-alumina ceramic electrolyte 12.5 percent. Battery grade nickel powder is used in the electrode and nickel sheet for the current collector, with the usage being 25-50 percent per kWh compared to Ni-Cd and Ni-MH batteries. While the negative electrode is sodium, the cells are assembled in the discharged state using sodium chloride, which is very cheap at $0.3/kg. The battery case is a double-walled stainless steel box, the cooling system, and microporous foamed silica plates located between the inner and outer walls. For a 21 kWh battery, the estimated cost for the case is $9.4/kWh, with close to 50 percent corresponding to thermal insulation and 28 percent corresponding to the stainless steel case.
121 http://www.greentechmedia.com/articles/read/4-billion-1-gigawatt-energy-storage-warehouse/ Created October 13, 2010. 122 http://www.greentechmedia.com/articles/read/update-gigawatt-scale-energy-storage/.

May 14, 2013 162
W E S T E R N E L E C T R I C I T Y C O O R D I N A T I N G C O U N C I L • W W W . W E C C . B I Z 1 5 5 N O R T H 4 0 0 W E S T • S U I T E 2 0 0 • S A L T L A K E C I T Y • U T A H • 8 4 1 0 3 - 1 1 1 4 • P H 8 0 1 . 5 8 2 . 0 3 5 3
For the battery system, assuming energy costs for ceramic production is $1.7/kWh and cell material is 70 percent of total cell fabrication cost, and battery assembly cost equals case material cost, the total cost is $72.6/kWh for a 21 kWh system, assuming a fixed price of $250 for the battery controller. The manufacturing cost is also expected to be lowered in the near-term by improving BASE manufacturing techniques, with materials preparation by sol-gel chemistry, co-precipitation or spray-freeze/freeze drying. (U.S. Department of Energy 2010, Yang et al. 2010) For both NaS and sodium metal halide batteries, the high-temperature of operation may lead to degradation due to freeze-thaw cycles, thus necessitating thermal management, which adds to cost, lowers efficiency, and increases size. Use of anodes and cathodes with lower melting points and electrolytes with good conductivity at lower temperatures is expected to mitigate these issues. Loss of sodium liquid during discharge leads to lower interfacial area between anode and electrolyte, thus increasing effective current density and overvoltage. This can be circumvented by using wicking and also improving wettability of electrolyte with liquid sodium.
23.4. Summary of zinc-air battery development in the past. AER Energy Resources developed Zn-air primary batteries with 8-Ah capacity for camcorders and computers, with an energy of 25–50 Wh. Some of the improvements in performance were achieved by designing thin cathodes, hydrophobic membranes to prevent cathode flooding, and use of metal oxide catalyst at the high surface area cathode. For intermittent use application, approaches for preventing dry-out or flooding need to be developed. Optimization needs to be done between high oxygen transfer rate versus water loss/gain. There is also a trade-off between high electrolyte content (which would mitigate water loss effect) and specific energy. High electrolyte content can also contribute to flooding of the cathode. The following were electrically rechargeable, zinc-air battery developers around 10 years ago:
• AER Energy Sources, Inc. - Air management system • Alupower/EPRI - Continuous air, electrode fabrication process. Also makes Al/air
batteries for electric vehicles • Auburn University/EPRI - Fiber electrodes • Fuel Cell Technologies, Canada - Novel air electrode catalysts • MATSI- continuous dry powder air electrode process • Paul Scherrer Institute, Switzerland - Pasted metal foam zinc electrode, advanced
electrolyte • Westinghouse Corp- High-performance, robust, EV-sized air electrodes • Zinc Air Power Corp/DEMI - Advanced air management & treatment
Except AER, all of the above entities developed EV-sized batteries. The following were developers of mechanically-rechargeable Zinc-air batteries around 10 years ago:
• ChemTEK, Germany - Battery swap and spent Zn plate removal plus external recharge of Zn plates every cycle; new Zn plates and fresh electrolyte every 15 cycles
May 14, 2013 163
W E S T E R N E L E C T R I C I T Y C O O R D I N A T I N G C O U N C I L • W W W . W E C C . B I Z 1 5 5 N O R T H 4 0 0 W E S T • S U I T E 2 0 0 • S A L T L A K E C I T Y • U T A H • 8 4 1 0 3 - 1 1 1 4 • P H 8 0 1 . 5 8 2 . 0 3 5 3
• Electric Fuel Ltd., Israel - Battery swap, spent Zn plate and electrolyte removal every cycle; external recycle and regeneration of spent Zn plates; new Zn plates and fresh electrolyte every cycle
• Lawrence Livermore National Laboratory - Pumped electrolyte; self-feeding Zn pellets; Zn/zincate system; pellet refueling and electrolyte replacement every cycle
• Metallic Power, Inc. - Self-feeding Zn pellets; simple, fast refueling feature; external Zn pellet regeneration
• University of California, Berkeley - Stationary Zn bed; Zn/zincate system, electrolyte circulation by natural convection; external Zn regeneration.
23.5. N-Zn battery management
Measurement of heat evolved during C/3 rate discharge corresponded to an estimated temperature rise of 21C in a perfectly insulated cell (Cao et al. 2000). The solubility of ZnO in KOH at > 60o C is high. Hence it was suggested that during discharge at 40o C ambient temperature, the battery be allowed to rest intermittently to lower the temperature. The battery performed very well at the 6o C rate even at 0 deg C., giving about the same capacity as at the 1o C rate.
Adler et al. (1993) found that when the cell capacity decreased due to Zn electrode depletion, they could recondition it by a low-rate discharge, followed by a recharge. The cycle life was expected to be 600-1,000 cycles at 80 percent DOD, assuming successful execution of this protocol.
23.6. Li-Ion batteries
This section provides information on Li-Ion batteries.
23.6.1 Novel cathodes and anodes
Novel cathodes and anodes are being developed at various organizations. For example, cathodes using Germanium nanoparticles provide 1,730 mAh/g at the C/20 rate, 1,575 mAh/h at C/5 rate and stable performance for > 600 cycles (Wang et al. 2011). The capacity was a function of synthesis temperature, thus providing potential for further improvement. Nanostructured silicon anodes are being developed at Amprius, Nexeon, National Institute of Science & Technology (South Korea).123 The Amprius approach uses Si nanowires with a reinforcing metal core using an expensive CVD process. Nexeon used Si particles etched to create sub-micron pillars, which they claim to be cheaper. The National Institute of Science &
123 http://spectrum.ieee.org/consumer-electronics/portable-devices/nanostructured-silicon-key-to-better-batteries?utm_source=EV+Forums+Jan+2012+%28eng+copy%29&utm_campaign=EVF+02%2F06%2F2012&utm_medium=email created August 2011, accessed February 6, 2012.
May 14, 2013 164
W E S T E R N E L E C T R I C I T Y C O O R D I N A T I N G C O U N C I L • W W W . W E C C . B I Z 1 5 5 N O R T H 4 0 0 W E S T • S U I T E 2 0 0 • S A L T L A K E C I T Y • U T A H • 8 4 1 0 3 - 1 1 1 4 • P H 8 0 1 . 5 8 2 . 0 3 5 3
Technology South Korea (NIST-SK) has developed anodes by chemically etching tiny holes into micron-sized silicon particles. However, the walls between the pores are only 40 nm thick, leading to poor structural stability. Silicon nanotubes are also being developed in a collaboration among Stanford, NIST-SK, and LG Chem. PNNL uses commercial powder with a ball milling method to develop cost-effective silicon anodes.124
23.6.2 Umicore Li-Ion recycling process The battery recycling flow sheet is shown below in Figure 1. Critical interfaces controlled by CAO in Central and Eastern Europe (Myska 2009) (Tytgat et al. 2011). Graphical representation of the battery recycling flow sheet for Umicore can be found in Tytgat et al. (2011). The capacity of the smelter is 7,000 tons per year. The benefits of recycling are obvious in terms of the environment impact. It remains to be seen what the financial benefits are for the manufacturers, since this would depend on recycling costs and the cost to synthesize the battery electrode materials from the recycled metals. Umicore indicated the recycling costs depended on several variables such as materials being recycled, disassembly costs, and the tonnage being provided.125 The value returned to the end-of-life battery owner depends on the metal content and pricing, based on the contractual terms. Some of the recovered metals will enter a closed loop process for further treatment and synthesis into advanced cathode materials as part of Umicore’s rechargeable battery materials business. It should be noted that Umicore is the world’s second largest cathode material manufacturer with a new production facility in Kobe, Japan in addition to its Korean facility.
23.7. Flow Batteries
The section discusses flow batteries.
23.7.1 Vanadium redox flow battery capital and O&M costs
A wide range of costs has been reported for redox flow batteries, with unit costs varying based on the power-to-energy ratio (Gyuk and Eckroad 2003, Eckroad 2007, Corey et al. 2002). A comprehensive review of the vanadium-redox flow battery systems deployment and cost analysis was recently published (Kear et al. 2011).
The stack cost is mainly governed by separator costs, which currently are in the $500 to $800/m2 range. It is expected that in the next 10 years, the separator costs would drop to $200/m2. Carbon felt electrode development with various forms of heat and chemical treatment was expected to enhance performance (Yang et al. 2011). The energy costs are mainly dependent on vanadium pentoxide (V2O5) costs, which peaked in 2005 at $27/lb, and have stabilized at $10/lb. With recycling of V2O5, V2O5 costs are expected to contribute less in the future. The electrolyte is expected to be very stable, thus enabling reuse in future. 124 Email from Jason Zhang of PNNL received February 6, 2012. 125 Email dated January 31, 2012 from G. V. Damme of Umicore Battery Recycling.
May 14, 2013 165
W E S T E R N E L E C T R I C I T Y C O O R D I N A T I N G C O U N C I L • W W W . W E C C . B I Z 1 5 5 N O R T H 4 0 0 W E S T • S U I T E 2 0 0 • S A L T L A K E C I T Y • U T A H • 8 4 1 0 3 - 1 1 1 4 • P H 8 0 1 . 5 8 2 . 0 3 5 3
23.7.2 RedFlow Zn Bromine battery system
The RedFlow system has been tested by the Research Institute for Sustainable Energy (RISE), Murdoch University (Corey 2010). The cells were stable through 300 cycles and are expected to last 1,500 cycles. This indicates that this chemistry may not be appropriate for high cycle applications. The battery delivered 5 kW as designed, and 9.4 kWh when charged to 200 Ah, and 7.1 kWh when charged to 150 Ah. The battery manufacture is mainly an advanced plastics manufacture and assembly process, with several components outsourced. The following figure shows the battery module and individual stack components, indicative of the plastics-intensive process. Bi-direction transport of data to and from the battery system deployed in the field is possible. Graphical representation of RedFlow ZBM module, electrode and separator stack components can be found in Corey (2010).
May 14, 2013 166
W E S T E R N E L E C T R I C I T Y C O O R D I N A T I N G C O U N C I L • W W W . W E C C . B I Z 1 5 5 N O R T H 4 0 0 W E S T • S U I T E 2 0 0 • S A L T L A K E C I T Y • U T A H • 8 4 1 0 3 - 1 1 1 4 • P H 8 0 1 . 5 8 2 . 0 3 5 3
23.7.3 ZBB Zn Bromine battery systems
In New York, in conjunction with NYSERDA, a 50-kW PV system has been installed in parallel with a 50-kW/100-kWh ZBB battery system. The objective is to charge the battery with excess PV capacity that would otherwise be spilled. This stored energy is discharged during peak hours. A 250-kW/500-kWh system has been installed on a remote utility in New South Wales. The system complements a 20-kW PV concentrator system, supports the remote line and improves reliability. The battery is charged by the solar array during the day and provides power at night to remote areas.
Around 2005, details were provided for the demonstration of a 2-MWh Z-BESS peak-shaving system (ZE Corporation ,Lex 2005). The project was funded by the California Energy Commission (CEC). The objective was to demonstrate a 500-kWh unit and a 2-MWh system at the PG&E utility distribution substation, which experiences overload peaks of 1-to-1.5 MW during the summer months. The 50-kW peak power, 50-kWh module weighs 3,000 lbs, for a specific energy of 37 Wh/kg and a footprint of 12.8 ft2. Norris et al. (2004) described the use of ZBB batteries for wind farm stabilization and load shifting. A technical and economic feasibility analysis was done for a planned 20-MW wind farm project. The grid operator imposed a requirement that the wind farm’s instantaneous power fluctuations should not exceed +/- 1 MW. The BESS gets charged during power surges and discharged during sags. The BESS can also be dispatched by the utility during peak loads, providing the utility with dependable capacity or supporting wind turbine auxiliary loads during low wind conditions. A BESS design was developed using 50-kWh ZBB modules and Xantrax bi-directional power converters. An economic analysis was done taking into account capital costs, operating costs, and performance characteristics. A table that provides information on the ZBB BESS capital and commissioning costs can be found in Norris et al. (2004). The BESS performance and cost/benefit results and the overall economic results can also be found in Norris et al. (2004). The estimated after tax internal rate of return for this project was 21.6 percent. The main benefit of the BESS was the avoidance of energy spillage to meet grid operator power fluctuation limits. The benefit of providing power to auxiliary loads during non-wind conditions is secondary. Additional benefits may also be obtained by providing ancillary services. The Graphical representation of a 25-kW/50-kWh module ZBB module and fully-loaded 500-kWh ZBB Zn-Br transportable battery can be found in ZE Corporation (2005).
23.8. Xtreme Power demonstration projects
Hawaii has selected its 1.5-MW system for its 3-MW PV farm in Kaua’i Island. This system is utility owned and; hence, can be used to support the grid, overriding the PV-related needs. A 1.2-MW solar farm in Lana’i Hawaii also uses a 1.125-MW/0.5-MWh Xtreme power system. Since this system is not utility owned, grid-related needs do not have priority. Xcel Solar has procured a 1-MW/1-MWh Dynamic Power Resources (DPR) system for testing the DPR performance for ramp control, firming and shaping, and ancillary services. Xtreme Power’s DPR large-scale energy storage and power systems is being used to provide 15 MW of rated power at First Wind’s 30-MW Kahuku Wind project on Hawaii’s Oahu island
May 14, 2013 167
W E S T E R N E L E C T R I C I T Y C O O R D I N A T I N G C O U N C I L • W W W . W E C C . B I Z 1 5 5 N O R T H 4 0 0 W E S T • S U I T E 2 0 0 • S A L T L A K E C I T Y • U T A H • 8 4 1 0 3 - 1 1 1 4 • P H 8 0 1 . 5 8 2 . 0 3 5 3
Ford has procured a 0.75-MW/2-MWh DPR system in order fully use the power generated by 500 kW of solar installed at its Detroit plant. The DPR is also used to absorb energy from regenerative breaking and uses that to power the South Pole Telescope across a 20-foot track. Tres Amigas LLC, a merchant transmission company, has selected its DPR for delivery of renewable energy to the Tres Amigas superstation by storing and releasing power in response to variations in demand and supply. This superstation will provide the first common interconnection of America’s three power grids. Since only a very small fraction (<< 1%) of electricity generated in the US can be transferred between grids, and since Texas and the Western grids are not connected directly, several transmission companies have submitted letters of intent to connect to Tres Amigas. The Superstation will more than double the electricity transferred between the major grids, providing 5 GW of capacity, with a goal of 30 GW. This is expected to benefit the existing transmission infrastructure in each of the inter-connected grids. The Xtreme Power DPR systems will ensure reliable flow of power, controlling and smoothing the variations for the gigawatts of power delivered via the Superstation to the Eastern, Western, and Texas Interconnections. The DPR also provides back-up power to each grid (Harris 2010).
23.9. Flywheels For the Beacon 20-MW/5-MWh flywheels, based on testing of the 100-kW modules on California Independent System Operator (CAISO) and New York Independent System Operator (NYISO) grids, the total losses were 7.09 percent per year, with 7 percent corresponding to efficiency losses, and 0.09 percent to standby losses. For their 100-kW/25-kWh module, all of the energy is usable because it is oversized to 40 kWh.126 The efficiency of the Beacon flywheels system is 98 percent, with additional 13 percent losses from the PCS. The Tribology Systems Inc. (TSI) flywheel has efficiency in the 95-to-97 percent range because of low losses associated with the ceramic bearings. The roundtrip efficiency of the Velkess Flywheels kW-sized systems is 85 percent (Gray 2009), while the efficiency for MW-sized systems was estimated to be 90-95 percent. 127 The ramp rate for the Velkess flywheels is twice the rated power in less than a second using 250-kWh modules.105 Most flywheels are oversized because operating at 100 percent DOD is not practical because of low efficiencies at low speeds. One unique feature of the TSI system is that over-sizing is not necessary because the flywheel can be discharged down to low speeds without loss of efficiency.128 Beacon Power signed a $2 M contract with New York Energy Research and Development Agency (NYSERDA) for partial funding of its 20-MW/5-MWh frequency regulation plant in Stephentown, New York.129 The plant is expected to consist of 200 Smart Energy 25 flywheels (100 kW/25 kWh). The flywheel is a turnkey system, with a DC-DC converter stepping the voltage to 480 V DC, followed by a bi-directional inverter and a transformer for conversion to 126 Telephone conversation with M. Lazarewicz on September 12, 2011. 127 Telephone conversation with Bill Gray of Velkess, Inc on September 27, 2011 128 Email received from Lew Sibley of TSI on October 27, 2011. 129 http://investors.beaconpower.com/releasedetail.cfm?ReleaseID=560549, accessed December 1, 2011
May 14, 2013 168
W E S T E R N E L E C T R I C I T Y C O O R D I N A T I N G C O U N C I L • W W W . W E C C . B I Z 1 5 5 N O R T H 4 0 0 W E S T • S U I T E 2 0 0 • S A L T L A K E C I T Y • U T A H • 8 4 1 0 3 - 1 1 1 4 • P H 8 0 1 . 5 8 2 . 0 3 5 3
115-kV AC. The total estimated cost was $25 M, out of which $5 M was estimated to be installation cost.104 This corresponds to $1,000/kW for the system excluding installation costs. This was a significant increase from the estimated $10-to-12 million reported earlier (Rounds and Peek 2008). The estimated cost for a 250-kWh TSI Flywheels system was $200/kWh, and for a 1-MWh system was $165/kWh, with the cost inclusive of the motor/generator cost for charging and discharging the flywheel. These estimates were based on current carbon fiber prices and are mainly sensitive to the energy content of the system because of the > 1-h charge discharge periods (Rounds and Peek 2008). The Velkess flywheels have a flexible rotor and a passive magnet, with lower associated construction cost. For megawatt/megawatt-hour-sized system, the costs were estimated to be $200/kW and $100/kWh.105
23.10. CAES performance and life
The energy and power components for CAES are separate. The CAES system has a startup time during compression to full load of less than five minutes while the corresponding start up time in the power generation mode is less than 10 minutes.130 This affects the sizing of the energy storage system because a battery needs to be used during the change-over period. Additionally, if CAES is used as load at night, and as a generator during the day, it needs to be oversized to accommodate this.
The cycle life, while not known, is expected to be more than 10,000 cycles based on the 20-to-30-year life at the Huntorf and McIntosh plants and the 5,000+ combined starts for generation and compression at the McIntosh plant (Hoffman et al. 2008). A wide range of efficiency (48-90 percent) for CAES has been quoted in the literature using different definitions (Succar and Williams 2008, Drury et al. 2011, Macchi and Lozza 1987).107 The efficiency is in the 77-89 percent range if it is defined as the ratio of electricity generated to the sum of the electricity input to the compressor. The electricity that could have been generated by natural gas in a combustion turbine, while it is ~ 66 percent for a ratio of output electricity adjusted by subtracting the electricity that could have been generated by natural gas in a combustion turbine to the electricity input to the compressor (Succar and Williams 2008). It is anticipated that efficiency as high as 0.7 can be obtained for adiabatic/isothermal CAES (Drury et al. 2011), but the technology is not yet mature. A summary of novel concepts for the next generation CAES plants was described by Nakhamkin et al. (2009).
The ramp rates for CAES were reported in the range of between 17 and 40 percent rated power/minute (Ridge Energy Storage and Grid Services 2005, Succar and Williams 2008, Nakhamkin et al. 2010, Gyuk and Eckroad 2003).
23.10.1 CAES capital and O&M cost
For CAES systems, the capital costs are provided in $/kW. For most systems, the BOP and PCS costs are also included. Some of the main suppliers of combustion turbines are GE, Siemens, and Westinghouse; while compressors are supplied by MAN Turbo, Dresser-Rand, Mitsubishi Hitachi, Rolls-Royce, and Ingersoll Rand (Nakhamkin 2008). The cost for the current 130 E-mail message from H Miller to Vilayanur Viswanathan October 4, 2011.
May 14, 2013 169
W E S T E R N E L E C T R I C I T Y C O O R D I N A T I N G C O U N C I L • W W W . W E C C . B I Z 1 5 5 N O R T H 4 0 0 W E S T • S U I T E 2 0 0 • S A L T L A K E C I T Y • U T A H • 8 4 1 0 3 - 1 1 1 4 • P H 8 0 1 . 5 8 2 . 0 3 5 3
generation 110-MW CAES plant was estimated to be $1,250/kW. Second-generation systems are estimated to be $750/kW, while systems based on advanced concepts were estimated to be in the $500-560/kW range (Nakhamkin et al. 2010, Daniel 2008). The capital cost was quoted at $1,200/kW for the recently cancelled Iowa project.131
Table 5 summarizes the CAES capital costs from the literature. The power-related capital costs for CAES are in the range $500-to-1,750/kW, while the energy-related costs are ~ $3/kWh for salt dome storage. The energy-related costs varies with storage type, with porous rock storage and surface storage costs higher by more than an order of magnitude.
131 Email to Vilayanur Viswanathan from A. Cavallo dated September 16, 2011.
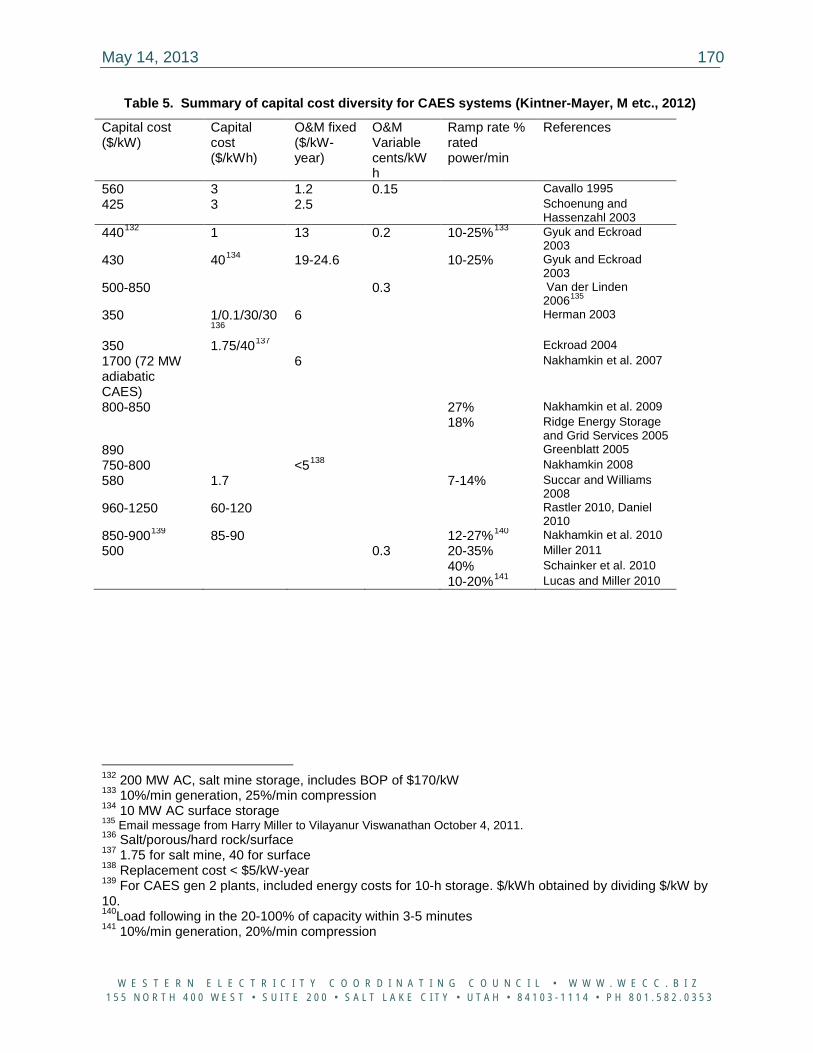
May 14, 2013 170
W E S T E R N E L E C T R I C I T Y C O O R D I N A T I N G C O U N C I L • W W W . W E C C . B I Z 1 5 5 N O R T H 4 0 0 W E S T • S U I T E 2 0 0 • S A L T L A K E C I T Y • U T A H • 8 4 1 0 3 - 1 1 1 4 • P H 8 0 1 . 5 8 2 . 0 3 5 3
Table 5. Summary of capital cost diversity for CAES systems (Kintner-Mayer, M etc., 2012)
Capital cost ($/kW)
Capital cost ($/kWh)
O&M fixed ($/kW-year)
O&M Variable cents/kWh
Ramp rate % rated power/min
References
560 3 1.2 0.15 Cavallo 1995 425 3 2.5 Schoenung and
Hassenzahl 2003 440132 1 13 0.2 10-25%133 Gyuk and Eckroad
2003 430 40134 19-24.6 10-25% Gyuk and Eckroad
2003 500-850 0.3 Van der Linden
2006135 350 1/0.1/30/30
136 6 Herman 2003
350 1.75/40137 Eckroad 2004 1700 (72 MW adiabatic CAES)
6 Nakhamkin et al. 2007
800-850 27% Nakhamkin et al. 2009 18% Ridge Energy Storage
and Grid Services 2005 890 Greenblatt 2005 750-800 <5138 Nakhamkin 2008 580 1.7 7-14% Succar and Williams
2008 960-1250 60-120 Rastler 2010, Daniel
2010 850-900139 85-90 12-27%140 Nakhamkin et al. 2010 500 0.3 20-35% Miller 2011 40% Schainker et al. 2010 10-20%141 Lucas and Miller 2010
132 200 MW AC, salt mine storage, includes BOP of $170/kW 133 10%/min generation, 25%/min compression 134 10 MW AC surface storage 135 Email message from Harry Miller to Vilayanur Viswanathan October 4, 2011. 136 Salt/porous/hard rock/surface 137 1.75 for salt mine, 40 for surface 138 Replacement cost < $5/kW-year 139 For CAES gen 2 plants, included energy costs for 10-h storage. $/kWh obtained by dividing $/kW by 10. 140Load following in the 20-100% of capacity within 3-5 minutes 141 10%/min generation, 20%/min compression
May 14, 2013 171
W E S T E R N E L E C T R I C I T Y C O O R D I N A T I N G C O U N C I L • W W W . W E C C . B I Z 1 5 5 N O R T H 4 0 0 W E S T • S U I T E 2 0 0 • S A L T L A K E C I T Y • U T A H • 8 4 1 0 3 - 1 1 1 4 • P H 8 0 1 . 5 8 2 . 0 3 5 3
APPENDIX 24
Additional Information on Demand Response
May 14, 2013 172
W E S T E R N E L E C T R I C I T Y C O O R D I N A T I N G C O U N C I L • W W W . W E C C . B I Z 1 5 5 N O R T H 4 0 0 W E S T • S U I T E 2 0 0 • S A L T L A K E C I T Y • U T A H • 8 4 1 0 3 - 1 1 1 4 • P H 8 0 1 . 5 8 2 . 0 3 5 3
Appendix 24: Additional Information on Demand Response “A wide range of studies are available on DR approaches, technologies, barriers, and markets. The studies, however, do not often focus on demand response as a reliability resource because this is a recent development for this field. As provided by Section 529 of the Energy Independence and Security Act of 2007, the Federal Energy Regulatory Commission is charged with preparing an Assessment of DR, a National Action Plan for DR, and a joint FERC-DOE Implementation Proposal. FERC completed the Assessment of DR in June 2009, including providing a national estimate of the technical potential for DR in 5- and 10-year horizons according to four scenarios. Under the full participation scenario, the most aggressive scenario, which assumes national deployment of advanced metering infrastructure and dynamic pricing, the FERC assessment finds the DR potential to be 188 GW by 2019. Under the business-as-usual scenario, the FERC assessment estimates 37 GW of DR would be achieved by 2019” (FERC 2009). FERC submitted its draft National Action Plan on DR for public comment in March 2010. The draft report outlines three categories of strategies and actions to advance DR: Communications Programs, Assistance to States, Tools and Materials (FERC 2010a). The last category refers to tools for incorporating DR in dispatch, ancillary services, transmission, and resource planning. FERC finds that there is a need for new tools and methods to more directly incorporate DR into dispatch algorithms and resource planning models. Subsequently, the action plan contemplates the development of tools to enable DR resources to provide reliability and ancillary services in the electricity markets (FERC 2010a). Furthermore, FERC issued a Notice of Proposed Rulemaking on March 18, 2010, seeking comment on requiring organized wholesale energy markets (RTOs and ISOs) to pay demand response providers the market price for energy, whether regional differences among markets justify the wide range of prices available to DR resources (FERC 2010b). Recognizing that DR is an important component in the portfolio of resources required to reliably meet increasing demands for electricity, NERC created the DR Data Task Force in December 2007. To keep up with the growing penetration of DR resources and the power sector’s growing reliance on these resources, NERC established a plan to enhance its data collection and reliability assessment process to highlight emerging programs and demand-side service offerings, which can impact bulk power system reliability (NERC 2009). The DR availability data system (DADS) Phase I and II report (NERC 2011 ) was issued by NERC in September 2009. The report lays out the process for moving forward with a data collection effort on demand response under DADS. DADS will be deployed in two phases. Phase I establishes a voluntary DR reporting system as a pilot program. Phase II is a mandatory data collection system for all electricity operators with dispatchable DR resources. The findings of the DADS project and the impact on reliability as measured by NERC’s analysis of the data will provide important information with respect to the ability of DR to provide additional reliability and ancillary services. In Order No. 719, FERC established a number of requirements for RTOs and ISOs, with the expressed goal of eliminating barriers to demand response participation in organized energy markets by treating DR resources comparably to other resources. Among other requirements, Order No. 719 provided that: “All RTOs and ISOs must incorporate new parameters into their ancillary services bidding rules that allow demand response resources to specify a maximum duration in hours that the demand response resource may be dispatched, a maximum number of times that the demand response
May 14, 2013 173
W E S T E R N E L E C T R I C I T Y C O O R D I N A T I N G C O U N C I L • W W W . W E C C . B I Z 1 5 5 N O R T H 4 0 0 W E S T • S U I T E 2 0 0 • S A L T L A K E C I T Y • U T A H • 8 4 1 0 3 - 1 1 1 4 • P H 8 0 1 . 5 8 2 . 0 3 5 3
resource may be dispatched during a day, and a maximum amount of electric energy reduction that the demand response resource may be required to provide either daily or weekly.” (FERC 2010b) The CAISO issued a report on April 28, 2009, DR Barriers Study (per FERC Order 719), which includes an analysis of market and regulatory barriers to DR. The CAISO included the DR Barriers Study as part of its compliance filing under Order 719. The report finds that DR resources cannot provide the full range of ancillary services as required under FERC Order 719. The CAISO allows DR resources to participate in competitive ancillary service markets to the extent they are able to comply with technical requirements; for example, as non-spinning reserves. Furthermore, although not defined as an ancillary service, DR resources may bid resources into the market for imbalance services. However, the technical requirements of the CAISO tariff, which reflect the WECC Operating Standards, limit the participation of DR resources for regulation and spinning reserves. WECC Standards requiring generation-based ancillary services preclude DR resources from participating in spinning reserve markets. The study on demand response barriers finds that the California market has a fairly robust and expanding portfolio of regulatory-driven DR programs that are a mix of price- and reliability-based designs. However, there are barriers for DR resources to become part of ancillary services markets, which may limit their use to provide flexibility. (NERC 210)
May 14, 2013 174
W E S T E R N E L E C T R I C I T Y C O O R D I N A T I N G C O U N C I L • W W W . W E C C . B I Z 1 5 5 N O R T H 4 0 0 W E S T • S U I T E 2 0 0 • S A L T L A K E C I T Y • U T A H • 8 4 1 0 3 - 1 1 1 4 • P H 8 0 1 . 5 8 2 . 0 3 5 3
APPENDIX 25
Various BA Consolidation Options
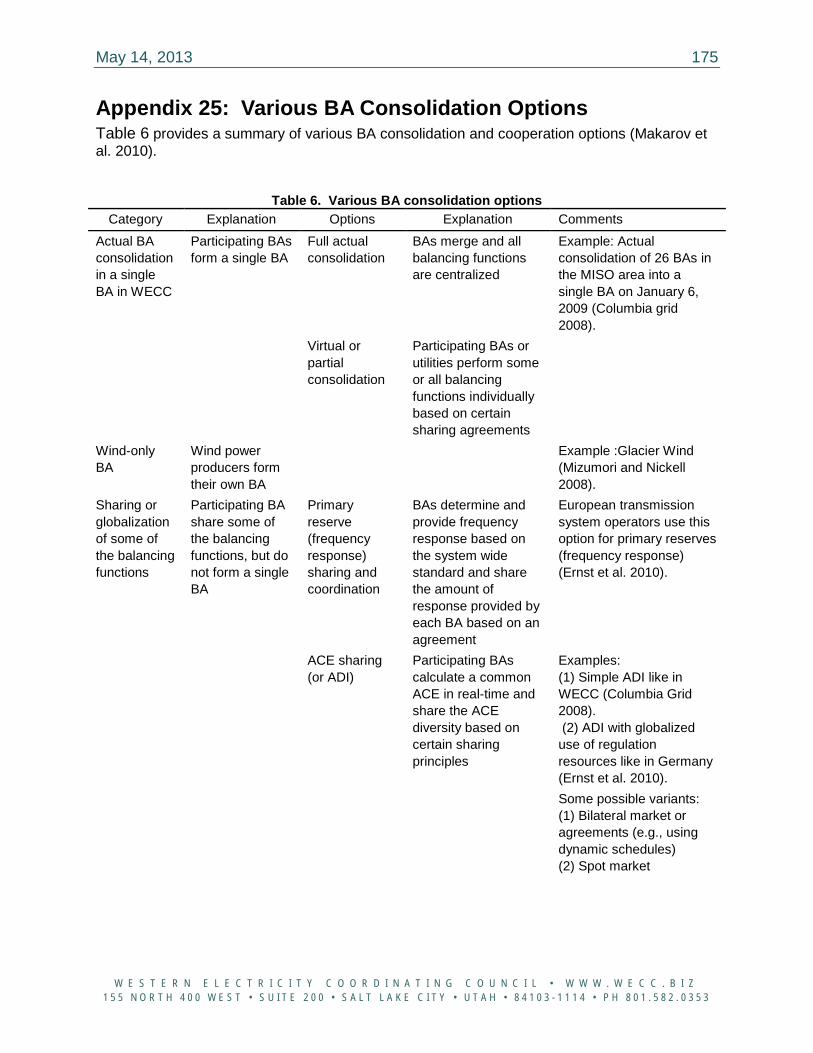
May 14, 2013 175
W E S T E R N E L E C T R I C I T Y C O O R D I N A T I N G C O U N C I L • W W W . W E C C . B I Z 1 5 5 N O R T H 4 0 0 W E S T • S U I T E 2 0 0 • S A L T L A K E C I T Y • U T A H • 8 4 1 0 3 - 1 1 1 4 • P H 8 0 1 . 5 8 2 . 0 3 5 3
Appendix 25: Various BA Consolidation Options Table 6 provides a summary of various BA consolidation and cooperation options (Makarov et al. 2010).
Table 6. Various BA consolidation options Category Explanation Options Explanation Comments
Actual BA consolidation in a single BA in WECC
Participating BAs form a single BA
Full actual consolidation
BAs merge and all balancing functions are centralized
Example: Actual consolidation of 26 BAs in the MISO area into a single BA on January 6, 2009 (Columbia grid 2008).
Virtual or partial consolidation
Participating BAs or utilities perform some or all balancing functions individually based on certain sharing agreements
Wind-only BA
Wind power producers form their own BA
Example :Glacier Wind (Mizumori and Nickell 2008).
Sharing or globalization of some of the balancing functions
Participating BA share some of the balancing functions, but do not form a single BA
Primary reserve (frequency response) sharing and coordination
BAs determine and provide frequency response based on the system wide standard and share the amount of response provided by each BA based on an agreement
European transmission system operators use this option for primary reserves (frequency response) (Ernst et al. 2010).
ACE sharing (or ADI)
Participating BAs calculate a common ACE in real-time and share the ACE diversity based on certain sharing principles
Examples: (1) Simple ADI like in WECC (Columbia Grid 2008). (2) ADI with globalized use of regulation resources like in Germany (Ernst et al. 2010).
Some possible variants: (1) Bilateral market or agreements (e.g., using dynamic schedules) (2) Spot market
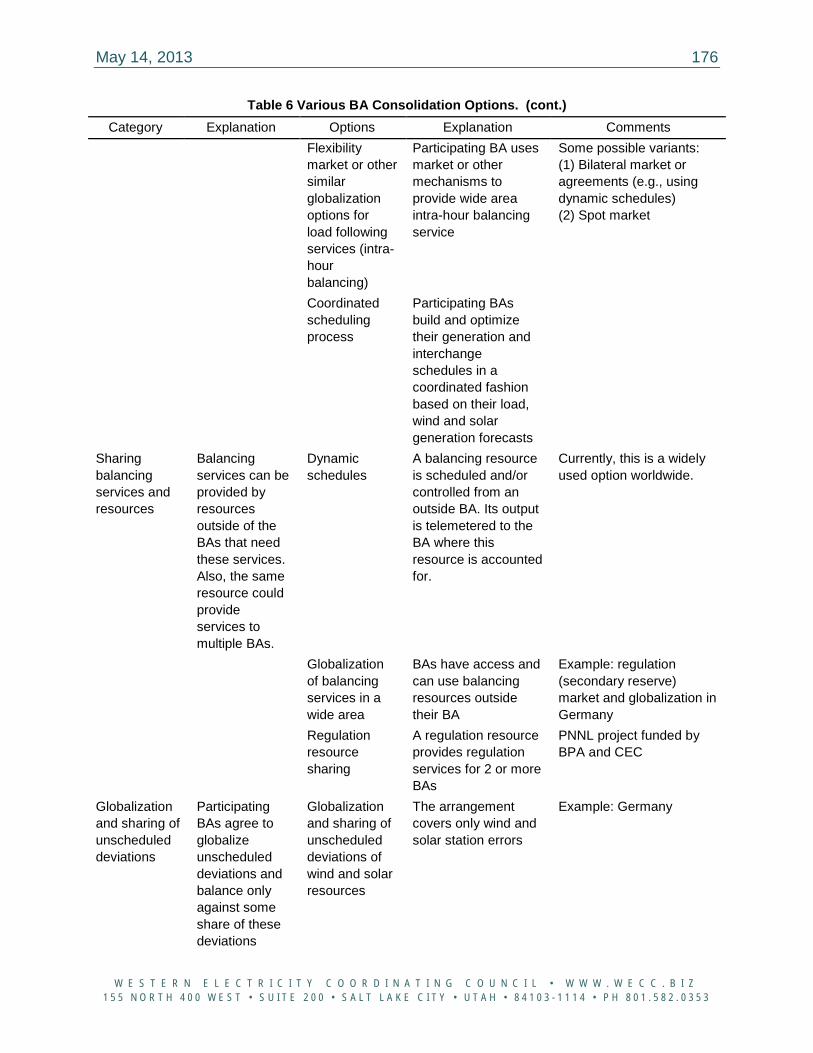
May 14, 2013 176
W E S T E R N E L E C T R I C I T Y C O O R D I N A T I N G C O U N C I L • W W W . W E C C . B I Z 1 5 5 N O R T H 4 0 0 W E S T • S U I T E 2 0 0 • S A L T L A K E C I T Y • U T A H • 8 4 1 0 3 - 1 1 1 4 • P H 8 0 1 . 5 8 2 . 0 3 5 3
Table 6 Various BA Consolidation Options. (cont.) Category Explanation Options Explanation Comments
Flexibility market or other similar globalization options for load following services (intra-hour balancing)
Participating BA uses market or other mechanisms to provide wide area intra-hour balancing service
Some possible variants: (1) Bilateral market or agreements (e.g., using dynamic schedules) (2) Spot market
Coordinated scheduling process
Participating BAs build and optimize their generation and interchange schedules in a coordinated fashion based on their load, wind and solar generation forecasts
Sharing balancing services and resources
Balancing services can be provided by resources outside of the BAs that need these services. Also, the same resource could provide services to multiple BAs.
Dynamic schedules
A balancing resource is scheduled and/or controlled from an outside BA. Its output is telemetered to the BA where this resource is accounted for.
Currently, this is a widely used option worldwide.
Globalization of balancing services in a wide area
BAs have access and can use balancing resources outside their BA
Example: regulation (secondary reserve) market and globalization in Germany
Regulation resource sharing
A regulation resource provides regulation services for 2 or more BAs
PNNL project funded by BPA and CEC
Globalization and sharing of unscheduled deviations
Participating BAs agree to globalize unscheduled deviations and balance only against some share of these deviations
Globalization and sharing of unscheduled deviations of wind and solar resources
The arrangement covers only wind and solar station errors
Example: Germany
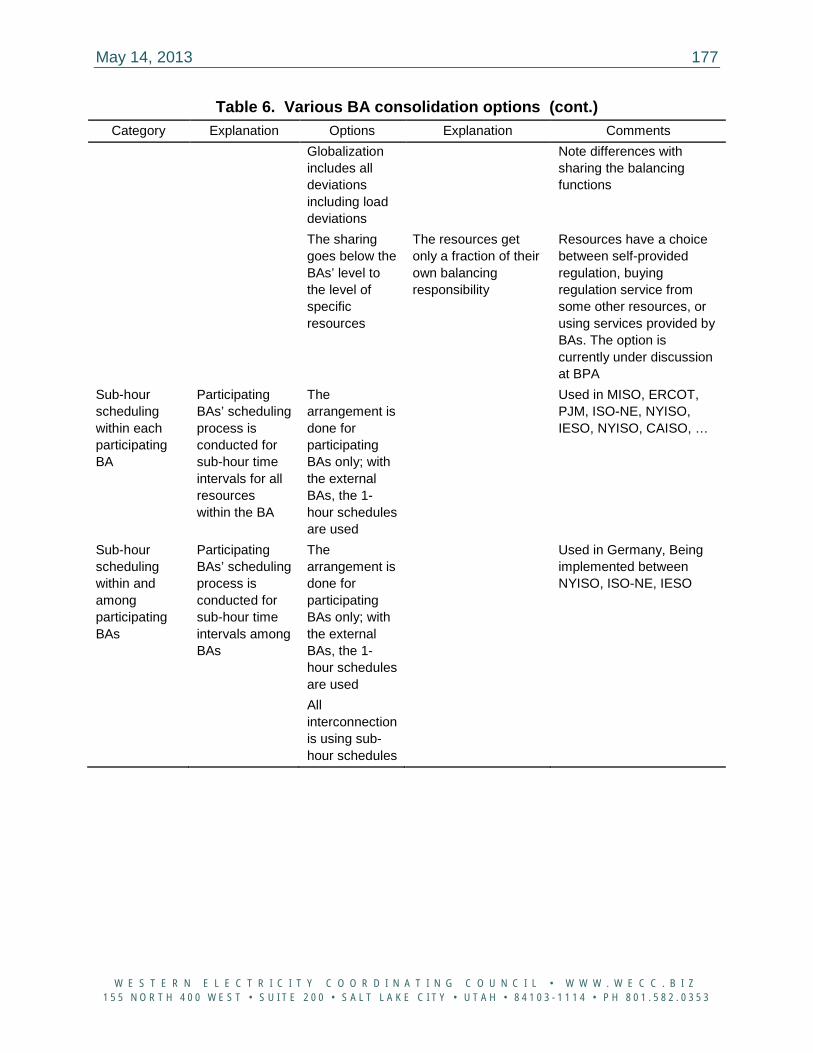
May 14, 2013 177
W E S T E R N E L E C T R I C I T Y C O O R D I N A T I N G C O U N C I L • W W W . W E C C . B I Z 1 5 5 N O R T H 4 0 0 W E S T • S U I T E 2 0 0 • S A L T L A K E C I T Y • U T A H • 8 4 1 0 3 - 1 1 1 4 • P H 8 0 1 . 5 8 2 . 0 3 5 3
Table 6. Various BA consolidation options (cont.) Category Explanation Options Explanation Comments
Globalization includes all deviations including load deviations
Note differences with sharing the balancing functions
The sharing goes below the BAs’ level to the level of specific resources
The resources get only a fraction of their own balancing responsibility
Resources have a choice between self-provided regulation, buying regulation service from some other resources, or using services provided by BAs. The option is currently under discussion at BPA
Sub-hour scheduling within each participating BA
Participating BAs’ scheduling process is conducted for sub-hour time intervals for all resources within the BA
The arrangement is done for participating BAs only; with the external BAs, the 1-hour schedules are used
Used in MISO, ERCOT, PJM, ISO-NE, NYISO, IESO, NYISO, CAISO, …
Sub-hour scheduling within and among participating BAs
Participating BAs’ scheduling process is conducted for sub-hour time intervals among BAs
The arrangement is done for participating BAs only; with the external BAs, the 1-hour schedules are used
Used in Germany, Being implemented between NYISO, ISO-NE, IESO
All interconnection is using sub-hour schedules
May 14, 2013 178
W E S T E R N E L E C T R I C I T Y C O O R D I N A T I N G C O U N C I L • W W W . W E C C . B I Z 1 5 5 N O R T H 4 0 0 W E S T • S U I T E 2 0 0 • S A L T L A K E C I T Y • U T A H • 8 4 1 0 3 - 1 1 1 4 • P H 8 0 1 . 5 8 2 . 0 3 5 3
APPENDIX 26
Generator Power Management Requirements (CAISO 2010)
May 14, 2013 179
W E S T E R N E L E C T R I C I T Y C O O R D I N A T I N G C O U N C I L • W W W . W E C C . B I Z 1 5 5 N O R T H 4 0 0 W E S T • S U I T E 2 0 0 • S A L T L A K E C I T Y • U T A H • 8 4 1 0 3 - 1 1 1 4 • P H 8 0 1 . 5 8 2 . 0 3 5 3
Appendix 26: Generator Power Management Requirements (CAISO 2010)
26.1 Active power management Modern VER plants are physically capable of controlling their output as dictated by available wind or insolation and the equipment rating. In fact, the ISO has generally interpreted the physically impossible exception to be restricted to real-time operating circumstances, such as forced outages, startup times, and, in the case of many renewable resources, lack of fuel, but not predetermined design limitations. Thus, all generating facilities with participating generator agreements are required to operate such that the ISO can control their output under both normal and emergency conditions. VER plants must have the ability to control the active power in response to a dispatch instruction or operating order similar to conventional generators. This ability should apply to the VER plants’ full range of potential output. The variable generation resource also should be able to receive automated dispatch system (ADS) instructions from the ISO Control Center and adjust the active power output of the plant to address any grid reliability concerns. In the event that active power control is not sufficient, the ISO must have the ability to send instructions to remotely trip the plant off-line. Also, if a VER plant is ordered off-line, the plant operator should not connect the plant back to the grid without prior approval from ISO operating personnel. The ISO anticipates using this feature only on an as needed basis to address any grid reliability issues or supply surplus situations or based upon stakeholder developed market rules. ISO intends to initiate a stakeholder process to establish rules governing the circumstances and use of this feature prior to beginning to use this feature.
26.2 Ramp rate limits and control VER plants must be able to limit and control their ramp rates. VER plants can have very steep ramp rates as compared to more gradual ramp rates for conventional fuel source resources. Per NERC IVGTF report, some VER generators can change output by +/- 70% in a time frame of 2 to 10 minutes, many times per day. It is currently envisioned, subject to further stakeholder consideration in a subsequent phase of this initiative, that ramp rate limits will be imposed when consistent with the generator’s economic bidding strategy or for specified operating conditions where accommodating the natural ramp rate of variable energy generators could threaten grid reliability. The ISO does not envision that this functionality will be continuously used. It will be used only when needed to reliably accommodate the upward and downward ramps for variable energy resources. Interconnection customer should design the system such that the ramp rate control feature can be enabled, when needed, either by the plant operator or in response to an external command from the ISO. This ability to enable or disable ramp rate limits is valuable to the grid. At the present time, the ISO anticipates limiting ramps when a curtailment instruction is engaged or released. In addition, the ability to limit the rate of power change may be necessary during periods of insufficient aggregate ramping capability on the system, primarily during a significant upward ramp of wind or solar resources. The ISO is not requiring any set limits for ramp up and down at this time. Alberta ISO has adopted a 10% MW rated capacity/minute upward ramp rate limit. A report prepared for ISO New England identified a rate of 5% MW rated capacity/minute as the slowest such adopted rate.
May 14, 2013 180
W E S T E R N E L E C T R I C I T Y C O O R D I N A T I N G C O U N C I L • W W W . W E C C . B I Z 1 5 5 N O R T H 4 0 0 W E S T • S U I T E 2 0 0 • S A L T L A K E C I T Y • U T A H • 8 4 1 0 3 - 1 1 1 4 • P H 8 0 1 . 5 8 2 . 0 3 5 3
26.3 Over-frequency response Frequency response is defined as an automatic and sustained change in the power consumption or output of a device that typically occurs within 30 seconds following a disturbance and is in a direction opposing the change in interconnection frequency. Historically, frequency response has been provided by turbine governor response and frequency responsive load in an interconnection. As load serving entities mobilize to meet California’s RPS objectives of 20% and 33% of energy served from renewable generation, conventional thermal resources that currently provide frequency response will be displaced by wind and solar generators. A conventional synchronous machine typically provides frequency response in the form of inertial response, where some of the kinetic energy stored in the rotating mass is released as electrical energy and governor response, where governors act based on the automatic droop control loop for the change in frequency, and open the governor valve to increase the turbine’s output. Inertial response is inherent to all synchronous machines. Governor response is via control actions, which can be turned to meet performance objectives, and also can be disabled, as is the case with some turbine generators. For variable energy generators, the physical equivalent for governor response is provided by control logic, such that the active power output of the generators can be adjusted if the grid frequency deviates from the pre-defined thresholds. WECC minimum operating reliability criteria (MORC) requires governor response from generators within WECC. Per WECC MORC, “It is imperative that all entities equitably share the various responsibilities to maintain reliability….To provide an equitable and coordinated system response to load/generation imbalances, governor droop shall be set at 5%. Over-frequency governor response is required from all variable energy generators, just like it is from conventional generators. Variable generation resources must have an over-frequency control system that continuously monitors the frequency of the transmission system and automatically reduces the real power output of the generator in the event of over-frequency. An intentional dead band of up to 0.036 Hz can be designed for the over-frequency control system. The ISO believes that if variable energy generators provide over-frequency response, then the risk of their receiving a disconnect order from the ISO in over-frequency situations would be reduced. The over-frequency response design requirements area droop setting is 5%, which means that a generator will change its output 100% for a 5% change in system frequency.
26.4 Interconnection application data recommendation The ISO recommends interconnection customers to provide the ISO with WECC approved standard study models (standard models) for their projects, rather than user-defined models, to the extent standard models are available. If standard models for certain generator technologies are not yet available, then the interconnection customers can supply user-written or equivalent models. However, once standard models become available, the interconnection customers should begin providing standard models. This not only helps in expediting the study process but ensures better consistency and higher confidence in accuracy of study results.
26.5 Future analyses Several other topics need to be closely reviewed for reliable renewable integration. While the ISO is not adding any interconnection requirements on these topics for this phase of the initiative, but the ISO will be reviewing any adverse reliability impacts from these topics in future
May 14, 2013 181
W E S T E R N E L E C T R I C I T Y C O O R D I N A T I N G C O U N C I L • W W W . W E C C . B I Z 1 5 5 N O R T H 4 0 0 W E S T • S U I T E 2 0 0 • S A L T L A K E C I T Y • U T A H • 8 4 1 0 3 - 1 1 1 4 • P H 8 0 1 . 5 8 2 . 0 3 5 3
phases of this initiative to determine if any new interconnection requirements need to be developed:
• Inertial response. The ISO will analyze the impact of reduction in system inertia caused by large scale variable energy generation displacing conventional synchronous machines. Pending the outcome of this analysis, there may be a need to develop new system operating limits, so that the MW amount of non-inertia-responsive generation can be reduced to maintain reliability for certain operating conditions. Controls providing inertial response for some types of VER plants and energy storage technologies may provide a substitute for the automatic injection of energy provided today by system inertia. ISO’s analysis will consider the capability of these technologies as potential mitigation for these operating limits.
• AGC participation. The ISO will analyze if there is a need to mandate any new-generation, including variable energy generation, to participate in automatic generation control (AGC). It should be noted that ISO’s asymmetric regulation market offers variable generators the opportunity to participate in that market for regulation down without continuously spilling wind or sun to maintain a regulation up range.
• Under-frequency response. The ISO will analyze if there is a need to mandate variable energy generation to provide under frequency response. If so, CAISO will require and utilize this feature in a very judicious manner consistent with market efficiency and environmental objectives. To properly develop appropriate market rules associated with the use of active power, the ISO will engage in a subsequent stakeholder process.
• Impact of the reduction in fault current levels. The inherent characteristics of practical asynchronous generators result in reduced short-circuit current contribution. A key disadvantage of this is that short-circuit faults may not clear, because standard protective relaying relies on the presence of significant fault current from at least one of the terminals of a transmission line or transformer. Significantly reduced fault current may result in time delayed clearing of system faults, and in the worst case, the relaying may fail to detect or clear the fault. The ISO will work with the PTOs to examine the impact of reduced available fault current.
• Power quality issues. Power quality refers to maintaining a pure sinusoidal output of voltage and current, and that frequencies other than the fundamental 60 Hz are not present. Further, there should be no noticeable flicker in system voltage associated with routine switching for lines, capacitors, etc. ISO will be engaging with power quality standards agencies (IEEE, ANSI) to analyze the impact of any additional power quality issues that may be caused by inverter-based variable energy generation.
• Minimum dynamic voltage support needs. As variable generation continues to be developed on large scale and this displaces some existing synchronous generation capacity, the need for dynamic voltage support for the grid would increase. ISO will undertake a study to establish a minimum amount of dynamic voltage support requirements for new-generation projects.
• Impact of variable generation on distribution system. If variable energy generators are developed on large scale at the distribution system level, then any adverse impact of this penetration on the transmission system will need to be analyzed. The interconnection
May 14, 2013 182
W E S T E R N E L E C T R I C I T Y C O O R D I N A T I N G C O U N C I L • W W W . W E C C . B I Z 1 5 5 N O R T H 4 0 0 W E S T • S U I T E 2 0 0 • S A L T L A K E C I T Y • U T A H • 8 4 1 0 3 - 1 1 1 4 • P H 8 0 1 . 5 8 2 . 0 3 5 3
requirements for new generators connecting to the distribution system are different and in some cases in conflict with interconnection requirements for the transmission system. One such conflict exists between IEEE 1547 and UL 1741 standards that require inverter-based generation to trip offline for faults near generator stations that can cause low voltages at the inverter terminals. If a significant amount of generation on the distribution system starts tripping for faults, this will pose an added burden on the transmission system.
• Non-fundamental frequency interactions. VER technologies that rely on power inverters have high frequency bandwidth controls. These controls have the potential to interact with other power electronic-based equipment (e.g., HVDC transmission), synchronous turbine-generators and series capacitors.
May 14, 2013 183
W E S T E R N E L E C T R I C I T Y C O O R D I N A T I N G C O U N C I L • W W W . W E C C . B I Z 1 5 5 N O R T H 4 0 0 W E S T • S U I T E 2 0 0 • S A L T L A K E C I T Y • U T A H • 8 4 1 0 3 - 1 1 1 4 • P H 8 0 1 . 5 8 2 . 0 3 5 3
APPENDIX 27
European Planning Guidelines
May 14, 2013 184
W E S T E R N E L E C T R I C I T Y C O O R D I N A T I N G C O U N C I L • W W W . W E C C . B I Z 1 5 5 N O R T H 4 0 0 W E S T • S U I T E 2 0 0 • S A L T L A K E C I T Y • U T A H • 8 4 1 0 3 - 1 1 1 4 • P H 8 0 1 . 5 8 2 . 0 3 5 3
Appendix 27: European Planning Guidelines This section presents Germany and Spain planning guidelines.
27.1 Germany
“Chancellor Angela Merkel's decision to phase out nuclear requires setting and achieving a vast expansion of renewable power and transmission. Following Japan's accident, 8 of the oldest of Germany's 17 reactors were ordered shut down. The rest will be phased out between 2015 and 2022 in the plan approved by parliament. Before the older plants were closed, nuclear power provided 22% of Germany's electricity; coal 42%; natural gas 14%t and renewable energy 17%, according to the Environment Ministry. A "no-nuclear" Germany would have to build more than 2,800 miles of new high-voltage transmission lines to achieve its new goal of doubling its current renewable power capacity to reach 35% by 2020. Under the new goals, the renewables share of Germany's electric generation capacity must reach 80% in 2050, coupled with large energy efficiency gains in buildings to restrain the growth of power demand.” (Behr 2011) The offshore wind development goal is to reach 25 GW of electricity from offshore installations by 2030.
27.2 Spain
“The single TSO approach is the most common situation in Western Europe. The transmission planning methodology involves four major steps: comprehensive scenario generation and analysis, information structuring, identification of competitive expansion alternatives, and decision making. These steps are illustrated through the case of the electricity market of mainland Spain and its TSO, Red Eléctrica de España.” (De Dios et. al. 2007)
May 14, 2013 185
W E S T E R N E L E C T R I C I T Y C O O R D I N A T I N G C O U N C I L • W W W . W E C C . B I Z 1 5 5 N O R T H 4 0 0 W E S T • S U I T E 2 0 0 • S A L T L A K E C I T Y • U T A H • 8 4 1 0 3 - 1 1 1 4 • P H 8 0 1 . 5 8 2 . 0 3 5 3
Bibliography ABB. 2012. “HVDC and HVDC Light.” Montreal, Canada. Available http://www.abb.com/hvdc Accessed 11/26/2012. ABB. 2003. “Blackout and electricity stability.” ABB, Montreal, Canada. Available http://www.google.com/url?sa=t&rct=j&q=&esrc=s&frm=1&source=web&cd=1&cad=rja&ved=0CDAQFjAA&url=http%3A%2F%2Fwww02.abb.com%2Fdb%2Fdb0003%2Fdb002698.nsf%2Fca7e93ab03030d22c12571380039e8fc%2F1c749593e024afc8c12571da0032d456%2F%24FILE%2FFacts%2Bwhite%2Bpaper%2BFinal.doc&ei=rJedUKvtB-SKjAKD0oCYCw&usg=AFQjCNHe5dAcHi9MZypRiLt0xiaAUJhLdA&sig2=i3QHHK19720zLMiefa_wRQ Accessed 11/28/2012.
Abdelaziz, A.R. 1999. "A fuzzy-based power system reliability evaluation." Electric Power Systems Research, vol. 50, pp. 1-5. Abdel-Rahman, M. H., and Youssef, F. M. H., and Saber, A. A., 2006 “New Static var Compensator Control Strategy and Coordination With Under-Load Tap Changer”, IEEE Transactions on Power Delivery, vol. 21, no. 3, pp. 1630-1635. Abraham, K.M., and Z. Jiang. 1996. ”A Polymer Electrolyte Based Rechargeable Lithium/oxygen Battery.” J. Electrochem. Soc., vol. 143, no. 1, pp. 1-5.
Abreu, L.V.L., and M. Shahidehpour, 2006. “Wind Energy and Power System Inertia.” IEEE Power Engineering Society General Meeting, Montreal, Quebec, 2006. Institute of Electrical and Electronics Engineers, Piscataway, NJ. Adamczyk, A., R. Teodorescu, R. N. Mukerjee, and P. Rodriguez. 2010. "Overview of FACTS devices for wind power plants directly connected to the transmission network." 2010 IEEE International Symposium on Industrial Electronics (ISIE), pp.3742-3748, July 4-7, 2010. Institute of Electrical and Electronics Engineers, Piscataway, NJ. Adler, T., F. McLarnon et al., 1993. “Low zinc solubility electrolytes for use in zinc/nickel oxide cells.” J. Electrochem. Soc., vol. 140, no. 2, pp. 289-294 Agreira, C.I.F., S. M. F. de Jesus, S. L. de Figueiredo, C. M. Ferreira, J. A. D. Pinto, and F. P. M. Barbosa. 2006. "Probabilistic steady-state security assessment of an electric power system using a Monte Carlo approach." In Proceedings of the 41st International Universities Power Engineering Conference, pp. 408-411, 2006. Institute of Electrical and Electronics Engineers, Piscataway, NJ. Ajjarapu, V. and B. Lee. 1998. “Bibliography on Voltage Stability.” IEEE Transactions on Power Systems, vol. 13, pp. 115-125, February 1998
Alberta Energy. 2009. “Assessment and Analysis of the State-Of-the-Art Electric Transmission Systems with Specific Focus on High-Voltage Direct Current (HVDC), Underground or Other New or Developing Technologies.” Alberta Energy, Edmonton, Alberta, Canada. December 23, 2009. Available http://www.energy.alberta.ca/Electricity/pdfs/TransmissionSystemsStudy.pdf.
May 14, 2013 186
W E S T E R N E L E C T R I C I T Y C O O R D I N A T I N G C O U N C I L • W W W . W E C C . B I Z 1 5 5 N O R T H 4 0 0 W E S T • S U I T E 2 0 0 • S A L T L A K E C I T Y • U T A H • 8 4 1 0 3 - 1 1 1 4 • P H 8 0 1 . 5 8 2 . 0 3 5 3
Alberto, L.D.C., F.H.J.R. Silva, and N.G. Bretas. 2001. “Direct Methods for Transient Stability Analysis in Power Systems: State of Art and Future Perspectives.” In Proceedings of IEEE Porto Power Tech Proceedings, vol. 2, September 10-13, 2001. Institute of Electrical and Electronics Engineers, Piscataway, NJ.
Aldea, C., and S. C. Savulescu. 2004. “Evaluation of the Stability Reserve of Transelectrica’s Transmission System by Using Quickstab Professional.” In Proceedings of National Conference of Energy CNE, Neptun, Romania, June 2004, pp. 1-6. Allan, R.N., R. Billinton, A. M. Briepohl, and C. H. Grigg. 1994. "Bibliography on the application of probability methods in power system reliability evaluation, 1987-1991." IEEE Transactions on Power Systems, vol. 9, pp. 41-49, 1994. Allan, R.N., R. Billinton, A. M. Breipohl, and C. Griss. 1999. "Bibliography on the application of probability methods in power system reliability evaluation, 1992-1996." IEEE Transactions on Power Systems, vol. 14, pp. 51-57, 1999. Allan, R.N., R. Billinton, and S. H. Lee. 1984. "Bibliography on the application of probability methods in power system reliability evaluation, 1977-1982." IEEE Transactions on Power Apparatus and Systems, vol. PAS-103, pp. 275-282, 1984.
Allan, R.N., R. Billinton, S. M. Shahidehpour, and C. Singh. 1988. "Bibliography on the application of probability methods in power system reliability evaluation, 1982-1987" IEEE Transactions on Power Systems, vol. 3, pp. 1555-1564, 1988. Allan, R.N., A. M. L. Da Silva, and R. C. Burchett. 1981. “Evaluation methods and accuracy in probabilistic load flow solutions.” IEEE Transactions Power App. Syst., vol. PAS-100, pp. 2539-2546, May. Alstom Grid. 2010. Multi-terminal HVDC System for Large Offshore Wind Park Grid Integration, Alstom Grid, Summer 2010. Pp. 24-26. Available http://www.alstom.com/Global/Grid/Resources/Documents/Smart%20Grid/Think%207%20-%2009%20chapter%202%20-%20Art%201%20Multi%20terminal%20HVDC%20system%20.pdf Anaya-Lara, O., F.M. Hughes, N. Jenkins, et al. 2006. "Influence of wind farms on power system dynamic and transient stability." Wind Engineering, vol. 30, no. 2, pp. 107-27.
Anderson, P.M., and B.K. LeReverend. 1996. “Industry Experience with Special Protection Schemes.” IEEE Transactions on Power Systems, vol. 11, no. 3, August.
Angeles-Camacho, C., O.L. Tortelli, E. Acha, and C.R. Fuerte-Esquivel. 2003. “Inclusion of a high voltage DC voltage source converter model in a Newton-Raphson power flow algorithm.” IEE Proceedings of Generation, Transmission, and Distribution, vol. 150, no. 6, pp. 691-696.
Ankan, K. Deb. 2000. Powerline Ampacity System: Theory, Modeling, and Applications, CRC Press, Boca Raton, FL.
Arges, C.G., V. Ramani, and P.N. Pintauro. 2010. “Anion Exchange Membrane Fuel Cells.” The Electrochemical Society Interface, p. 31-35.
May 14, 2013 187
W E S T E R N E L E C T R I C I T Y C O O R D I N A T I N G C O U N C I L • W W W . W E C C . B I Z 1 5 5 N O R T H 4 0 0 W E S T • S U I T E 2 0 0 • S A L T L A K E C I T Y • U T A H • 8 4 1 0 3 - 1 1 1 4 • P H 8 0 1 . 5 8 2 . 0 3 5 3
Armand, M., and J.M. Tarascon. 2008. “Building better batteries.” Nature Materials, vol. 451, pp. 652-657. Arrillaga, J., Y.H. Liu, and N.R. Watson. 2007. Flexible Power Transmission. The HVDC Options, J. Wiley and Sons Ltd, Hoboken, NJ.
Asare, P.O., A.W. Galli, J.S. Lee, C.A. Lozano, and E.O’Neil-Carillo. 1995. Real Time Pricing of Electric Power,.ECE Technical Report, Paper 120, Purdue University, West Lafayette, NJ. Available http://docs.lib.purdue.edu/cgi/viewcontent.cgi?article=1121&context=ecetr Accessed 11/28/2012.
Asmine, M., J. Brochu, J. Fortmann, R. Gagnon, Y. Kazachkov, C. E. Langlois, C. Larose, E. Muljadi, J. MacDowell, P. Pourbeik, S. A. Seman, and K. Wiens. 2011. “Model Validation for Wind Turbine Generator Models.” IEEE Transactions on Power Systems, pp. 1769 – 1782, Aug.
Asplund, G. 2007. “Ultra high voltage transmission.” ABB Review 2/2007, pp. 22-27. Available http://www05.abb.com/global/scot/scot271.nsf/veritydisplay/9e16e26d65ab7339c12572fe004deb21/$file/22-27%202m733_eng72dpi.pdf. Accessed 11/20/2012.
Asplund, G. 2000. “Application of HVDC Light to power system enhancement.” In Proceedings of IEEE PES Winter Meeting 2000, Singapore, Singapore, Jan. 23-27, 2000. Institute of Electrical and Electronics Engineers, Piscataway, NJ.
Asplund, G., and A. Williamson. 2007. “A novel approach to providing on route power supplies to rural and urban communities in close proximity to the extra high voltage DC transmission line.” IEEE PES Power Africa 2007 Conference and Exposition, South Africa, July 2007. Institute of Electrical and Electronics Engineers, Piscataway, NJ.
Athay, T., R. Podmore, and S. Virmani. 1979. “A Practical Method for the Direct Analysis of Transient Stability.” IEEE Trans. on Power Apparatus and Systems, vol. PAS-98, no. 2, pp. 573–584, March. Atlantic Wind Connection. 2012. Atlantic Wind Connection website. Atlantic Grid Development LLC, Chevy Chase, MD. Available http://atlanticwindconnection.com/awc-intro/. Accessed 11/15/2012. Austria, R.R., X. Y. Chao, N. P. Reppen, and D. E. Welsh. 1995. “Integrated Approach to Transfer Limit Calculations.” In Proceedings of IEEE Computer Applications in Power, January 1995, pp. 48-52. Institute of Electrical and Electronics Engineers, Piscataway, NJ. Aven, T. 2008. Risk Analysis Assessing Uncertainties beyond Expected Values and Probabilities: John Wiley & Sons Ltd., Hoboken, NJ, 2008.
Axion Power International, Inc. 2011. “Axion Power's PowerCube Battery Energy Storage System Integrated Into PJM Utility Grid.” November. Available http://www.eetimes.com/electronics-products/electronic-product-releases/smart-energy-design/4231963/Axion-Power-s-%20PowerCube-Battery-Energy-Storage-System-Integrated-Into-PJM-Utility-Grid Accessed 11/12/2012.
Bagnall, T., C. Ritter, B. Ronner, P. Maibach, N. Butcher, and T. Thurnherr. 2009. “PCS6000 STATCOM ancillary functions: Wind park resonance damping.” EWEC, Maeseille.
May 14, 2013 188
W E S T E R N E L E C T R I C I T Y C O O R D I N A T I N G C O U N C I L • W W W . W E C C . B I Z 1 5 5 N O R T H 4 0 0 W E S T • S U I T E 2 0 0 • S A L T L A K E C I T Y • U T A H • 8 4 1 0 3 - 1 1 1 4 • P H 8 0 1 . 5 8 2 . 0 3 5 3
Bahrman, M.P., J. G. Johansson, and B. A. Nilsson. 2003. “Voltage Source Converter Transmission Technologies: the Right Fit for the Application.” IEEE Power Engineering Society General Meeting, 13-17 July 2003. Institute of Electrical and Electronics Engineers, Piscataway, NJ. Available http://ieeexplore.ieee.org/stamp/stamp.jsp?tp=&arnumber=1267441&isnumber=28353. Accessed 11/15/2012. Balducci, A et al. "Cycling stability of a hybrid activated carbon// poly(3-methylthiophene) supercapacitor with N-butyl-N-methylpyrrolidinium bis(trifluoromethanesulfonyl)imide ionic liquids as electrlyte". Electrochim Acta 50 (2005) 2233-2237. Baran, M.E., S. Teleke, L. Anderson, S. Bhattacharya, A. Huang, and S. Atcitty. 2008. “STATCOM with Energy Storage for Smoothing Intermittent Wind Farm Power.” IEEE/PES, Institute of Electrical and Electronics Engineers, Piscataway, NJ.
Bauer, P. 1968. “Batteries for space power systems.” ed. NASA, Washington, D.C. Vol. NASA SP-172. BC Hydro. 2006. Voltage Stability Operating Limits and Procedures for Using the RT-VSA and VSA Applications, System Operating Order 7T – 50, Real Time Operations, British Columbia Transmission Corporation, Vancouver, British Columbia, Canada. 2 May 2006. Available http://www.bctc.com/NR/rdonlyres/BD53F0FD-A80A-4D0A-B4B9-11D13EFB9566/0/7T50.pdf. BCP Switzerland. undated. NEPLAN Electricity - Voltage Stability. Available http://www.neplan.ch/html/e/pdf_e/neplan_t03_voltagestability_engl.pdf Accessed 11/27/2012.
Beacon Power, “Frequency regulation and the smart energy matrix.” Beacon Power, Tyngsboro, MA. Available http://www.beaconpower.com/products/flywheel-energy-storage.asp.
Bear, J. 2011. “Renewable Integration: The Story So Far and What Lies Ahead.” MISO Presentation, Utility Scale Flexible Power Summit, Denver, CO, September 27, 2011. Midwest ISO, Carmel, IN. Available http://www.greenpowerconferences.com/EF/Events/RE1109US/docs/1/John_Bear.pdf. Accessed 11/5/2012. Bebic, J. 2008. Power System Planning: Emerging Practices Suitable for Evaluating the Impact of High-Penetration Photovoltaics, NREL, Golden, CO. February, Available http://www1.eere.energy.gov/solar/pdfs/42297.pdf Accessed 11/27/2012.
Bebic, J., R. Walling, K. O'Brien, and B. Kroposki. 2009. “The sun also rises.” IEEE Power and Energy Magazine, Vol. 7 , no. 3, May 2, 2009, pp. 45 – 54.
Begovic, M.M. and A.G. Phadke. 1992.“Control of Voltage Stability Using Sensitivity Analysis.” IEEE Trans. on Power Syst., Vol. 7, No. 1, Feb. 1992, pp. 114-123. Behr, P. 2011. “Germany Sees Thousands of Miles of New Power Lines on Its Road to Renewable Energy.” New York Times, August 1, 2011. Available http://www.nytimes.com/cwire/2011/08/01/01climatewire-germany-sees-thousands-of-miles-of-new-power-43095.html?pagewanted=all Accessed 11/20/2012.
May 14, 2013 189
W E S T E R N E L E C T R I C I T Y C O O R D I N A T I N G C O U N C I L • W W W . W E C C . B I Z 1 5 5 N O R T H 4 0 0 W E S T • S U I T E 2 0 0 • S A L T L A K E C I T Y • U T A H • 8 4 1 0 3 - 1 1 1 4 • P H 8 0 1 . 5 8 2 . 0 3 5 3
Belanger, D., T. Brousse, and J.W. Long. 2008. “Manganese Oxides: Battery Materials Make the Leap to Electrochemical Capacitors.” The Electrochemical Society Interface, Spring: p. 49-52. Bents, D.J. et. al. 2005.Hydrogen-Oxygen PEM Regenerative Fuel Cell Energy Storage System. NASA, Washington, D.C.
Bessette, N. 2011. “Development of a Low-Cost 3-10 kW Tubular SOFC Power System.” in DOE Hydrogen and Fuel Cells Program Annual Progress Report, DOE, Washington, D.C. Editor. Acumentrics Corporation. Westwood, MA. p. 890-893.
Bettiol, A.L., Y. Zhang, L. Wehenkel, and M. Pavella, 1997. “Transient Stability Investigations on a Brazilian Network by SIME.” In Proceedings of Fourth International Conference on Advances in Power System Control, Operation and Management APSCOM-97, paper 450, vol. 1, pp. L1–L6, November 11-14, 1997,. Institute of Electrical and Electronics Engineers, Piscataway, NJ.
Bevrani, H., and Takashi Hiyama. 2011. Intellient Automatic Generation Control, CRC Press, Boca Raton, FL. Billinton, R. 1972. "Bibliography on the application of probability methods in power system reliability evaluation." IEEE Transactions on Power Apparatus and Systems, vol. PAS-91, pp. 649-660, 1972.
Billinton, R. and R.N. Allan. 1996. Reliability Evaluation of Power Systems, Plenum Press, New York. Billinton, R., H. Chen and R. Ghajar. 1996. "A sequential simulation technique for adequacy evaluation of generating systems including wind energy." IEEE Transactions on Energy Conversion, vol. 11, no. 4, pp. 728-734, 1996.
Billinton, R. and A.A. Chowdhury. 1992. "Incorporating of wind energy conversion systems in conventional generating capacity adequacy assessment." IEEE Proceedings C: Generation, Transmission and Distribution, vol. 139, no. 1, pp. 45-56, Jan. 1992. Institute of Electrical and Electronics Engineers, Piscataway, NJ. Billinton, R. and M. Fotuhi-Firuzabad. 1994. "A basic framework for generating system operating health analysis." IEEE Transactions on Power Systems, vol.9, no. 3, pp.1610-1617, Aug. 1994. Billinton, R. and B. Karki. 2011. “Well-Being Analysis of Wind Integrated Power Systems” IEEE Transactions on Power Systems, vol. 26, no. 4, Nov. Billinton, R. and R. Karki. 1999. "Application of Monte Carlo simulation to generating system well-being analysis.” IEEE Transactions on Power Systems, vol. 14, no. 3, pp. 1172-1177, Aug. 1999. Billinton, R. and Khan. E. 1992. "A security based approach to composite power system reliability evaluation.” IEEE Transactions on Power Systems, vol. 7, no. 1, pp. 936-941, Feb. 1992. Billinton, R., and W. Li. 1994. Reliability Assessment of Electric Power Systems using Monte Carlo Methods. Plenum Press, New York 1994.
May 14, 2013 190
W E S T E R N E L E C T R I C I T Y C O O R D I N A T I N G C O U N C I L • W W W . W E C C . B I Z 1 5 5 N O R T H 4 0 0 W E S T • S U I T E 2 0 0 • S A L T L A K E C I T Y • U T A H • 8 4 1 0 3 - 1 1 1 4 • P H 8 0 1 . 5 8 2 . 0 3 5 3
Billinton, R. and Lian. G 1994. "Composite power system health analysis using a security constrained adequacy evaluation procedure.” IEEE Transactions on Power Systems, vol. 9, no. 2, pp. 936-941, May. 1994.
BINE Informationsdienst,“Compressed air energy storage power plants.” BINE Informationsdienst projektinfo 05/07. Available http://www.bine.info/fileadmin/content/Publikationen/Englische_Infos/projekt_0507_engl_internetx.pdf. Accessed on November 10, 2012. Bockenfeld, N. et al. 2011. “Composite LiFePO4/AC high rate performance electrodes for Li-ion capacitors.” J. Power Sources, 196:p. 4136-4142. Bolund, B. 2007. “Flywheel Energy and Power Storage Systems.” Renewable and Sustainable Energy Reviews, vol. 11, pp. 235-259.
BPA. 2012. “BPA’s Proposed Oversupply Management Protocol.” BPA Workshop presentation, February 14, 2012. Available http://www.bpa.gov/Projects/Initiatives/Oversupply/OversupplyDocuments/20120207-proposed-protocol/Feb14WorkshopPresentation.pdf Accessed 11/27/2012.
BPA. 2011. “Planning for and Responding to Overgeneration Events.” BPA Public Workshop Presentation, February 25, 2011. [Online.] Available http://www.bpa.gov/Projects/Initiatives/Oversupply/OversupplyDocuments/Feb%20Workshop%20Presentations.pdf Accessed 11/27/2012.
BPA. 2010a. “BPA Comments on RM10-11-000.” Available http://www.bpa.gov/corporate/windpower/docs/RM10-11_BPA_Comments.pdf Accessed 11/26/2012.
BPA. 2010b. Forecast of Renewable Projects Connected to BPA Grid based on Existing Queue and Recent Trends. Portland, OR. Available http://www.transmission.bpa.gov/PlanProj/Wind/documents/Wind_Forecast_Graph_2015-September2010.pdf Accessed October 30, 2012 BPA. 2010c. “Comments of Bonneville Power Administration in FERC Docket No. RM10-11-000.” April 12, 2010. Available http://www.efsec.wa.gov/Whistling%20Ridge/Adjudication/Intervenor's%20pre-filed%20testimony/Ex%2030.10%20.pdf Accessed 11/12/2012. BPA. 2009. Integrating Wind Power and Other Renewable Resources into the Electric Grid, September 2009. Available http://bpa.gov/corporate/windpower/docs/Wind-WIT_generic_slide_set_Sep_2009_customer.pdf Accessed 11/26/2012.
BPA. 2008a. “2009 Wind Integration Rate Case Revised Proposal.” March 2008. Available http://www.nippc.org/upload/BPA%20Wind%20Integration%20WI09_Revised_Proposal.pdf Accessed 11/26/2012.
BPA. 2008b. “Proposed Wind Integration-Within-Hour Balancing Service Rate for Public Hearing, and Opportunity for Public Review and Comment.” A Notice by the Bonneville Power Administration on 2/07/2008, Available https://www.federalregister.gov/articles/2008/02/07/E8-
May 14, 2013 191
W E S T E R N E L E C T R I C I T Y C O O R D I N A T I N G C O U N C I L • W W W . W E C C . B I Z 1 5 5 N O R T H 4 0 0 W E S T • S U I T E 2 0 0 • S A L T L A K E C I T Y • U T A H • 8 4 1 0 3 - 1 1 1 4 • P H 8 0 1 . 5 8 2 . 0 3 5 3
2253/proposed-wind-integration-within-hour-balancing-service-rate-for-public-hearing-and-opportunity-for Accessed 11/26/2012.
BPA. Undated. “Bonneville Power Administration.” Portland, OR. Available http://www.bpa.gov Accessed 11/26/2012. Borges, C.L.T., and D. M. Falcao. 2000. "Power system reliability by sequential Monte Carlo simulation on multicomputer platforms." In Proceedings of the Processing of the 4th International Conference Vector and Parallel (VECPAR 2000), Porto, Portugal, pp. 242-253, June 21–23, 2000. Borkowska, B. 1974. “Probabilistic load flow.” IEEE Transactions Power App. Systems, vol. PAS-93, pp. 752-759, May. Bragason, R.F. 2005. Damping in the Icelandic Power System: Small Signal Stability Analysis and Solutions. MS Thesis, Dept. of Industrial Electrical Engineering and Automation, Lund University, Lund, Sweden, 2005. Available http://www.iea.lth.se/publications/MS-Theses/Full%20document/5201_full_document.pdf Accessed 11/27/2012. Brennan, B., M. Diedesch, J. Johnson, and W. Zhang. 2008. “Dynamic Line Ratings for the Cowlitz-LaGrande Transmission Lines.” Final Report, Department of Electrical Engineering, Washington State University, Pullman, WA.
British Columbia Transmission Corporation. 2006. Voltage Stability Operating Limits And Procedures For Using The RT-VSA And VSA Applications, System Operating Order 7T – 50, Real Time Operations, British Columbia Transmission Corporation, Effective Date: May 2, 2006. Available http://www.bctc.com/NR/rdonlyres/BD53F0FD-A80A-4D0A-B4B9-11D13EFB9566/0/7T50.pdf Accessed 11/28/2012.
Bucher,B. 2009. “King County Fuel Cell Demonstration Project.” King County Department of Natural Resources and Park, Seattle, WA. Available http://your.kingcounty.gov/dnrp/library/wastewater/energy/FuelCell/0803FuelCellDemoProjectSummary.pdf
Buckley, P. 2010. “Ultracapacitors with increased energy and power density seek to drive high-power applications.” January. Available http://www.eetimes.com/electronics-news/4198483/Ultracapacitors-with-increased-energy-and-power-density-seek-to-drive-high-power-applications?pageNumber=3 Accessed 11/12/2012.
Bullock, G.C. 1990. “Cascading Voltage Collapse in West Tennessee, August 22, 1987.” Georgia Institute of Technology 44th Annual Protective Relaying Conference, May 2—4, 1990. Georgia Institute of Technology, Atlanta, GA.
Burke, A. 2007. “R&D considerations for the performance and application of electrochemical capacitors.” Electrochem. Acta, 53:pp. 1083-1091. Burke, K.A. 2003. Unitized Regenerative Fuel Cell System Development, N.G.R. Center, NASA/TM-2003-212739.
May 14, 2013 192
W E S T E R N E L E C T R I C I T Y C O O R D I N A T I N G C O U N C I L • W W W . W E C C . B I Z 1 5 5 N O R T H 4 0 0 W E S T • S U I T E 2 0 0 • S A L T L A K E C I T Y • U T A H • 8 4 1 0 3 - 1 1 1 4 • P H 8 0 1 . 5 8 2 . 0 3 5 3
Butt, R. 2011. “Microgrid Planning and Design –MCAS Miramar, US Air Force Academy, and Fort Carson.” NREL, Golden, CO, Presentation May 13, 2011. Available http://e2s2.ndia.org/schedule/Documents/Abstracts/Butt.pdf. Accessed 11/5/2012.
CAISO. 2011a. “Renewables Integration Market Vision and Roadmap, Initial Straw Proposal” California ISO, Folsum, CA. July 6, 2011. Available http://www.caiso.com/Documents/StrawProposal-RenewablesIntegrationMarketVision_RoadmapDay-ofMarket.pdf Accessed 11/27/2012.
CAISO. 2011b. “Supplement to August 2010 Report on the Integration of Renewable Resources Operational Requirements and Generation Fleet Capability at 20% RPS.” Folsum, CA. CAISO. 2010a. Integration of Renewable Resources: Operational Requirements and Generation Fleet Capability at 20% RPS. California ISO Report, August 31, 2010. Available http://www.uwig.org/CAISO-20PercentRPS.pdf Accessed 11/27/2012. CAISO. 2010b. Interconnection Standards Review Initiative, Draft Straw Proposal, California ISO, Folsom, California, March 25, 2010. Available http://www.nerc.com/docs/pc/ivgtf/CAISO_Draft_Straw_Proposal.pdf. Accessed 11/15/2012. CAISO. 2010c. Interconnection Standards Review Initiative, Draft Straw Proposal, California ISO, Folsom, California, May 7, 2010. Available http://www.caiso.com/Documents/SecondRevisedDraftFinalStrawProposal-InterimInterconnectionRequirements_LargeGeneratorFacilitiesReview5_07_10.doc. Accessed 11/15/2012. CAISO, 2009. “Participation of Limited Energy Storage Resources in CAISO Electricity Markets.” Folsum, CA.
CAISO. 2006. “Spinning Reserve and Non-Spinning Reserve.” California ISO, Folsum, CA, January.
CAISO 1998. California ISO System Disturbance Report: December 8, 1998 - San Francisco Area. CAISO, Folsum, CA. Available http://www.caiso.com/docs/1999/03/31/1999033116341717931.pdf.
Cañizares, C.A., and F.L. Alvarado. 1991. “Computational Experience with the Point of Collapse Method on Very Large AC/DC Systems.'' In Proceedings Bulk Power System Voltage Phenomena – Voltage Stability And Security, ECC/NSF Workshop, Deep Creek Lake, MD, August 1991; published by ECC Inc., Fairfax, Virginia. Cañizares, C.A., F. L. Alvarado, C. L. DeMarco, I. Dobson, and W. F. Long, 1992. “Point of Collapse Methods Applied to AC/DC Power Systems.” IEEE Transactions on Power Systems, vol. 7, no. 2, pp. 673–683, May 1992.
Cao, F., A. Charkey, and K. Williams. 2000. “Thermal behavior and end-of-life characteristics of the nickel–zinc battery.” In Proceedings of the 35th Intersociety Energy Conversion Engineering Conference, vol. 2, pp. 985–994.
Castellanos, R. and A.R. Messina. 2008. Robust Stability and Performance Analysis of Large Scale Power Systems with Parametric Uncertainty: A Structured Singular Value Approach, Nova Science Publishers, New York.
May 14, 2013 193
W E S T E R N E L E C T R I C I T Y C O O R D I N A T I N G C O U N C I L • W W W . W E C C . B I Z 1 5 5 N O R T H 4 0 0 W E S T • S U I T E 2 0 0 • S A L T L A K E C I T Y • U T A H • 8 4 1 0 3 - 1 1 1 4 • P H 8 0 1 . 5 8 2 . 0 3 5 3
Cavallo A. 2007. “Controllable and affordable utility-scale electricity from intermittent wind resources and compressed air energy storage (CAES).” Energy 32:120–127. Cavallo, A. 1995. “High-capacity Factor Wind Energy Systems.” Journal of Solar Energy Engineering, vol. 117, no. 2, pp. 137-143. “Central Allocation Office GmbH.” Germany. Available http://www.central-ao.com Accessed 11/26/2012
Charkey, A, E. E. Ferreira and A. Charkey. 1997. “An improved nickel/zinc battery for ventricular assist systems.” Journal of Power Sources, vol. 65, pp. 109-l 15. Chauhan, S., and M.P. Dava. 1997. “Kohonen Neural Network Classifier for Voltage Collapse Margin Estimation.” Electric Machines and Power Systems, vol. 25, no. 6, pp. 607-619, July. Chen, P., Chen, Z., and Bek-Jensen, B., 2008, “Probabilistic Load Flow: A Review”, Third International Conference on Electric Utility Deregulation and Restructuring and Power Technologies, 2008, DRPT 2008,pp. 1586-1591. Chen, G., S.R. Bare, and T.E. Mallouk. 2002. “Development of Supported Bifunctional Electrocatalysts for Unitized Regenerative Fuel Cells.” J. Electrochem. Soc., 149(8):p. A1092-A1099. Chen, R.H., O. P. Malik, and G. S. Hope. 1995. "On-line multi-contingency preprocessing of security assessment for severe weather based on qualitative reasoning with probability statistics classification." Electrical Power and Energy Systems, vol. 17, pp. 3-10, 1995. Chiang, H.-D., F.F. Wu, Felix F.; Varaiya, P.P, 1988. “Foundations of the potential energy boundary surface method for power system transient stability analysis.” IEEE Transactions on Circuits and Systems, vol. 35, no. 6, pp. 712-728. Chiang, H.-D., F.F. Wu, and P.P. Varaiya, 1994. “A BCU Method for Direct Analysis of Power System Transient Stability.” IEEE Transactions on Power Systems, vol. 9, no. 3, pp. 1194–1208. China Daily. 2010. “State Grid unveils ultra-high-voltage power line plans.” China Daily, August 13, 2010. Available http://www.chinadaily.com.cn/business/2010-08/13/content_11148692.htm . Accessed 11/6/2012.
Chmiola, J. et al. 2011. “Anomalous Increase in Carbon Capacitance at Pore Sizes less than 1 Nanometer.” Science, 313:p. 1760-1763. CIGRE TB 299. 2006, Guide for the selection of weather parameters for bare overhead conductor ratings. International Council on Large Electric Systems, Paris, France.
CIGRE Task Force 38. 1993. Modeling of Voltage Collapse Including Dynamic Phenomena. CIGRE Task Force 38-02-10.International Council on Large Electric Systems, Paris, France.
May 14, 2013 194
W E S T E R N E L E C T R I C I T Y C O O R D I N A T I N G C O U N C I L • W W W . W E C C . B I Z 1 5 5 N O R T H 4 0 0 W E S T • S U I T E 2 0 0 • S A L T L A K E C I T Y • U T A H • 8 4 1 0 3 - 1 1 1 4 • P H 8 0 1 . 5 8 2 . 0 3 5 3
Clarke, S. et al. 2009. U.S. Offshore Wind Energy: A Path Forward. U.S. Offshore Wind Collaborative, Cambridge, MA. Available http://www.usowc.org/pdfs/PathForwardfinal.pdf Accessed 11/27/2012.
Coates, D, E. Ferreira, and A. Charkey. 1997. “Development of a Long Cycle Life Sealed Nickel-Zinc Battery for High Energy-Density Applications.” IEEE AES Systems Magazine, June ColumbiaGrid. 2008. Report on ACE Diversity Interchange. January 1, 2008. Available http://www.columbiagrid.org/download.cfm?DVID=436. Accessed February 2010. Conway, B.E., ed. 1999. Electrochemical Supercapacitors: Scientific Fundamentals and Technological Applications. Kluwer Academic/Plenum Publishers, Denmark.
Corey, G.P. 2010. An Assessment of the State of the Zinc-Bromine Battery Development Effort. RedFlow Limited, Chicago, IL. Corey, G.P., L.E. Stoddard, and R.M. Kerschen. 2002. Boulder City Battery Energy Storage Feasibility Study. Sandia Report SAND2002-0751, .Sandia National Laboratories, Albuquerque, NM. Dalin, G.A., et al. 1964. “Sealed Silver-Zinc Batteries.” In Proceedings of the 18th Annual Power Sources Conference. Fort Monmouth, NJ. p. 54. PSC Publications Committee, Red Bank, NJ.
Daniel, R, 2010. Integrating Wind-Solar-CAES,” Compressed Air Energy Storage (CAES) Conference & Workshop, October 21, 2010. Available http://www.clca.columbia.edu/CAES2workshop_proceedings.pdf
De Dios, R., Soto, F., and Conejo, A. J., 2007, “Planning to expand?,”IEEE Power and energy Magazine, pp. 64-70. Desrochers, G., and M. Blanchard. 1986. "A Monte Carlo simulation for the economical assessment of the contribution of wind energy to power systems," IEEE Transactions on Energy Conversion, vol. 1, no.4, pp. 50-56, 1986.
Dimo, P. 1975. Nodal Analysis of Power Systems. Abacus Press, England. Dimo, P. 1971. L’Analyse Nodale des Réseaux D’Énergie, Eyrolles. Dinavahi, V.R., and S.C. Srivastava. 2001. “ANN Based Voltage Stability Margin Prediction.” IEEE Power Engineering Society Summer Meeting, vol. 2, pp. 1275–1280, July 15-19, 2001. Institute of Electrical and Electronics Engineers, Piscataway, NJ. Dizdarevic, N., M. Majstrovic, S. Cudjic Coko, N. Mandic, and J. Bonovic. 2003. “Causes, Analyses and Countermeasures with Respect to Blackout in Croatia on January 12, 2003.” CRIS International Workshop on Power System Blackouts ~ Causes, Analyses, and Countermeasures, Lund, Sweden, May 3, 2004.
Djukanovic, M., D.J. Sobajic and Y.H. Pao. 1993. “Learning Tangent Hypersurfaces for Fast Assessment of Transient Stability” In Proceedings of 2nd International Forum on Applications of
May 14, 2013 195
W E S T E R N E L E C T R I C I T Y C O O R D I N A T I N G C O U N C I L • W W W . W E C C . B I Z 1 5 5 N O R T H 4 0 0 W E S T • S U I T E 2 0 0 • S A L T L A K E C I T Y • U T A H • 8 4 1 0 3 - 1 1 1 4 • P H 8 0 1 . 5 8 2 . 0 3 5 3
Neural Networks to Power Syst. ANNPS '93, Apr. 19-22, 1993, pp. 124 – 129. Institute of Electrical and Electronics Engineers, Piscataway, NJ. Dobson, I. 1992. “Observations on the Geometry of Saddle Node Bifurcation and Voltage Collapse in Electrical Power Systems.” IEEE Transactions on Circuits and Systems I: Fundamental Theory and Applications, vol. 39, no. 3, pp. 240–243, March 1992.
Dobson, I. and L. Lu. 1993. “New Methods for Computing a Closest Saddle Node Bifurcations and Worst Case Load Power Margin for Voltage Collapse.” IEEE Trans. on Power Systems, vol. 8, no. 3, pp. 905-913, August.
Dobson, I., and L. Lu. 1992. “Computing an Optimal Direction in Control Space to Avoid Saddle Node Bifurcation and Voltage Collapse in Electric Power Systems.” IEEE Transactions on Automatic Control, vol. 37, no. 10, pp. 1616-1620, October. Dobson, I., L. Lu and Y. Hu. 1991. “A Direct Method for Computing a Closest Saddle Node Bifurcation in the Load Power Parameter Space of an Electric Power System.” IEEE International Symposium on Circuits and Syst., Singapore, pp. 3019-3022, June. Institute of Electrical and Electronics Engineers, Piscataway, NJ. DOE. 2011. “One Million Electric Vehicles By 2015.” DOE, Washington, D.C. editor. DOE. 2003. Operations Review of June 14, 2000 PG&E Bay Area System Events Using AEMPFAST ® Software. Consultant Report P500-03-085F, Prepared by CERTS for the California Energy Commission, Folsum, CA, October.
Dolloff, P.A., D. Adams, S. Anderson, M.Y. Vaiman, M.M. Vaiman, M. Povolotskiy, and D.T. Bradshaw. 2008. “Evaluate Real-time System Reliability Using Boundary-based Concept for EKPC System.” In Proceedings of 2008 PES General Meeting, July 20-24, 2008. Institute of Electrical and Electronics Engineers, Piscataway, NJ.
Dong, Z.Y., Y.V. Makarov, and D. J. Hill. 1998. “Power system small signal stability analysis using genetic optimization techniques.” Electric Power Syst. Research, Vol. 46, 1998, pp. 195-204. Dong, C. and Y, Yu. 2005.“PDSR in Phase Angle Space and SPM Based Security Monitoring of Power Systems.” IEEE Region 10 TEHCON 2005, pp. 1–5, Nov. 2005. Institute of Electrical and Electronics Engineers, Piscataway, NJ.
Doorman, G., G. Kjǿlle, K. Uhlen, E. S. Huse, and N. Flatabǿ. 2004.Vulnerability of the Nordic Power System. Report to the Nordic Council of Ministers, SINTEF Energy Research, May 2004. Available http://sparky.harvard.edu/hepg/Papers/Doorman.vul.nordic. system.0504.pdf Accessed 11/12/2012. Dopazo, J.F. 1975. “Stochastic load flow.” IEEE Transactions Power App. Systems, vol. PAS-94, pp. 299-309, March. Douglas, D. 2002. High-Temperature, Low-Sag Transmission Conductors. Electric Power Research Institute, Palo, Alto, CA Available http://mydocs.epri.com/docs/public/000000000001001811.pdf. Accessed November 7, 2012.
May 14, 2013 196
W E S T E R N E L E C T R I C I T Y C O O R D I N A T I N G C O U N C I L • W W W . W E C C . B I Z 1 5 5 N O R T H 4 0 0 W E S T • S U I T E 2 0 0 • S A L T L A K E C I T Y • U T A H • 8 4 1 0 3 - 1 1 1 4 • P H 8 0 1 . 5 8 2 . 0 3 5 3
Drury, E. P. Denholm, and R. Sioshans. 2011. “The Value of Compressed Air Energy Storage in Energy and Reserve Markets.” Energy 36:4959-4973.
Dvorak, P. 2011. “High Voltage DC Line Planned to Cross Iowa.” Windpower Engineering and Development, June 13, 2011. Available http://www.windpowerengineering.com/featured/business-news-projects/high-voltage-dc-line-planned-to-cross-iowa/. Accessed 11/15/2012. EASAC, Transforming Europe’s Electricity Supply – An Infrastructure Strategy for a Reliable, Renewable and Secure Power System. EASAC Policy Report 11, The Royal Society, London. Available http://easac.eu/fileadmin/PDF_s/reports_statements/Transforming.pdf
East Penn Manufacturing Co. Inc. 2010. “East Penn Awarded Grant from the DOE for UltraBattery Smart Grid Project.” February. Available http://www.dekabatteries.com/default.aspx?pageid=1813 Accessed 11/12/2012. Eckroad, S. 2007. “Vanadium Redox Flow Batteries: An In-Depth Analysis.” Rept # 1014836. Electric Power Research Institute, Palo Alto, CA.
Eckroad, S. 2004. “EPRI-DOE Handbook Supplement of Energy Storage for Grid Connected Wind Generation Applications.” Rept # 1008703. Electric Power Research Institute. Palo Alto, CA, and the U.S. Department of Energy, Washington, DC.
Edris, A-A., R. Adapa, M. H. Baker, L. Bohmann, K. Clark, K. Habshi, L. Gyugyi, J. Lemay, A.S. Mehraban, A. K. Myers, J. Reeve, F. Sener, D. R. Torgerson, and R. R. Wood. 1997. “Proposed Terms and Definitions for Flexible AC Transmission System (FACTS).” IEEE Transactions on Power Delivery, vol. 12, pp. 1848–1853, October. Institute of Electrical and Electrics Engineers, Piscataway, NJ. El-Hawary, M.E. 2007. Power System Stability and Control. CRC Press, Baco Raton, Fl. El-Hawary, M.E., and G.A.N. Mbamalu. 1991. “A comparison of probabilistic perturbation and deterministic based optimal power flow solutions.” IEEE Transactions in Power Systems, vol. 6, no. 3, pp. 1099-1105, August. El-Kady, M.A., C. K. Tang, V. F. Carvalho, A. A. Fouad, and V. Vittal. 1986. “Dynamic Security Assessment Utilizing the Transient Energy Function Method.” IEEE Trans. on Power Syst., 1(3), pp. 284–291, 1986. EI-Keib A.A., and X. Ma. 1995. “Application of Artificial Neural Networks in Voltage Stability Assessment.” IEEE Transactions on Power Systems, vol. 10, no. 4, pp. 1890-1896, Nov. El-Sharkawi, M.A., R.J. Marks, M.E. Aggoune, D.C. Park, M.J. Damborg, and L.E. Atlas. 1989. “Dynamic Security Assessment of Power Systems Using Back Error Propagation Artificial Neuron Networks.” In Proceedings of the 2nd Symposium on Expert System Applications to Power Systems, Seattle, WA, July 1989. Ela, E. and B. Kirby. 2008. ERCOT Event on February 26, 2008: Lessons Learned. Report, NREL/TP-500-43373, National Renewable Energy Laboratory, Golden, CO, July 2008. Available www.nrel.gov/docs/fy08osti/43373.pdf. Accessed 11/15/2012.
May 14, 2013 197
W E S T E R N E L E C T R I C I T Y C O O R D I N A T I N G C O U N C I L • W W W . W E C C . B I Z 1 5 5 N O R T H 4 0 0 W E S T • S U I T E 2 0 0 • S A L T L A K E C I T Y • U T A H • 8 4 1 0 3 - 1 1 1 4 • P H 8 0 1 . 5 8 2 . 0 3 5 3
Ela, E., B. Kirby, E. Lannoye, M. Milligan, D. Flynn, B. Zavadil, and Mark O’Malley. 2010. “Evolution of Operating Reserve Determination in Wind Power Integration Studies.” IEEE Power and Energy Society General Meeting, July 25-29, 2010, Minneapolis, MN, pp. 1 – 8. Institute of Electrical and Electronics Engineers, Piscataway, NJ. Available http://www.wecc.biz/committees/StandingCommittees/JGC/VGS/OWG/ActivityO1/Operating%20Reserve%20Determination%20in%20Wind%20Integration%20Studies.pdf. Accessed 11/20/2012.
Elkraft-System. 2003. Power Failure in Eastern Denmark and Southern Sweden on 23 September 2003. Final report on the course of events, Elkraft System, DENMARK. November 4, 2003. Available www.geocities.jp/ps_dictionary/blackout/Final_report_uk-web.pdf Ellis, A., E. Muljadi, J.J. Sanchez-Gasca, and Y. Kazachkov. 2011. “Generic Models for Simulation of Wind Power Plants in Bulk System Planning Studies.” In Proceedings of 2011 IEEE Power and Energy Society General Meeting, July 24-29, 2011, San Diego, CA, pp. 1 – 8. Institute of Electrical and Electronics Engineers, Piscataway, NJ.
Energizer Resources. 2011. Vanadiumsite, Vancouver, B.C. Available http://www.vanadiumsite.com/vanadium-redox-l-cell-iron-chromium-flow-battery/. Accessed October 3, 2011.
Energy Storage News, 2010. Available http://www.energystoragenews.com/Vanadium%20Redox%20Flow%20Batteries.htm. Accessed 10/3/2011. EPRI 1993. Voltage Stability/Security Assessment and On-Line Control. EPRI Technical Report TR-101931-V1-4, vol. 1-4,. Electric Power Research Institute, Palo Alto, CA..
EPRI 1992. Voltage Stability Analysis Program (VSTAB), Version 2.1, User’s Manual. EPRI Research Project RP30400-01, August 1992. Electric Power Research Institute, Palo Alto, CA.
ERCOT, “Glossary.” ELECTRIC Reliability Council of Texas (ERCOT), Austin, TX. Available http://www.ercot.com/glossary Accessed 11/28/2012.
ERCOT. 2010. “The Tres Amigas Project.” ERCOT Presentation, Tres Amigas L.L.C., Santa Fe, NM . Available http://www.google.com/url?sa=t&rct=j&q=the%20tres%20amigas%20project%2C%20ercot%20presentation&source=web&cd=1&cad=rja&ved=0CDAQFjAA&url=http%3A%2F%2Fwww.ercot.com%2Fcontent%2Fmeetings%2Frpg%2Fkeydocs%2F2010%2F0122%2FTA__ERCOT_FINAL_012110.ppt&ei=EgrAUIn7NcbL0AGj04BY&usg=AFQjCNH7Okcs42JiJlhz1BQwLCAZZFKOjQ Accessed 12/5/2012. Ernst, B., U. Schreirer, F. Berster, C. Scholz, H.-P. Erbring, S. Schlunke, J. Pease, and Y. V. Makarov. 2010. Large Scale Wind and Solar Integration in Germany. PNNL-19225, Pacific Northwest National Laboratory, Richland, WA. Available: http://www.pnl.gov/main/publications/external/technical_reports/PNNL-19225.pdf. Accessed 11/15/2012.
Eto, J.H., J. Undrill, P. Mackin, R. Daschmans, B. Williams, B. Haney, R. Hunt, J. Ellis, H. Illian, C. Martinez, M.O’Malley, K. Coughlin, and K. Hamachi LaCommare. 2010. Use of Frequency
May 14, 2013 198
W E S T E R N E L E C T R I C I T Y C O O R D I N A T I N G C O U N C I L • W W W . W E C C . B I Z 1 5 5 N O R T H 4 0 0 W E S T • S U I T E 2 0 0 • S A L T L A K E C I T Y • U T A H • 8 4 1 0 3 - 1 1 1 4 • P H 8 0 1 . 5 8 2 . 0 3 5 3
Response Metrics to Assess the Planning and Operating Requirements for Reliable Integration of Variable Renewable Generation. Lawrence Berkeley National Laboratory, Berkeley, CA. December 2010.
Eudy, L. 2011. “Technology Validation: Fuel Cell Bus Evaluations,” in DOE Hydrogen and Fuel Cells Program Annual Progress Report. DOE, Washington, D.C. Editor. Intelligent Energy, Long Beach, CA. p. 1036-1039.
European Commission. 2003, “Report on the application of the Regulation (EC) No 1228/2003 of the European Parliament and of the council, ” June 2003 Available http://www.energy-community.org/pls/portal/docs/36276.PDF.
“European Network of Transmission System Operators for Electricity.” ENTSO-E Website: Available http://www.entsoe.eu/ Accessed 11/26/2012. European Wind Energy Association. 2010. Powering Europe: wind energy and the electricity grid. Nov. 2010. Available http://www.ewea.org/fileadmin/ewea_documents/documents/publications/reports/Grids_Report_2010.pdf Accessed 11/10/2012. Evdokunin, G.A. 2004. “Efficiency of the Use of Power Transmission with Increased Surge-Impedance Loading (ISIL).” Expanding Edge Seminar, Midwest ISO, St. Paul, MN, September 16, 2004. Available http://www.cerc-reactors.com/articles/miso16sep2004seminar/3_Evdokunin/Evdokunin-Presentation.pdf. Accessed 10/31/2012. Eyer, J. 2012. Renewable Integration in California. CEC IEPR Workshop, June 2012, California Energy Storage Alliance (CESA), CA. Available http://www.energy.ca.gov/2012_energypolicy/documents/2012-06-11_workshop/presentations/18_Eyer_CESA_IEPRWorkshop_Presentation_June2012_ver6.pdf Eyer, J., and G. Corey. 2010. Energy Storage for the Electricity Grid: Benefits and Market Potential Assessment Guide. Sandia National Laboratory, Albuquerque, NM.
Eyer, J. and R.S. Brown. 2007.Guide To Estimating Benefits and Market Potential for Electricity Storage in New York (With Emphasis on New York City). Final Report 07-06, New York State Energy Research and Development Authority (NYSERDA), Albany, NY. March 2007. Available http://www.energycollection.us/Energy-Storage/NYSERDA-Storage-Benefits.pdf. Accessed 11/27/2012.
Eyer, J., and G. Corey. 2010.Energy Storage for the Electricity Grid: Benefits and Market Potential Assessment Guide. Sandia National Laboratory, Albuquerque, NM FACTS Terms & Definitions Task Force. 1997. "Proposed terms and definitions for flexible AC transmission system (FACTS)." IEEE Transactions on Power Delivery, vol.12, no.4, pp.1848-1853, Oct 1997. Institute of Electrical and Electronics Engineers, Piscataway, NJ. FERC 2012a. “Order No. 1000 - Transmission Planning and Cost Allocation.” FERC, Washington, D.C. Jan 2012 Available http://www.ferc.gov/industries/electric/indus-act/trans-plan.asp Accessed 11/28/2012.
May 14, 2013 199
W E S T E R N E L E C T R I C I T Y C O O R D I N A T I N G C O U N C I L • W W W . W E C C . B I Z 1 5 5 N O R T H 4 0 0 W E S T • S U I T E 2 0 0 • S A L T L A K E C I T Y • U T A H • 8 4 1 0 3 - 1 1 1 4 • P H 8 0 1 . 5 8 2 . 0 3 5 3
FERC 2012b. “Federal Energy Regulatory Authority (FERC) Order 1000.” May 17, 2012. Transmission Planning and Cost Allocation by Transmission Owning and Operating Public Utilities. FERC, Washington, D.C. Available http://www.ferc.gov/whats-new/comm-meet/2012/051712/E-1.pdf Accessed 11/6/2012.
FERC 2010a. National Action Plan on Demand Response. Federal Energy Regulatory Commission, Washington, D.C. June 2010. Available http://www.ferc.gov/legal/staff-reports/06-17-10-demand-response.pdf. Accessed November 20, 2012.
FERC 2010b. Demand Response Compensation in Organized Wholesale Energy Markets. FERC Notice of Proposed Rulemaking, issued March 18, 2010. FERC, Washington, D.C. FERC 2009. A National Assessment of Demand Response Potential. Federal Energy Regulatory Commission, Staff Report, Washington, D.C. June 2009, p. 27. Available http://www.ferc.gov/legal/staff-reports/06-09-demand-response.pdf. Accessed 11/20/12. FERC 2005. FERC Order No. 661-A. December 2005. Available http://www.ferc.gov/EventCalendar/Files/20051212171744-RM05-4-001.pdf. Accessed 11/8/12.
FERC 2008 Wholesale Competition in Regions with Organized Electric Markets. FERC Order No. 719. FERC, Washington, D.C. Available www.ferc.gov/whats-new/comm-meet/2008/101608/E-1.pdf.
Forbes, B., D. Bradshaw, and F. Campbell. 2002. “Finding Hidden Capacity In Transmission Lines.” Transmission and Distribution World, September 1, 2002.
Fouad, A.A. and V. Vittal. 1992. Power System Transient Stability Analysis Using the Transient Energy Function Method. Prentice Hall, New Jersey, 1992. Freeman, Sullivan & Co, Energy and Environmental Economics, Inc, 2009, California Independent System Operator Demand Response Barriers Study.April 2009. Available http://www.caiso.com/2410/2410ca792b070.pdf Furukawa, J. et al. 2009. “Development of the Flooded-type UltraBattery for Micro-HEV Applications.” ECS Transactions, 16(34):p. 27-34. Galloway, R,C. 2003. “ZEBRA Battery - Material Cost Availability and Recycling.” Published EVS-20. Long Beach, CA.
Gao, B., G.K. Morison, and P. Kundur. 1996. “Towards the Development of a Systematic Approach for Voltage Stability Assessment of Large-Scale Power Systems.” IEEE Transactions on Power Systems, vol. PWRS-11, no. 3, pp. 1314-1324, August 1996. Institute of Electrical and Electronics Engineers, Piscataway, NJ. Garver, L.L. 1966. “Effective Load Carrying Capability of Generating Units.” IEEE Transactions on Power Appuratus and Systems, vol. 85, no. 8, pp. 910–919, Aug. Gautam, D., V. Vittal, and T. Harbour. 2009. "Impact of increased penetration of DFIG-based wind turbine generators on transient and small signal stability of power systems." IEEE Transactions on Power Systems, vol. 24, no. 3, pp. 1426-1434, Aug.
May 14, 2013 200
W E S T E R N E L E C T R I C I T Y C O O R D I N A T I N G C O U N C I L • W W W . W E C C . B I Z 1 5 5 N O R T H 4 0 0 W E S T • S U I T E 2 0 0 • S A L T L A K E C I T Y • U T A H • 8 4 1 0 3 - 1 1 1 4 • P H 8 0 1 . 5 8 2 . 0 3 5 3
Gestore Rete Transmissione 2003. Black-Out: The Events Of 28 September 2003. Press Release, Gestore Rete Transmissione Nazionale, Italy, October 1, 2003. Available http://www.grtn.it/eng/documentinewsstatiche/blackout28set03.pdf.
Giberson, M. 2009. “Consequences of Dynamic Transmission Line Rating for Renewable Power.” Blog, May 20, 2009, Available http://knowledgeproblem.com/2009/05/20/dynamic-transmission-line-rating-and-renewable-power/. Accessed 10/31/2012. Global Transmission 2009. “Focus on UHV AC: China shows the way by energizing 1,000 kV line.” Global Transmission Report, New Delhi, India. Available http://www.globaltransmission.info/archive.php?id=1434. Accessed 11/20/2012. Golden Valley Electric Association. “Battery energy storage system (BESS).” Golden Valley Electric Association, Fairbanks, AK. Available http://www.gvea.com/inside/about. Accessed 11/20/2012. Gray, B. 2009. “Grid Scale Energy Storage: Linchpin Technology for our Clean and Secure Energy Future.” Environmental Energy Technologies Division Seminars, E.O. Lawrence Berkeley National Laboratory, Berkeley, CA. March 17, 2009. Available http://eetd-seminars.lbl.gov/seminar/grid-scale-energy-storage-linchpin-technology-our-clean-and-secure-energy-future. Accessed Nov 30, 2011.
Grazzini, G. and A. Millazzo. 2008. “Thermodynamic analysis of CAES/TES systems for renewable energy plants.” Renewable Energy 44:1998-2006.
Green Economy. 2011. “First HVDC Transmission Projects Beginning Globally.” Green Economy, May 2, 2011. Available http://uk.ibtimes.com/articles/20110502/first-hvdc-transmission-projects-beginning-globally.htm. Accessed 11/15/2012.
Greenblatt, J.B. 2005. “Using gas turbines to enhance the value of wind power.” Combined Cycle J 1Q:34–8, 2005 Greene, S., I. Dobson, and F.L. Alvarado. 2002. “Sensitivity of Transfer Capability Margins With a Fast Formula.” IEEE Trans. on Power Syst., Vol. 17, Issue 1, Feb 2002, pp. 34-40. Greene, S., I. Dobson, and F.L. Alvarado. 1997. "Sensitivity of the Loading Margin to Voltage Collapse With Respect to Arbitrary Parameters." IEEE Trans. on Power Syst., Vol. 12, Issue 1, Feb. 1997, pp. 262-272. Grigoriev, S.A. et al. 2010. “Design and characterization of bi-functional electrocatalytic layers for application in PEM unitized regenerative fuel cells.” Int. J Hydrogen Energy, 35:p. 5070-5076.
Group, N. 2010. “Advanced materials and devices for stationary electrical energy storage applications.” DOE, Washington, D.C., editor. p. 25. Grünbaum, R. 2010. “FACTS for Grid Integration of Wind Power.” ABB, Montreal, Canada. Available http://www05.abb.com/global/scot/scot221.nsf/veritydisplay/0bb9837cbc3c970e832577bb003e4464/$file/IEEE%20PES%20ISGT%202010.pdf. Accessed 11/20/2012.
May 14, 2013 201
W E S T E R N E L E C T R I C I T Y C O O R D I N A T I N G C O U N C I L • W W W . W E C C . B I Z 1 5 5 N O R T H 4 0 0 W E S T • S U I T E 2 0 0 • S A L T L A K E C I T Y • U T A H • 8 4 1 0 3 - 1 1 1 4 • P H 8 0 1 . 5 8 2 . 0 3 5 3
Grünbaum, R. and Rasmussen, J., 2012. “FACTS for Cost-Effective Improvement of Power Feeding of Large Mining Complexes.” IECON 2012 - 38th Annual Conference on IEEE Industrial Electronics Society , pp. 1295-1300. Gurevich, Y. E., L.E. Libova, and A.A. Okin. 1990. Design of Stability and Emergency Control Automatic Devices in Power Systems. Energoatomizdat, Moscow, 1990 – in Russian. Gyuk, I.P. and S. Eckroad. 2003.“EPRI-DOE Handbook of Energy Storage for Transmission and Distribution Applications.” Rept # 1001834 Final Report, December. Prepared by Technology Insights and EPRI PEAC Corporation for the U.S. Department of Energy, Washington DC, and Electric Power Research Institute, Inc., Palo Alto, CA. Hagstrom, E., I. Norheim, and K. Uhlen. 2005. "Large-scale wind power integration in Norway and impact on damping in the Nordic grid." Wind Energy, vol. 8, no. 3, pp. 375-384. Hailei, H., G. Jianbo, S. Yunting, and Z. Dongxia, "Risk based probabilistic security evaluation algorithm of bulk power system." In Proceedings of the 3rd International Conference on Electric Utility Deregulation and Restructuring and Power Technologies, pp. 1231-1236. Institute of Electrical and Electronics Engineers, Piscataway, NJ.
Hakim, H. 2002. “Application of Pattern Recognition in Transient Security Assessment.” Journal of Electrical Machines and Power Systems, vol. 20, no. 1–15. Han, C., A.Q. Huang, M.E. Baran, S. Bhattacharya, W. Litzenberger, L. Anderson, A.L. Johnson, and A.-A. Edris. 2008. “STATCOM Impact Study on the Integration of a Large Wind Farm into a Weak Loop Power System.” IEEE Transaction on Energy Conversion, March 2008. Institute of Electrical and Electronics Engineers, Piscataway, NJ.
Hansen, A.D., F. Iov, P. Sorensen, N. Cutuluis et al. 2007. "Dynamic wind turbine models in power system simulation tool DigSILENT." Ris0-R-1400(EN).
Hardiman, R.C., M. Kumbale, and Y. V. Makarov. 2004. “An Advanced Tool for Analyzing Multiple Cascading Failures.” In Proceedings of the 8th International Conference on Probabilistic Methods Applied to Power Systems, Iowa State University, Ames, Iowa, September 12-16, 2004. Harris, C. and J.P. Meyers. 2010. Working Smarter, Not Harder: An Introduction to the "Smart Grid." The Electrochemical Society Interface, 19(3).
Harris, P.G. 2010. “Technology Attributes.” Fortnightly's Spark, pp. 2-10. Hassenzahl, W.V. Eckroad, S. E. C. Grant. P. M. Gregory, B. and Nilsson, S.2009. “A High-Power Superconducting DC Cable,” IEEE Transactions on Applied Superconductivity, vol. 19, no. 3, June 2009, pp. 1756-1761.
Hatziargyriou, N.D., T. S. Karakatsanis, and M. Papadopoulos. 1993. “Probabilistic load flow in distribution systems containing dispersed wind power generation.” IEEE Transactions on Power Systems, vol. PWRS-8, pp. 159-165, February.
May 14, 2013 202
W E S T E R N E L E C T R I C I T Y C O O R D I N A T I N G C O U N C I L • W W W . W E C C . B I Z 1 5 5 N O R T H 4 0 0 W E S T • S U I T E 2 0 0 • S A L T L A K E C I T Y • U T A H • 8 4 1 0 3 - 1 1 1 4 • P H 8 0 1 . 5 8 2 . 0 3 5 3
Herman, D. 2003. “Comparison of Storage Technologies for Distributed Resource Applications.” Rept #1007301, Electric Power Research Institute, Palo Alto, CA. Heydt, G.T., V. Vittal, S. Malhara, Y. V. Makarov, N. Zhou, and P. V. Etingov. 2011. “The Characterization and Impact of Extreme Forecast Errors on Power Systems.” Journal of Electric Power Components and Systems, vol. 39, no. 15, pp. 1685-1700, Oct. 2011.
Himy, A. 1986. Silver-Zinc Battery, Phenomena and Design Principles. Vantage Press, Inc., Burlington, VT.
Hingorani, N.G. 1988. "Power Electronics in Electric Utilities: Role of Power Electronics in Future Power Systems." Invited Paper, Proceedings of the IEEE Special Issue, Vol. 76, No. 4, April 1988. Institute of Electrical and Electronics Engineers, Piscataway, NJ.
Hingorani, N.G., and L. Gyugyi. 2000. “'Understanding FACTS : concepts and technology of flexible AC transmission systems.” IEEE Press, New York. Hiskens, I.A. and R. J. Davy. 2001. “Exploring the Power Flow Solution Space Boundary.” IEEE Power Engineering Review, Vol. 21, No. 8, August 2001, pp. 57 – 57.
Hoffman P., P, H. Miller, and J. Kerth, 2008. “McIntosh CAES Experience NYSERDA-Columbia University Compressed Air Energy Workshop,” Compressed Air Energy Storage (CAES) Conference & Workshop, Columbia University, October 21-22, 2008. Columbia University, New York. Holbert, K. E. and G. T. Heydt. 2001. “Prospects For Dynamic Transmission Circuit Rating.” Proceedings of IEEE International Symposium on Circuits and Systems (ISCAS), Sydney, Australia, vol. 3, pp. 205–208, May 2001. Institute of Electrical and Electronics Engineers, Piscataway, NJ Available http://www.pserc.wisc.edu/documents/publications/papers/2001_general_publications/heydt-sydney01-4.pdf. Accessed November 7, 2012.
Holman, J. 2011. "Increasing transmission capacity," Wind Systems. Available windsystemsmag.com, pp. 50-53, Jan.
Holttinen, H., P. Meibom, A. Orths, F. Van Hulle, B. Lange, M. O’Malley, J. Pierik, B. Ummels, J.O. Tande, A. Estanqueiro, M. Matos, E. Gomez, L. Söder, G. Strbac, A. Shakoor, J. Ricardo, J.C. Smith, M. Milligan, and E. Ela. 2009, Design and operation of power systems with large amounts of wind power. Final Report IEA Wind Task 25 (2006-2008) ISBN 978-951-38-7308-0 VTT, Vuorimiehentie, Available http://www.vtt.fi/inf/pdf/tiedotteet/2009/T2493.pdf. Hou, J. et al. 2011. “Graphene-based Electrochemical Energy Conversion and Storage: Fuel Cells, Supercapacitors and Lithium Ion Batteries.” Phys. Chem. Chem. Phys., Vol. 13, pp. 15384-15402. Huang, D. Yinbiao Shu, Jiangjun Ruan, and Yi Hu. 2009. "Ultra High Voltage Transmission in China: Developments, Current Status and Future Prospects." In Proceedings of the IEEE , vol.97, no.3, pp.555-583, March 2009. Institute of Electrical and Electronics Engineers, Piscataway, NJ.
May 14, 2013 203
W E S T E R N E L E C T R I C I T Y C O O R D I N A T I N G C O U N C I L • W W W . W E C C . B I Z 1 5 5 N O R T H 4 0 0 W E S T • S U I T E 2 0 0 • S A L T L A K E C I T Y • U T A H • 8 4 1 0 3 - 1 1 1 4 • P H 8 0 1 . 5 8 2 . 0 3 5 3
Huang, H., V. Ramaswami, and D. Kumar. 2002. “Design Considerations of Ultra High Voltage DC System.” December 2002 Available http://www.ptd.siemens.de/050714_Design_Considerations_UHVDC.pdf. Accessed 10/31/2012. Huggins, R.A. ed. 2010. Energy Storage. Springer, US, 2010 Hughes, F.M., O. Anaya-Lara, N. Jenkins, et al. 2006. "A power system stabilizer for DFIG-based wind generation." IEEE Transactions on Power Systems, vol. 21, no. 2, pp. 763-772, May. Hyungchul, K., and C. Singh. 2002."Probabilistic security analysis using SOM and Monte Carlo simulation." In Proceedings of IEEE Power Engineering Society Winter Meeting, vol.2, pp. 755-760, 2002. Institute of Electrical and Electronics Engineers, Piscataway, NJ. Hydrogen Analysis Resource Center Website, Available http://hydrogen.pnl.gov/cocoon/morf/hydrogen/site_specific/fuel_heating_calculator?canprint=false Accessed 11/28/2012.
IEA Wind. 2011. “IEA Task 25, Power Systems with large Amounts of Wind Power.” Available http://www.ieawind.org/summary_page_25.html Accessed 11/26/2012.
IEEE. 2006. IEEE Standard 738-2006, IEEE Standard for Calculating the Current-Temperature of Bare Overhead Conductors, January 30, 2006. Institute of Electrical and Electronics Engineers, Piscataway, NJ
IEEE. 1990. Voltage Stability of Power Systems: Concepts, Analytical Tools, and Industry Experience. IEEE Special Publication 90TH0358-2-PWR, Institute of Electrical and Electronics Engineers, Piscataway, NJ. IEEE Excitation Limiters Task Force. 1995. “Recommended Models for Overexcitation Limiting Devices.” IEEE Transactions on Energy Conversion, vol 10. no. 4, pp. 706-712, December. IEEE Standards Association. 2011. “IEEE Guide for Design, Operation, and Integration of Distributed Resource Island Systems with Electric Power Systems.” Institute of Electrical and Electronics Engineers, Piscataway, NJ. July, 2011 Available http://ieeexplore.ieee.org/stamp/stamp.jsp?tp=&arnumber=5960751 Accessed 12/2/2012. IEEE Standard Dictionary of Electrical & Electronics Terms (ANS/IEEE Std 100-1977). 1997. IEEE Press, New York. Available http://ieeexplore.ieee.org/xpl/mostRecentIssue.jsp?punumber=4116785 Accessed 11/28/2012. International Council on Large Electric Systems – CIGRE (HVDC and Power Electronics) committee. Undated. “OVERVIEW OF FLEXIBLE AC TRANSMISSION SYSTEMS, FACTS.”Available http://www.google.com/url?sa=t&rct=j&q=&esrc=s&frm=1&source=web&cd=1&ved=0CDAQFjAA&url=http%3A%2F%2Fb4.cigre.org%2Fcontent%2Fdownload%2F1973%2F25265%2Fversion%2F2%2Ffile%2FFACTS%2Boverview_Cigr%25C3%25A9%2BB4_What%2Bis%2BFACTSID10VER39.pdf&ei=cDGcUJaHDMvqiwKLgoGYAQ&usg=AFQjCNHv8TfBNxEet81m4Q8nF5oJh6943A&sig2=T4SP_jhylZNW2GUCunx-1w. Accessed 11/20/2012.
May 14, 2013 204
W E S T E R N E L E C T R I C I T Y C O O R D I N A T I N G C O U N C I L • W W W . W E C C . B I Z 1 5 5 N O R T H 4 0 0 W E S T • S U I T E 2 0 0 • S A L T L A K E C I T Y • U T A H • 8 4 1 0 3 - 1 1 1 4 • P H 8 0 1 . 5 8 2 . 0 3 5 3
Intrator, J. et al. 2011. 2020 Strategic Analysis of Energy Storage in California. Public Interest Energy Research (PIER) Program, California Energy Commission, University of California, Berkeley, CA. Irisarri, G.D., X. Wang, J. Tong, and S. Mokhtari. 1997. “Maximum Loadability of Power Systems Using Interior Point Non-linear Optimization Method." IEEE Transactions on Power Systems, vol. 12, no. 1, pp. 162-172, Feb. 1997.
Irving, P. 2011. “Power Generation from an Integrated Biomass Reformer and Solid Oxide Fuel Cell.” In DOE Hydrogen and Fuel Cells Program Annual Progress Report, DOE, editor, Washington, D.C. InnovaTek, Inc., Richland, WA p. 901-904. ISO/RTO Council Planning Committee. 2006. Phase I Transmission Planning Report. March 20, 2006. Available http://www.iso-ne.com/pubs/spcl_rpts/2006/irc_pc_planning_report.pdf. Accessed 11/5/2012.
Itron. 2010. Impacts of Distributed Generation. Prepared for California Public Utilities Commission by Itron Inc., Davis, CA, January 2010, pp. 3-7. Available www.cpuc.ca.gov/NR/rdonlyres/750FD78D-9E2B-4837-A81A-6146A994CD62/0/ImpactsofDistributedGenerationReport_2010.pdf Accessed 11/27/2012.
Jarjis, J. and F.D. Galiana. 1981. “Quantitative Analysis of Steady State Stability in Power Networks.” IEEE Transactions on Power Apparatus and Systems, vol. PAS-100, no. 1, pp. 318-326, January 1981.
Joerissen, L., J. Garche, Ch Fabjan, and G. Tomazic. 2004. “Possible use of vanadium redox-flow batteries for energy storage in small grids and stand-alone photovoltaic systems.” J. Power Sources, vol. 127, pp. 98-104. Johnson, R.C. 2011. “Gasoline, diesel or pumpable electrons.” Electronic Engineering Times. 2011. p. 22-28.
Jossen, A., and D.U. Sauer. 2006. “Advances in Redox-Flow batteries.” First International Renewable Energy Storage Conference,October 30-31, 2006, Gelsenkirchen, Germany. Kaizuka, T. and T. Sasaki. 2001. “Evaluation of control maintaining electric power quality by use of rechargeable battery system" in Power Engineering Society Winter Meeting pp. 88-93 vol.1. Institute of Electrical and Electronics Engineers, Piscataway, NJ., Kalsi, S., D. Madura, R. Howard, G. Snitcbler, T. MacDonald, D. Bradshaw. I. Grant, and M. lngram. 2003. “Superconducting Dynamic synchronous condenser For Improved Grid Voltage Support.” 2003 IEEE T&D Conference, Dallas, Texas. Institute of Electrical and Electronics Engineers, Piscataway, NJ. Sep. 2003
Karpinski, A,,et al. 1999. “Silver–zinc: status of technology and applications,” Journal of Power Sources 80, p 53-60.
Karystianos, M.E., N. G. Maratos, and C. D. Vournas. 2007.“Maximizing Power-System Loadability in the Presence of Multiple Binding Complementarity Constraints.” IEEE Trans. on Circuits and Syst. I: Regular Papers, Vol. 54, No. 8, pp: 1775 – 1787.
May 14, 2013 205
W E S T E R N E L E C T R I C I T Y C O O R D I N A T I N G C O U N C I L • W W W . W E C C . B I Z 1 5 5 N O R T H 4 0 0 W E S T • S U I T E 2 0 0 • S A L T L A K E C I T Y • U T A H • 8 4 1 0 3 - 1 1 1 4 • P H 8 0 1 . 5 8 2 . 0 3 5 3
Kataoka, Y. and Y. Shinoda. 2005. “Voltage stability limit of electric power systems with generator reactive power constraints considered.” IEEE Trans. Power Syst., Vol. 20, No. 2, pp. 951–962, May 2005. Kaye, R. and F. Wu. 1982. “Dynamic Security Regions of Power Systems.” IEEE Trans. on Circ. and Syst., Vol. 29, No. 9, Sept. 1982, pp. 612– 623. Kazaryan, S.A., S.N. Razumov, and S.V. Litvinenko. 2006. “Mathematical Model of Heterogeneous Electrochemical Capacitors and Calculation of Their Parameters,” J. Electrochemical. Society., Vol. 153, pp. A1655. Keane, A., M. R. Milligan, C. J. Dent, B. Hasche, C. D’Annunzio, K. Dragoon, H. Holttinen, N. Samaan, L. S¨oder, and M. O’Malley. 2011. “Capacity value of wind power.” IEEE Transactions on Power Systems, vol. 26, pp. 564–572, May.
Kear, G., A.A. Shah, and F.C .Walsh. 2011.“Development of the all‐vanadium redox flow battery for energy storage: a review of technological, financial and policy aspects.” Int. J. Energy Res. 2011, DOI: 10.1002/er.1863. Kim, J.H. et al. 2011. “Effect of carbon types on the electrochemical properties of negative electrodes for Li-ion capacitors.” J. Power Sources, 196:p. 10490-10495. Kinter-Meyer, M., Balducci, P., Colella, W., Elizondo, M., Jin, C., Nguyen, T., Viswanathan, V., and Zhang, Y, 2012, “National Assessment of Energy Storage for Grid Balancing and Arbitrage: Phase 1, WECC”, PNNL-21388, Pacific Northwest National Laboratory, Richland, WA. Available http://energyenvironment.pnnl.gov/pdf/PNNL-21388_National_Assessment_Storage_Phase_1_final.pdf. Accessed 12/2/2012. Kirby, B.J. 2003. “Spinning Reserve From Responsive Loads.” Oak Ridge National Laboratory, Oak Ridge, TN March 2003. Kirschner, L., Retzmann, D., Thumm, G., and Siemens AG., 2005, "Benefits of FACTS for Power System Enhancement", IEEE PES Transmission and Distribution Conference & Exhibition,pp. 1-7. Kontorovich, A.M., A.V. Kryukov, Y.V. Makarov, et al. 1988. Methods of stability indices computations for complicated power systems. Publishing House of the Irkutsk University, Irkutsk, 1988 --- in Russian. Kontorovich, A.M. and Y. V. Makarov. 1989. “A permanent loading technique for fast analysis of power system stability limit load flows.” Proceedings of USSR National Scientific and Technical Conference “Problems of Stability and Reliability of the USSR Power System”, Dushanbe, 1989 – In Russian. Kontorovich, A.M., Y.V. Makarov and A. A. Tarakanov. 1982. "Improvements of a Permanent Loading Technique to Compute Load Flows on Stability Margin." Trudy LPI, No. 380, pp. 37-41, 1982 – in Russian.
Kothari, D.P., and I.J. Nagarath. 2011. Modern Power System Analysis(4th Edition). McGraw Hill Press, Columbus, OH.
May 14, 2013 206
W E S T E R N E L E C T R I C I T Y C O O R D I N A T I N G C O U N C I L • W W W . W E C C . B I Z 1 5 5 N O R T H 4 0 0 W E S T • S U I T E 2 0 0 • S A L T L A K E C I T Y • U T A H • 8 4 1 0 3 - 1 1 1 4 • P H 8 0 1 . 5 8 2 . 0 3 5 3
Kravchuk, L., and J. Pierce. 2009. Transient Stability Analysis of a System with Wind Generation. MS Project, Dept. of Electrical and Electronic Engineering, University of California, Sacramento, CA. Kroposki, B. 2009. “Renewable Energy Interconnection and Storage - Technical Aspects.” NREL, Golden, CO. Presentation, Available http://www.sandia.gov/regis/presentations/B_Kroposki-NREL.pdf. Accessed November 10, 2012.
Kroposki, B., T. Basso, and R. DeBlasio. 2008.“Microgrid standards and technologies.” IEEE Power and Energy Society General Meeting - Conversion and Delivery of Electrical Energy in the 21st Century, Pittsburgh, PA, 20-24 July 2008, pp. 1-4. Institute of Electrical and Electronics Engineers, Piscataway, NJ. Kumar, R., A. Ipahchi, V. Brandwajan, M. A. El-Sharkawi, and G. Cauley. 1991. “Neuron Networks for Dynamic Security Assessment of Large Scale Power Systems: Requirements Overview.” In Proceedings of 1st International Forum on Applications of Neuron Networks to Power Systems, Seattle, WA, pp. 65-71, July 1991. Institute of Electrical and Electronics Engineers, Piscataway, NJ. Kundur, P. 1994. Power System Stability and Control. McGraw-Hill, New York. Kurita, A., and T. Sakurai. 1988. “The Power System Failure on July 23, 1987 in Tokyo.” In Proceedings of the 27th Conference on Decision and Control, December 1988. Institute of Electrical and Electronics Engineers, Piscataway, NJ.
Kurth, R.D., Robert B. Henderson, R.S. Burton, Brent S. Hancock, and James N. Roik. 2005. Design, Implementation and Commissioning of a Remedial Action Scheme. DistribuTECH Conference and Exhibition, January 25-27, 2005 Available http://www.teshmont.com/pdf/papers/Distributech%202005%20Paper.pdf Accessed 11/28/2012.
Labbate, A., and G. Fulli. 2010. "Modeling and application of VSC-HVDC in the European Transmission System." International Journal of Innovations in Energy Systems and Power, vol. 5, no. 1, pp. 8-16, April. Labeau, P.E., C. Smidts, and S. Swaminathan. 2000. "Dynamic reliability: towards an integrated platform for probabilistic risk assessment." Reliability Engineering & System Safety, vol. 68, pp. 219-254, 2000.
Lalor, G., A. Mullane, and M. O’Maley. 2005. “Frequency Control and Wind Turbine Technology.” IEEE Transactions on Power Systems, vol. 20, no. 4. Lam, L.T., et al. 2007. “VRLA Ultrabattery for high-rate partial-state-of-charge operation.” J. Power Sources, 174:p. 16-29. Larruskain, D.M. et al., 2005. “Transmission and Distribution Networks: AC versus DC.” In Proceedings 9th Spanish-Portuguese Congress on Electrical Engineering, Power Engineering Society, Marbella, Spain. Larruskain, D.M., I. Zamora, O. Abarrategui, A. Iraolagoitia, M. D. Gutiérrez, E. Loroño, and F. de la Bodega. 2007. “Power Transmission Capacity Upgrade of Overhead Lines.” Department
May 14, 2013 207
W E S T E R N E L E C T R I C I T Y C O O R D I N A T I N G C O U N C I L • W W W . W E C C . B I Z 1 5 5 N O R T H 4 0 0 W E S T • S U I T E 2 0 0 • S A L T L A K E C I T Y • U T A H • 8 4 1 0 3 - 1 1 1 4 • P H 8 0 1 . 5 8 2 . 0 3 5 3
of Electrical Engineering, E.U.I.T.I., University of the Basque Country, Available http://www.icrepq.com/icrepq06/296_Larruskain.pdf. Accessed 11/20/2012. Larsson, S. and Danell, A. 2006. The Black-Out In Southern Sweden and Eastern Denmark. IEEE Power Systems Conference and Exposition,” pp. 309-313. Le, X., P.M.S. Carvalho, L.A.F.M. Ferreira, J. Liu, B.H. Krogh, N. Popli, and M.D. Ilić. 2010. “Wind Integration in Power Systems: Operational Challenges and Possible Solutions.” Proceedings of the IEEE, vol. 99, no. 1, Oct. 21. IEEE, Piscataway, NJ. Leclercq, L., C. Sudemont, B. Robyns, G. Cimuca, and M.M. Rabulescu. 2003. “Flywheel Energy Storage System to Improve the Integration of Wind Generators into a Network.” In Proceedings of 5th International Symposium on Advanced Electromechanical Electromotion Systems ELECTROMOTION 2003, Marrakesh, Marocco, November 26-28, 2003. Lee, S.T. 2003. “Community Activity Room as a New Tool for Transmission Operation and Planning Under a Competitive Power Market.” In Proceedings of 2003 IEEE Bologna Power Tech Conf., Vol. 4, June 23-26, 2003. Institute of Electrical and Electronics Engineers, Piscataway. NJ.
Leite da Silva, A.M., V.L. Arienti, and R.N. Allan. 1990. “Probabilistic Load Flow Techniques Applied To Power System Expansion Planning.” IEEE Transactions on Power Systems, vol. 5, no. 4, pp. 1047- 1053, November 1990.
Leite da Silva, A.M., V.L. Arienti, and R.N. Allan 1984. "Probabilistic Load Flow Considering Dependence Between Input Nodal Powers." IEEE Transactions on Apparatus and Systems, PAS-103, pp. 1524-1530, June 1984.
Leite da Silva, A.M., L.A.F. Manso, Sales, W.S. Resende, L.C. Aguiar, M.J.Q Matos, M.A. Lopes, J.A. Peças and Miranda, V. 2004. “Application of Monte Carlo simulation to generating system well-being analysis considering renewable sources.” International conference on probabilistic methods applied to power systems, pp. 439-444, Sept. 2004. Leite da Silva, A.M., A.C.G. Melo and S.H.F. Cunha. 1991. "Frequency and duration method for reliability evaluation of large-scale hydrothermal generating systems." IEEE Proceedings C: Generation, Transmission and Distribution, vol.138, no.1, pp.94-102, Jan. 1991. Institute of Electrical and Electronic Engineers, Piscataway, NJ. Leite da Silva, A.M., L.C. Resende, L.A.F. Manso and R. Billinton. 2004. “Well-being analysis for composite generation and transmission systems.” IEEE Transactions on Power Systems, vol. 19, no. 4, pp. 1763-1770, Nov. 2004. Lescale, V.F., A. Kumar, L.-E. Juhlin, H. Björklund, and K. Nyberg. 2008. “Challenges with Multi-Terminal UHVDC Transmissions.” POWERCON 2008 & 2008 IEEE Power India Conference, New Delhi, India, October 12-15, 2008. Institute of Electrical and Electronics Engineers, Piscataway, NJ. Lewis, H. and A.J. Salkind. 1997. “Cellulosic separator applications: new and improved separators for alkaline rechargeable cells,” J. Power Sources, 65, p. 29-38.
Lex, P. 2005, Demonstration of a 2-MWh Peak Shaving Z-BESS.
May 14, 2013 208
W E S T E R N E L E C T R I C I T Y C O O R D I N A T I N G C O U N C I L • W W W . W E C C . B I Z 1 5 5 N O R T H 4 0 0 W E S T • S U I T E 2 0 0 • S A L T L A K E C I T Y • U T A H • 8 4 1 0 3 - 1 1 1 4 • P H 8 0 1 . 5 8 2 . 0 3 5 3
Li, H., and Z. Chen. 2008. "Overview of different wind generator systems and their comparisons." IET Renewable Power Generation, vol. 2, no. 2, pp. 123-138. Li, L. et al. 2011. “A Stable Vanadium Redox-Flow Battery with High Energy Density for Large-Scale Energy Storage.” Adv. Energy Mater., vol. 1, pp. 394-400. Li, P., Y. Yu, H. Jia, J. Su, and J. Zhao. 2002. “A Study on Boundary of Small Disturbance Stability Region.” In Proceedings International Conf. on Power Syst. Technology PowerCon 2002, Vol. 2, Oct.13-17, 2002, pp. 1228 -1232. Institute of Electrical and Electronics Engineers, Piscataway, NJ. Li, W. 2005. Risk Assessments of Power Systems - Models, Methods, and Applications. Ch 6, pp. 150, John Wiley & Sons, Hoboken, New Jersey, 2005.
Li, W. and P. Choudhury. 2007. “Probabilistic Transmission Planning.” IEEE Power and Energy Magazine, vol. 5, no. 5, pp. 46-53, Sept-Oct 2007.
Li, Y. and V. Venkatasubramanian. 2004. "Coordination of Transmission Path Transfers." IEEE Trans. on Power Syst., Vol. 19, Issue. 3, Aug. 2004. Lin, J., G. Damato, and P. Hand. 2011. “Energy Storage—a Cheaper, Faster, & Cleaner Alternative to Conventional Frequency Regulation.” CESA, editor. Strategen Consulting, Berkeley, CA. Lin, Y. 2012. “Introduction to Generic Wind Turbine Generator Models.” May, 2011, Siemens Energy, Inc. Available https://www.pti-us.com/pti/company/enewsletter/2011may/pdfs/Introduction%20to%20Generic%20Wind%20Models.pdf Accessed 11/8/2012 Lindahl, S. 2004.“Case studies of recent blackouts.” CRIS International Workshop on Power System Blackouts ~ Causes, Analyses, and Countermeasures, Lund, Sweden, May 3, 2004.
Linden, D. 1995. Handbook of Batteries. ed. D. Linden. McGraw-Hill, New York. Lindgren, G. and H. Rootzen. 1987. “Extreme values: Theory and technical applications.” Scandinavian Journal of Statistics, Theory and Applications 14:241–279 Lings, R. 2005. "Overview of transmission lines above 700 kV." Power Engineering Society Inaugural Conference and Exposition in Africa, vol., no., pp.33-43, 11-15 July 2005. Institute of Electrical and Electronics Engineers, Piscataway, NJ. Liu, H. and J. Jiang. 2007. “Flywheel energy storage – An upswing technology for energy sustainability,” Energy and Buildings, pp. 599-601. Löf, P.A., T. Smed, G. Andersson, and D.J. Hill. 1992. “Fast Calculation of a Voltage Stability Index.” IEEE Trans. on Power Syst., Vol. 7, No. 1, pp. 54–64, Feb. 1992.
Long, J.W. 2008. “Electrochemical Capacitors Empowering the 21st Century.” The Electrochemical Society Interface, Spring, p. 33.
May 14, 2013 209
W E S T E R N E L E C T R I C I T Y C O O R D I N A T I N G C O U N C I L • W W W . W E C C . B I Z 1 5 5 N O R T H 4 0 0 W E S T • S U I T E 2 0 0 • S A L T L A K E C I T Y • U T A H • 8 4 1 0 3 - 1 1 1 4 • P H 8 0 1 . 5 8 2 . 0 3 5 3
Lu, N, Makarov, Y.V, Weimar, M. R, Rudolph, F., Murthy, S, Arseneaux, J, Loutan, C, and Chowdhury, S. 2010, The Wide-Area Energy Storage and Management System Phase II, Final Report-Flywheel Field Tests.PNNL-19669, Pacific Northwest National Laboratory, Richland, WA. Available http://www.pnl.gov/main/publications/external/technical_reports/PNNL-19669.pdf. Accessed 12/2/2012. Lu, S., Y. V. Makarov, C. A. McKinstry, A. J. Brothers, and S. Jin. 2009. Low Probability Tail Event Analysis and Mitigation in BPA Control Area. PNNL-18769, Pacific Northwest National Laboratory, Richland, WA. Available http://www.pnl.gov/main/publications/external/technical_reports/PNNL-18769.pdf. Accessed 11/15/2012.
Lu, W. and B. T. Ooi. 2001, “Multi-Terminal DC Transmission System For Wind-Farms.” IEEE Power Engineering Society Winter Meeting, vol.3, Columbus, OH , Jan. 28 – Feb. 1, vol.1, pp.1091-1096.
Lucas, G. and H. Miller. 2010. “Dresser-Rand’s SMARTCAES Compressed Air Energy Storage Solution.” 2nd Compressed Air Energy Storage Conference & Workshop, Columbia University, New York, October 20 & 21, 2010 Macchi, E. and G. Lozza. 1987. “A study of Thermodynamic performance of CAES plants, including unsteady effects.” Presented at the Gas Turbine Conference and Exhibition, Anaheim, California, May 31-June 4, 1987. American Society of Mechanical Engineers, New York.
Madaeni, S.H., R. Sioshansi, and P. Denholm. 2012. “Estimating the capacity value of concentrating solar power plants: A case study of the southwestern united states.” IEEE Transactions on Power Systems, vol. 27, no. 2, pp. 1116-1124. Madaeni, S.H., R. Sioshansi, and P. Denholm. 2012. “Estimating the Capacity Value of Concentrating Solar Power Plants With Thermal Energy Storage: A Case Study of the Southwestern United States.” IEEE Transactions on Power Systems, vol. PP, no. 99, 2012.
Madrigal, M., K. Ponnambalam, and V.H. Quintana. 1998. “Probabilistic optimal power flow.” In Proceedings of IEEE Canadian Conference on Electrical and Computer Engineering, vol. 1, pp. 385-388, May. Institute of Electrical and Electronics Engineers, Piscataway, NJ.
Maher, M. and V. VanZandt. 2009. “Opportunity -Smart Grid Investment Grant. The Western Interconnection Synchrophasor Program (WISP): Western Interconnect Synchrophasor Program NASPI Roadmap.” Status Briefing for the WECC Board of Directors, Oct. 22, 2009. Available http://www.wecc.biz/committees/BOD/102109/Lists/Presentations/1/09%20SynchroPhasor%20Presentation.pdf. Accessed 11/15/2012.
Makarov, Y,V., P.V. Etingov, N. Zhou, J. Ma, N.A. Samaan, R. Diao, S. Malhara, R.T. Guttromson, P. Du, and C. Sastry. 2010a. Analysis Methodology for Balancing Authority Cooperation in High Penetration of Variable Generation. PNNL-19229, Pacific Northwest National Laboratory, Richland, WA.. Available http://www.pnl.gov/main/publications/external/technical_reports/PNNL-19229.pdf. Makarov, Y,.V., S. Lu, X. Guo, J.F. Gronquist, P. Du, T.B. Nguyen, and J.W. Burns. 2010b. Wide Area Security Region Final Report. PNNL-19331, Pacific Northwest National Laboratory,
May 14, 2013 210
W E S T E R N E L E C T R I C I T Y C O O R D I N A T I N G C O U N C I L • W W W . W E C C . B I Z 1 5 5 N O R T H 4 0 0 W E S T • S U I T E 2 0 0 • S A L T L A K E C I T Y • U T A H • 8 4 1 0 3 - 1 1 1 4 • P H 8 0 1 . 5 8 2 . 0 3 5 3
Richland, WA. March. Available http://www.pnl.gov/main/publications/external/technical_reports/PNNL-19331.pdf. Makarov, Y.V., J. Ma, S. Lu, and T. B. Nguyen, 2008a. Assessing the Value of Regulation Resources Based on Their Time Response Characteristics. PNNL-17632, Pacific Northwest National Laboratory, Richland, WA. Makarov, Y.V., J.H. Pease, C. Loutan, T. VanBlaricom, and C. Potter. 2008b. Notes on Visit to Red Eléctrica de España (REE). PNNL-17680, Pacific Northwest National Laboratory, Richland, WA, July 2008. Makarov, Y.V., B. Yang, J. DeSteese, S. Lu, C. Miller, P. Nyeng, J. Ma, D. Hammerstrom, V. Viswanathan. 2008c. Wide-Area Energy Storage and Management System to Balance Intermittent Resources in the Bonneville Power Administration and California ISO Control Areas. PNNL-17574, Pacific Northwest National Laboratory, Richland, WA. June 2008. Available http://www.pnl.gov/main/publications/external/technical_reports/PNNL-17574.pdf Accessed 12/3/12.
Makarov, Y.V., D.J. Hill, and Z.Y. Dong. 2000a. “Computation of Bifurcation Boundaries for Power Systems: A New Δ-Plane Method.” IEEE Trans. on Circ. and Syst. I: Fundamental Theory and Applications, Vol. 47, Issue 4, April 2000, pp. 536 –544. Makarov, Y.V., D.J. Hill, and I.A. Hiskens. 2000b. “Properties of Quadratic Equations and Their Application to Power System Analysis.” Electrical Power and Energy Syst., 22 (2000), pp. 313-323. Makarov, Y.V., Q. Wu, D.J. Hill, D.H. Popovic and Z.Y. Dong. 1997. “Coordinated Steady-State Voltage Stability Assessment and Control.” In Proceedings of International Conference on Advances in Power System Control, Operation and Management APSCOM'97, Wanchai, Hong Kong, November 11-14, 1997. Institute of Electrical and Electronics Engineers, Piscataway, NJ.
Makarov, Y.V., V.A. Maslennikov, and D.J. Hill. 1995.“Calculation of Oscillatory Stability Margins in the Space of Power System Controlled Parameters.” In Proceedings of the International Symposium on Electric Power Engineering Stockholm Power Tech, Vol. Power Systems, Stockholm, Sweden, pp. 416-422, June 1995. Institute of Electrical and Electronics Engineers, Piscataway, NJ. Makarov, Y.V., and I. A. Hiskens. 1994. “A continuation method approach to finding the closest sad-dle node bifurcation point.'' In Proceedings of NSF/ECC Workshop on Bulk Power System Voltage Phenomena III, Davos, Switzerland, August 1994. ECC Inc., Fairfax, Virginia. Mansour, Y., A.Y. Chang, J. Tamby, E. Vaahedi, B.R. Corns, and M.A. El-Sharkawi. 1997. “Large Scale Dynamic Security Screening and Ranking Using Neuron Networks.” IEEE Transactions on Power Systems, vol. 12, no. 2, pp. 954-960, May.
Maria, G.A., C. Tang, and J. Kim. 1990. “Hybrid Transient Stability Analysis [Power Systems].” IEEE Transactions on Power Systems, vol. 5, no. 2, pp. 384–393. Martin, L. 2010. “Grid Integration of Large Scale Wind and Solar.” Siemens presentation, Asia Pacific Clean Energy Summit and Expo, Honolulu, Hawaii, Aug 30–Sept. 2, 2010. Available http://www.ct-si.org/events/APCE/ State of Hawaii, Honolulu, Hawaii.
May 14, 2013 211
W E S T E R N E L E C T R I C I T Y C O O R D I N A T I N G C O U N C I L • W W W . W E C C . B I Z 1 5 5 N O R T H 4 0 0 W E S T • S U I T E 2 0 0 • S A L T L A K E C I T Y • U T A H • 8 4 1 0 3 - 1 1 1 4 • P H 8 0 1 . 5 8 2 . 0 3 5 3
Masiello, R. 2004. “Utilities Must Leverage Existing Resources and Upgrade Technology to Avoid Future Blackouts.” Electric Energy T&D Magazine, pp. 44-47. May/June. Matveev, V.A. 1964. “A Method of Numeric Solution of Sets of Nonlinear Equations.” Zhurnal Vychislitelnoi Matematiki I Matematicheskoi Fiziki, vol. 4, no. 6, pp. 983-994, 1964 - in Russian.Van Cutsem, T. and C. Vournas. 1998. “Voltage Stability of Electric Power Systems.” Kluwer Academic Publishers (Power Electronics and Power Systems Series), Boston, Mass.
Maxwell, M., and M. Cohen. 2011. “PEM Fuel Cell Systems Providing Backup Power to Commercial Cellular Towers and an Electric Utility Communications Network.” In DOE Hydrogen and Fuel Cells Program Annual Progress Report, DOE, Washington, D.C. Editor. Intelligent Energy, Long Beach CA. p. 1304-1307. Mayadas-Dering, J. 2009. “NY Utility Examines Integrating Dynamic Line Ratings.” Utility Automation & Engineering T&D Magazine, July Vol 14, Issue 7.
. McCall, J. 2009. “DC Superconductor Cables for Long Distance Transmission.” American Superconductor presentation, Fall EEI Transmission, Distribution, & Meeting Conference, Kansas City, KS. http://www.eei.org/meetings/Meeting%20Documents/2009FallTDM-3-McCall,%20Jack.pdf. Accessed 11/20/2012. McCall, J. Gamble, B. and Eckroad, S. 2010 “Combining Superconductor cables and VSC HVDC Terminals for Long Distance Transmission,” IEEE Conference on Innovative Technologies for an Efficient and Reliable Electricity Supply (CITRES), Sept 2010, pp. 47-54.
McCalley, J.D., S. Wang, Q. L. Zhao, G. Z. Zhou, R.T. Treinen, and A. D. Papalexopoulos. 1997. “Security Boundary Visualization for Systems Operation.” IEEE Trans. on Power Syst., Vol. 12, No. 2, May 1997. Institute of Electrical and Electronics Engineers, Piscataway, NJ, pp. 940-947. McCalley, D., and V. Vittal. 1998. Risk-based Security Assessment. EPRI Final Report W08604-01, Electric Power Research Institute, Palo Alto, CA, Dec. 1998.
McDonough, R.N., and Anthony D. Whalen.1995. “Detection of Signals in Noise.” Academic Press, San Diego, California. Measure, B.A., R. Whiting, W. B. Booth, James A. Yost, T. Karier, P. Rockefeller, B. Bradbury, and J. M. Dukes. 2011. “Wind Integration Forum Steering Committee Meeting Notes, June 6, 2011.” Available http://www.nwcouncil.org/energy/wind/meetings/2011/06/WIF%20SC%206-11%20Notes%20Final.pdf Accessed 11/8/2012. Meegahapola, L, T. Littler, B. Fox, J. Kennedy, and D. Flynn. 2010. “Voltage and Power Quality Improvement Strategy for a DFIG Wind Farm during Variable Wind Conditions.” In Proceedings of the International Symposium Modern Electric Power Systems (MEPS), Wroclaw, Poland, Sept. 20-22, 2010. Institute of Electrical and Electronics Engineers, Piscataway, NJ.
Meliopoulos, A.P. Sakis, G. J. Cokkinides, and X.Y. Chao. 1990. "A new probabilistic power flow analysis method." IEEE Transactions on Power Systems, vol. 5, no. 1, pp. 182-190, Feb
May 14, 2013 212
W E S T E R N E L E C T R I C I T Y C O O R D I N A T I N G C O U N C I L • W W W . W E C C . B I Z 1 5 5 N O R T H 4 0 0 W E S T • S U I T E 2 0 0 • S A L T L A K E C I T Y • U T A H • 8 4 1 0 3 - 1 1 1 4 • P H 8 0 1 . 5 8 2 . 0 3 5 3
Mensah-Bonsu, C. 2000. “Instrumentation and Measurement of Overhead Conductor Sag using the Differential Global Positioning Satellite System.” Doctoral Dissertation, Dept. Philosophy, Arizona State University, Tempe, AZ.
Midwest ISO. 2011. “Proposed Multi Value Project Portfolio.” Midwest ISO Presentation, Business Case Workshop, September 29, 2011. MISO, Carmel, IN. Available https://www.midwestiso.org/Library/Repository/Meeting%20Material/Stakeholder/MVP/2011%20MVP/20110919/20110919%20MVP%20Proposed%20Portfolio%20Business%20Case.pd. Accessed 11/20/2012.
Miller, N., K. Clark, and M. Shao. 2010. “Impact of frequency responsive wind plant controls on grid performance. Transmission planning for wind energy: status and prospects.” Proceedings of the 9th International Workshop on Large Scale Integration of Wind Power and Transmission Networks for Offshore Wind Farms, pp. 348-355, October 2010. Hydro Quebec, Quebec, Canada. Milligan, M.R. 1996. Measuring wind plant capacity value. Tech. Rep. NREL/TP-441-20493, National Renewable Energy Laboratory, Golden, CO.
Milligan, M.R., and T. Factor. 2000. “Optimizing the geographic distribution of wind plants in Iowa for maximum economic benefit and reliability.” Wind Engineering, vol. 24, pp. 271–290, July. Milligan, M.R., and B. Parsons. 1999. “Comparison and case study of capacity credit algorithms for wind power plants.” Wind Engineering, vol. 23, pp. 159–166, May. Milligan, M.R. and K. Porter. 2006. “The capacity value of wind in the United States: Methods and implementation.” The Electricity Journal, vol. 19, pp. 91–99, March.
Mitlitsky, F. et al. 1998. “Unitized Regenerative Fuel Cell Systems.” In 1998 Fuel Cell Seminar. 1998. Palm Springs, CA.
Mizumori, M. and B. Nickell. 2008. “Balancing Authority Proliferation.” RPIC Meeting, WECC, November 13, 2008. Available http://www.wecc.biz/committees/BOD/RPIC/111308/Lists/Agendas/1/7_BA%20Proliferation.pdf. Accessed 11/15/2012. Mokhoff, N. 2011. “Smart grid: slow buildout begins.” Electronic Engineering Times, pp. 22-28.
Molinski, T. 1996. “Geomagnetically Induced Currents: Cause, Effect, and Mitigation.” IEEE Canadian Review, no. 25, pp. 11-14, Fall. Morales, J.M., and J. P´erez-Ruiz. 2005. “Point estimate schemes to solve the probabilistic power flow.” IEEE Transactions on Power Systems, vol. 22, no. 4, November.
Morgan, M., I. Dobson, R. Adapa, B. Carreras, V. Dawar, M. Kumbale, R. Hardiman, L. Hwang, B. Lesieutre, J. Kim, Y. Makarov, N. Samaan, D. Newman, and S.Varadan. 2011. Extreme Events Phase 2. Prepared for the California Energy Commission by Pacific Northwest National Laboratory, University of Wisconsin-Madison, Electric Power Research Institute, BACV Solutions, Southern Company, CIEE/PIER, University of Alaska – Fairbanks, and KEMA. CEC-
May 14, 2013 213
W E S T E R N E L E C T R I C I T Y C O O R D I N A T I N G C O U N C I L • W W W . W E C C . B I Z 1 5 5 N O R T H 4 0 0 W E S T • S U I T E 2 0 0 • S A L T L A K E C I T Y • U T A H • 8 4 1 0 3 - 1 1 1 4 • P H 8 0 1 . 5 8 2 . 0 3 5 3
MR-08-03. Available http://uc-ciee.org/downloads/Extreme_Events_Phase_21.pdf Accessed 11/26/2012. Morton, A.B. 2009. "Wind turbines and oscillatory stability in power systems: towards a general approach." In Proceedings of the 2009 Australasian Universities Power Engineering Conference (AUPEC 2009), pp. 6, 2009. Institute of Electrical and Electronics Engineers, Adelaide, SA.
Muljadi, E., C.P. Butterfield, B. Parsons, et al. 2007. "Effect of variable speed wind turbine generator on stability of a weak grid." IEEE Transactions on Energy Conversion, vol. 22, no. 1, pp. 29-36. Murty, M.S.R. undated. “Wind Turbine Generator Model.” Available http://www.sari-energy.org/PageFiles/What_We_Do/activities/CEB_Power_Systems_Simulation_Training,_Colombo,_Sri_Lanka/Course_ppts/Wind_TG_Model.pdf Accessed 11/27/2012.
Myska, D. 2009. “Allocation Algorithm Review.” In Proceedings of 2nd Workshop for Market Participants, Central Allocation Office GmbH, Munich, Germany, August 12, 2009. Available http://central-ao.com/images/stories/upload/workshopII/details_on_capacity_allocation_algorithm.pdf. Accessed 11/15/2012.
Nakhamkin, M. “Second Generation of the CAES Technology.” Compressed Air Energy Storage (CAES) Conference & Workshop, Columbia University, October 21-22, 2008. Columbia Univesity, New York.
Nakhamkin, M., M. Chiruvolu, and C. Daniel. 2007. “Available Compressed Air Energy Storage (CAES) Plant Concepts.” Available www.espcinc.com/library/PowerGen_2007_paper.pdf. Accessed 11/20/2012. Nakhamkin, M., M. Chiruvolu, M. Patel, S. Byrd, and R. Schainker. 2009. “Second Generation of CAES Technology: Performance, Operations, Economics, Renewable Load Management, Green Energy.” POWER-GEN International, December 8-10, 2009. Energy Storage Power Corporation, Las Vegas Convention Center, Las Vegas, NV. Nakhamkin, M., B. Kraft, and C. Moran. 2010. “Advanced Second Generation of CAES Technology 180 MW, 310 MW and 450 MW CAES Plants.” 2nd Compressed Air Energy Storage (CAES) Conference & Workshop, Columbia University, October 20-21, 2010, New York State Energy Research and Development Authority, New York City, NY.
Naoi, K. 2010. “NAnohybri Capacitor: The Next Generation Electrochemical Capacitors.” Fuel Cells, 10(5): p. 825-833.
Naoi, K. 2007. “Available Compressed Air Energy Storage (CAES) Plant Concepts.” Presented at PowerGen 2007. Available www.espcinc.com/library/PowerGen_2007_paper.pdf. Naoi, K., and N. Anohybri. 2010. “Capacitor: The Next Generation Electrochemical Capacitors.” Fuel Cells, 10(5):p. 825-833. Naoi, K. and M. Morita. 2008. “Advanced Polymers as Active Materials and Electrolytes for Electrochemical Capacitors and Hybrid Capacitor Systems.” The Electrochemical Society Interface, Spring: p. 44-48.
May 14, 2013 214
W E S T E R N E L E C T R I C I T Y C O O R D I N A T I N G C O U N C I L • W W W . W E C C . B I Z 1 5 5 N O R T H 4 0 0 W E S T • S U I T E 2 0 0 • S A L T L A K E C I T Y • U T A H • 8 4 1 0 3 - 1 1 1 4 • P H 8 0 1 . 5 8 2 . 0 3 5 3
Naoi, K., and P. Simon. 2008. “New Materials and New Configurations for Advanced Electrochemical Capacitors.” The Electrochemical Society Interface, Spring: p. 34-37.
NERC 2012. “Reliability Indicators: Planning Reserve Margin.” NERC, Princeton, NJ. Available http://www.nerc.com/page.php?cid=4%7C331%7C373. Accessed 11/20/2012. NERC 2011. Demand Response Availability Data System (DADS): Phase I & II Final Report. January. Available http://www.nerc.com/files/DADS_Report_Final_Revised.pdf Accessed 11/28/2012. NERC 2010a. Potential Reliability Impacts of Emerging Flexibility Resources. Special Report, NERC, Princeton, NJ, November 2010. Available http://www.nerc.com/docs/pc/ivgtf/IVGTF_Task_1_5_Final.pdf. Accessed November 20, 2012.
NERC 2010b. Flexibility Requirements and Metrics for Variable Generation: Implications for System Planning Studies. Draft Report, Task Force 1-4, NERC Integration of Variable Generation Task Force (IVGTF), NERC, Princeton, NJ. June 2010.
NERC 2010c. Generator Verification, Available http://www.nerc.com/filez/standards/Generator-Verification-Project-2007-09.html. Accessed 11/15/2012.
NERC 2010d. “Integrated Bulk Power System Risk Assessment Concepts.” White Paper. NERC, Princeton, NJ Available http://www.nerc.com/docs/pc/rmwg/Integrated_Bulk_Power_System_Risk_Assessment_Concepts_Final.pdf Accessed 11/26/2012. NERC 2009a. Accommodating High Levels of Variable Generation. NERC Integration of Variable Generation Task Force (IVGTF), NERC, Princeton, NJ. April 2009. Available http://www.nerc.com/files/IVGTF_Report_041609.pdf. Accessed 11/1/2012. NERC 2009b. A Technical Reference Paper Fault- Induced Delayed Voltage Recovery. Version 1.2, Transmission Issues Subcommittee and System Protection and Control Subcommittee, NERC, Princeton, NJ June 2009. Available http://www.nerc.com/docs/pc/tis/FIDVR_Tech_Ref%20V1-2_PC_Approved.pdf. Accessed 11/1/2012.
NERC 2009c. “Standard PRC-024-1 — Generator Frequency and Voltage Protective Relay Settings.” NERC, Princeton, NJ. Available http://www.nerc.com/docs/standards/sar/PRC-024-1_Draft1_2009Feb17.pdf Accessed 11/12/2012.
NERC 2009d. Demand Response Availability Data System (DADS) Phase I & II. North American Electric Reliability Corporation, September 1, 2009. NERC 2007. “Definition of Adequate Level of Reliability.” NERC, Princeton, NJ, December 2007. Available http://www.nerc.com/docs/pc/Definition-of-ALR-approved-at-Dec-07-OC-PC-mtgs.pdf Accessed 11/26/2012. NERC 2004a. Technical Analysis of the August 14, 2003, Blackout: What Happened, Why, and What Did We Learn?, Report to the NERC Board of Trustees by the NERC Steering Group, July 13, 2004.
May 14, 2013 215
W E S T E R N E L E C T R I C I T Y C O O R D I N A T I N G C O U N C I L • W W W . W E C C . B I Z 1 5 5 N O R T H 4 0 0 W E S T • S U I T E 2 0 0 • S A L T L A K E C I T Y • U T A H • 8 4 1 0 3 - 1 1 1 4 • P H 8 0 1 . 5 8 2 . 0 3 5 3
NERC 2004b. Final Report on the August 14, 2003 Blackout in the United States and Canada: Causes and Recommendations. U.S. – Canada Power System Outage Task Force, April 5, 2004. Available http://www.nerc.com/docs/docs/blackout/Blackout-OneYearLater.pdf Accessed 12/6/2012.
NERC 2004c. Resource and Transmission Adequacy Recommendations. Prepared by the Resource and Transmission Adequacy Task Force, NERC Planning Committee, Village Boulevard, NJ, NERC, June 15, 2004. Available http://www.nerc.com/docs/docs/pubs/Resource_and_Transmission_Adequacy_Recommendations.pdf Accessed 11/27/2012. NERC 2004d. Frequency Response Standard Whitepaper. North American Electric Reliability Council, Princeton, NJ. April 2004. Available www.nerc.com/docs/oc/rs/Frequency_Response_White_Paper.pdf. Accessed 11/20/2012. NERC 1996a. Western Systems Coordinating Council Disturbance Report for the Power System Outage that Occurred on the Western Interconnection on August 10, 1996. October 18, 1996. NERC, Washington, D.C. Available http://www.nerc.com/docs/docs/pubs/AUG10FIN.pdf
NERC 1996b. Glossary of Terms. Glossary of Terms Task Force, North American Electric Reliability Council, Princeton, NJ, August 1996. NERC 2008. Reliability Standards, “WECC Standard BAL-002-WECC-1 — Contingency Reserves.” Available http://www.nerc.com/files/BAL-002-WECC-1.pdf Accessed 11/28/2012.
Neptune Regional Transmission System. Undated. Neptune Regional Transmission System. Available http://neptunerts.com/. Accessed 11/15/2012. Ning, C.N., C. A. Hsieh, T. Y. Hsiao, and C. N. Lu. 2006. "Two application examples of probabilistic risk assessment in power system operations." In Proceedings of International Conference on Probabilistic Methods Applied to Power Systems, Stockholm, Sweden, pp. 1-5.
Norris, B.J., R.J. Perry, and R.M. Hudson. 2004. “An Evaluation of windfarm stabilization and load shifting using the Zinc-Bromine Battery (ZBB).” Gridwise Engineering Company, Danville, CA. Norris, B.L., et al. 2002. Grid-Connected Solar Energy Storage Using the Zinc-Bromine Flow Battery. Gridwise Engineering Company, Danville, CA.
Northwest Wind Integration Forum. 2007. Available http://www.nwcouncil.org/energy/Wind/Default.asp. Accessed October 30, 2012. Oshima, T., and M. Kajita. 2004. “Development of Sodium-Sulfur Batteries.” Int.. J. Appl. Ceram. Technol., vol. 1, no. 3, pp. 269-276. Oskoui, A., Mathew, B., Hasler, J.-P., Oliveria, M., Larsson, T., Petersson, Å., and John, E., “Holly STATCOM-FACTS to replace critical generation, operational experience”, IEEE PES Transmission and Distribution Conference and Exhibition, pp. 1393-1398.
May 14, 2013 216
W E S T E R N E L E C T R I C I T Y C O O R D I N A T I N G C O U N C I L • W W W . W E C C . B I Z 1 5 5 N O R T H 4 0 0 W E S T • S U I T E 2 0 0 • S A L T L A K E C I T Y • U T A H • 8 4 1 0 3 - 1 1 1 4 • P H 8 0 1 . 5 8 2 . 0 3 5 3
“Pacific Northwest National Laboratory.” PNNL Website. Available http://www.pnnl.gov Accessed 11/26/2012 PacifiCorp Website, http://www.pacificorp.com/index.html Accessed 11/28/2012.
Parashar, M., A. Agarwal, Y.V.. Makarov and, I. Dobson. 2007. Real-Time Voltage Security Assessment (RTVSA): Summary Report. Prepared for California Independent System Operator Corporation, Folsum, CA by Consortium for Electric Reliability Technology Solutions, Jan. 21, 2008. Available http://certs.lbl.gov/pdf/task3-rtvsa-summary-rpt.pdf. Accessed 11/15/2012. Parashar, M., A. Agarwal, Y. Makarov, and I. Dobson. 2007a. Real Time Voltage Security Assessment (RTVSA) Algorithms & Framework. Prepared for California Independent System Operator, Folsum, CA by Consortium for Electric Reliability Technology Solutions, December 2007. Available http://certs.lbl.gov/certs-rt-pubs.html. Accessed 11/1/2012. Parashar, M., A. Agarwal, Y. Makarov, and I. Dobson. 2007b. Real-Time Voltage Security Assessment Tool (RTVSA) Functional Specifications For Commercial Grade Application. Prepared for California Independent System Operator, Folsum, CA by Consortium for Electric Reliability Technology Solutions, April 9, 2007. Available http://certs.lbl.gov/certs-rt-pubs.html Accessed 11/27/2012. Parker, C.J., I.F. Morrison, and D. Sutanto. 1996. “Application of an Optimization Method for Determining the Reactive Margin From Voltage Collapse in Reactive Power Planning.” IEEE Transactions on Power Systems, vol. 11, no. 3, pp. 1473–1481, August 1996.
Pavlov, A., L. Grigorieva et al., 1996. “Ni-Zn batteries with long cycle life.” J. Power Sources, 62:pp. 113-116. POWERnews. 2009. “China to Triple Ultra-High-Voltage Transmission Lines by 2012.” Power News, March 4, 2009. Available http://www.powermag.com/POWERnews/China-to-Triple-Ultra-High-Voltage-Transmission-Lines-by-2012_1773.html.Accessed 11/6/2012. Powertech Labs. 2008. VSAT – Voltage Security Assessment Tool. 2008 Available http://www.dsapowertools.com/downloads/VSAT_Brochure.pdf Accessed 11/27/2012.
PowerWorld Corporation. Undated. PowerWorld Simulator – PVQV. Available http://www.powerworld.com/products/simulator/add-ons-2/simulator-pvqv Accessed 11/27/2012. Prodromidis, A. and F.A. Coutelieris. 2011. “Simulations of economical and technical feasibility of battery and flywheel hybrid energy storage systems in autonomous projects.” Renewable Energy, pp. 149-153, 2011. Propst, J.E. 1995. "Calculating electrical risk and reliability." IEEE Transactions on Industry Applications, vol. 31, pp. 1197-1205, 1995. Pudaruth, G.R., and F. Li. 2008. “Capacity credit evaluation: A literature review” In Third International Conference on Electric Utility Deregulation and Restructuring and Power Technologies. Nanjing, China, pp. 2719–2724, April 6-9, 2008. Institute of Electrical and Electronics Engineers, Piscataway, NJ.
May 14, 2013 217
W E S T E R N E L E C T R I C I T Y C O O R D I N A T I N G C O U N C I L • W W W . W E C C . B I Z 1 5 5 N O R T H 4 0 0 W E S T • S U I T E 2 0 0 • S A L T L A K E C I T Y • U T A H • 8 4 1 0 3 - 1 1 1 4 • P H 8 0 1 . 5 8 2 . 0 3 5 3
Rabih, S., O. Ralliers, C. Turpin, S. Astier. 2008. “Experimental Study of a PEM Reversible Fuel Cell.” In Proceedings of the International Conference on Renewable Energy and Power Quality (ICREPQ’08, Valencia; March 11-12, 2008, p. 268. Rahmatullah, N. 2006. Grid Reinforcing Wind Generation. Thesis for the Degree of Licentiate of Engineering, Department of Energy and Environment, Chalmers University of Technology, Göteborg, Sweden.
Ramtharan, G., N. Jenkins, and O. Anaya-Lara et al. 2007. "Influence of rotor structural dynamics representations on the electrical transient performance of FSIG and DFIG wind turbines." Wind Energy, vol. 10, no. 4, pp. 293-301, Jul-Aug.
Ranjbari, A. et al. 2010. “Recent Advances in the Development of Unitized Regenerative Fuel cells based on PEM technology.” In 18th World Hydrogen Energy Conference. Essen, Germany. May 16-21, 2010. Rastler, D. 2010. Electricity Energy Storage Technology Options: A white Paper Primer on Applications, Costs and Benefits. Rept #1020676. Electric Power Research Institute, Palo Alto, CA.
Reactive Reserve Working Group. 2006. Guide to WECC/NERC Planning Standard I.D: Voltage Support and Reactive Power. Prepared by Reactive Reserve Working Group, WECC, Washington, D.C. March 30, 2006.
Rei, A.M., M. T. Schilling, and A. C. G. Melo,. 2006. "Monte Carlo simulation and contingency enumeration in bulk power systems reliability assessment." In Proceedings of the 9th International Conference on Probabilistic Methods Applied to Power Systems, Stockholm, Sweden, June 11-15, 2006. Ridge Energy Storage & Grid Services L.P. 2005. “The Economic Impact of CAES on Wind in TX, OK and NM.” Final Report June 27, 2005. Report for Texas State Energy Conservation Office, Austin, TX. Rohr, D. 2011a. “Accelerating Acceptance of Fuel Cell Backup Power Systems.” In DOE Hydrogen and Fuel Cells Program Annual Progress Report, DOE, Washington, D.C. Editor. Plug Power, Inc., Latham, NY, p. 1328-1329. Rohr, D. 2011b. “Highly Efficient, 5 kW CHP Fuel Cells Demonstrating Durability and Economic Value in Residential and Light Commercial Applications.” in DOE Hydrogen and Fuel Cells Program Annual Progress Report, DOE, Washington, D.C. Editor. Plug Power, Inc. Latham, NY, pp. 1325-1327. . Rosehart, W., C. Roman, and A. Schellenberg. 2005. “Optimal power flow with complementarity constraints.” IEEE Trans. on Power Syst., Vol. 20, No. 2 , pp. 813 – 822.
Rounds, R. and G.H. Peek. 2008. “Design & Development of a 20-MW Flywheel-based Frequency Regulation Power Plant.” Sandia Report SAND 2008-8229, Sandia National Laboratory, Albuquerque, NM. Rudervall, R., J.P. Charpentier, and R. Sharma. 2012."High voltage direct current (HVDC) transmission systems technology review paper." Presented at Energy Week 2000, Washington,
May 14, 2013 218
W E S T E R N E L E C T R I C I T Y C O O R D I N A T I N G C O U N C I L • W W W . W E C C . B I Z 1 5 5 N O R T H 4 0 0 W E S T • S U I T E 2 0 0 • S A L T L A K E C I T Y • U T A H • 8 4 1 0 3 - 1 1 1 4 • P H 8 0 1 . 5 8 2 . 0 3 5 3
DC, 7–8 March 2000. Available http://www2.internetcad.com/pub/energy/technology_abb.pdf. Accessed 11/10/2012. Rueda, J.L., and F. Shewarega. 2009. “Small Signal Stability of Power Systems with Large Wind Power Integration.” CIGRE, .Paris, France. Ruiz-Vega, R., A.R. Messina, and M. Pavella. 2004. “On-line Assessment and Control of Transient Oscillations Damping.” IEEE Trans. on Power Syst., Vol. 19, Issue. 2, May 2004, pp. 1038-1047.
Rydh, C.J. 1999. “Environmental assessment of vanadium redox and lead-acid batteries for stationary energy storage.” J. Power Sources, vol. 80, pp. 21-29. Salamaa, M.M., E.M. Saieda, M.M. Abou-Elsaada, and E.F. Gharianyb. 2001. “Estimating the Voltage Collapse Proximity Indicator Using Artificial Neural Network.” Energy Conversion and Management, vol. 42, no. 1, pp. 69-79, January. Salasovich, J., and Mosey. G., 2011. “Feasibility Study of Solar Photovoltaics on landfills in Puerto Rico.” NREL, August 2011. Available http://www.nrel.gov/docs/fy11osti/52181.pdf. Accessed 12/5/2012.
Sanabria, L.A., and T.S. Dillon. 1993. “Power system reliability assessment suitable for a deregulated system via the method of cumulants.” Electric Power and Energy Systems, vol. 20, pp. 203-211, February. Sayas, F.C., and R.N. Allan. 1996. “Generation availability assessment of wind farms.” IEEE Proceedings C: Generation, Transmission and Distribution, vol. 143, no. 5, pp. 507-518, Sept. 1996. Institute of Electrical and Electronics Engineers, Piscataway, NJ. Sauer, P,.W. and B. C. Lesieutre. 1995. “Power System Load Modeling.” in J. H. Chow, P. V. Kokotovic and R. J. Thomas, (Editors), Systems and Control Theory for Power Systems, Springer-Verlag, pp. 283-313. Sauer, P.W., K. Tomsovic, J. Dagle, S. Widergren, T. Nguyen, and L. Schienbein, 2004. Integrated Security Analysis. Final Report, CERTS, July 2004. Available http://certs.lbl.gov/CERTS_P_RealTime.html Accessed 11/27/2012.
Schainker, R.B. W.J. Steeley, and V, M-Wray, 2010. “Insights from EPRI’s CAES Economic Benefit-Cost Analyses.” 2nd Compressed Air Energy Storage (CAES) Conference & Workshop, Columbia University, New York. October 20-21, 2010.
Schellenberg, A., W. Rosehart, and J. Aguado. 2004. “Cumulant Based Probabilistic Optimal Power Flow (P-OPF).” In Proceedings of 8th International Conference on Probabilistic Methods Applied to Power Systems, September, 2004. Iowa State University, Ames, Iowa.
Scaini, V, P. Lex, T. Rhea and N. Clark. 2002. “Battery Energy Storage for Grid Support Applications.” In Proceedings of the Electrical Energy Storage Applications and Technologies (EESAT) 2002, San Francisco, CA, April 15‐17, 2002. Sandia National Laboratories, Albuquerque, NM.
May 14, 2013 219
W E S T E R N E L E C T R I C I T Y C O O R D I N A T I N G C O U N C I L • W W W . W E C C . B I Z 1 5 5 N O R T H 4 0 0 W E S T • S U I T E 2 0 0 • S A L T L A K E C I T Y • U T A H • 8 4 1 0 3 - 1 1 1 4 • P H 8 0 1 . 5 8 2 . 0 3 5 3
Schilling, M.Th., A.M. Leite da Silva, R. Billinton, and M.A. El-Kafy. 1990. “Bibliography on power system probabilistic analysis (1962-1988).” IEEE Transactions on Power Systems, 5(1):1-11, February. Schoenung, S.M. and W.V. Hassenzahl. 2003. “Long vs. Short-Term Energy Storage Technology Analysis.” SAND2003-2783. Sandia National Laboratories, Albuquerque, NM. Seale, R.V. 2007. “An Investigation into the Technical Design, Transient Stability Studies and Modeling Issues for Land Based WF Small Island Grid.” The Barbados Light & Power Company, Available http://www.google.com/url?sa=t&rct=j&q=r.v.%20seale%2C%20%E2%80%9Can%20investigation%20into%20the%20technical%20design&source=web&cd=1&ved=0CC0QFjAA&url=http%3A%2F%2Fwww.caricom.org%2Fjsp%2Fprojects%2Fcredp%2FRohan%2520Seale%2520Transient%2520Stability%2520Studies%2520presentation.ppt&ei=UhubULf8F-S6iwK07oHQAw&usg=AFQjCNEtT_q4Qq_f-CzqD1zoEpE_x-ILhg Accessed 11/27/2012. Seppa, O. 2007. “Reliability and Real Time Transmission Line Ratings.” The Valley Group, New York. June 18, 2007.
Series Capacitor Working Group of the Transmission and Distribution Committee. 2010. Draft Guide for the Specification of Fixed Series Capacitor Banks for Transmission System Applications, IEEE P1726, January 2010. Available http://grouper.ieee.org/groups/td/cap/seriescap/IEEEP1726D10_20100129_FSCSpecGuide.doc Accessed 11/27/2012. Shirmohamadi, M. 2002. “Sagging Line Mitigator Final Report.” Consultant Report, California Energy Commission, Folsum CA, December 2002.
Sibley. L. undated. Patented Flywheel Energy Storage System – FESS. Tribology Systems Incorporated, Warminster, PA. Available http://www.tribologysystems.com/index_files/TSI_FESS_Overview.pdf Accessed on 11/2712.
Simon, P. and A. Burke 2008. “Nanostructured Carbons: Double-Layer Capacitance and More.” The Electrochemical Society Interface, Spring: p. 38-42. Simon, P. and Y. Gogotsi. 2008. “Materials for electrochemical capacitors.” Nature Materials, 7:p. 845-854. Singh, C., and A.L. Gonzalez. 1985. "Reliability modeling of generation systems including unconventional energy sources." IEEE Transactions on Power Apparatus and Systems, vol. PAS-104, no. 5, pp. 1049-1056, May 1985.
Singh, B. and S.N. Singh. 2009. “Wind Power Interconnection into the Power System: A Review of Grid Code Requirements.” The Electricity Journal, vol.22, no. 5, pp. 54-63, June.
Sittithumwat, A. and K. Tomsovic. 2002. “Dynamic Security Margin Estimation Using Artificial Neural Networks.” IEEE Power Engineering Society Summer Meeting, vol. 3, pp. 1322-1327, 2002. Institute of Electrical and Electronics Engineers, Piscataway, NJ. Skilling, J. 1998. Probabilistic Data Analysis: An Introductory Guide. Unpublished manuscript, Department of Applied Mathematics and Theoretical Physics, University of Cambridge ,
May 14, 2013 220
W E S T E R N E L E C T R I C I T Y C O O R D I N A T I N G C O U N C I L • W W W . W E C C . B I Z 1 5 5 N O R T H 4 0 0 W E S T • S U I T E 2 0 0 • S A L T L A K E C I T Y • U T A H • 8 4 1 0 3 - 1 1 1 4 • P H 8 0 1 . 5 8 2 . 0 3 5 3
Cambridge, England. Available http://www.maxent.co.uk/documents/pda.pdf. Accessed 10/30/2012 Skyllas-Kazacos, undated. The Vanadium Redox Flow Battery: Science and Materials. Available http://www.ccrhq.org/userfiles/file/Niche/Skyllas-Kazacosweb.ppt.pdf. Accessed October 31, 2001.
Slootweg, J.G. 2003. Wind Power, Modeling and Impact on Power System Dynamics. PhD Thesis, Power Systems Laboratory, Delft University of Technology, Ridderkerk, Netherlands. Slootweg, J.G., and W. L. Kling. 2003. "The impact of large scale wind power generation on power system oscillations." Electric Power Systems Research, vol. 67, no. 1, pp. 9-20, Oct.
Smith, J.C. 2004. “Utilities and Wind Power Integration.” Utility Wind Interest Group presentation at Stanford University, April 26, 2004. Available http://gcep.stanford.edu/pdfs/energy_workshops_04_04/wind_c_smith.pdf Accessed 11/27/2012. Song, Y., H. He, D. Zhang, and J. Guo. 2006. "Probabilistic security evaluation of bulk power system considering cascading outages." In Proceedings of International Conference on Power System Technology, pp. 1-6, 2006. Institute of Electrical and Electronics Engineers, Piscataway, NJ. Southwest Transmission Cooperative, Inc, 2005. “Standard Large Generator Interconnection Agreement (LGIA).” Benson, AZ. Available http://www.oatioasis.com/SWTC/SWTCdocs/LGIA.pdf Accessed 11/28/2012. Sovalov, S.A. and V. A. Semenov. 1988. Emergency Control in Power Systems. Energoatomizdat, Moscow, 1988 - in Russian. Staudt, L. undated.“Electricity Storage: Windfarm and Industrial Applications.” Centre for Renewable Energy, Dundalk Institute of Technology. Co. Louth, Ireland. Available http://docs.wind-watch.org/EI_Storage_Presentation.pdf Accessed October 26, 2011.
Steeley, W. 2005. “VRB Energy Storage for Voltage Stabilization.” Report 1008434, Electric Power Research Institute, Palo Alto, CA. March.
Stelmak, R. 2009. “Dynamic Line Ratings A Complementary Technology for SynchroPhasors.” The Valley Group, NASPI Meeting Chattanooga, TN, pp. 3, October 7-8 2009.
Su, C-L. 2005. “Probabilistic load-flow computation using point estimate method.” IEEE Transactions on Power Systems, vol. 20, no. 4, Nov. Su, J., Y. Yu, H. Jia, P. Li, N. He, Z. Tang, and H. Fu. 2002. “Visualization of Voltage Stability Region of Bulk Power System.” In Proceedings of International Conference on Power System Technology PowerCon 2002, vol. 3, pp. 1665-1668. Institute of Electrical and Electronics Engineers, Piscataway, NJ. Succar, S. and R. H. Williams. 2008.“Compressed Air Energy Storage: Theory, Resources and Applications For Wind Power.” Princeton Environmental Institute, Princeton University, April 8, 2008.
May 14, 2013 221
W E S T E R N E L E C T R I C I T Y C O O R D I N A T I N G C O U N C I L • W W W . W E C C . B I Z 1 5 5 N O R T H 4 0 0 W E S T • S U I T E 2 0 0 • S A L T L A K E C I T Y • U T A H • 8 4 1 0 3 - 1 1 1 4 • P H 8 0 1 . 5 8 2 . 0 3 5 3
Sun, Y., L. Wang, G. Li, and J. Lin. 2010. “A Review of Analysis and Control of Small Signal Stability of Power Systems with Large Scale Integration of Wind Power.” International Conference on Power System Technology (POWERCON), Hangzhou, China, Oct. 24-28, 2010. Institute of Electrical and Electronics Engineers, Piscataway, NJ. Swamy, D. 2011. “Development and Demonstration of a New-Generation High Efficiency 10 kW Stationary Fuel Cell System.” In DOE Hydrogen and Fuel Cells Program Annual Progress Report,” DOE, editor, Intelligent Energy., Long Beach, CA p. 894-898.
System Dynamic Performance Subcommittee, and Power System Engineering Committee. 1982. “Proposed Terms & Definitions for Power Systems Stability.” IEEE Transactions on Power Apparatus and Systems, vol. PAS-101, no. 7, July. Tamura, Y., H. Mori, and S. Iwamoto. 1983. “Relationship between Voltage Instability and Multiple Load Flow Solutions in Electric Power Systems.” IEEE Transactions on Power Apparatus and Systems, vol. PAS-102, pp.1115-1123, May 1983.
Tarasov, V.I. 1975. “Implementation of a Permanent Loading Procedure to Definition of Load Flows on a Limit of Aperiodic Steady-State Stability.” Voprosy primeneniya matematicheskih metodov pri upravlenii regimami i razvitiem elektricheskih sistem, Irkutsk, pp. 50-56, 1975 – in Russian.
Task Force on the Capacity Value of Wind Power, IEEE Power and Energy Society. 2011. “Capacity Value of Wind Power.” IEEE Transactions on Power Systems, vol. 26, no. 2, May. Taylor, C.W. 2008. “Voltage Stability for Undergraduates.” University of Minnesota Power Group, Available http://www.ece.umn.edu/groups/power/month_sem/pres_11.pdf Accessed 12/2/2012.
Taylor P., et al. 1999. “A summary of the state-of-the-art of SMES, flywheel, and CAES.” Sandia report SAND991854, July 1999. Sandia National Laboratories, Albuquerque, NM.
Thomas, M.H. 2003. “Persistence and Progress - The Zinc Bromine Battery in Renewable Energy Systems.” In REGA FORUM 2003. Yarra Valley, Victoria, British Columbia, Canada. Tokuda, N. et al. 2000. “Development of a Redox Flow Battery System.” SEI Technical Review, No. 50: 88-93. Tong J, H.-D. Chiang, and T. P Conneen. 1993. “A Sensitivity-based BCU Method for Fast Derivation of Stability Limits in Electric Power Systems.” IEEE Transactions on Power Systems, vol. 8, no. 4, pp. 1418–1428, 1993. Tsourakis, G., B. M. Nomikos, and C. D. Voumas. 2009A. "Effect of wind parks with doubly fed asynchronous generators on small-signal stability." Electric Power Systems Research, vol. 79, no. 1, pp. 190-200, Jan. Tsourakis, G., B. M. Nomikos, and C. D. Voumas. 2009B. "Contribution of Doubly Fed Wind Generators to Oscillation Damping." IEEE Transactions on Energy Conversion, vol. 24, no. 3, pp. 783-791, Sep.
May 14, 2013 222
W E S T E R N E L E C T R I C I T Y C O O R D I N A T I N G C O U N C I L • W W W . W E C C . B I Z 1 5 5 N O R T H 4 0 0 W E S T • S U I T E 2 0 0 • S A L T L A K E C I T Y • U T A H • 8 4 1 0 3 - 1 1 1 4 • P H 8 0 1 . 5 8 2 . 0 3 5 3
Tsourakis, G., E. Potamianakis, and C. Vournas. 2004. “Eliminating Voltage Instability Problems in Wind Parks by Using Doubly Fed Induction Generators.” In Proceedings of European Wind Energy Conference and Excibition, London, UK, 2004. Tytgat, J. et al. 2011 “Umicore's Excellence in Battery Materials and Battery Recycling.”Brussels, Available http://www.green-cars-initiative.eu/workshops/joint-ec-eposs-ertrac-expert-workshop-2011-on-battery-manufacturing/presentations/2_4%20Jan%20Tytgat_Umicore.pdf Accessed 12/5/2012. Ullah, N.R., and T. Thiringer. 2008."Effect of operational modes of a wind farm on the transient stability of nearby generators and on power oscillations: a Nordic grid study." Wind Energy, vol. 11, no. 1, pp. 63-73.
Undervoltage Laod Shedding Task Force (UVLSTF), Technical Studies Subcommittee, Western Systems Coordinating Council. 1999. “Undervoltage Load Shedding Guidelines.” July 1999. Available http://www.wecc.biz/committees/StandingCommittees/PCC/TSS/Shared%20Documents/Undervoltage%20Load%20Shedding%20Guidelines.pdf Accessed 11/28/2012. Union for the Coordination of Transmission of Electricity UCTE. 2003. Interim Report of the Investigation Committee on the 28 September 2003 Blackout in Italy. Press Release, Union for the Coordination of Transmission of Electricity UCTE, Brussels, Belgium, October 3, 2003. Available http://www.energie-schweiz.ch/imperia/md/content/medienmitteilungen/mm06-122003/82.pdf U.S. DOE. 2010. Solar Energy Technologies Program. Systems Integration Subprogram. Transmission Activity Draft, Multi-Year Plan (MYP) FY2010-FY2016, Energy Efficiency and Renewable Energy, U.S. Department of Energy, Washington, D.C. August 10, 2010
U.S. DOE. 1996. The Electric Power Outages In The Western United States July 2-3, 1996. DOE Report to the President, August 2, 1996. Available ftp://www.nerc.com/pub/sys/all_updl/docs/pubs/doerept.pdf
U.S. DOE. Undated. “U.S. Department of Energy.” Washington, D.C. Available http://www.doe.gov Accessed 11/26/2012.
Usaola, J. “Probabilistic load flow with wind production uncertainty using cumulants and Cornish-Fisher expansion.” In Proceedings of the 2008 Power Systems Computation Conference (PSCC), Glasgow, UK, July 2008. Curran Associates, Red Hook, NY.
USE Supply, 2008, “20% Wind Energy by 2030.” December 2008. Available http://www.nrel.gov/docs/fy09osti/42864.pdf Accessed 11/29/2012.
V-Fuel Pty Ltd, 2008 http://www.vfuel.com.au/infosheet.pdf, accessed 10/3/2011.
Van Cutsem, T., I. Dobson (Editor), C. DeMarco, D. Hill, I. Hiskens, T. Overbye, M. Venkatasubramanian, and C. Vournas. 1998. Basic Theoretical Concepts, Chapter 2. IEEE Voltage Stability Work Group Report, April 1998. Institute of Electrical and Electronics Engineers, Piscataway, NJ. Available http://www.ece.wisc.edu/~dobson/WG/chapter.pdf. Accessed 11/15/2012.
May 14, 2013 223
W E S T E R N E L E C T R I C I T Y C O O R D I N A T I N G C O U N C I L • W W W . W E C C . B I Z 1 5 5 N O R T H 4 0 0 W E S T • S U I T E 2 0 0 • S A L T L A K E C I T Y • U T A H • 8 4 1 0 3 - 1 1 1 4 • P H 8 0 1 . 5 8 2 . 0 3 5 3
Van Custem, T. 1991. “A method to compute reactive power margins with respect to voltage collapse.” IEEE Transactions on Power Systems, vol. 6, no. 1, pp. 145–156, February 1991. Van der Linden, S. 2006. “Bulk Energy Storage Potential in the USA, Current Developments and Future Prospects.” Energy, vol. 31, no. 15, pp. 3446–3457.
Venikov, V.A., V. A. Stroev, V. I. Idelchick, and V. I. Tarasov. 1975. “Estimation of electric power system steady-state stability in load flow calculation.” IEEE Transactions on Power Apparatus and Systems, vol. PAS-94, pp.1034 - 1041, May/June, 1975.
Verhaeghe, F., F. Groubin, B. Yazicioglu, M. Schurmans, B. Thiis, G. Haesebroek, J. Tytgat, and M. Van Camp. 2011. “Valorisation of battery recycling slags.” Second International Slag Valorisation Symposium, Leuven, Belgium, April 4, 2011. Available http://www.slag-valorisation-symposium.eu/2011/images/papers/s4_12_verhaeghe.pdf Accessesed 12/5/12. Vittal, V., J. McCalley, V. Ajjarapu, and U. V. Shanbhag. 2009. Impact of Increased DFIG Wind Penetration on Power Systems and Markets. PSERC Publication 09-10, Power Systems Engineering Research Center, Tempe, AZ, October 2009. Available http://www.pserc.wisc.edu/documents/publications/reports/2009_reports/vittal_dfig_pserc_final_report_s-34_2009.pdf Accessed 11/27/2012. Vivian, G.L., and G.T. Heydt. 1981. “Stochastic energy dispatch.” IEEE Transactions on Power Apparatus and Systems, vol. PAS-100, no. 7, pp. 3221-3227, July.
Vournas, C. 2004. Technical Summary on the Athens and Southern Greece Blackout of July 12, 2004. Available http://www.google.com/#hl=en&tbo=d&output=search&sclient=psy-ab&q=Technical+Summary+on+the+Athens+and+Southern+Greece+Blackout+of+July+12%2C+2004&oq=Technical+Summary+on+the+Athens+and+Southern+Greece+Blackout+of+July+12%2C+2004&gs_l=hp.12...1108.1108.1.2142.1.1.0.0.0.0.122.122.0j1.1.0.les%3B..0.0...1c.1.h3p23PeP2Fs&psj=1&bav=on.2,or.r_gc.r_pw.r_qf.&bvm=bv.1355534169,d.dmQ&fp=c341db92e3d4d65d&bpcl=40096503&biw=1600&bih=785. Vowles, D.J., C. Samarasinghe, M. J. Gibbard et al. 2008. "Effect of Wind Generation on Small-Signal Stability-A New Zealand Example.” 2008 IEEE Power & Energy Society General Meeting, pp. 5217-5224, 2008. Institute of Electrical and Electronics Engineers, Piscataway, NJ. Walawalkar, R., J. Apt, and R. Mancini. 2006. “Economics of electric energy storage for energy arbitration and regulation in New York.” Carnegie Mellon Electricity Industry Center Working Paper CEIC-06-04, Available https://wpweb2.tepper.cmu.edu/ceic/pdfs/CEIC_06_04.pdf. Accessed 10/26/2011. Wan, H.B., and Y. H. Song. 1998. “Hybrid Supervised and Unsupervised Neural Network Approach to Voltage Stability Analysis.” Electric Power System Research, vol. 47, no. 2, pp.115-122.
Wang, X., H. Dai and R.J. Thomas. 1984. "Reliability modeling of large wind farms and electric utility interface systems." IEEE Transactions on Power Apparatus and Systems, vol. PAS-103, no. 3, pp. 569-575, Mar. 1984.
May 14, 2013 224
W E S T E R N E L E C T R I C I T Y C O O R D I N A T I N G C O U N C I L • W W W . W E C C . B I Z 1 5 5 N O R T H 4 0 0 W E S T • S U I T E 2 0 0 • S A L T L A K E C I T Y • U T A H • 8 4 1 0 3 - 1 1 1 4 • P H 8 0 1 . 5 8 2 . 0 3 5 3
Wang, X. L., et al. 2011 “Amorphous Hierarchical Porous GeOx as High-Capacity Anodes for Li Ion Batteries with Very Long Cycling Life.” Journal of the American. Chemical Society,vol. 133, no. 51, pp. 20692-20695
Wang, J., X. Wang and Y. Wu. 2005. “Operating Reserve Model in the Power Market.” IEEE Transactions on Power Systems, vol. 20, no. 1, February..
Weber, J. 2007. “Efficient Available Transfer Capability Analysis Using Linear Methods.” PSERC Internet Seminar, November. Arizona State University, Tempe, AZ Available www.powerworld.com/files/Efficient-ATC-Analysis.ppt
Wehenkel, L. 1998. Automatic Learning Techniques in Power Systems. Kluwer Academic Publishers, Boston, Massachusetts.
WECC. 2012. WECC Website. Available http://www.wecc.biz/About/Pages/default.aspx Accessed 11/27/2012.
WECC 2010. Western Electricity Coordinating Council Off-Nominal Frequency Load Shedding Plan. December 2010. Available http://www.wecc.biz/library/Documentation%20Categorization%20Files/Policies/Off-Nominal%20Frequency%20Load%20Shedding%20Plan.pdf. Accessed November 9, 2012. WECC 2008. WECC System Performance Criteria. Apr. 18, 2008, Western Electricity Coordinating Council, Washington, D.C. Available http://wecc.biz/standards/wecc%20criteria/forms/allItems.aspx. Accessed 11/15/2012. WECC 2007. WECC Standard BAL-STD-002-1 - Operating Reserves. March 12, 2007. WECC, Washington, D.C. Available http://www.nerc.com/files/BAL-STD-002-0.pdf. Accessed 11/20/2012. WECC 2006. Guide to WECC/NERC Planning Standards I.D: Voltage Support and Reactive Power. Reactive Reserve Working Group (RRWG), Western Electricity Coordinating Council, Washington, D.C. Available http://www.wecc.biz/committees/StandingCommittees/PCC/TSS/Shared%20Documents/Voltage%20Stability%20Guide.pdf Accessed 11/15/2012.
WECC 2005. Minimum Operating Reliability Criteria. Western Electricity Coordinating Council, Washington, D.C. April 2005. Available http://www.wecc.biz/library/WECC%20Documents/Miscellaneous%20Operating%20and%20Planning%20Policies%20and%20Procedures/WECC%20Reliability%20Criteria%20MORC.pdf. Accessed 11/15/2012.
WECC 1998. Voltage Stability Criteria, Undervoltage Load Shedding Strategy, and Reactive Power Reserve Monitoring Methodology. Final Report, Reactive Power Reserve Work Group, Western Electricity Coordinating Council, Washington, D.C. May 1998. Available http://www.wecc.biz/library/Documentation%20Categorization%20Files/Guidelines/Voltage%20Stability%20Criteria%20-%20Guideline.pdf.
May 14, 2013 225
W E S T E R N E L E C T R I C I T Y C O O R D I N A T I N G C O U N C I L • W W W . W E C C . B I Z 1 5 5 N O R T H 4 0 0 W E S T • S U I T E 2 0 0 • S A L T L A K E C I T Y • U T A H • 8 4 1 0 3 - 1 1 1 4 • P H 8 0 1 . 5 8 2 . 0 3 5 3
WECC, 2007, WECC Standard TOP-STD-007-0 – Operating Transfer Capability. Adopted by Board of Trustees, March 12, 2007. Available http://www.nerc.com/files/TOP-STD-007-0.pdf Accessed 12/5/2012.
Western Governors’ Association and U.S. Department of Energy. 2009. Western Renewable Energy Zones, Phase 1 Report. June. Available http://www.westgov.org/wga/publicat/WREZ09.pdf Accessed 11/9/2012.
Western Systems Coordinating Council, Minimum Operating Reliability Criteria. Part III, WECC, Washington, D.C. Available http://www.westgov.org/wieb/meetings/crepc1000/briefing/morc.pdf Accessed 11/28/2012. Wets, R. J-B. 1996. “Challenges in stochastic programming.” Mathematical Programming, vol, 75, pp. 115-135, 1996. Department of Mathematics, University of California, Davis. Available http://www.math.ucdavis.edu/~rjbw/mypage/Stochastic_Optimization_files/Wets96_chall.pdf Accessed 12/5/2012. Whitney, J. 2011. “Ultra High Voltage (UHV) Transmission is the Renewable Energy Interstate.” The Green Economy Post, April 25, 2011. Available http://greeneconomypost.com/ultra-high-voltage-uhv-transmission-renewable-energy-interstate-14309.htm. Accessed 11/20/2012. Wind. T.A. 2006. “Interconnection and Transmission for Wind Generation.” Wind Utility Consulting, Jefferson, Iowa. Presented at WEATS 2006, Boulder, Colorado. Available http://apps1.eere.energy.gov/tribalenergy/pdfs/course_wind_wind3.pdf Accessed 11/30/2012. Winters, I.J. 2006. “Wind out of their sails.” Mechanical Engineering, Available http://www.memagazine.org/contents/current/features/windout/windout.html Accessed 11/27/2012. Wood, A. J, and Wollenberg, B. L, 1984 “Power Generation Operation & Control,” John Wiley & Sons, NY. Wu, F. and S. Kumagai, 1982. “Steady-State Security Regions of Power Systems.” IEEE Trans. on Circ. and Syst., vol. 29, no. 11, Nov. 1982. Xiao, F., J. D. McCalley, Y. Ou, J. Adams, and S. Myers. 2006. "Contingency probability estimation using weather and geographical data for on-line security assessment." In Proceedings of the 9th International Conference on Probabilistic Methods Applied to Power Systems, IEEE, Stockholm, Sweden, June 11-15, 2006.
Xiao, J., Donghai Mei, Xiaolin Li, Wu Xu, Deyu Wang, Gordon L. Graff, Wendy D. Bennett, Zimin Nie, Laxmikant V. Saraf, Ilhan A. Aksay, Jun Liu, and Ji-Guang Zhang. 2011. “Hierarchically Porous Graphene as a Lithium-Air Battery Electrode.” Nano Letters (11):5071-5078.
Xu, X., M.W. Gustafson, B.P Lam, J.D. Mountford, and S.L. Johnson. 2002. “Assessment of Voltage Stability and Real and Reactive Margins Using Advanced Analytical Tools.” In Proceedings of International Conference on Power System Technology PowerCon 2002, vol. 4, pp. 2047–2051. Institute of Electrical and Electronics Engineers, Piscataway, NJ.
May 14, 2013 226
W E S T E R N E L E C T R I C I T Y C O O R D I N A T I N G C O U N C I L • W W W . W E C C . B I Z 1 5 5 N O R T H 4 0 0 W E S T • S U I T E 2 0 0 • S A L T L A K E C I T Y • U T A H • 8 4 1 0 3 - 1 1 1 4 • P H 8 0 1 . 5 8 2 . 0 3 5 3
Yang, Z. et. al. 2010. “Electrochemical energy storage for green grid.” Chemical Reviews. vol. 111, no. 5, pp. 3577-3613. Yang, Z., J. Zhang, M.C. Kintner-Meyer, X. Lu, D. Choi, J.P. Lemmon, and J. Liu. 2011. “Electrochemical Energy Storage for Green Grid.” Chem. Rev., vol. 111, no. 5, pp. 3577-3613 Yazicioglu, B., and J. Tytgat, 2011. Life Cycle Assessments involving Umicore’s Battery Recycling Process, DG Environmen– Stakeholder Meeting, July 18, 2011. Yee, H. and B. D. Spalding. 1977. “Transient Stability Analysis of Multimachine Power Systems by the Method of Hyperplanes.” IEEE Transactions on Power Apparatus and Systems, vol. 96, no. 1 (Part 1), pp. 276–284, 1977. Yip, T., C. An, G. Lloyd, M. Aten, and B.Ferris. 2009. “Field Experience of Dynamic Line Rating Protection for Wind Farm Connections.” The International Conference on Electrical Engineering pp.2, Hong Kong, March 18-20, 2009.
Yu, H., C. Y. Chung, K. P. Wong, and J. H. Zhang 2009. “A Chance Constrained Transmission Network Expansion Planning Method With Consideration of Load and Wind Farm Uncertainties.” IEEE Transactions on Power Systems, vol. 24, no. 3, pp. 1568-1576, Aug. 2009
Yu, Y., Y. Zeng, C. Huang, S. T. Lee, and P. Zhang. 2004. “A Practical Direct Method for Determining Dynamic Security Regions of Electrical Power Systems by Power Perturbation Analysis,” International Conference on Electrical Engineering ICEE2004, July 4-8, 2004, Sapporo, Japan.
Zavadil, R. et. al. 2007 “Queuing up: Interconnecting Wind Generation into the Power System” IEEE Power & Energy magazine, pp. 47-58.
Zeng, Y. and Y. Yu. 2002. “A Practical Direct Method for Determining Dynamic Security Regions of Electrical Power Systems.” In Proceedings of International Conf. on Power Syst. Technology PowerCon 2002, vol. 2, pp. 1270–1274, Oct. 13-17, 2002. Zeng, Y, Y. Yu, and H. Jia. 2005.“Theoretical Explanation of Hyper-Plane Boundary of Dynamic Security Region.” In Proceedings of Canadian Conf. on Electrical and Computer Engineering, pp. 1946–1949, May 1-4, 2005.
Zhang, H. 2009. “R&D Progress of Redox Flow Battery (RFB) for Energy Storage.” MS&T 2009 Conference & Exhibition,
Zhang, J-G., Deyu Wang,Wu Xu, Jie Xiao, and R.E. Williford. 2010. “Ambient operation of Li/Air batteries.” Journal of Power Sources, (195):4332-4337. Zhang, P. and S. T. Lee. 2004. "Probabilistic load flow computation using the method of combined cumulants and Gram-Charlier expansion." IEEE Transactions on Power Systems, vol. 19, pp. 676-682, Feb. Zhang, Y. et. al. 2009. “Progress of electrochemical capacitor electrode materials: A review.” Int. J Hydrogen Energy, 34:p. 4889-4899.
May 14, 2013 227
W E S T E R N E L E C T R I C I T Y C O O R D I N A T I N G C O U N C I L • W W W . W E C C . B I Z 1 5 5 N O R T H 4 0 0 W E S T • S U I T E 2 0 0 • S A L T L A K E C I T Y • U T A H • 8 4 1 0 3 - 1 1 1 4 • P H 8 0 1 . 5 8 2 . 0 3 5 3
Zhang, X.-P. 2004. “Multiterminal voltage-sourced converter-based HVDC models for power flow analysis.” IEEE Transactions on Power Systems, vol. 19, no. 4, Nov., pp. 1877-1884. Zhang, Y. et al 2010. “A novel bifunctional electrocatalyst for unitized regenerative fuel cell.” J. Power Sources, 195:p. 142-145
Zhang, Y., et al. 2009. “Progress of electrochemical capacitor electrode materials: A review.” Int. Journal on Hydrogen Energy, vol. 34, pp. 4889-4899.
Zhang, Y., et al. 2009. “Impacts of Solar PV Generators on Power System Stability and Voltage Performance.” IEEE Power and Energy Society GM, San Diego, CA, USA pp. 1-7.
Zhao, P., H. Zhang, H. Zhou, J. Chen, S. Gao, and B. Yi. 2006. “Characteristics and performance of 10kW class all-vanadium redox-flow battery stack.” J. Power Sources, vol. 162, pp. 1416-1420.