Embed Size (px)
Citation preview
Dish TV India Limited
Investor Presentation
Disclaimer
Some of the statements made in this presentation are forward-looking statements and are based on the current beliefs, assumptions, expectations, estimates, objectives and projections of the directors and management of Dish TV India Limited about its business projections of the directors and management of Dish TV India Limited about its business and the industry and markets in which it operates.
These forward-looking statements include, without limitation, statements relating to d i Th d revenues and earnings. The words
“believe”, “anticipate”, “expect”, “estimate”,“intend”, “project” and similar expressions are also intended to identify forward looking statements.
These statements are not guarantees of future performance and are subject to risks, uncertainties and other factors, some of which are beyond the control of the Company and are difficult to predict. Consequently, actual results could differ materially from those expressed or forecast in the forward-looking statements as a result of among from those expressed or forecast in the forward looking statements as a result of, among other factors, changes in economic and market conditions, changes in the regulatory environment and other business and operational risks. Dish TV India Limited does not undertake to update these forward-looking statements to reflect events or circumstances that may arise after publication.
2
About us
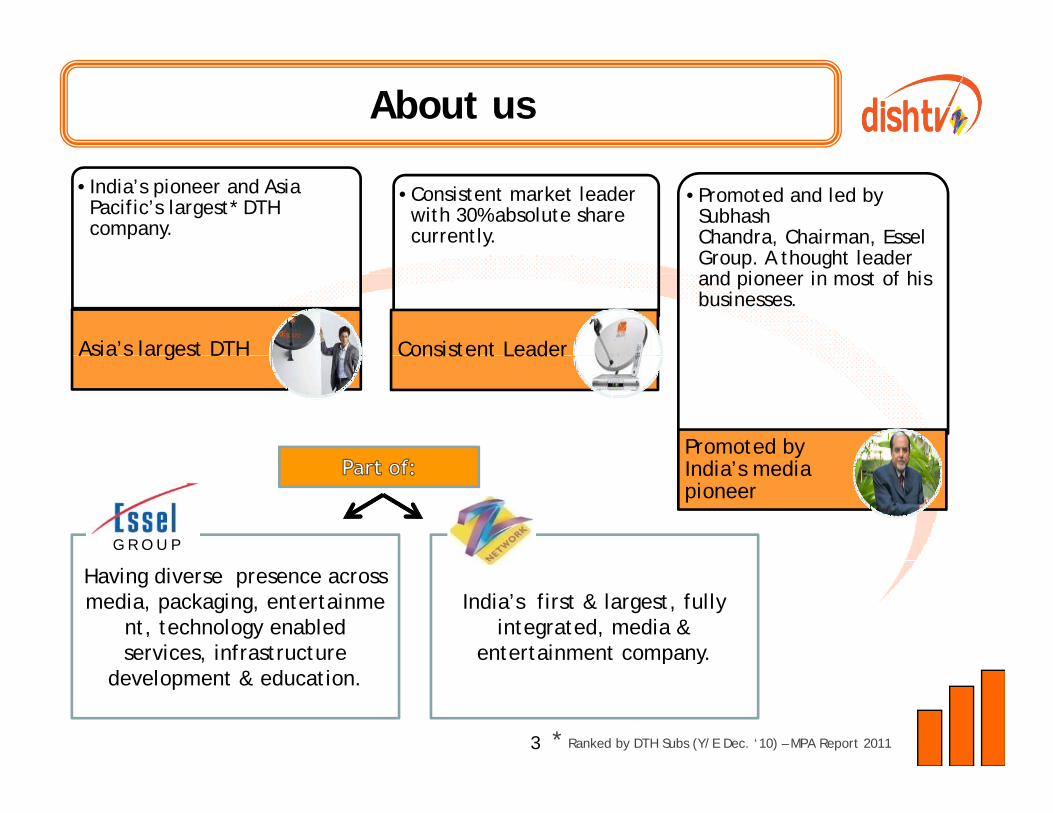
•India’s pioneer and Asia Pacific’s largest* DTH company.
•Consistent market leader with 30% absolute share currently.
•Promoted and led by Subhash Chandra, Chairman, Essel G A th ht l d
Asia’s largest DTH Consistent Leader
Group. A thought leader and pioneer in most of his businesses.
Asia s largest DTH Consistent Leader
Promoted by
G R O U P
India’s media pioneer
India’s first & largest, fully integrated, media &
entertainment company.
Having diverse presence across media, packaging, entertainme
nt, technology enabled services, infrastructure
* Ranked by DTH Subs (Y/E Dec. ‘10) – MPA Report 20113
p y,development & education.
Indian DTH industry
4
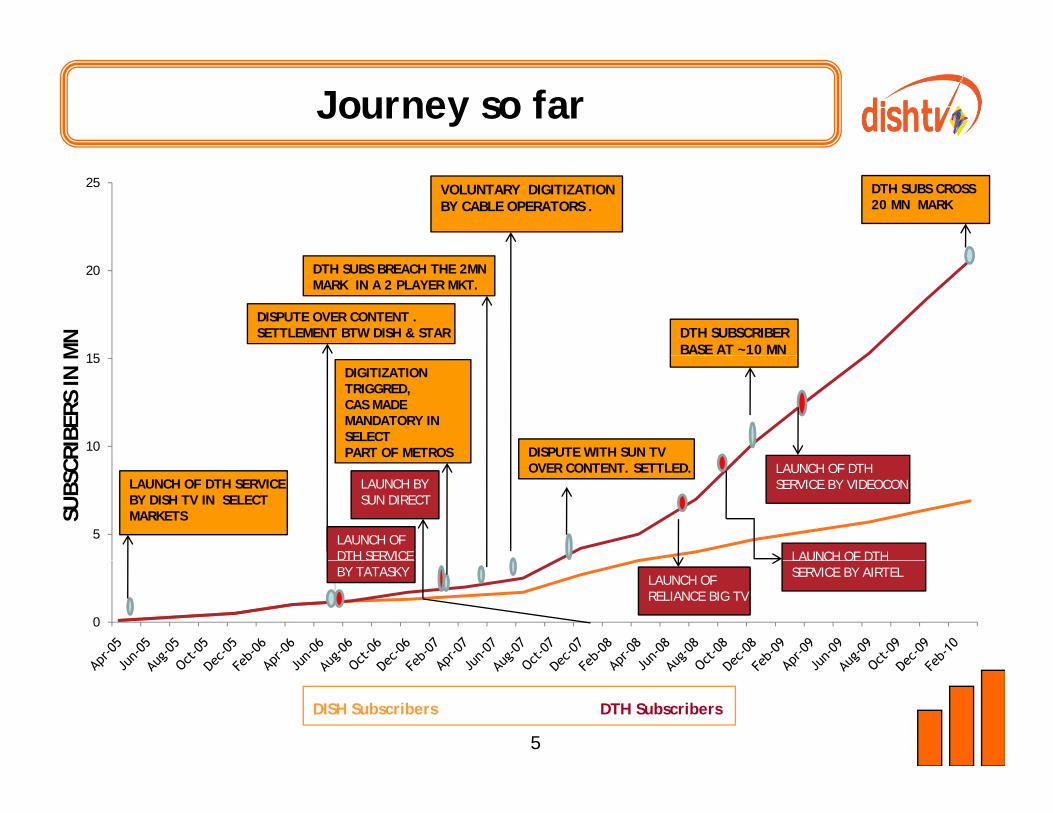
Journey so far
25 VOLUNTARY DIGITIZATION BY CABLE OPERATORS .
DTH SUBS CROSS20 MN MARK
15
20
MN
DISPUTE OVER CONTENT . SETTLEMENT BTW DISH & STAR
DTH SUBS BREACH THE 2MNMARK IN A 2 PLAYER MKT.
DTH SUBSCRIBERBASE AT ~10 MN
10
15
RIBE
RS IN
M
DIGITIZATION TRIGGRED,CAS MADE MANDATORY IN SELECT PART OF METROS DISPUTE WITH SUN TV
5
SUBS
CR
LAUNCH OF DTH SERVICEBY DISH TV IN SELECTMARKETS
OVER CONTENT. SETTLED.
LAUNCH OFDTH SERVICE LAUNCH OF DTH
LAUNCH OF DTH SERVICE BY VIDEOCONLAUNCH BY
SUN DIRECT
0
BY TATASKYLAUNCH OF RELIANCE BIG TV
LAUNCH OF DTHSERVICE BY AIRTEL
5
DISH Subscribers DTH Subscribers
Opportunities galore!
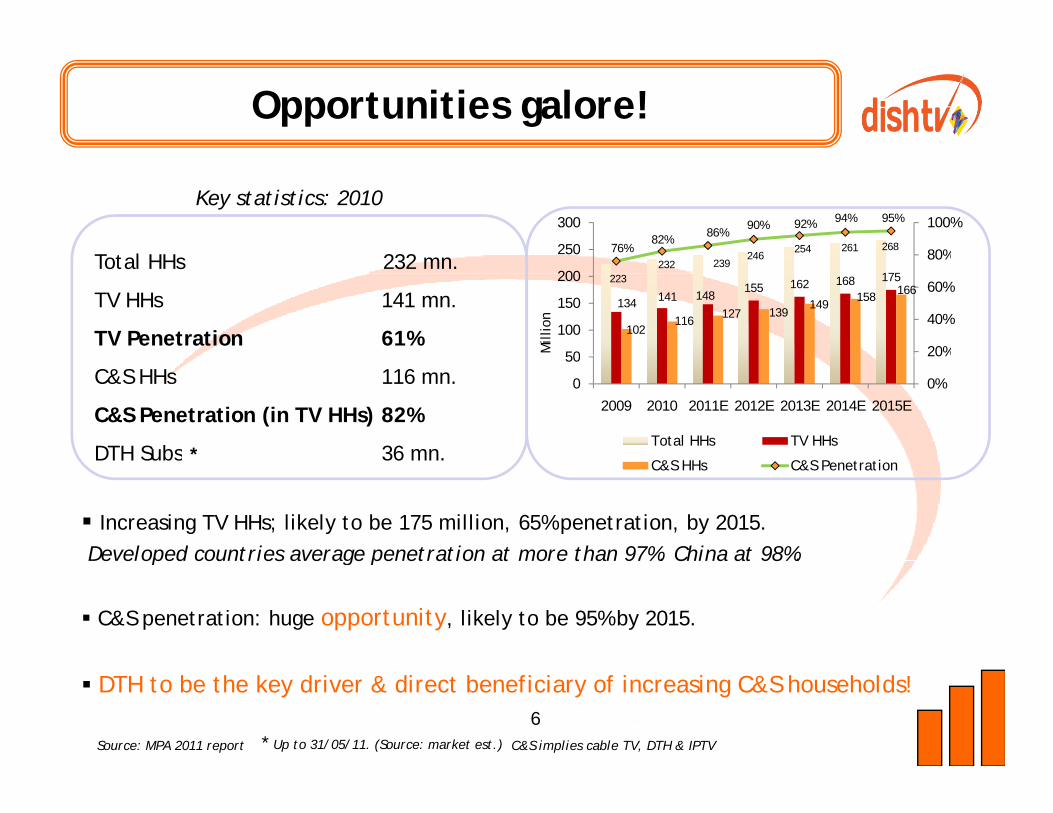
Key statistics: 2010
246254 261 26876%
82% 86%90% 92% 94% 95%
80%
100%
250
300
Total HHs 232 mn.
TV HHs 141 mn.
TV Penetration 61%
223232 239
246
134 141 148155 162 168 175
102116
127 139149
158 166
20%
40%
60%
80%
50
100
150
200
250
Mill
ion
C&S HHs 116 mn.
C&S Penetration (in TV HHs) 82%
DTH Subs * 36 mn.
0%
20%
0
50
2009 2010 2011E 2012E 2013E 2014E 2015E
Total HHs TV HHs
Increasing TV HHs; likely to be 175 million, 65% penetration, by 2015. Developed countries average penetration at more than 97%. China at 98%.
DTH Subs 36 mn.C&S HHs C&S Penetration
Developed countries average penetration at more than 97%. China at 98%.
C&S penetration: huge opportunity, likely to be 95% by 2015.
DTH to be the key driver & direct beneficiary of increasing C&S households!6
Source: MPA 2011 report C&S implies cable TV, DTH & IPTV* Up to 31/05/11. (Source: market est.)
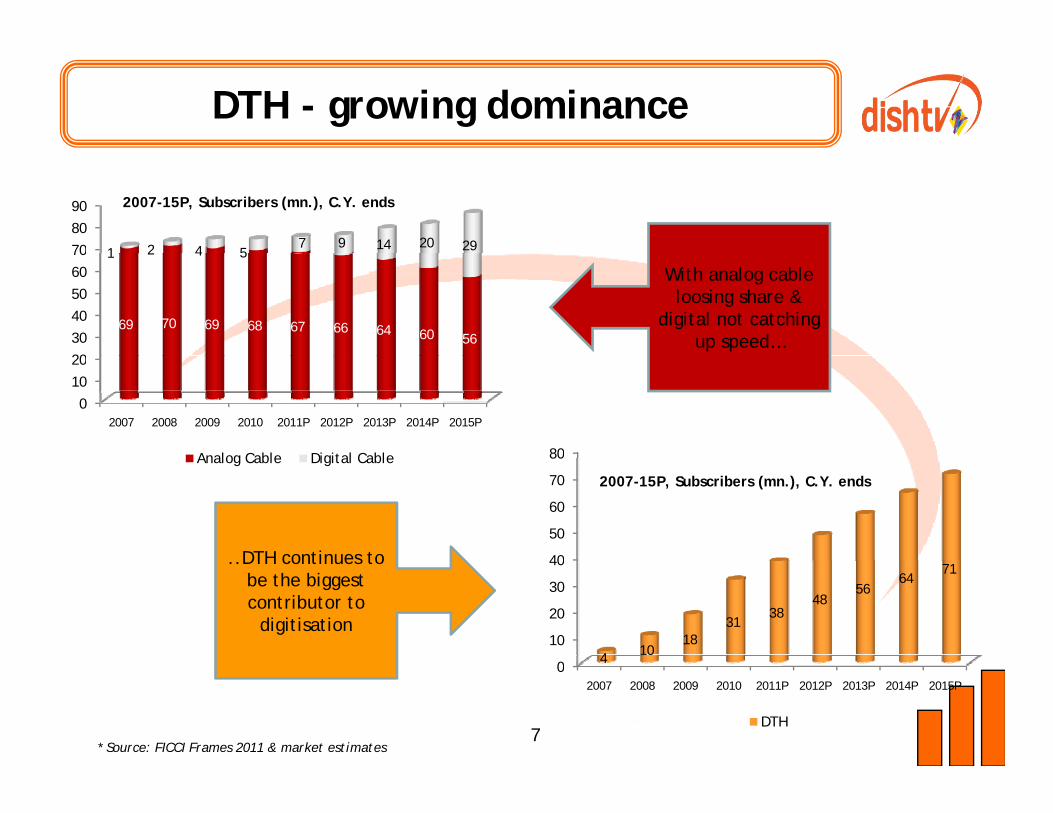
DTH - growing dominance
708090
1 2 4 57 9 14 20 29
2007-15P, Subscribers (mn.), C.Y. ends
203040506070
69 70 69 68 67 66 64 60 56
1 2 4 5
With analog cable loosing share &
digital not catching up speed…
01020
2007 2008 2009 2010 2011P 2012P 2013P 2014P 2015P
Analog Cable Digital Cable 80Analog Cable Digital Cable
40
50
60
70
80
DTH continues to
2007-15P, Subscribers (mn.), C.Y. ends
0
10
20
30
40
4 1018
3138
4856
6471
..DTH continues to be the biggest contributor to
digitisation
7* Source: FICCI Frames 2011 & market estimates
02007 2008 2009 2010 2011P 2012P 2013P 2014P 2015P
DTH
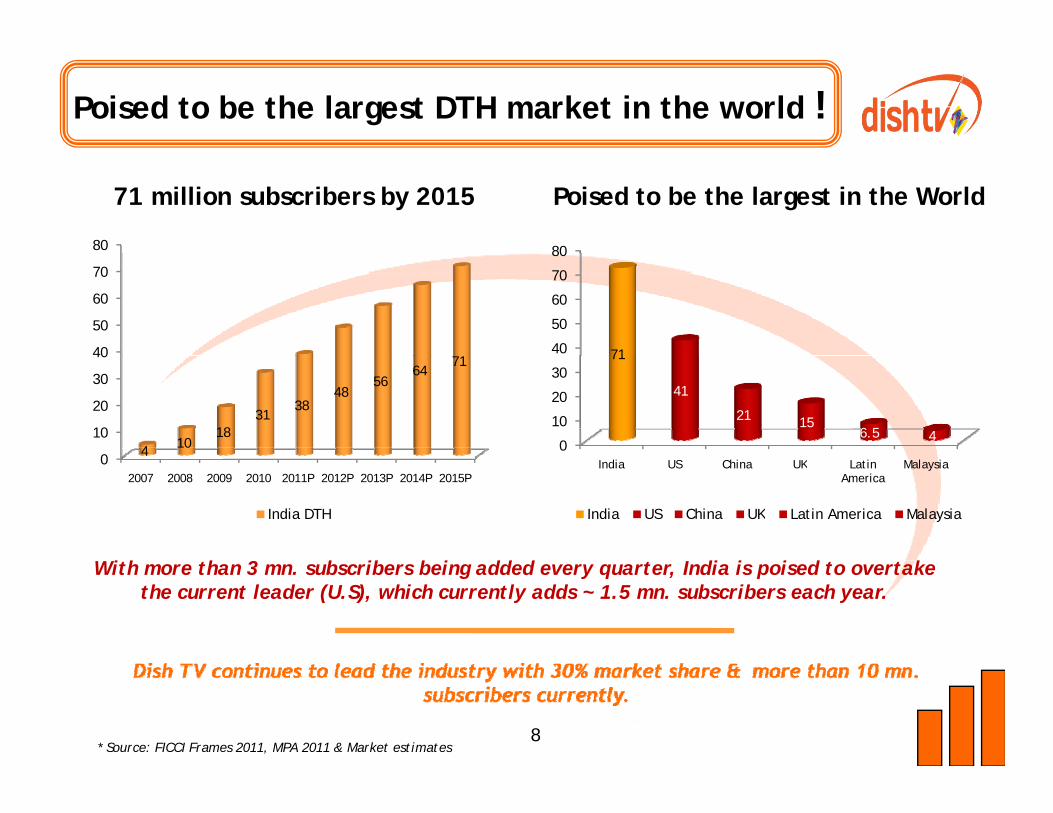
Poised to be the largest DTH market in the world !
80 80
71 million subscribers by 2015 Poised to be the largest in the World
40
50
60
70
40
50
60
70
80
71
0
10
20
30
40
4 1018
3138
4856
6471
0
10
20
3071
41
21 156.5 4
02007 2008 2009 2010 2011P 2012P 2013P 2014P 2015P
India DTH
India US China UK Latin America
Malaysia
India US China UK Latin America Malaysia
i h h 3 b ib b i dd d di i i d k With more than 3 mn. subscribers being added every quarter, India is poised to overtake the current leader (U.S), which currently adds ~ 1.5 mn. subscribers each year.
8* Source: FICCI Frames 2011, MPA 2011 & Market estimates
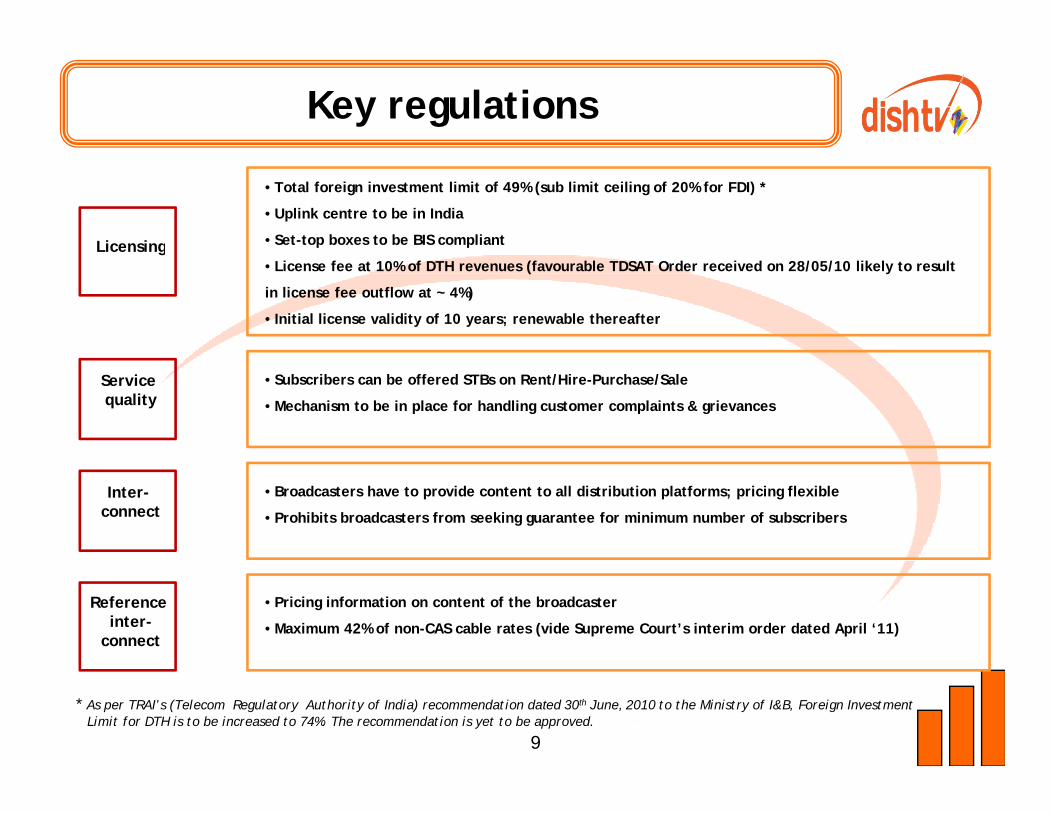
Key regulations
Licensing
• Total foreign investment limit of 49% (sub limit ceiling of 20% for FDI) *
• Uplink centre to be in India
• Set-top boxes to be BIS compliantg• License fee at 10% of DTH revenues (favourable TDSAT Order received on 28/05/10 likely to result
in license fee outflow at ~ 4%)
• Initial license validity of 10 years; renewable thereafter
Service quality
• Subscribers can be offered STBs on Rent/Hire-Purchase/Sale
• Mechanism to be in place for handling customer complaints & grievances
Inter-connect
• Broadcasters have to provide content to all distribution platforms; pricing flexible
• Prohibits broadcasters from seeking guarantee for minimum number of subscribers
Reference inter-
connect
• Pricing information on content of the broadcaster
• Maximum 42% of non-CAS cable rates (vide Supreme Court’s interim order dated April ‘11)
9
* As per TRAI’s (Telecom Regulatory Authority of India) recommendation dated 30th June, 2010 to the Ministry of I&B, Foreign Investment Limit for DTH is to be increased to 74%. The recommendation is yet to be approved.
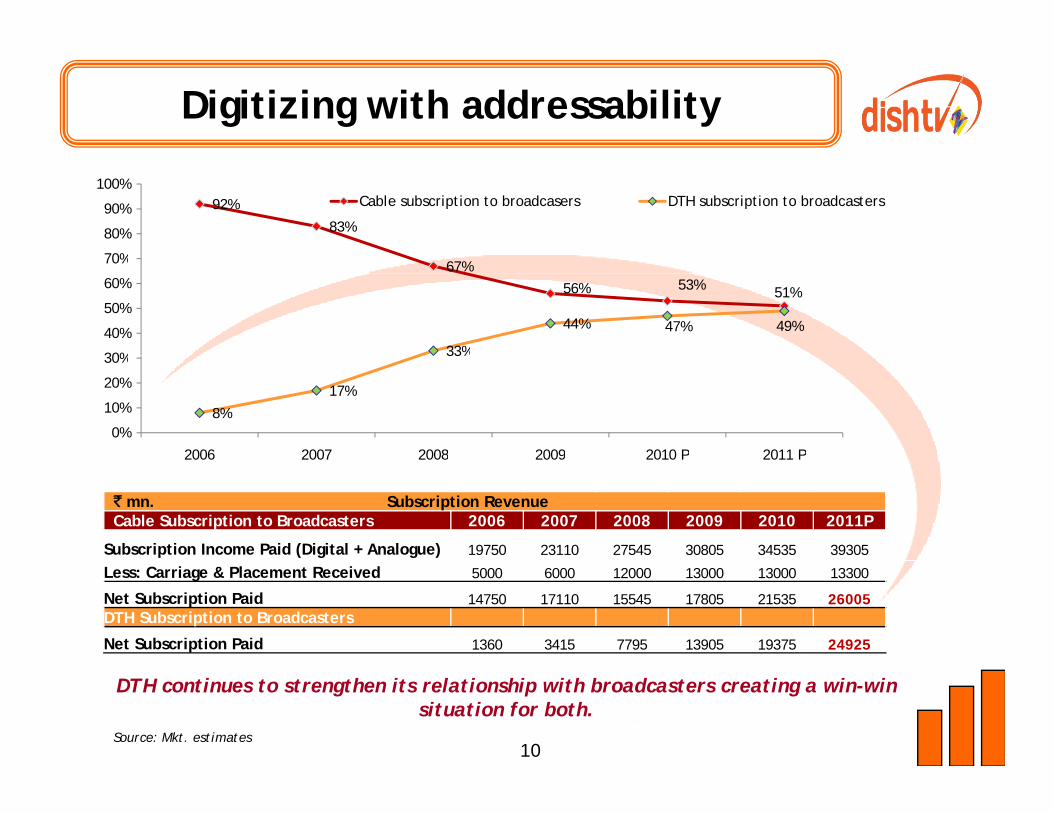
Digitizing with addressability
92%
83%
70%
80%
90%
100%Cable subscription to broadcasers DTH subscription to broadcasters
67%56% 53% 51%
33%
44% 47% 49%
30%
40%
50%
60%
70%
8%
17%
33%
0%
10%
20%
30%
2006 2007 2008 2009 2010 P 2011 P2006 2007 2008 2009 2010 P 2011 P
` mn. Subscription RevenueCable Subscription to Broadcasters 2006 2007 2008 2009 2010 2011P
Subscription Income Paid (Digital + Analogue) 19750 23110 27545 30805 34535 39305
Less: Carriage & Placement Received 5000 6000 12000 13000 13000 13300
Net Subscription Paid 14750 17110 15545 17805 21535 26005DTH Subscription to Broadcasters
Net Subscription Paid 1360 3415 7795 13905 19375 24925
10Source: Mkt. estimates
DTH continues to strengthen its relationship with broadcasters creating a win-win situation for both.
Dish TV – market leader in DTH
11
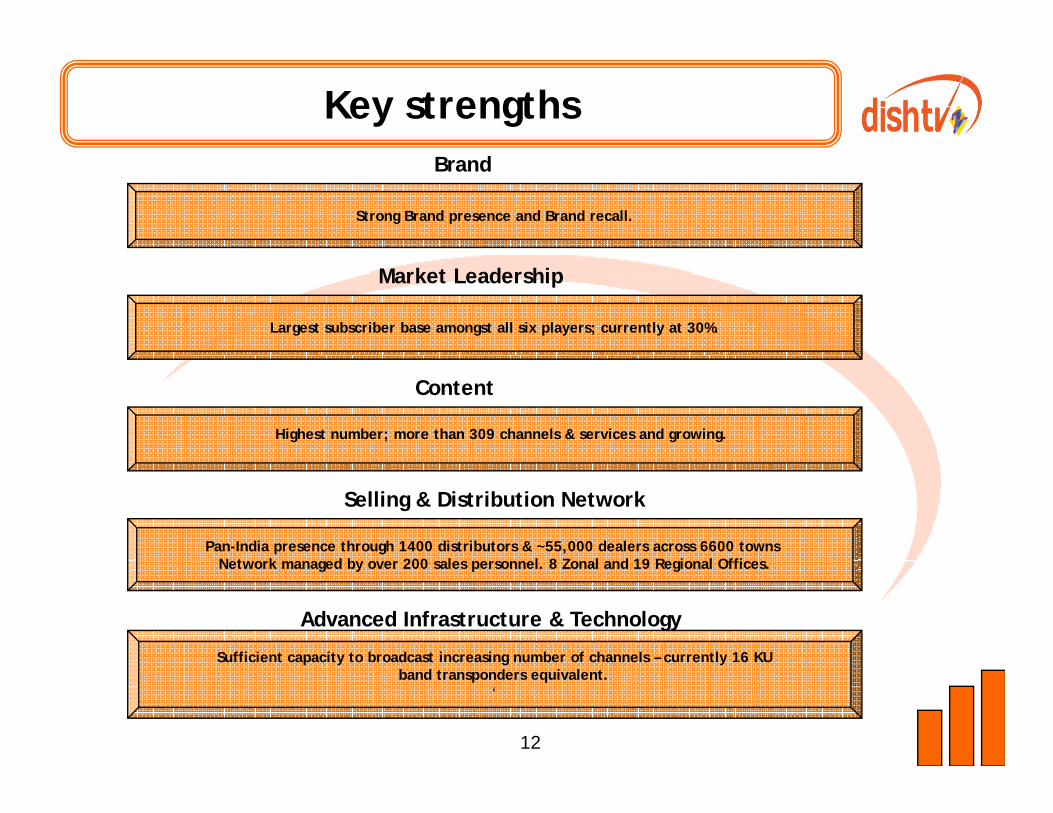
Key strengths
Strong Brand presence and Brand recall.
Brand
Largest subscriber base amongst all six players; currently at 30%.
Market Leadership
Highest number; more than 309 channels & services and growing.
Content
Pan-India presence through 1400 distributors & ~55,000 dealers across 6600 towns N t k g d b 200 l l 8 Z l d 19 R gi l Offi
Selling & Distribution Network
Network managed by over 200 sales personnel. 8 Zonal and 19 Regional Offices.
Sufficient capacity to broadcast increasing number of channels – currently 16 KU
Advanced Infrastructure & Technology
12
p y g yband transponders equivalent.
‘
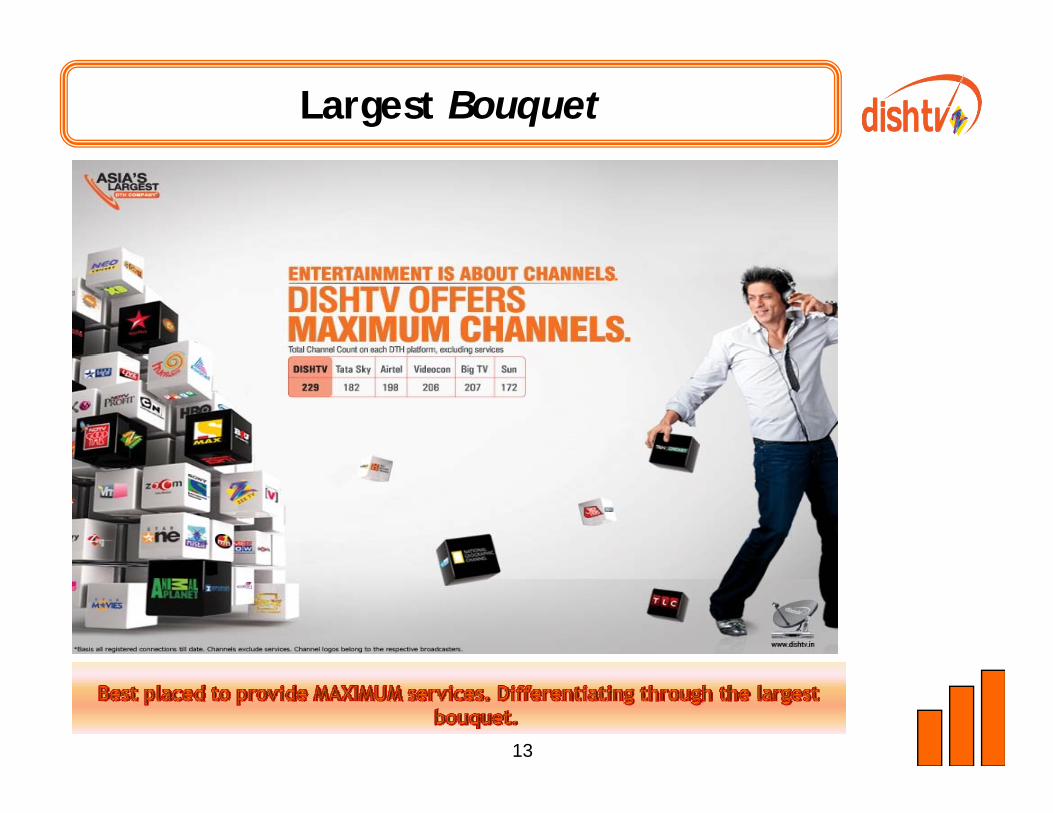
Largest Bouquet
13
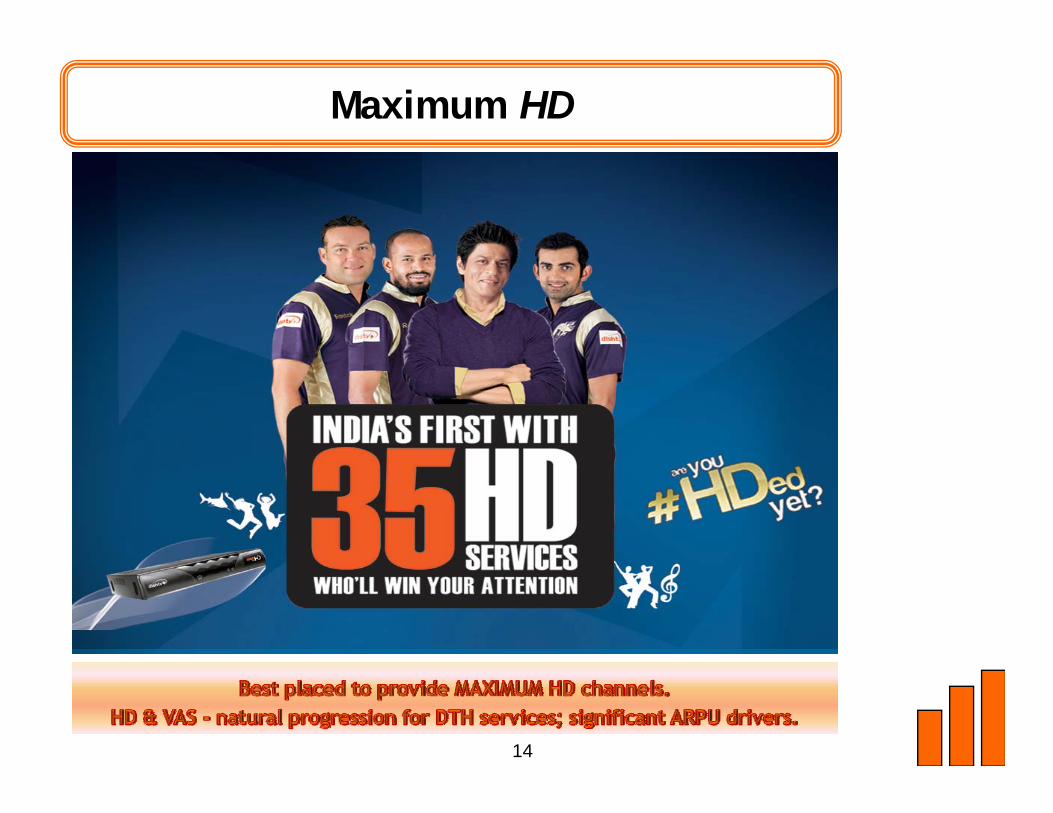
Maximum HD
14
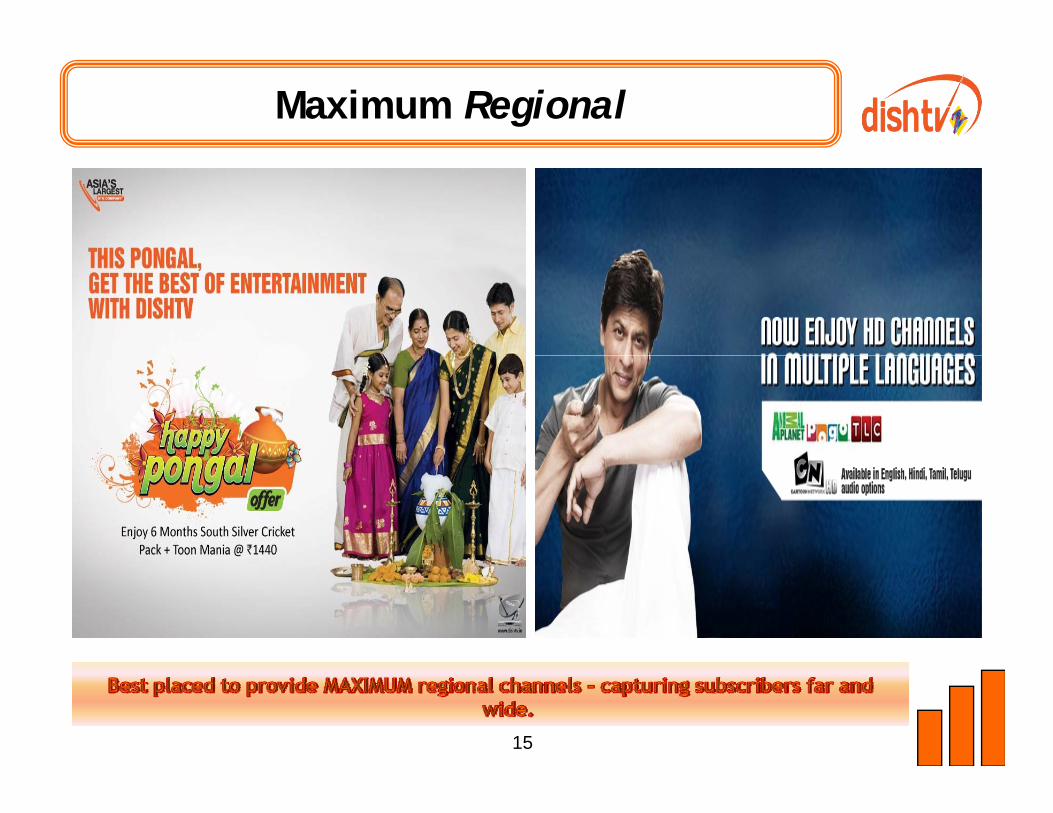
Maximum Regional
15
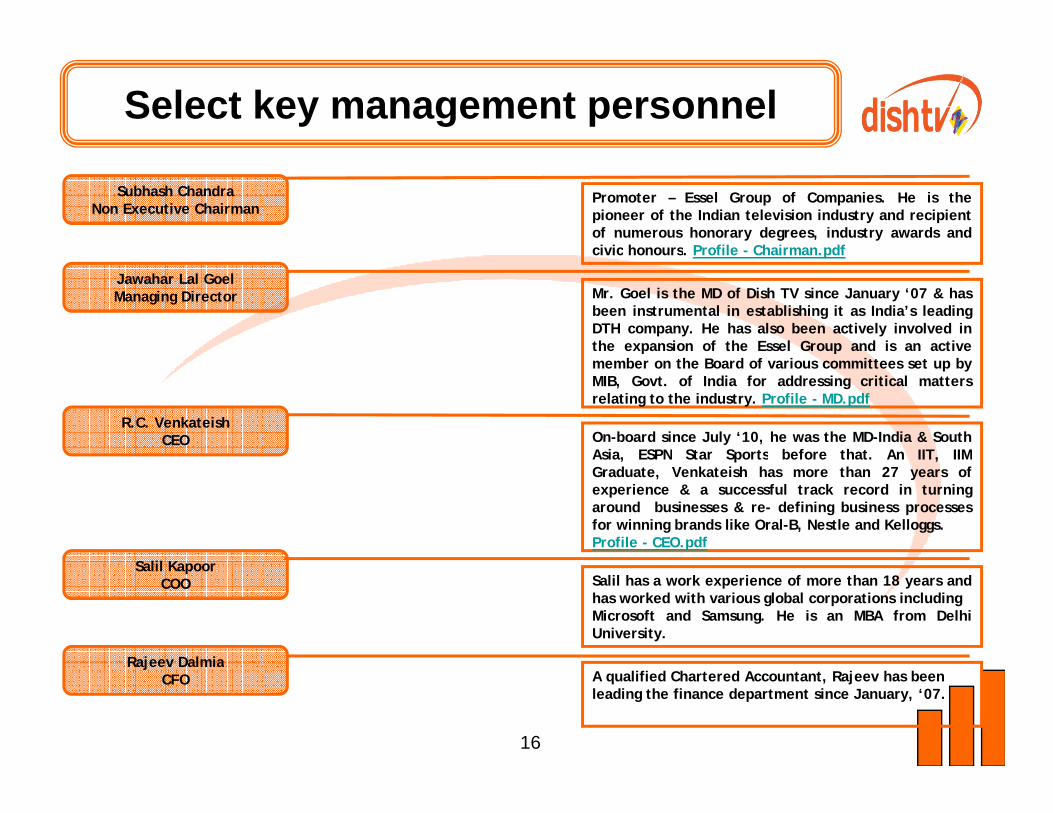
Select key management personnel
Promoter – Essel Group of Companies. He is thepioneer of the Indian television industry and recipientof numerous honorary degrees, industry awards andcivic honours Profile - Chairman pdf
Subhash ChandraNon Executive Chairman
civic honours. Profile Chairman.pdf
Mr. Goel is the MD of Dish TV since January ‘07 & hasbeen instrumental in establishing it as India’s leadingDTH company. He has also been actively involved inthe expansion of the Essel Group and is an active
Jawahar Lal GoelManaging Director
member on the Board of various committees set up byMIB, Govt. of India for addressing critical mattersrelating to the industry. Profile - MD.pdf
R.C. VenkateishCEO On-board since July ‘10, he was the MD-India & South
Asia, ESPN Star Sports before that. An IIT, IIMAsia, ESPN Star Sports before that. An IIT, IIMGraduate, Venkateish has more than 27 years ofexperience & a successful track record in turningaround businesses & re- defining business processesfor winning brands like Oral-B, Nestle and Kelloggs.Profile - CEO.pdf
S l l Salil KapoorCOO
Rajeev Dalmia
Salil has a work experience of more than 18 years andhas worked with various global corporations includingMicrosoft and Samsung. He is an MBA from DelhiUniversity.
16
Rajeev DalmiaCFO A qualified Chartered Accountant, Rajeev has been
leading the finance department since January, ‘07.
Dish TV – now
17
Asia - Pacific’s largest
18
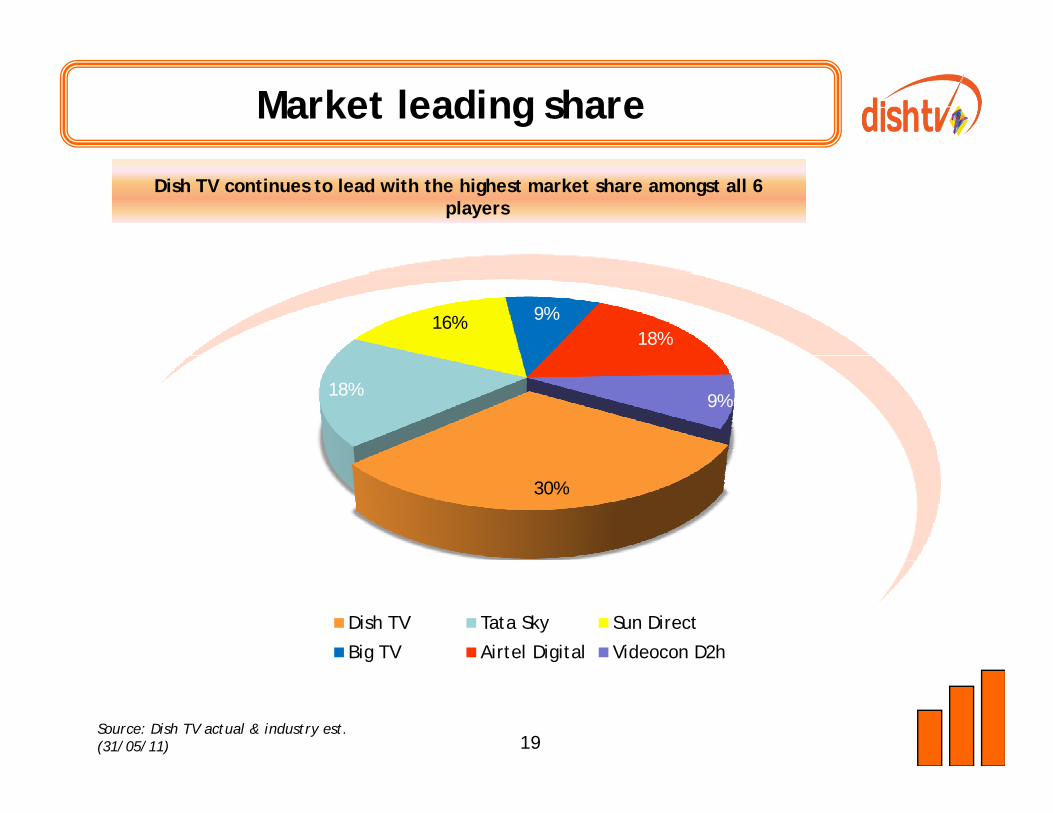
Market leading share
Dish TV continues to lead with the highest market share amongst all 6 players
16% 9%18%
18%9%
30%
Dish TV Tata Sky Sun Direct
Big TV Airtel Digital Videocon D2h
19Source: Dish TV actual & industry est. (31/05/11)
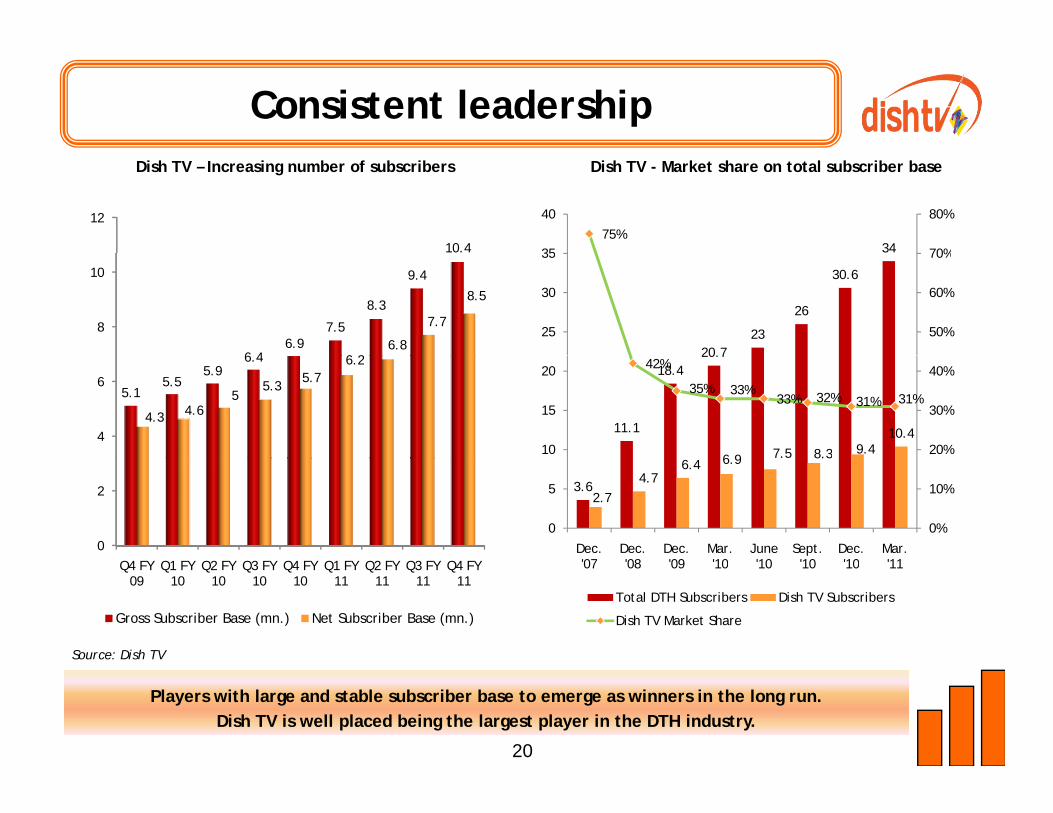
Consistent leadership
12
10.4
Dish TV – Increasing number of subscribers Dish TV - Market share on total subscriber base
3475%
70%
80%
35
40
8
10
6 46.9
7.5
8.3
9.4
6 26.8
7.7
8.5
20.723
26
30.6
50%
60%
70%
25
30
35
4
65.1
5.55.9
6.4
4.3 4.65
5.35.7
6.2
11.1
18.420.7
6 9 7.5 8.3 9.410.4
42%
35% 33%33% 32% 31% 31%
20%
30%
40%
10
15
20
0
2
Q Q Q2 Q3 Q Q Q2 Q3 Q
3.62.7
4.76.4 6.9 8.3
0%
10%
0
5
Dec. '07
Dec. '08
Dec. '09
Mar. '10
June '10
Sept. '10
Dec. '10
Mar. '11Q4 FY
09Q1 FY
10Q2 FY
10Q3 FY
10Q4 FY
10Q1 FY
11Q2 FY
11Q3 FY
11Q4 FY
11
Gross Subscriber Base (mn.) Net Subscriber Base (mn.)
Source: Dish TV
'07 '08 '09 '10 '10 '10 '10 '11
Total DTH Subscribers Dish TV Subscribers
Dish TV Market Share
20
Players with large and stable subscriber base to emerge as winners in the long run. Dish TV is well placed being the largest player in the DTH industry.
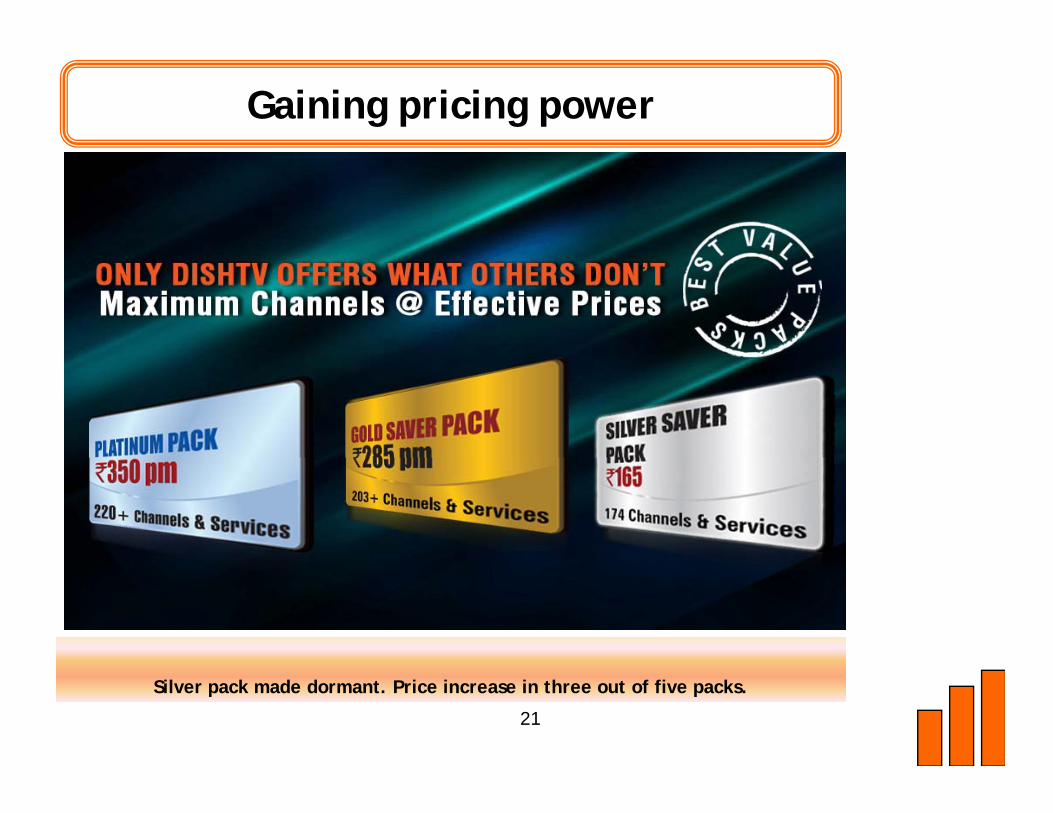
Gaining pricing power
21
Silver pack made dormant. Price increase in three out of five packs.
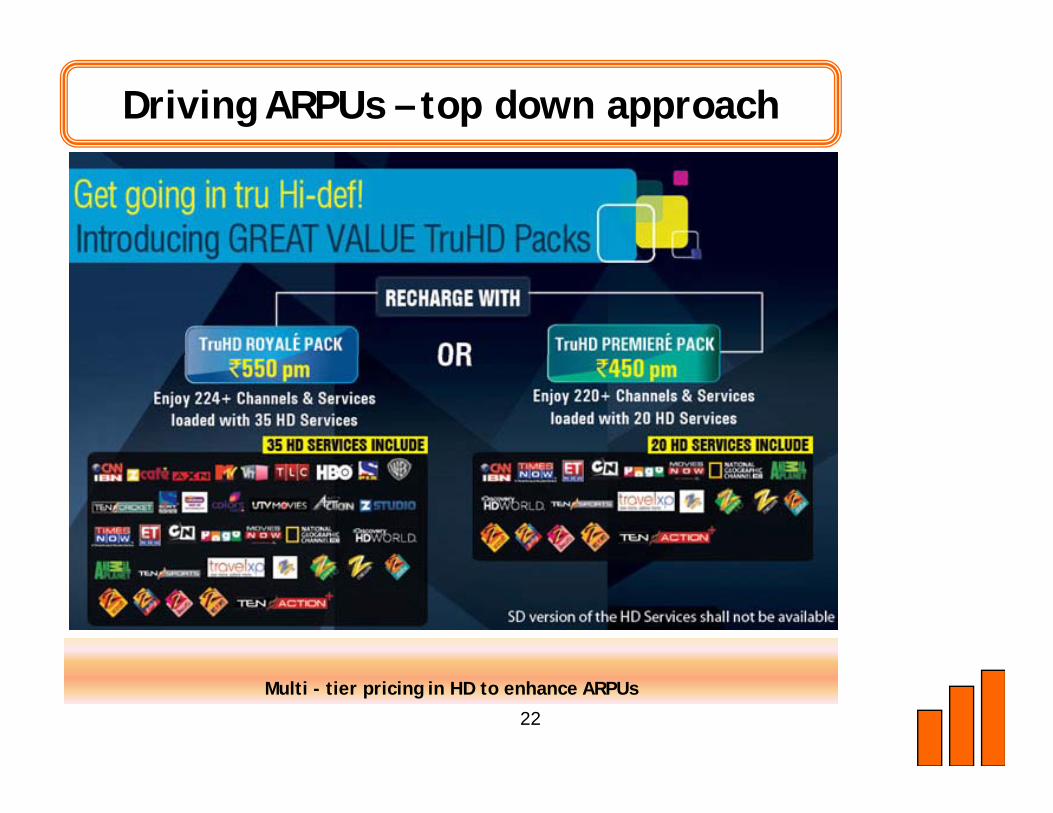
Driving ARPUs – top down approach
22Multi - tier pricing in HD to enhance ARPUs
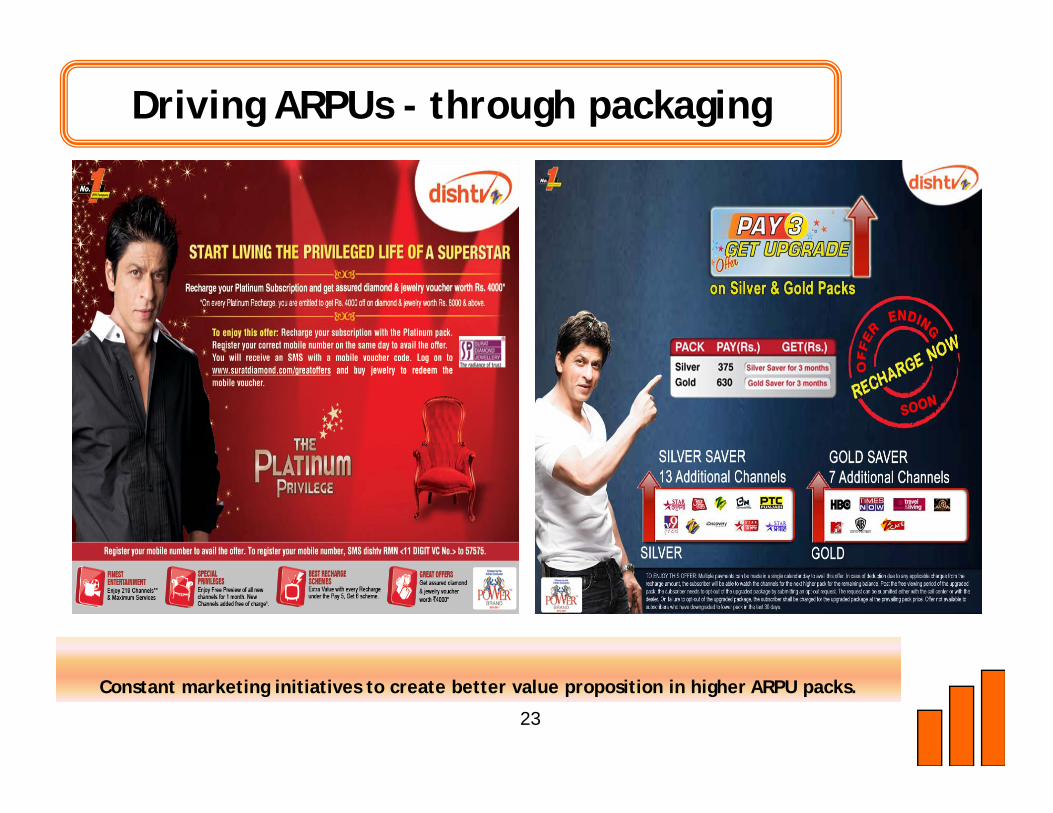
Driving ARPUs - through packaging
23
Constant marketing initiatives to create better value proposition in higher ARPU packs.
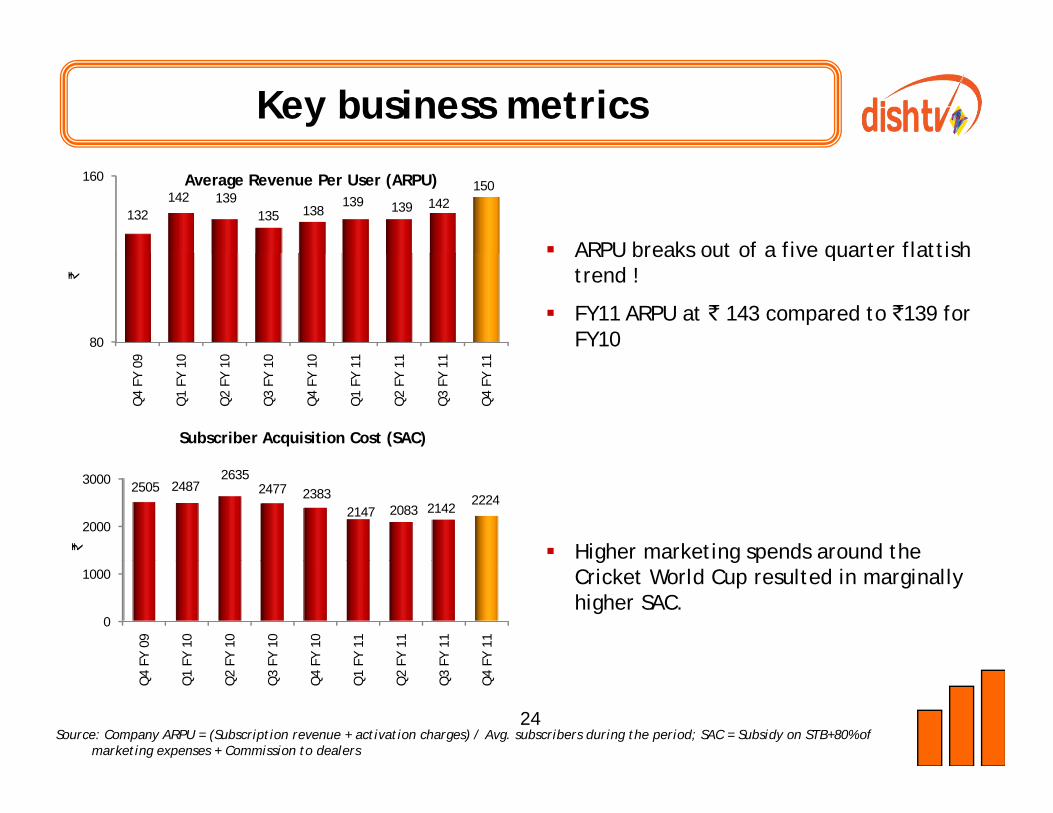
Key business metrics
Average Revenue Per User (ARPU)
ARPU breaks out of a five quarter flattish
160
132142 139
135 138139 139 142
150
ARPU breaks out of a five quarter flattish trend !
FY11 ARPU at ` 143 compared to `139 for FY10 80
9 0 0 0 0
`
Subscriber Acquisition Cost (SAC)
Q4
FY 0
9
Q1
FY 1
0
Q2
FY 1
0
Q3
FY 1
0
Q4
FY 1
0
Q1
FY 1
1
Q2
FY 1
1
Q3
FY 1
1
Q4
FY 1
1
Higher marketing spends around the 2000
3000 2505 24872635
2477 23832147 2083 2142
2224
` g g pCricket World Cup resulted in marginally higher SAC.
0
1000
FY 0
9
FY 1
0
FY 1
0
FY 1
0
FY 1
0
FY 1
1
FY 1
1
FY 1
1
FY 1
1
24Source: Company ARPU = (Subscription revenue + activation charges) / Avg. subscribers during the period; SAC = Subsidy on STB+80% of
marketing expenses + Commission to dealers
Q4
F
Q1
F
Q2
F
Q3
F
Q4
F
Q1
F
Q2
F
Q3
F
Q4
F
Financials
25
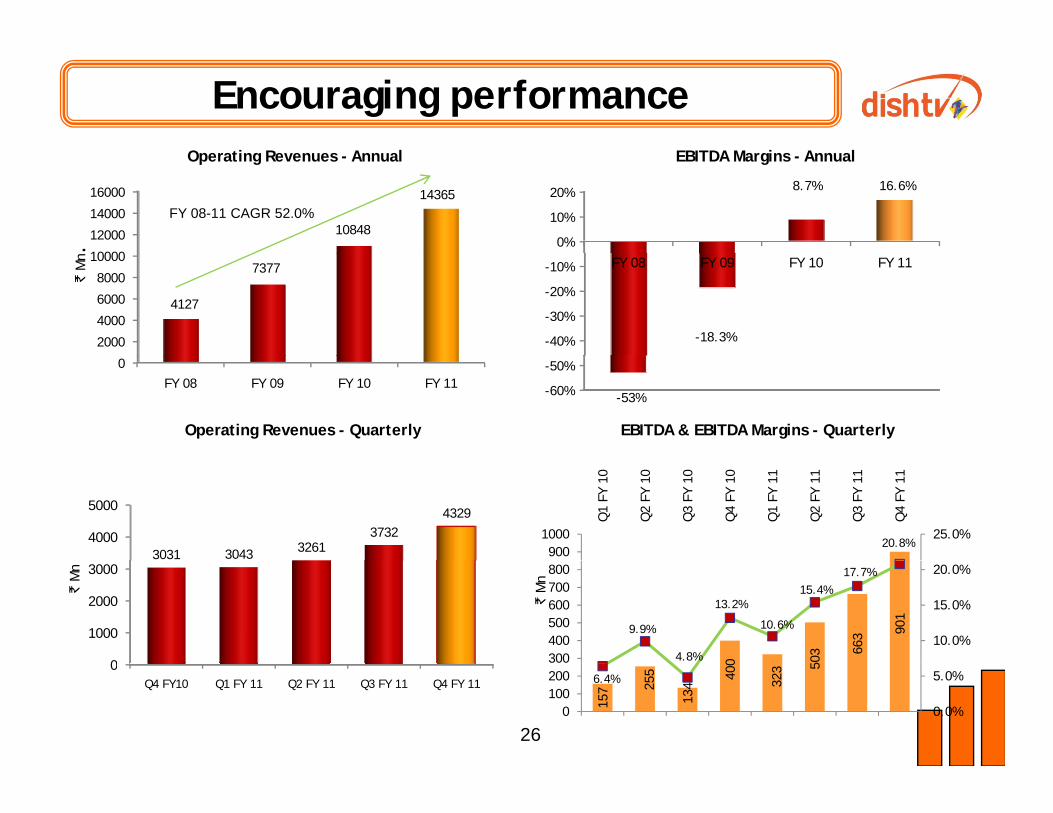
Encouraging performanceEBITDA M i A lO i R A l
FY 08-11 CAGR 52.0%
EBITDA Margins - Annual
10000
12000
14000
16000
10848
14365
.
Operating Revenues - Annual
0%
10%
20% 8.7% 16.6%
2000
4000
6000
8000
10000
4127
7377
`M
n
-40%
-30%
-20%
-10% FY 08 FY 09 FY 10 FY 11
-18.3%
EBITDA & EBITDA Margins - QuarterlyOperating Revenues - Quarterly
0FY 08 FY 09 FY 10 FY 11 -60%
-50%
-53%
4000
5000
3031 3043 32613732
4329
20.8%25.0%
9001000
Q1
FY 1
0
Q2
FY 1
0
Q3
FY 1
0
Q4
FY 1
0
Q1
FY 1
1
Q2
FY 1
1
Q3
FY 1
1
Q4
FY 1
1
0
1000
2000
3000
`M
n
0 03
663 90
1
9.9%
4.8%
13.2%
10.6%
15.4%17.7%
10.0%
15.0%
20.0%
300400500600700800
`M
n
26
0Q4 FY10 Q1 FY 11 Q2 FY 11 Q3 FY 11 Q4 FY 11
157 25
5
134
400
323 5
6.4%
0.0%
5.0%
0100200
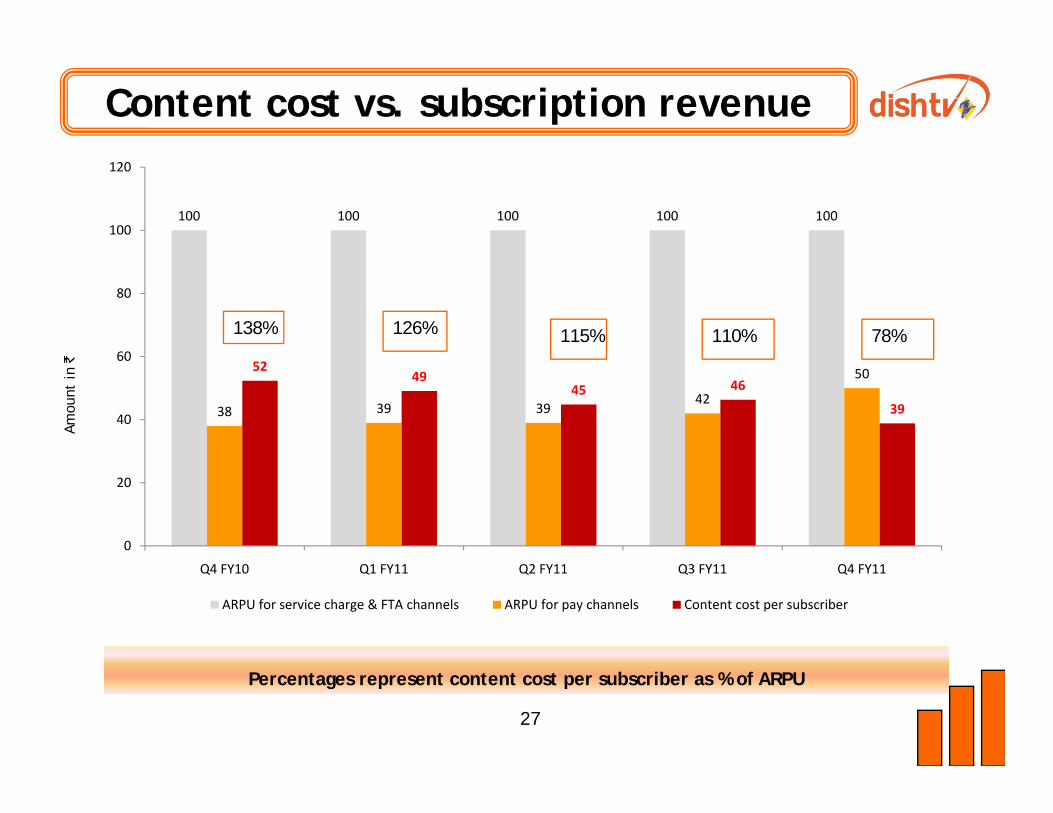
Content cost vs. subscription revenue
100 100 100 100 100100
120
60
80
126% 115% 110% 78%138%
Amou
nt in
`
38 39 3942
505249
45 46
3940
60
0
20
Q4 FY10 Q1 FY11 Q2 FY11 Q3 FY11 Q4 FY11
ARPU for service charge & FTA channels ARPU for pay channels Content cost per subscriber
27
Percentages represent content cost per subscriber as % of ARPU
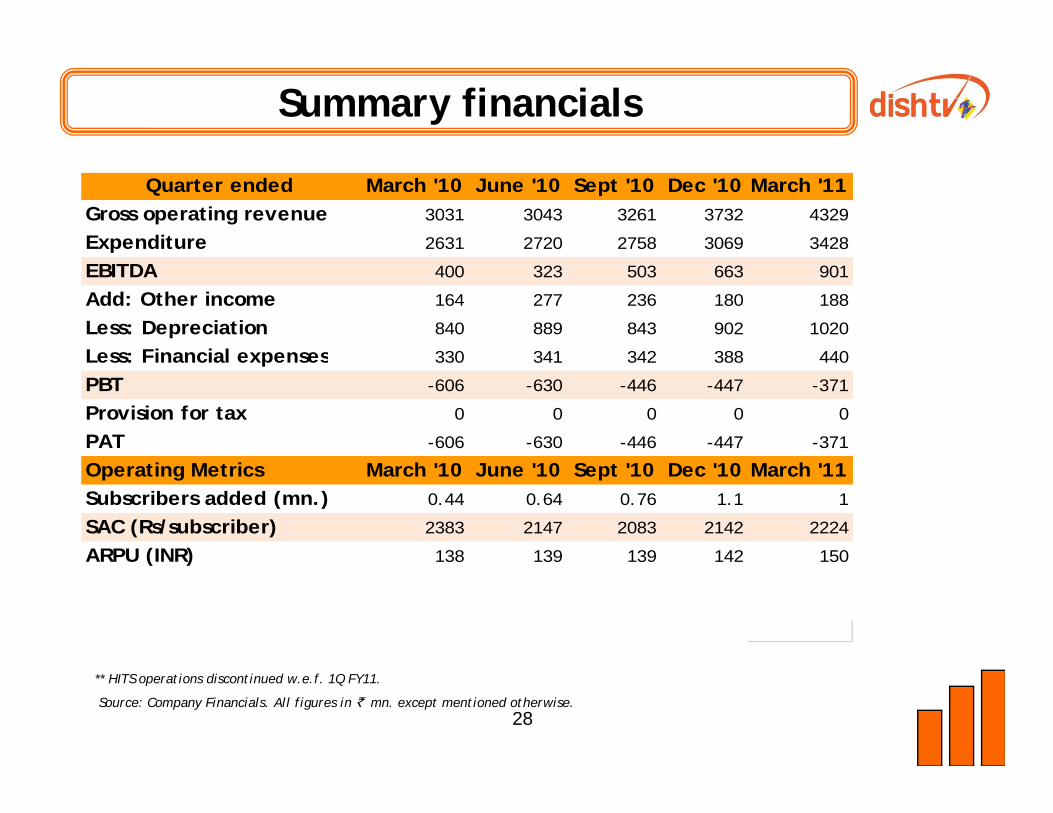
Summary financials
Quarter ended March '10 June '10 Sept '10 Dec '10 March '11Gross operating revenue 3031 3043 3261 3732 4329
Expenditure 2631 2720 2758 3069 3428
EBITDA 400 323 503 663 901
Add: Other income 164 277 236 180 188
Less: Depreciation 840 889 843 902 1020
Less: Financial expenses 330 341 342 388 440Less: Financial expenses 330 341 342 388 440
PBT -606 -630 -446 -447 -371
Provision for tax 0 0 0 0 0
PAT -606 -630 -446 -447 -371
Operating Metrics March '10 June '10 Sept '10 Dec '10 March '11Subscribers added (mn.) 0.44 0.64 0.76 1.1 1
SAC (Rs/subscriber) 2383 2147 2083 2142 2224
ARPU (INR) 138 139 139 142 150ARPU (INR) 138 139 139 142 150
28
** HITS operations discontinued w.e.f. 1Q FY11.
Source: Company Financials. All figures in ` mn. except mentioned otherwise.
Thank you
29
Questions
30