Embed Size (px)
Citation preview
1
4QFY2010 Result Update I Banking
April 28, 2010
Please refer to important disclosures at the end of this report Sebi Registration No: INB 010996539
Investment Period 12 Months
Stock Info
Sector Banking
Market Cap (Rs cr) 2,379
Beta 1.0
52 WK High / Low 93/36
Avg. Daily Volume 1246665
Face Value (Rs) 10
BSE Sensex 17,380
Nifty 5,215
Reuters Code DENA.BO
Bloomberg Code DBNK@IN
Shareholding Pattern (%)
Promoters 51.2
MF/Banks/Indian FIs 13.0
FII/NRIs/OCBs 16.0
Indian Public 19.8
Abs (%) 3m 1yr 3yr
Sensex 6.6 58.0 25.0
Dena Bank 62.5 122.7 120.3
Dena Bank reported a Net Profit growth of 23.3% yoy, ahead of our estimates, on account of a higher-than-expected improvement in the NIMs and better-than-expected income from recoveries, which boosted the non-interest income of the bank. We maintain a Buy rating on the stock.
Better-than-expected NIMs and Recoveries: Sequential growth in advances (at 14.7%) exceeded deposit growth by 7.4%, resulting in a CD ratio of 69.1% (from 64.6% in 3QFY2010). The reported NIMs of the bank improved to 2.8% in 4QFY2010, from 2.5% in 3QFY2010 and 2.4% in 4QFY2009. CASA deposits increased by 23.0% yoy to Rs18,320cr at the end of 4QFY2010. Non-interest income increased by 24.8% yoy to Rs175cr, driven by a strong traction in recoveries in written-off accounts, which stood at Rs70cr (against Rs28cr in 4QFY2010 and Rs22cr in 3QFY2010). The Gross NPA and Net NPA ratios improved to 1.8% (1.9% in 3QFY2010) and 1.2% (1.2% in 3QFY2010), respectively. The NPA provision coverage ratio stood at 78.0% including technical write-offs. The bank’s CAR stood at 12.7%, with Tier-I capital of 8.2% (forming 65% of the total CAR). During 1HFY2011, the Government is expected to infuse capital of Rs600cr in the bank, Rs300cr each in the form of Equity and Preference Capital. The management also expects to receive Rs700cr from the Government in the form of Preference Capital over FY2012-13E.
Outlook and Valuation: Dena Bank, with a strong CASA ratio of 35.7%, is better placed than its peers to protect its NIMs in a rising interest rate environment. After the proposed capital infusion, the Bank's Tier-I ratio will improve to 9.1% by end-FY2011E from 8.2% in FY2010, and will enable it to maintain its CAR well above the 12% level till FY2012E. We estimate Advances to grow at a 17% CAGR over FY2009-12E, driving an Earnings’ CAGR of 16% over the period. At the CMP, the stock is trading at 3.8x FY2012E EPS of Rs21.9 and 0.7x FY2012E Adjusted Book Value of Rs120.6. We have assigned a Target FY2012E P/ABV multiple of 0.8x to Dena Bank, (equal to its 5-year median P/ABV multiple) to arrive at a Target Price of Rs98, translating into an upside of 18.4%. Hence, we maintain a Buy on the stock.
Key Financials Y/E March (Rs cr) FY2009 FY2010E FY2011E FY2012E
NII 1,064 1,100 1,295 1,481
% chg 19.2 3.3 17.7 14.4
Net Profit 423 511 556 629
% chg 17.5 21.0 8.8 13.1
NIM (%) 2.8 2.4 2.4 2.3
EPS (Rs) 14.7 17.8 19.4 21.9
P/E (x) 5.6 4.7 4.3 3.8
P/ABV (x) 1.3 1.0 0.8 0.7
RoA (%) 1.0 1.0 0.9 0.9
RoE (%) 21.3 21.2 19.2 18.4 Source: Company, Angel Research
Dena Bank Performance Highlights
BUY CMP Rs83 Target Price Rs98
Vaibhav Agrawal Tel: 022 – 4040 3800 Ext: 333
E-mail: [email protected]
Amit Rane Tel: 022 – 4040 3800 Ext: 326
E-mail: [email protected]
April 28, 2010 2
Dena Bank I 4QFY2010 Result Update
Exhibit 1: 4QFY2010 Performance
Y/E March (Rs cr) 4QFY10 3QFY10 % chg (qoq) 4QFY09 % chg (yoy) FY10 FY09 % chg Interest Earned 1,063 1,016 4.7 896 18.7 4,010 3,447 16.3 Interest Expenses 737 733 0.6 657 12.2 2,910 2,383 22.1 Net Interest Income 326 283 15.2 239 36.5 1,100 1,064 3.3 Non-Interest Income 175 133 31.3 140 24.9 589 430 36.9 Total Income 501 416 20.4 379 32.2 1,689 1,495 13.0 Operating Expenses 221 218 1.1 191 15.5 848 768 10.4 Pre-Prov Profit 280 198 41.7 188 49.2 841 726 15.7 Provisions & Cont. 82 29 181.8 51 60.5 154 185 (16.8) PBT 198 168 17.4 136 44.9 687 541 26.8 Prov. for Taxes 61 34 78.8 25 140.2 176 119 47.8 PAT 137 135 1.9 111 23.3 511 423 21.0 EPS (Rs) 4.8 4.7 1.9 3.9 23.3 17.8 14.7 21.0
Cost to Income (%) 44.1 52.5
50.5
50.2 51.4
Effective Tax Rate (%) 30.7 20.1
18.5
25.6 21.9
Net NPA (%) 1.2 1.2 1.1 1.2 1.1 Source: Company, Angel Research
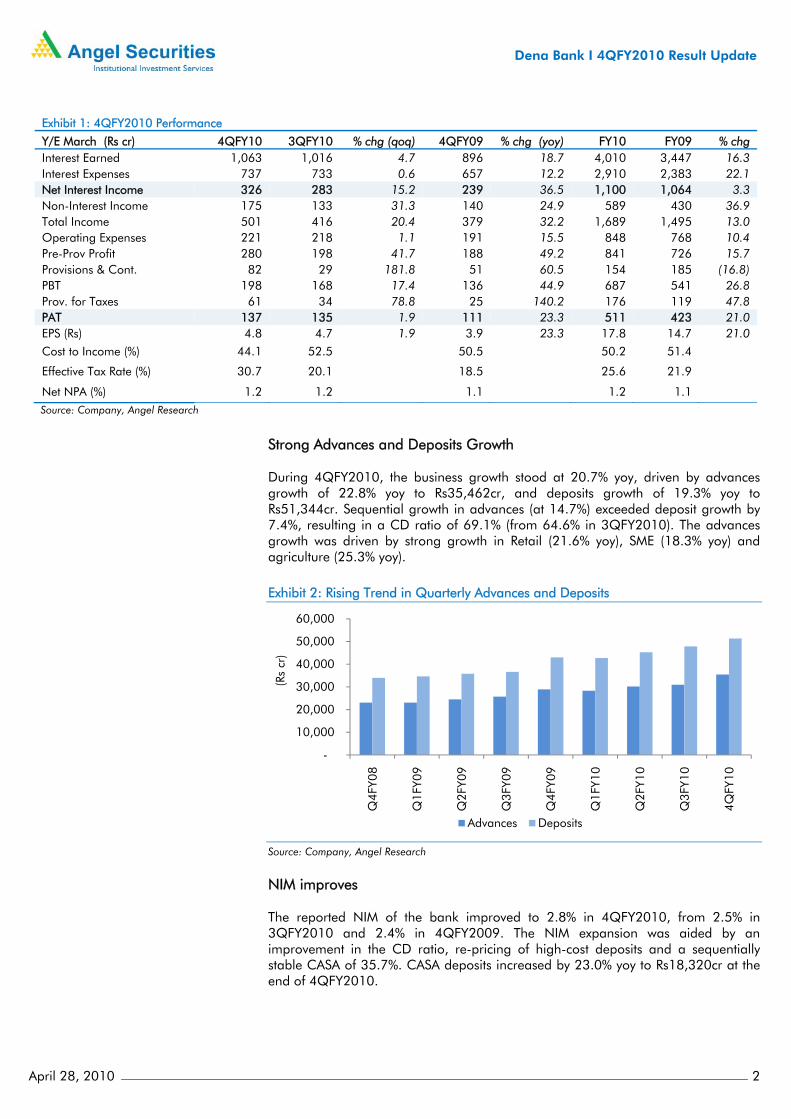
Strong Advances and Deposits Growth During 4QFY2010, the business growth stood at 20.7% yoy, driven by advances growth of 22.8% yoy to Rs35,462cr, and deposits growth of 19.3% yoy to Rs51,344cr. Sequential growth in advances (at 14.7%) exceeded deposit growth by 7.4%, resulting in a CD ratio of 69.1% (from 64.6% in 3QFY2010). The advances growth was driven by strong growth in Retail (21.6% yoy), SME (18.3% yoy) and agriculture (25.3% yoy). Exhibit 2: Rising Trend in Quarterly Advances and Deposits
Source: Company, Angel Research
NIM improves The reported NIM of the bank improved to 2.8% in 4QFY2010, from 2.5% in 3QFY2010 and 2.4% in 4QFY2009. The NIM expansion was aided by an improvement in the CD ratio, re-pricing of high-cost deposits and a sequentially stable CASA of 35.7%. CASA deposits increased by 23.0% yoy to Rs18,320cr at the end of 4QFY2010.
-
10,000
20,000
30,000
40,000
50,000
60,000
Q4F
Y08
Q1F
Y09
Q2F
Y09
Q3F
Y09
Q4F
Y09
Q1F
Y10
Q2F
Y10
Q3F
Y10
4QFY
10
Advances Deposits
(Rs
cr)
April 28, 2010 3
Dena Bank I 4QFY2010 Result Update
Strong Growth in Non-Interest Income driven by Recoveries Non-interest income increased by 24.8% yoy to Rs175cr, driven by a strong traction in recoveries in written-off accounts, which stood at Rs70cr (against Rs28cr in 4QFY2010 and Rs22cr in 3QFY2010). The management expects to recover ~Rs120cr p.a. for the next two years. The core fee income increased by 7.1% to Rs97cr during 4QFY2010, and recorded a 25.0% growth in FY2010. Exhibit 3: Non-Interest Income Period (Rs cr) 4QFY10 3QFY10 % qoq 4QFY09 % yoy Fee based Income 97 83 16.7 91 7.1 Income from Recoveries 70 22 219.1 28 155.3 Profit on Sale of Invest. 8 28 (72.3) 22 (64.7) Total Non-Int. income 175 133 31.5 140 2489 Source: Company, Angel Research
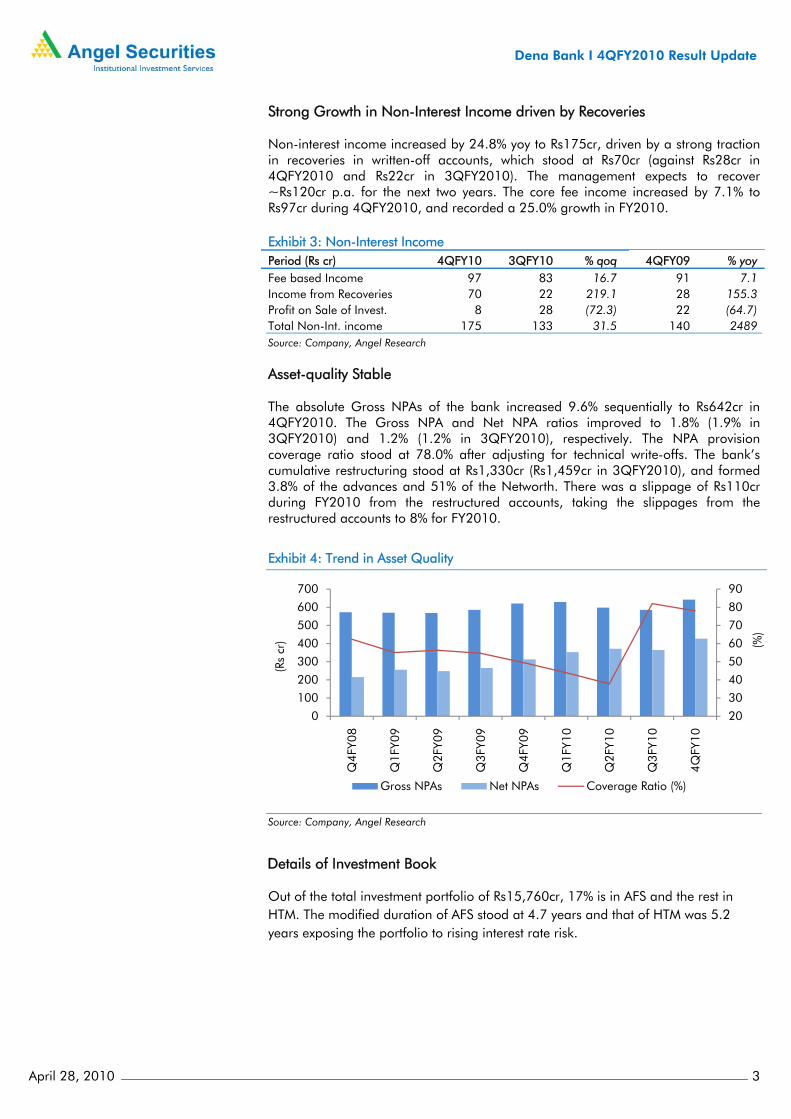
Asset-quality Stable
The absolute Gross NPAs of the bank increased 9.6% sequentially to Rs642cr in 4QFY2010. The Gross NPA and Net NPA ratios improved to 1.8% (1.9% in 3QFY2010) and 1.2% (1.2% in 3QFY2010), respectively. The NPA provision coverage ratio stood at 78.0% after adjusting for technical write-offs. The bank’s cumulative restructuring stood at Rs1,330cr (Rs1,459cr in 3QFY2010), and formed 3.8% of the advances and 51% of the Networth. There was a slippage of Rs110cr during FY2010 from the restructured accounts, taking the slippages from the restructured accounts to 8% for FY2010.
Exhibit 4: Trend in Asset Quality
Source: Company, Angel Research
Details of Investment Book
Out of the total investment portfolio of Rs15,760cr, 17% is in AFS and the rest in HTM. The modified duration of AFS stood at 4.7 years and that of HTM was 5.2 years exposing the portfolio to rising interest rate risk.
20
30
40
50
60
70
80
90
0
100
200
300
400
500
600
700
Q4F
Y08
Q1F
Y09
Q2F
Y09
Q3F
Y09
Q4F
Y09
Q1F
Y10
Q2F
Y10
Q3F
Y10
4QFY
10
Gross NPAs Net NPAs Coverage Ratio (%)
(%)
(Rs
cr)
April 28, 2010 4
Dena Bank I 4QFY2010 Result Update
Improved Productivity
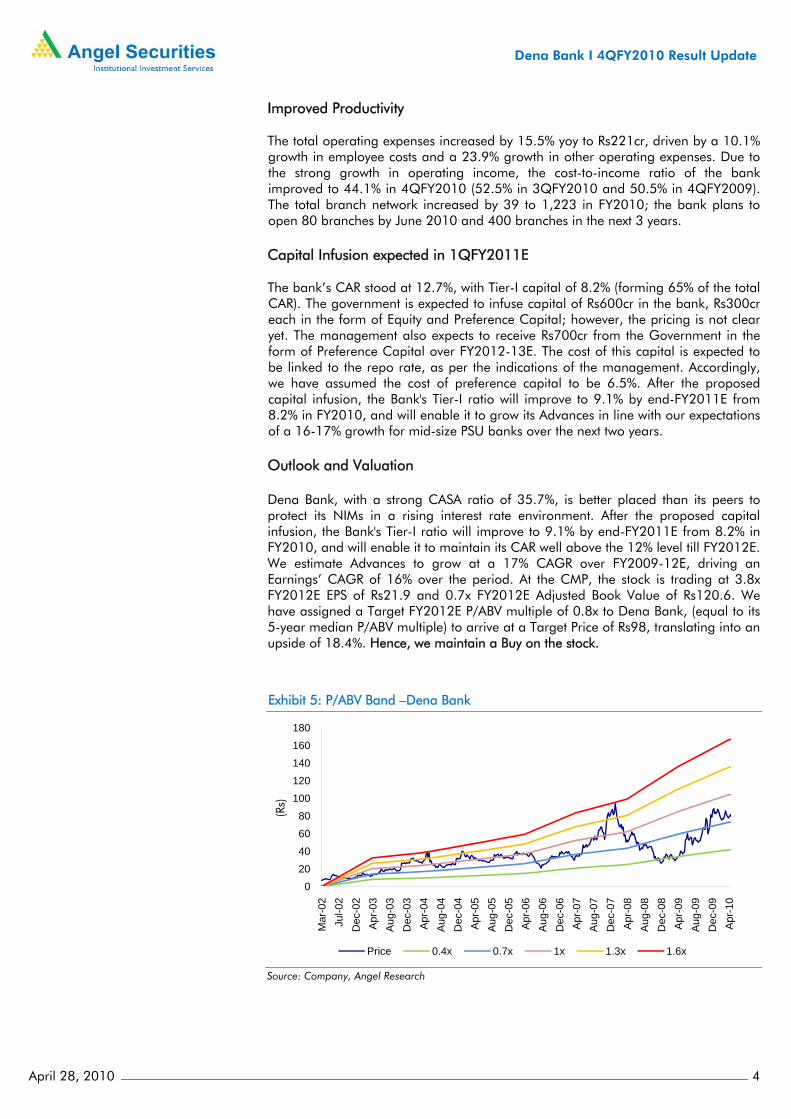
The total operating expenses increased by 15.5% yoy to Rs221cr, driven by a 10.1% growth in employee costs and a 23.9% growth in other operating expenses. Due to the strong growth in operating income, the cost-to-income ratio of the bank improved to 44.1% in 4QFY2010 (52.5% in 3QFY2010 and 50.5% in 4QFY2009). The total branch network increased by 39 to 1,223 in FY2010; the bank plans to open 80 branches by June 2010 and 400 branches in the next 3 years. Capital Infusion expected in 1QFY2011E The bank’s CAR stood at 12.7%, with Tier-I capital of 8.2% (forming 65% of the total CAR). The government is expected to infuse capital of Rs600cr in the bank, Rs300cr each in the form of Equity and Preference Capital; however, the pricing is not clear yet. The management also expects to receive Rs700cr from the Government in the form of Preference Capital over FY2012-13E. The cost of this capital is expected to be linked to the repo rate, as per the indications of the management. Accordingly, we have assumed the cost of preference capital to be 6.5%. After the proposed capital infusion, the Bank's Tier-I ratio will improve to 9.1% by end-FY2011E from 8.2% in FY2010, and will enable it to grow its Advances in line with our expectations of a 16-17% growth for mid-size PSU banks over the next two years. Outlook and Valuation Dena Bank, with a strong CASA ratio of 35.7%, is better placed than its peers to protect its NIMs in a rising interest rate environment. After the proposed capital infusion, the Bank's Tier-I ratio will improve to 9.1% by end-FY2011E from 8.2% in FY2010, and will enable it to maintain its CAR well above the 12% level till FY2012E. We estimate Advances to grow at a 17% CAGR over FY2009-12E, driving an Earnings’ CAGR of 16% over the period. At the CMP, the stock is trading at 3.8x FY2012E EPS of Rs21.9 and 0.7x FY2012E Adjusted Book Value of Rs120.6. We have assigned a Target FY2012E P/ABV multiple of 0.8x to Dena Bank, (equal to its 5-year median P/ABV multiple) to arrive at a Target Price of Rs98, translating into an upside of 18.4%. Hence, we maintain a Buy on the stock.
Exhibit 5: P/ABV Band –Dena Bank
Source: Company, Angel Research
020406080
100120140160180
Mar
-02
Jul-0
2D
ec-0
2A
pr-0
3A
ug-0
3D
ec-0
3A
pr-0
4A
ug-0
4D
ec-0
4A
pr-0
5A
ug-0
5D
ec-0
5A
pr-0
6A
ug-0
6D
ec-0
6A
pr-0
7A
ug-0
7D
ec-0
7A
pr-0
8A
ug-0
8D
ec-0
8A
pr-0
9A
ug-0
9D
ec-0
9A
pr-1
0
Price 0.4x 0.7x 1x 1.3x 1.6x
(Rs)
April 28, 2010 5
Dena Bank I 4QFY2010 Result Update
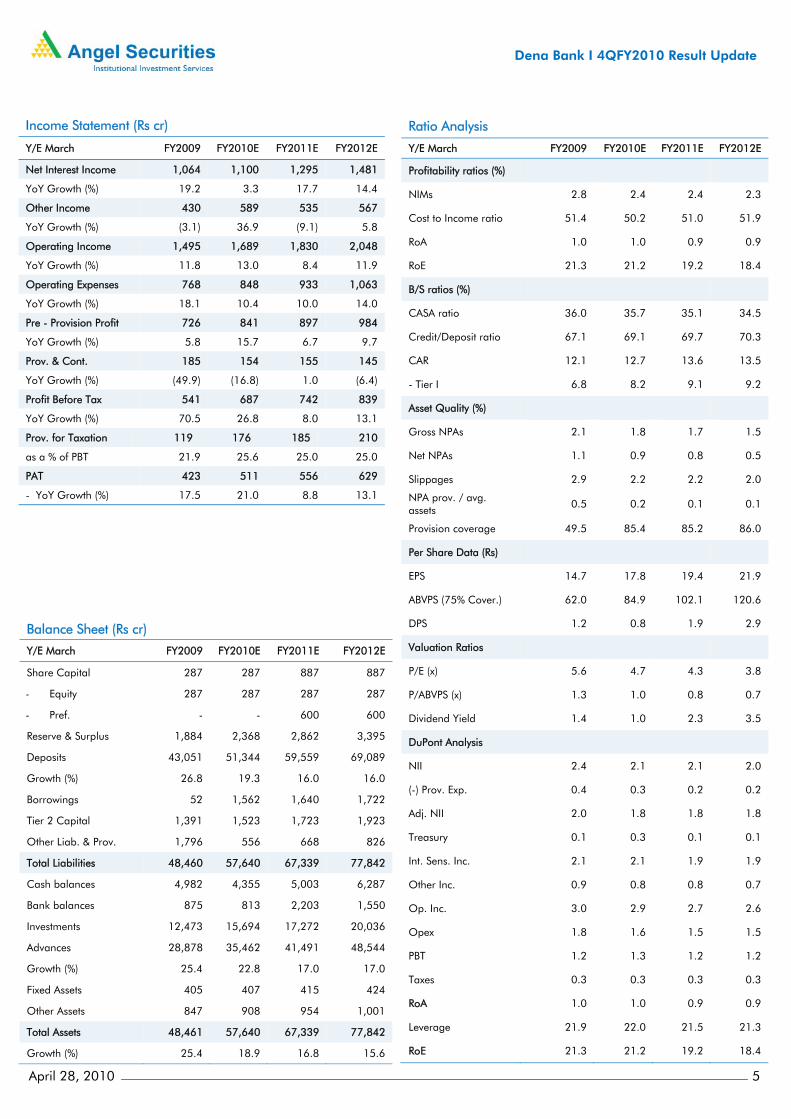
Income Statement (Rs cr)
Y/E March FY2009 FY2010E FY2011E FY2012E
Net Interest Income 1,064 1,100 1,295 1,481
YoY Growth (%) 19.2 3.3 17.7 14.4
Other Income 430 589 535 567
YoY Growth (%) (3.1) 36.9 (9.1) 5.8
Operating Income 1,495 1,689 1,830 2,048
YoY Growth (%) 11.8 13.0 8.4 11.9
Operating Expenses 768 848 933 1,063
YoY Growth (%) 18.1 10.4 10.0 14.0
Pre - Provision Profit 726 841 897 984
YoY Growth (%) 5.8 15.7 6.7 9.7
Prov. & Cont. 185 154 155 145
YoY Growth (%) (49.9) (16.8) 1.0 (6.4)
Profit Before Tax 541 687 742 839
YoY Growth (%) 70.5 26.8 8.0 13.1
Prov. for Taxation 119 176 185 210
as a % of PBT 21.9 25.6 25.0 25.0
PAT 423 511 556 629
- YoY Growth (%) 17.5 21.0 8.8 13.1
Ratio Analysis
Y/E March FY2009 FY2010E FY2011E FY2012E
Profitability ratios (%)
NIMs 2.8 2.4 2.4 2.3
Cost to Income ratio 51.4 50.2 51.0 51.9
RoA 1.0 1.0 0.9 0.9
RoE 21.3 21.2 19.2 18.4
B/S ratios (%)
CASA ratio 36.0 35.7 35.1 34.5
Credit/Deposit ratio 67.1 69.1 69.7 70.3
CAR 12.1 12.7 13.6 13.5
- Tier I 6.8 8.2 9.1 9.2
Asset Quality (%)
Gross NPAs 2.1 1.8 1.7 1.5
Net NPAs 1.1 0.9 0.8 0.5
Slippages 2.9 2.2 2.2 2.0
NPA prov. / avg. assets
0.5 0.2 0.1 0.1
Provision coverage 49.5 85.4 85.2 86.0
Per Share Data (Rs)
EPS 14.7 17.8 19.4 21.9
ABVPS (75% Cover.) 62.0 84.9 102.1 120.6
DPS 1.2 0.8 1.9 2.9
Valuation Ratios
P/E (x) 5.6 4.7 4.3 3.8
P/ABVPS (x) 1.3 1.0 0.8 0.7
Dividend Yield 1.4 1.0 2.3 3.5
DuPont Analysis
NII 2.4 2.1 2.1 2.0
(-) Prov. Exp. 0.4 0.3 0.2 0.2
Adj. NII 2.0 1.8 1.8 1.8
Treasury 0.1 0.3 0.1 0.1
Int. Sens. Inc. 2.1 2.1 1.9 1.9
Other Inc. 0.9 0.8 0.8 0.7
Op. Inc. 3.0 2.9 2.7 2.6
Opex 1.8 1.6 1.5 1.5
PBT 1.2 1.3 1.2 1.2
Taxes 0.3 0.3 0.3 0.3
RoA 1.0 1.0 0.9 0.9
Leverage 21.9 22.0 21.5 21.3
RoE 21.3 21.2 19.2 18.4
Balance Sheet (Rs cr)
Y/E March FY2009 FY2010E FY2011E FY2012E
Share Capital 287 287 887 887
- Equity 287 287 287 287
- Pref. - - 600 600
Reserve & Surplus 1,884 2,368 2,862 3,395
Deposits 43,051 51,344 59,559 69,089
Growth (%) 26.8 19.3 16.0 16.0
Borrowings 52 1,562 1,640 1,722
Tier 2 Capital 1,391 1,523 1,723 1,923
Other Liab. & Prov. 1,796 556 668 826
Total Liabilities 48,460 57,640 67,339 77,842
Cash balances 4,982 4,355 5,003 6,287
Bank balances 875 813 2,203 1,550
Investments 12,473 15,694 17,272 20,036
Advances 28,878 35,462 41,491 48,544
Growth (%) 25.4 22.8 17.0 17.0
Fixed Assets 405 407 415 424
Other Assets 847 908 954 1,001
Total Assets 48,461 57,640 67,339 77,842
Growth (%) 25.4 18.9 16.8 15.6
April 28, 2010 6
Dena Bank I 4QFY2010 Result Update
Research Team Tel: 022-4040 3800 E-mail: [email protected] Website: www.angeltrade.com DISCLAIMER This document is solely for the personal information of the recipient, and must not be singularly used as the basis of any investment decision. Nothing in this
document should be construed as investment or financial advice. Each recipient of this document should make such investigations as they deem necessary to
arrive at an independent evaluation of an investment in the securities of the companies referred to in this document (including the merits and risks involved),
and should consult their own advisors to determine the merits and risks of such an investment.
Angel Securities Limited, its affiliates, directors, its proprietary trading and investment businesses may, from time to time, make investment decisions that are
inconsistent with or contradictory to the recommendations expressed herein. The views contained in this document are those of the analyst, and the company
may or may not subscribe to all the views expressed within.
Reports based on technical and derivative analysis center on studying charts of a stock's price movement, outstanding positions and trading volume, as
opposed to focusing on a company's fundamentals and, as such, may not match with a report on a company's fundamentals.
The information in this document has been printed on the basis of publicly available information, internal data and other reliable sources believed to be true,
and are for general guidance only. Angel Securities Limited has not independently verified all the information contained within this document. Accordingly,
we cannot testify, nor make any representation or warranty, express or implied, to the accuracy, contents or data contained within this document. While Angel
Securities Limited endeavours to update on a reasonable basis the information discussed in this material, there may be regulatory, compliance, or other
reasons that prevent us from doing so.
This document is being supplied to you solely for your information, and its contents, information or data may not be reproduced, redistributed or passed on,
directly or indirectly.
Angel Securities Limited and its affiliates may seek to provide or have engaged in providing corporate finance, investment banking or other advisory services
in a merger or specific transaction to the companies referred to in this report, as on the date of this report or in the past.
Neither Angel Securities Limited nor its directors, employees and affiliates shall be liable for any loss or damage that may arise from or in connection with the
use of this information.
Note: Please refer to the important `Stock Holding Disclosure' report on the Angel website (Research Section).
Disclosure of Interest Statement Dena Bank
1. Analyst ownership of the stock No
2. Angel and its Group companies ownership of the stock No
3. Angel and its Group companies’ Directors ownership of the stock No
4. Broking relationship with company covered No
Note: We have not considered any Exposure below Rs 1 lakh for Angel and its Group companies.
Angel Broking Ltd: BSE Sebi Regn No : INB 010996539 / CDSL Regn No: IN - DP - CDSL - 234 - 2004 / PMS Regn Code: PM/INP000001546 Angel Securities Ltd:BSE: INB010994639/INF010994639 NSE: INB230994635/INF230994635 Membership numbers: BSE 028/NSE:09946
Angel Capital & Debt Market Ltd: INB 231279838 / NSE FNO: INF 231279838 / NSE Member code -12798 Angel Commodities Broking (P) Ltd: MCX Member ID: 12685 / FMC Regn No: MCX / TCM / CORP / 0037 NCDEX : Member ID 00220 / FMC Regn No: NCDEX / TCM / CORP / 0302
Address: Acme Plaza, ‘A’ Wing, 3rd Floor, M.V. Road, Opp. Sangam Cinema, Andheri (E), Mumbai - 400 059. Tel : (022) 3952 4568 / 4040 3800


![Result Press Release [Company Update]](https://img.pdfslide.us/doc/110x75/577ca5811a28abea748b9063/result-press-release-company-update.jpg)
![Financial Result Updates [Company Update]](https://img.pdfslide.us/doc/110x75/577c78191a28abe0548eb963/financial-result-updates-company-update.jpg)


![Result Update - Q4 & FY 16 [Company Update]](https://img.pdfslide.us/doc/110x75/577c7c7b1a28abe0549ac3b8/result-update-q4-fy-16-company-update.jpg)

![Q2 Result Presentation [Company Update]](https://img.pdfslide.us/doc/110x75/577ca7871a28abea748c70f6/q2-result-presentation-company-update.jpg)