Embed Size (px)
Citation preview

Demographic Data Use and Demographic Data Needs at the Texas Department of Transportation and Related Agencies
by
Michael Cline, Steve Murdock, John McCray, Jolanda Prozzi, and Robert Harrison
Research Report 0-5392-1
IMPACTS OF FUTURE DEMOGRAPHIC TRENDS ON TRANSPORTATION PLANNING IN TEXAS
Conducted for the Texas Department of Transportation
In cooperation with the U.S. Department of Transportation Federal Highway Administration
By the
INSTITUTE FOR DEMOGRAPHIC AND SOCIOECONOMIC RESEARCH
THE UNIVERSITY OF TEXAS AT SAN ANTONIO AND
THE CENTER FOR TRANSPORTATION RESEARCH THE UNIVERSITY OF TEXAS AT AUSTIN
August 2006


Project No. 0-5392 i
Form DOT F 1700.7 (8-72)
1. Report No. FHWA/TX-06/ 0-5392-1
2. Government Accession No.
3. Recipient's Catalog No.
5. Report Date 08/2006
4. Title and Subtitle
Demographic Data Use and Demographic Data Needs at the Texas Department of Transportation and Related Agencies
6. Performing Organization Code:
7. Author(s): Cline, Michael E., Steve Murdock, Jolanda Prozzi, John McCray, and Robert Harrison
8. Performing Organization Report No. 0-5392-1
10. Work Unit No. 9. Performing Organization Name and Address The Institute for Demographic & Socioeconomic Research The University of Texas at San Antonio, 1 UTSA Circle San Antonio, TX 78249-0704
11. Contract or Grant No.
0-5392
13. Type of Report and Period Covered
Technical Report – 09/2005-08/2006
12. Sponsoring Agency Name and Address
Texas Department of Transportation Research and Technology Implementation Office PO Box 5080 Austin, TX 78763-5080
14. Sponsoring Agency Code
15. Supplementary Notes Project performed in cooperation with the Texas Department of Transportation and the Federal Highway Administration. This report is part of an expanded study: Impacts of Future Demographic Trends on Transportation Planning in Texas
16. Abstract: As Texas population continues to grow and as the complexities of that growth change the fundamental demographic structure of the state, transportation planners will need a better understanding of demographic data. This report provides an overview of demographic data available for transportation planning, as well as a summary of current uses of demographic data within TxDOT and related transportation agencies in Texas. Findings from the report will help guide the development of a one-stop demographic data tool.
17. Key Words
demographic data, statistics, transportation planning, population
18. Distribution Statement No restrictions. This document is available to the public through the National Technical Information Service, Springfield, Virginia 22161, www.ntis.gov
19. Security Classif. (of this report) unclassified
20. Security Classif. (of this page) unclassified
21. No. of Pages 62
22. Price

Project No. 0-5392 ii

Project No. 0-5392 iii
Demographic Data Use and Demographic Data Needs at the Texas Department of Transportation and Related Agencies
by
Michael Cline, Steve Murdock, John McCray, Jolanda Prozzi, and Robert Harrison
Research Report 0-5392-1
IMPACTS OF FUTURE DEMOGRAPHIC TRENDS ON TRANSPORTATION PLANNING IN TEXAS
Conducted for the Texas Department of Transportation
In cooperation with the U.S. Department of Transportation Federal Highway Administration
By the
INSTITUTE FOR DEMOGRAPHIC AND SOCIOECONOMIC RESEARCH
THE UNIVERSITY OF TEXAS AT SAN ANTONIO AND
THE CENTER FOR TRANSPORTATION RESEARCH THE UNIVERSITY OF TEXAS AT AUSTIN
August 2006

Project No. 0-5392 iv
Institute for Demographic and Socioeconomic Research The University of Texas at San Antonio One UTSA Circle San Antonio, TX 78249-0704 http://idser.utsa.edu Copyright (c) 2006 Institute for Demographic and Socioeconomic Research The University of Texas at San Antonio All rights reserved Printed in the United States of America

Project No. 0-5392 v
Disclaimers
Authors’ Disclaimer: The contents of this report reflect the view of the authors, who are responsible for the facts and the accuracy of the data presented herein. The contents do not necessarily reflect the official view or policies of the Federal Highway Administration (FHWA) or the Texas Department of Transportation (TxDOT). This report does not constitute a standard, specification, or regulation.
Patent Disclaimer: There was no invention or discovery conceived or first actually reduced to practice in the course of or under this contract, including any art, method, process, machine manufacture, design or composition of matter, or any new useful improvement thereof, or any variety of plant, which is or may be patentable under the patent laws of the United States of America or any foreign country.
Notice: The United States Government and the State of Texas do not endorse products or manufacturers. Trade or manufacturers’ names appear herein solely because they are considered essential to the object of this report.

Project No. 0-5392 vi
Acknowledgments The authors recognize the assistance of the following individuals who served on the project monitoring committee for FY 2006, including:
The Texas Department of Transportation Project Coordinator: Charles H. Berry, Jr. P.E., District Engineer, El Paso District Project Director: Gregory O. Lancaster, Transportation Programming and Planning Division Project Advisors: Gilbert Sanchez (San Antonio District) and Sarah Stroman (Environmental Affairs Division)
The research team includes: Institute for Demographic and Socioeconomic Research, The University of Texas at San Antonio Dr. Steve Murdock, Research Supervisor Mr. Michael Cline Dr. John McCray (UTSA College of Business) Center for Transportation Research, The University of Texas at Austin, Mr. Rob Harrison Ms. Jolanda Prozzi

Project No. 0-5392
vii
Table of Contents
Chapter 1 : Introduction and Study Purpose ....................................................................... 1 1.1 What Is Demographic Data?..................................................................................... 2 1.2 Why Is Demography Important to TxDOT?............................................................. 2
Chapter 2 : Review of Similar Transportation Agency Projects......................................... 7 2.1 California Department of Transportation.................................................................. 7 2.2 Florida Department of Transportation ...................................................................... 9 2.3 Virginia Department of Transportation .................................................................. 10 2.4 Missouri Department of Transportation.................................................................. 11 2.5 Colorado Department of Transportation................................................................. 12 2.6 Washington Department of Transportation ............................................................ 13
Chapter 3 : Summary of Interviews of Select Transportation Personnel.......................... 15 3.1 Demographic Data Uses at TxDOT........................................................................ 15 3.2 Data Sources ........................................................................................................... 17 3.3 Demographic Variables Used ................................................................................. 17 3.4 Models that Require Demographic Data................................................................. 18 3.5 Typical Users .......................................................................................................... 18 3.6 Typical Departments............................................................................................... 18 3.7 Strengths and Weaknesses of Current Demographic Information.......................... 19 3.8 Data Tool ................................................................................................................ 20
Chapter 4 : Survey Results................................................................................................ 23 4.1 Demographics of Survey Respondents ................................................................... 24 4.2 Demographic Data Use and Needs ......................................................................... 27 4.3 Training Needs Related to Demographic Data Use................................................ 28 4.4 Demographic Variables Accessed .......................................................................... 28 4.5 Demographic Data Sources Accessed .................................................................... 30 4.6 Demographic Data Tool Preferences ...................................................................... 33 4.7 Perceived Demographic Trends Impacting Transportation in Texas ..................... 35
Chapter 5 : Conclusions .................................................................................................... 39 Appendix: Catalogue of Demographic Data Sources Used in Transportation Planning .. 41 Bibliography ..................................................................................................................... 47


Project No. 0-5392
ix
List of Figures Figure 2-1: Screenshot of California Demographic Map ................................................................ 7 Figure 2-2: Screenshot of Journey-to-Work: Florida Edition ...................................................... 10 Figure 2-3: Screenshot of Missouri SEIR ..................................................................................... 12 Figure 2-4: Screenshot of Washington EJ Analysis Tools ............................................................ 13 Figure 4-1: Significant or Very Significant Trends....................................................................... 36 Figure 4-2: TxDOT’s Consideration of Demographic Factors ..................................................... 37


Project No. 0-5392
xi
List of Tables Table 1-1: 2004 Population Estimates by TxDOT District ............................................................. 4 Table 4-1: Survey Responses by Organization.............................................................................. 24 Table 4-2: Respondents’ Post-Secondary Education..................................................................... 25 Table 4-3: Respondents’ Years of Experience for Selected Demographic Analysis Techniques . 26 Table 4-4: Respondents’ Education and Training for Selected Demographic Analysis Techniques....................................................................................................................................................... 26 Table 4-5: Respondents’ Use of Demographic Data ..................................................................... 27 Table 4-6: Data Needs ................................................................................................................... 28 Table 4-7: Training Needs............................................................................................................. 28 Table 4-8: Demographic Data Variables Used.............................................................................. 29 Table 4-9: Geographic Level of Most Uses (Combined Responses) ............................................ 30 Table 4-10: Frequency of Use for Demographic Data Sources..................................................... 31 Table 4-11: Preferred Method of Access....................................................................................... 33 Table 4-12: Geographic Information System Software Used........................................................ 33 Table 4-13: Importance of Selected Features ................................................................................ 34 Table 4-14: Perceptions of Demographic Trends Impacting Transportation ................................ 35 Table 4-15: Response to Statement: “TxDOT Adequately Considers Demographic Factors” ..... 37 Table 4-16: Importance of Demographic Data for Respondents’ Job........................................... 37

Project No. 0-5392
xii

Project No. 0-5392
1
Chapter 1 : Introduction and Study Purpose
The Texas Department of Transportation (TxDOT) utilizes population data extensively,
primarily in referencing data on population size, employment, and income in various analyses;
however, data on population characteristics could be usefully expanded to more effectively guide
district and state-level policy development. This project is intended to improve TxDOT planning by
examining the broad impacts of demographics on Texas’ transportation system, reviewing the
development of demographic data sources for transportation analysis, developing county and TxDOT
district-level demographic data sets in easy to use forms, examining future demographic data and data
analysis needs, and assessing the broad implications of changing demographics for the policy context
likely to impact TxDOT in the coming years.
This report provides a summary of the findings from the first two of six research tasks for this
research project: the identification of existing demographic databases for Texas and the current uses
of such data in transportation planning in Texas. These findings are a result of a review of
demographic data sources useful for transportation planning; interviews with a cross section of
TxDOT and Metropolitan Planning Organization (MPO) staff; and a survey of appropriate district,
divisional, and state-level TxDOT and related transportation agency staff.
In order to complete these research tasks, the research team identified demographic data
resources used in transportation planning. These resources were examined and cataloged with
information showing the demographic database’s reference date, frequency of production, level of
geographical detail, the form of media (e.g., CD, DVD, cartridge) in which the data are available, and
how it is used for transportation planning (see the appendix). The research team then interviewed a
small sample of TxDOT district, divisional, and state-level staff, as well as staff from selected MPOs,
to ascertain if each database is used, in which processes it is used, and what the limitations are in its
use. Staff within the Dallas, Houston, Austin, San Antonio, El Paso, Lubbock, Pharr, and Tyler
TxDOT districts were selected so that a cross section of transportation personnel from all areas of the
state were represented. At these sites, professionals were asked to provide candid assessments of how
data are accessed and how such data could be made more useful for them. In addition to the general
information uncovered by these interviews, the discussions informed the development of a statewide
survey of district personnel.

Project No. 0-5392
2
The research team then surveyed all appropriate district, division, state-level, and MPO
personnel who were identified as demographic data users. A survey questionnaire was designed and
pre-tested with a small group of personnel at each level, revised, and sent to all appropriate personnel.
The questionnaire asked the respondents to identify the demographic databases that they use and the
specific forms of their use. They were asked to identify the specific planning or other function in
which they use the data. They were then requested to describe the limitations they perceive in the data
relative to their uses of the data, the scope and form of data they would like to receive, and their
priority for the development of new databases. The questionnaire also included a small number of
items about the respondent to assist in the evaluation of their response. This included such
information as the function in which the respondent has used such data, how long they have used such
data, their training in the use of demographic data, and other relevant information. The outcomes of
the analysis of the survey results are being used to design the preliminary data product to be
developed for district and other uses.
1.1 What Is Demographic Data? When talking about the development of and needs for transportation infrastructure, total
population and total population change (often growth) are typically emphasized. However, in order to
fully prepare for the future transportation needs of Texans, it is important to understand how the
population is changing, where it will be distributed geographically, and how changes in the
population’s composition will influence those needs. Thus, in this research, demographic data are any
data that provide an understanding of population size, distribution, and composition (Murdock and
Ellis 1991). In this research those data sources and demographic data variables that have specific
application to transportation (such as vehicles per household and commuting patterns) or those that
are typically used for understanding relationships between demographic trends and transportation
(such as total population, race/ethnicity, and median household income) are highlighted.
1.2 Why Is Demography Important to TxDOT? Texas’ population is growing and changing rapidly and such changes will have substantial
impacts on the Texas Department of Transportation (TxDOT). Texas’ rate of population growth has
exceeded that for the nation in every decade since Texas became a state and its recent population
increases have been particularly large. In the 1990s, Texas was the second fastest growing state in
numerical terms (behind California) and the eighth fastest growing in percentage terms (U.S. Census
1990 and 2000). In the post-2000 period from April 1, 2000, (the 2000 Census date) to July 1, 2005, it
was again the second fastest growing state in numerical terms and was the seventh fastest growing in
percentage terms. The size of Texas’ population has more than doubled in the past 25 years,

Project No. 0-5392
3
increasing from roughly 11.2 million in 1970 to nearly 22.9 million in 2005. In the 1990s its
percentage increase of 22.8 resulted in a population increase of nearly 3.9 million people. This 3.9
million increase was roughly equivalent to having added the number of people who in 1990 lived in
the cities of Houston, Dallas, San Antonio, and Corpus Christi combined. This 3.9 million was greater
than the total population of 24 of the 50 states and meant that for every nine persons added to the
population of the United States in the 1990s more than one was added in Texas. In the post-2000
period population growth has continued with an increase in Texas’ population of more than 2.0
million from April 1, 2000, to July 1, 2005 (U.S. Census 2006). This level of growth, if continued,
will mean that Texas’ population increase from 2000 to 2010 will likely be between 3.6 and 4.0
million people.
However, neither the amount nor the rate of population change has been uniform across
Texas. Some counties have grown significantly while others have lost population. Growth was
particularly pronounced along the Texas-Mexico border and in the urban complexes of Houston,
Dallas-Fort Worth, and the San Antonio to Austin Corridor. In the Dallas-Fort Worth area the
population increased by nearly 1.2 million in the 1990s (greater population growth than occurred in
45 of the 50 states). At the same time, population growth was roughly 957,000 in the Houston-
Galveston area (greater than 40 of the 50 states) while the population in the Austin-San Antonio
corridor grew by an additional 748,000 people (31 percent). Also in the 1990s, 68 of Texas’ 254
counties, all of which were non-metropolitan (i.e., rural), lost population. In the post-2000 period
from 2000 to 2004 growth has been even more concentrated in the state’s large suburban and central
city complexes with the number of counties losing population increasing to 92, nearly all of these
being non-metropolitan counties (Texas State Data Center 2005).
These patterns of population change are also seen in population changes at the TxDOT
District level. Six districts, located in the aforementioned areas, grew at faster rates than the state as a
whole (22.8%) during the 1990s. The TxDOT District with the largest growth in percentage terms
during the 1990s was the Austin District (46.7%), followed by the Pharr District (at 38.5%). Other
TxDOT Districts that had rates of growth larger than the State of Texas, included Dallas (31.7%),
Laredo (30.6%), Fort Worth (25.0%), and Houston (25.0%). These same districts continue to show
rapid growth in the post-2000 period, while others have shown limited growth or actual loss (Table 1-
1).

Project No. 0-5392
4
Table 1-1: 2004 Population Estimates by TxDOT District
2000 Census July 1, 2004 Numerical Percent TxDOT District Count Pop. Est. Change Change Abilene 252,753 252,505 -248 -0.10 Amarillo 350,605 358,999 8,394 2.39 Atlanta 303,557 310,036 6,479 2.13 Austin 1,349,581 1,516,544 166,963 12.37 Beaumont 552,822 562,829 10,007 1.81 Brownwood 126,210 129,088 2,878 2.28 Bryan 370,948 388,149 17,201 4.64 Childress 42,625 41,265 -1,360 -3.19 Corpus Christi 549,025 557,167 8,142 1.48 Dallas 3,414,427 3,767,815 353,388 10.35 El Paso 704,318 740,795 36,477 5.18 Ft. Worth 1,827,017 2,013,285 186,268 10.20 Houston 4,573,386 5,016,243 442,857 9.68 Laredo 329,483 363,787 34,304 10.41 Lubbock 429,458 432,202 2,744 0.64 Lufkin 284,315 294,866 10,551 3.71 Odessa 311,458 315,523 4,065 1.31 Paris 337,130 353,855 16,725 4.96 Pharr 1,004,222 1,138,079 133,857 13.33 San Angelo 154,379 153,249 -1,130 -0.73 San Antonio 1,798,385 1,940,075 141,690 7.88 Tyler 593,394 621,840 28,446 4.79 Waco 624,850 647,278 22,428 3.59 Wichita Falls 245,566 244,468 -1,098 -0.45 Yoakum 321,906 330,080 8,174 2.54 State of Texas 20,851,820 22,490,022 1,638,202 7.90 Source: Estimates of the Total Populations of Counties and Places in Texas for July 1, 2004, and January 1, 2005, Texas State Data Center, Oct. 2005.
The characteristics of Texas’ population are also changing rapidly, particularly those related
to its racial/ethnic and age composition. Although Texas’ population in 1980 was roughly two-thirds
Anglo, by 2000 it was 53 percent Anglo and the Census Bureau’s estimates program indicated that by
2004 Texas was a state with no majority racial/ethnic group. Texas’ population is now approximately
49 percent Anglo, 11 percent African American, 34 percent Hispanic, and 6 percent are members of
other racial/ethnic groups (primarily Asian). Similarly, although a relatively young state overall (with
the third youngest median age at 32.3), Texas, like the rest of the nation, has more than 25 percent of
its population in the “baby-boom” ages (i.e., 41-59 years of age in 2005) and, as a result, will show
increasing numbers of elderly persons in the coming decades. In fact, these two characteristics are
interrelated: non-Anglo status and youth status and Anglo and older age status. Thus, as of 2000, 57
percent of the population under 18 years of age was non-Anglo while 57 percent of the population 18

Project No. 0-5392
5
years of age or older was Anglo.
Changes in the characteristics of the state’s population alter social and cultural patterns but
may have particularly pronounced effects on all services and planning processes including
transportation and transportation planning because of differentials in economic resources. Owing to a
variety of historical, discriminatory, and other factors, African-American and Hispanic populations in
Texas had median household income levels in 1999 that were less than two-thirds of those for
Anglos, whereas poverty levels for African-Americans and Hispanics were nearly three times as high
as those for Anglos. Educational gaps also remain substantial with the percent of adults (25 years of
age or older) with a college degree in 2000 being roughly 30 percent for Anglos, 15 percent for
African-Americans, and 8.9 percent for Hispanics. Similarly, income levels vary with age such that
median household income levels tend to be higher for middle-aged than for younger or older
households.
Projections by the Texas State Data Center (2004) and Murdock et al. (2003) suggest that
Texas’ population will (a) continue to grow rapidly with continued concentration in urban areas, (b)
will become increasingly diverse and older, and (c) that such changes could have dramatic impacts on
the state’s socioeconomic resources. According to the Texas State Data Center’s two projection
scenarios that most closely reflect recent patterns of population change (those assuming the 2000-
2002 and 1990-2000 rates of net migration, respectively), Texas’ population would be between 45
and 52 million people in 2040 (40- year growth rates of 118 to 148 percent) and would be between 24
and 26 percent Anglo, about 8 percent African-American, between 58 and 59 percent Hispanic, and
between 8 and 9 percent other racial/ethnic groups, primarily Asian. Texas’ non-metropolitan
population would decrease to roughly 9 percent of the total population (compared to 15 percent in
2000), while the Dallas-Fort Worth region could exceed 17 million and the Houston-Galveston region
could exceed 13 million. Texas’ elderly population would grow from 9.9 percent of the population in
2000 to between 16 and 20 percent by 2030 – a change that could require a greater emphasis on
public transportation within the Texas transportation system. Even more startling, Murdock et al.
(2003) suggest that in the absence of change in the socioeconomic differentials among racial/ethnic
and age groups, these population changes could also substantially alter the socioeconomic
characteristics of Texas’ population such that the work force could be less well educated in 2040 than
in 2000, its median household income could be $6,500 poorer in 2000 constant dollars than in 2000,
and the percentage of family households in poverty could increase by roughly four percent compared
to that in 2000.
Clearly, such changes portend substantial impacts on TxDOT. The rapid growth in the state
has strained the existing transportation network and resulted in the need for extensive expansions to

Project No. 0-5392
6
the system in virtually every major city in Texas. In slower growing rural areas the need for roadway
maintenance is high at a time when the sources of revenue related to population are either declining or
relatively stagnant. Funding for either expansion or maintenance projects has often been insufficient
and a variety of new forms of funding (e.g., toll roads) are being planned but seldom has the long-
term funding required for such projects been evaluated relative to the future socioeconomic
characteristics of the population. Similarly, system preferences have often not been sufficiently
evaluated relative to key population segments (e.g., by race/ethnicity, age, economic status) so that it
is not clear whether what is preferred and supported now will be in the future. It is apparent that an
expansion in the use of demographic data will be beneficial and essential to TxDOT planning in the
coming years.
In the next chapter, a brief review of similar research undertaken for other state transportation
agencies is provided. Then in the following chapter, the findings from the initial interviews are
outlined, followed by a summary of the results of the survey of demographic data users at TxDOT
and related agencies. In the appendix, a listing of selected demographic data resources used within
transportation planning is provided.

Project No. 0-5392
7
Chapter 2 : Review of Similar Transportation Agency Projects
The following pages provide six examples of how other state departments of transportation
evaluated the impacts of demographic trends on statewide transportation demand or developed tools
and resources to assist local and regional transportation planners and project engineers with
demographic analyses. The first three listings are examples of overall analyses of demographic trends
and impacts on transportation; the latter three listings are of projects developed primarily as data
analysis tools to be used by state, regional, and local planners. The California and Florida examples
include data analysis tools in addition to the overall assessment of demographic trends.
2.1 California Department of Transportation California Travel Trends and Demographics Study http://www.uctc.net/trends/ http://www.uctc.net/trends/papers/final/uctcdemorev501.pdf http://www.dot.ca.gov/hq/tpp/TDS_final_report_121902.pdf
This website provides a link to special reports on demographic trends, as well as a link to a
series of maps of demographic variables at the tract level for 1990 and 2000 for regions in California
and for the entire state. In addition, there are links to environmental documentation guidebooks. A
screenshot of one of the maps produced by this project can be seen in Figure 2-1.
Figure 2-1: Screenshot of California Demographic Map
Project No. 0-5392
8
This project was created to analyze the impacts of demographic trends to 2025 on
transportation in California as part of the development of a long-term, multi-modal transportation
plan for the California Department of Transportation (Caltrans). The study was developed by the
University of California Transportation Center at UC Berkeley, the Institute of Transportation Studies
at the School of Public Policy and Social Research at the University of California, Los Angeles
(UCLA), and Solimar Research Group. The project was developed in three phases by the two
institutes and the private firm. In the first phase, a series of working papers were written to review
broad demographic, logistical, and technological trends and their possible impacts on transportation
demand in California. In the second phase, demographic projections were developed for geographies
down to the census tract level. In the final phase, the projections in phase two were used to estimate
the impacts of socioeconomic changes on travel demand in future years. In addition to their statewide
study, the researchers at UCLA created an analysis tool that could be used by transportation planners
within the state to create their own scenarios and impact assessments for specific projects.
UC Berkeley provided an analysis of general demographic, environmental, and technological
trends that might impact transportation in the state. These are presented in a series of working papers
and as a series of static maps on the UC Transportation Center website. The authors reviewed trends
in regards to total population growth; components of population change; changes in the population
composition; changes in employment patterns; shifts in housing location, type, and affordability;
changing patterns of freight transportation; changing patterns of personal and household travel; the
impact of new technologies; and environmental and equity issues.
UCLA and Solimar Research Group projected population by census tract for 2015 to 2025.
From those projections, UCLA developed travel demand trends to 2015 and 2025. They then
provided an overall analysis of transportation demand trends by area based upon socioeconomic
variables. A series of maps concerning travel demand by mode was created and provided in the
appendices of the final report. Geographic Information System (GIS) files were also given to the
Caltrans for use in transportation planning.

Project No. 0-5392
9
2.2 Florida Department of Transportation Shaping Florida’s Future: Trends and Conditions http://www.dot.state.fl.us/planning/policy/trends Journey-to-Work: Florida Edition http://www.j2w.usf.edu/default.asp
The Office of Policy Planning of the Florida Department of Transportation (FDOT), the
Center for Urban Transportation Research at the University of South Florida and the Bureau of
Economic and Business Research at the University of Florida have developed a series of reports
outlining demographic trends impacting travel behavior and transportation as they relate to the
Florida 2020 Transportation Plan. FDOT houses these reports or links to these reports from their
website (http://www.dot.state.fl.us/planning/policy/trends). These reports include, among others,
“Population Growth and Characteristics,” “Travel Demand and Travel Behavior Trend,” and “Policy
Considerations.” “Population Growth and Characteristics” provides an overview of state-wide and
county level changes including: total population growth, components of growth (natural increase,
domestic and international migration), growth rates, population densities, distribution of population
by age and race, labor force change, education, income, and housing tenure. This report provides a
general overview of demographic changes with limited discussion about how those changes might
impact transportation uses and demand. Transportation demand was specifically mentioned in
reference to race and ethnicity (mobility and transit demand); labor force size changes (work-related
travel); housing (differences in trips, travel demand, and transit use between renters and home
owners); income (higher demand among higher income households); and housing unit type (travel
demand according to housing densities). Data sources include the Census Transportation Planning
Package (CTPP), the 1990 and 2000 Decennial Census, 2001 National Household Travel Survey,
U.S. Census Population Estimates Program, and population estimates and projections from the
University of Florida Bureau of Economic and Business Research.
In addition to the reports cited above, the Center for Urban Transportation Research and
FDOT created a Journey-to-Work web application that provides a series of tables, charts, and maps of
origins and destinations of commuters within Florida by county and place. The information is derived
from the 2000 CTPP. The web-based product provides easier and quicker access to journey-to-work
information than that provided by the CD-based extraction tool packaged with the CTPP data (see
Figure 2-2).

Project No. 0-5392
10
Figure 2-2: Screenshot of Journey-to-Work: Florida Edition
2.3 Virginia Department of Transportation Expected Changes in Virginia Transportation Demand by 2025 http://www.virginiadot.org/projects/resources/VTransTrendsMarch31F.pdf
This document was developed by the Virginia Transportation Research Center as part of the
Virginia Department of Transportation’s long-range multi-modal transportation plan. The report
analyzed historical and projected changes of socioeconomic indicators; trends in travel behavior,
automobile ownership, and mode choices; public policy and technological impacts to transportation;
and projections of freight demand. The researchers used various data sources, including the Census
Bureau, the Bureau of Transportation Research, and the Virginia Employment Commission, among
many others to develop a picture of how trends will impact transportation in the future.

Project No. 0-5392
11
2.4 Missouri Department of Transportation Socio-Economic Indicator Resource (SEIR) http://oseda.missouri.edu/modot/
The Missouri Department of Transportation (MoDOT) worked with the University of
Missouri Extension Office of Social and Economic Data Analysis (OSEDA) to develop a web tool to
aid transportation planners and project administrators. The web tool provides ready access to data,
maps, tables, charts, and graphics to help assess the potential impacts to environmental justice (EJ)
communities.
The web tool provides data for geographies down to the block group level. Maps, graphs and
tables can be created from a data query tool. The data on the Socio-Economic Indicator Resource
(SEIR) site comes from Census Summary Files 1 and 3 for 1990 and 2000 and the 2000 Census
Transportation Planning Package (CTPP).
A SAS database houses the social and economic indicator data and is enabled through a
Geographic Information System (GIS). Pre-generated reports for MPOs, Planning Districts, Selected
Corridors, and Regional Planning Commissions are available online. In addition, query driven reports
can be created for user-specified geographies.
The project was awarded the American Association of State Highway and Transportation
Officials (ASHTO) Trailblazer Award in 2003. OSEDA developed another application for the state
education office based on lessons learned with the SEIR project. Figure 2-3 shows a screen shot of
the home page of SEIR. Reports can be generated by MoDOT Planning District, MPO, Regional
Planning Commission, county, or place. In addition, data from the CTPP are made available via this
website.

Project No. 0-5392
12
Figure 2-3: Screenshot of Missouri SEIR
2.5 Colorado Department of Transportation Statistics and Data http://www.dot.state.co.us/App_DTD_DataAccess/index.cfm
Although not as dynamic of an application as those of California, Florida, or Missouri, this
website is an access point to statistics, maps, and GIS data files frequently used by transportation
planners in Colorado. The link includes access to a series of demographic statistical tables by county.
These files are provided in HTML and MS Excel formats. Data are derived from 1990 and 2000 U.S.
Census, IRS Migration Data files, and the Colorado Department of Local Affairs. Example tables by
county include: household totals, household size, housing unit totals, housing unit occupancy,
vehicles per household, group quarters population, population by age group, median age, disability
status, employment status, employment by occupation, family income, median household income, per
capita income, journey to work files, migration, poverty, race and ethnicity, and total population. A
limited number of these files are also provided for municipalities.

Project No. 0-5392
13
2.6 Washington Department of Transportation Environmental Justice Analysis Tools http://www.wsdot.wa.gov/environment/envJustice/Analysis.htm
This website is primarily a “one-stop” website developed for transportation planners and
project engineers who are working on environmental impact and environmental justice issues. The
website provides links to sites that provide information and data related to EJ analysis. These include
links to an environmental procedures manual; data extraction tools; links to the Census and American
FactFinder; links to poverty threshold guidelines; language resources; and links to state economic
statistics. In addition, there are links to Federal Highway Administration (FHWA) and Transportation
Research Board (TRB) developed guidebooks on public involvement; American with Disabilities Act
(ADA) related resources; tribal impact resources; and links to information on cultural impacts. The
data extraction tools linked from this website includes a GIS Workbench and Census Data Engine to
extract and map census and environmental data for EJ analysis.
Figure 2-4: Screenshot of Washington EJ Analysis Tools

Project No. 0-5392
14

Project No. 0-5392
15
Chapter 3 : Summary of Interviews of Select Transportation Personnel
In order to understand how demographic information is utilized within the Texas Department
of Transportation (TxDOT), the research team interviewed a cross section of transportation planners.
With the assistance of the Project Director, the research team selected and interviewed individuals
from a range of rural oriented to large urban oriented TxDOT Districts and a cross section of users
within the headquarters divisions. Personnel in the following divisions were interviewed:
Environmental, Transportation Planning and Programming (TP&P), Texas Turnpike Authority, and
Government and Business Enterprise. In addition, personnel from the following districts were
interviewed: El Paso, Pharr, Lubbock, Tyler, Dallas, Austin, Houston, and San Antonio. Since
TxDOT personnel work closely with Metropolitan Planning Organizations (MPOs), MPO personnel
in Dallas, Lubbock, and San Antonio were also interviewed. In one case, a current TxDOT planner
provided his insight as a former planner for the El Paso MPO.
The research team asked these individuals how their offices used demographic information.
They were asked to review demographic variables needed for their specific uses and to provide an
overview of the sources utilized to obtain those data. In addition, the selected personnel were asked
for their opinions about any limitations or problems with the availability of demographic information
or the data sources used within TxDOT.
The following discussion provides an overview of the findings from these interviews. The
responses have been categorized based upon the major areas discussed.
3.1 Demographic Data Uses at TxDOT The interviewees were first asked how they and their departments utilize demographic
information. Personnel indicated that the greatest use of demographic information occurs within the
planning and project development areas of TxDOT districts. Project development utilizes
demographic information for environmental related analyses and documentation. Demographic
information may also be utilized in evaluating alternative roadway alignments. Planning, along with
local MPOs, uses demographic information to develop long-range plans and travel demand models.
At TxDOT Headquarters, the Environmental and TP&P Divisions are the most frequent users of
demographic data for the same reasons as those highlighted for district users.
Finally, demographic information is often a part of feasibility studies or other projects where
consultants develop the analyses. Interviewees indicated that, unfortunately, the source of and
assumptions underlying the consultant-provided demographic information is not always clear.

Project No. 0-5392
16
The interviewees mentioned that they use demographic data within the context of the following
general categories:
NEPA processes and documents such as:
• Categorical Exclusions • Environmental Assessments • Environmental Impact Statements • Environmental Justice (Title VI) • Supplemental Evaluations
Route studies:
• Alignment Issues • Alternative Route Comparisons
Funding:
• Benefit Cost Analysis • Funding Categories • Grant Funding • Unified Work Program • Special Funding for Border Areas • Economically Disadvantaged Counties Program • Rural Transportation Improvement Program • Public Transportation Grant Allocations • Category 5 Funding (Congestion Mitigation and Air Quality Improvement)
Toll Roads:
• Toll Feasibility Analysis • Toll Modeling • Toll Planning and Corridor Planning (Trans Texas Corridor) • Tolling and Bonding Issues (Consultants)
Planning:
• Corridor Analysis • Feasibility Studies • Long Range Planning • Metropolitan Mobility Planning
• Metropolitan Transportation Plan • Route Planning (Transit) • Strategic Plan for the State • Statewide Transportation Plan
Models:
• Air Quality Modeling • Congestion Index Model • Travel Demand Models
Other:
• Design Plans (Consultants) • Policy Analysis • Presentations • Roadway Districts
• Traffic Impact Analysis (Consultants) • Safe Routes to School • RideShare • Congestion Management System

Project No. 0-5392 17
3.2 Data Sources The most frequently cited sources of information were the Census, the Census
Transportation Planning Package (CTPP), Texas State Data Center Population Projections for
Counties, Council of Governments (COG)–developed population projections, and employer data
from the Texas Workforce Commission. The data sources mentioned in the interviews include the
following (in alphabetical order):
• American FactFinder (Census) • Appraisal Districts • Bureau of Economic Analysis • Census • Census Transportation Planning Package (CTPP) • COG or MPO developed population projections • Comptroller’s Office • Consultants • Demographic Books (in-house) • MPO Travel Demand Model • Modern Language Association Map of Languages Spoken at Home (Census derived) • Public Use Microdata Sample (PUMS) • Texas State Data Center at UTSA Population Projections for Counties • Texas State Data Center at UTSA Population Estimates for Counties • Texas Water Development Board Population Projections • Locally Developed Estimates and Projections (COG/MPO/University) • TxDOT SAM Model (Various Sources) • TxDOT Travel Survey • Texas Workforce Commission
3.3 Demographic Variables Used The demographic data variables mentioned during the interviews include these (in
alphabetical order):
• Age • Auto ownership • Commuting • Economic data • Educational attainment • Employer data (from TWC) • Employment • Family income • Gender • Gross state product • Households • Households or employers • Household income • Household size • Income
• Income brackets • Language spoken at home • Median income • Mode split at the county level • Number of children • Number of disabled • Number of elders • Personal income • Personal transportation costs • Population • Population density • Property values • Race/ethnicity • Registered vehicles • Vehicles per household

Project No. 0-5392 18
• Special population groups such as Indian tribes
• Time to work
• Unemployment
• County level population and socioeconomic data • Households below national income level • Population in economically disadvantaged counties
3.4 Models that Require Demographic Data The models used by local planners for transportation modeling that require demographic
data include the following, according to our interviews:
• Economic Impact (employment) • Metropolis • QUANTM • SAM • TBEST
• TLOG • DRAM/EMPAL • TransCAD • UrbanSim
• REMI (for economic modeling of corridor studies)
3.5 Typical Users The interviewees were asked to identify other individuals or job functions that might use
demographic data. The job titles and functions mentioned include the following:
• Advanced Project Managers • Environmental Coordinators • Environmental Specialists • Environmental Planners • Environmental Staff • Engineers • Financial Program Managers • Grant Managers
• MPO Staff • Public Transportation • Statewide Planners • Traffic Forecasters • Transportation Modelers • Transportation Planners • Urban Modelers
• District Engineers (for inclusion in presentations) • Public Information Staff (in each district)
3.6 Typical Departments In addition, the interviewees were asked what departments within TxDOT they felt would
have a need for demographic information. The departments and divisions mentioned include the
following:
• Aviation (for NEPA) • Environmental Affairs • Government Business Enterprise • MPOs • Planning (District) • Project Development (District)
• Public Transportation • Transportation Programming and Planning • Texas Turnpike Authority • Travel • Vehicle Title and Registration

Project No. 0-5392 19
3.7 Strengths and Weaknesses of Current Demographic Information The interviewees were asked to describe any strengths or weaknesses in the demographic
information made available to them. A summary of comments obtained during the course of the
interviews follows:
• Access to demographic information is good. The biggest issue is adjusting for
geographic boundary mismatch between data sets.
• COG data are not detailed enough for EJ analysis, so we go to the census data at the
tract level (rather than the TAZ).
• Data are not always in the right format. We are concerned about using the American
Community Survey because of questions about its continued funding.
• Data are too general and not forecasted for particular groups (e.g., age, sex,
race/ethnicity).
• There are data sharing issues between agencies (for travel demand modeling and
population projection development). Data can be hard to get. Also, the COG or MPO
cleans the data and tries to give it back to the original data source but the data are not
accepted.
• We need to know where to find the data. The CTPP is not very easy to use. There are
lots of data available on CTPP but we need to know how to use it.
• We don’t always know where to get the information we need.
• We just need to know where to find the information.
• At MPO level, there is considerable turnover and not much in the way of training on
methods for collecting data and developing and evaluating estimates and projections.
• Data collection costs.
• TWC data are not accurate and must be checked because data for a location may
include corporate employment and not site-specific numbers.
• TxDOT can only use certified data. Unfortunately, in many cases certified data are
old or outdated. We would like to have access to more recent or frequently updated
information.
• In an effort to compile the data into a format that is understandable to most people,
we would like to have access to a graphical presentation of demographic data that can
be copied into reports and presentations.

Project No. 0-5392 20
• Demographic information is only required in formulas for the allocation of one or
two of the twelve funding categories. Most of the data needed are highway and
vehicular data.
• Planners are interested in seeing how age structure and gender patterns might impact
travel demand. Also, how racial/ethnic changes impact transportation variables on
demand. For instance, persons per household impact the travel demand models.
Trends have been flattening out and future demand will increase due to changes in
persons per household.
• The U.S. Census information is not disaggregated enough for project level analysis. It
is also not updated frequently enough.
• The U.S. Census data are not easy to work with. I need something that is easier to
work with and an easier way to compile maps.
3.8 Data Tool Data Access Preference
Those interviewed indicated an overwhelming preference for online access. In some
cases, demographic data are used infrequently, so the online access was preferred so that users
could go to one place and not have to remember where to go to get the information. A CD or
DVD was mentioned as the second choice but there was some concern that not all work stations
would have a DVD drive available and that the data would only be useful for a short time,
whereas a website could be updated regularly. Some felt that although enough demographic
information was available for their purposes, having a “one-stop-shop” would be nice. Others
also expressed a need for training on where to go to find information, how to access that
information and how to interpret and use that information.
There are a variety of demographic data users throughout TxDOT and the MPOs, with
needs ranging from specific socioeconomic variables at the census tract or traffic analysis zone
(TAZ) level1, to more general population numbers at the county and district levels. The smaller
scale needs may require specialized data from local sources that vary from MPO to MPO, making
it difficult to create a “one-stop-shop” for data at those detailed geographic levels.
1 Sometimes referred to as the traffic serial zone. A traffic analysis zone, or TAZ, is a special statistical geographic unit delineated by local MPOs in order to tabulate special traffic related census data, particularly items related to commuting. TAZs consist of one or more census block groups or census tracts. Data for TAZs are included in the Census Transportation Planning Package, a special Census tabulation prepared in conjunction with the Federal Highway Administration (U.S. Census 2000b).

Project No. 0-5392 21
Examples of websites
Some of the respondents provided examples of websites that they felt were good
examples of websites providing data. These sites include, in alphabetical order:
• Alamo Community Information System - http://www.aacis.info/ • American FactFinder - http://factfinder.census.gov • Bureau of Business Research - http://www.mccombs.utexas.edu/research/bbr/ • Bureau of Economic Analysis – http://www.bea.gov • Bureau of Labor Statistics – http://www.bls.gov • Bureau of Transportation Statistics – http://www.bts.gov • Claritas – http://www.claritas.com • EPA EnviroMapper - http://www.epa.gov/enviro/html/em/index.html • Federal Highway Center - http://www.tfhrc.gov/ • Glenmary Research Center – http://www.glenmary.org • Kidsdata.org – http://www.kidsdata.org • Perryman Group - http://www.perrymangroup.com/ • Texas Health Department - http://www.dshs.state.tx.us/ • Texas State Data Center – http://txsdc.utsa.edu • Texas Workforce Commission - http://www.twc.state.tx.us/ • Transportation Research Board – http://www.trb.org • U.S. Census – http://www.census.gov • Volpe Research Center - http://www.volpe.dot.gov/.

Project No. 0-5392 22

Project No. 0-5392 23
Chapter 4 : Survey Results
Following the interviews with selected personnel within TxDOT and selected MPOs, a
comprehensive web-based survey of demographic data users was administered in April and May
of 2006. The purpose of this survey was to further understand (a) how demographic data are used
at TxDOT and related agencies, (b) the extent and use of selected data resources, and (c) the
needs and uses of district and region-wide demographic data. Survey participants included
individuals from TxDOT, MPOs, Regional Mobility Authorities (RMAs), and Toll Authorities,
all of whom were identified by name by the interviewees or identified according to their job title.
Questionnaires focused on how demographic data are used, sources of data, and possible
limitations or gaps in accessing demographic information. In addition, respondents were asked
about their needs regarding access to demographic data and how they might like to access that
information. The survey results will be used to (a) report on demographic data uses within
TxDOT; (b) guide the development of a demographic data analysis tool for use by transportation
professionals in Texas; and (c) understand what demographic data users within these agencies see
as the most important demographic trends impacting transportation in Texas. Some of the salient
findings of the survey follow:
• Demographic data are important to a majority of the respondents within the
context of their jobs.
• Demographic data users in non-TxDOT agencies are less sure of TxDOT’s
consideration of demographic factors in planning transportation infrastructure
than TxDOT demographic data users.
• Most respondents see total population growth as the most significant trend
impacting transportation in Texas. Other demographic trends recognized as
significant or very significant included suburban population growth, dispersion of
employment locations within metropolitan areas, and increases in vehicles per
household.
• Additional demographic data are needed at smaller geographies, including
information about specific populations at the TAZ or block group level.
• Almost 30% of respondents see an urgent need for better tools to access
demographic information and wish to access it via the Internet.
The following sections report on the responses to this survey. First an overview of the
survey methods is provided, as well as selected demographic backgrounds of the respondents,
Project No. 0-5392 24
including information about their training and educational background relating to demographic
data analyses techniques. Then an analysis of respondents’ use of and needs for selected
demographic data is provided, followed by an overview of desired items to be included in a
demographic data tool. Finally, summaries of respondents’ perceptions about TxDOT’s use of
demographic data and demographic trends impacting transportation in Texas are provided.
4.1 Demographics of Survey Respondents
The original sampling frame consisting of 286 individuals with e-mail addresses was
developed from the following sources: (a) interviews of selected TxDOT personnel (task 1); (b)
staff listings of specific titles for the TxDOT offices; (c) staff listings at all MPOs, RMAs, and
Toll Authorities; and (d) selected individuals in divisional offices. After removing those who
indicated that they were not users of demographic data and after removing non-deliverable
addresses, a total of 165 remained. An e-mail letter of introduction with a link to the survey on
the Institute for Demographic and Socioeconomic Research (IDSER) website was sent to the
original list. Respondents were requested to complete the survey online. Two additional e-mail
mailings and one phone call were used to follow up with those not responding. Responses were
received from a variety of transportation-related agencies and from throughout Texas. Responses
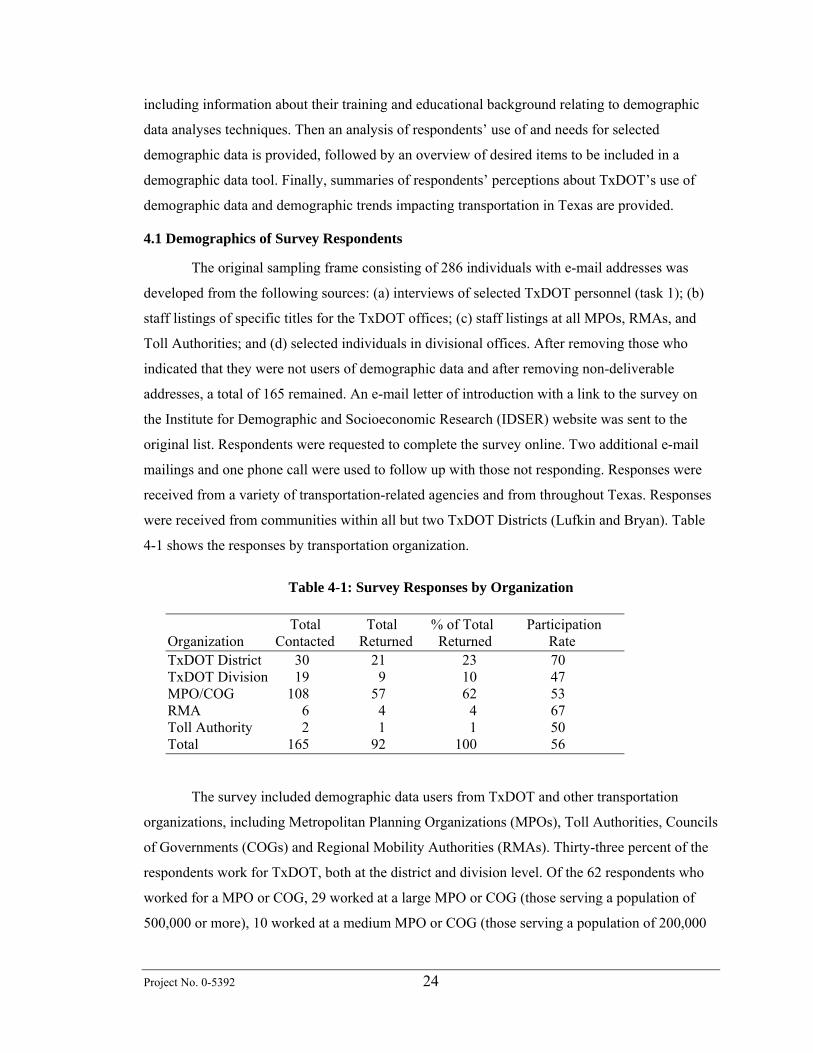
were received from communities within all but two TxDOT Districts (Lufkin and Bryan). Table
4-1 shows the responses by transportation organization.
Table 4-1: Survey Responses by Organization
Total Total % of Total Participation Organization Contacted Returned Returned Rate TxDOT District 30 21 23 70 TxDOT Division 19 9 10 47 MPO/COG 108 57 62 53 RMA 6 4 4 67 Toll Authority 2 1 1 50 Total 165 92 100 56
The survey included demographic data users from TxDOT and other transportation
organizations, including Metropolitan Planning Organizations (MPOs), Toll Authorities, Councils
of Governments (COGs) and Regional Mobility Authorities (RMAs). Thirty-three percent of the
respondents work for TxDOT, both at the district and division level. Of the 62 respondents who
worked for a MPO or COG, 29 worked at a large MPO or COG (those serving a population of
500,000 or more), 10 worked at a medium MPO or COG (those serving a population of 200,000

Project No. 0-5392 25
to 499,999), 10 worked at a small MPO or COG (those serving 50,000 to 199,999), and an
additional 8 worked at a COG exclusively.
Of those responding to the survey, the overwhelming majority (67%) works in
transportation planning. The next most frequently cited job types include those involved in
environmental analyses (10%). Three District Engineers also responded to the survey.
On average, respondents have worked in their respective agencies for 8.2 years.
Respondents working for TxDOT have worked, on average, 16.1 years, compared to all other
respondents, who worked in their positions, on average, 4.5 years. Most of the respondents have
at least a Bachelor’s Degree, with 52% indicating that they have a graduate or professional
degree.
Table 4-2: Respondents’ Post-Secondary Education
Post-Sec. Degree Count Percent
None 2 2.2 Assoc. Degree 5 5.4 Bachelor's 37 40.2 Master's or Prof. 40 43.5 Ph.D. 8 8.7
Respondents have most experience and training in interpreting and analyzing
demographic data and in using travel demand models and least experience in calibrating travel
demand models and developing population estimates and projections. This is not surprising given
that the latter require special training and may not be required for the respondents’ job position
(see Tables 4-3 and 4-4).

26
Table 4-3: Respondents’ Years of Experience for Selected Demographic Analysis Techniques
None LT 1 Year 1-4 Years 5-9 Years 10-14 Years 15+ Years Technique No. % No. % No. % No. % No. % No. %
Developing Population Estimates 42 45.7 14 15.2 16 17.4 8 8.7 4 4.3 8 8.7 Developing Population Projections 44 47.8 10 10.9 18 19.6 8 8.7 4 4.3 8 8.7 Calibrating Travel Demand Models 50 54.3 9 9.8 20 21.7 7 7.6 5 5.4 1 1.1 Using Travel Demand Models 29 31.5 14 15.2 26 28.3 12 13.0 7 7.6 4 4.3 Analyzing Demographic Data 19 20.7 10 10.9 33 35.9 11 12.0 7 7.6 12 13.0 Interpreting Demographic Data 13 14.1 11 12.0 36 39.1 13 14.1 7 7.6 12 13.0 Average 33 35.7 11 12.3 25 27.0 10 10.7 6 6.2 8 8.2
Table 4-4: Respondents’ Education and Training for Selected Demographic Analysis Techniques
1 College 2+ College 1 Work 2+ Work Combo None Course Course Related Course Related Courses College & Work Technique No. % No. % No. % No. % No. % No. %
Developing Population Estimates 59 64.1 7 7.6 6 6.5 2 2.2 2 2.2 16 17.4 Developing Population Projections 58 63.0 7 7.6 6 6.5 3 3.3 2 2.2 16 17.4 Calibrating Travel Demand Models 51 55.4 7 7.6 6 6.5 3 3.3 9 9.8 16 17.4 Using Travel Demand Models 44 47.8 10 10.9 7 7.6 4 4.3 10 10.9 17 18.5 Analyzing Demographic Data 38 41.3 12 13.0 9 9.8 5 5.4 5 5.4 23 25.0 Interpreting Demographic Data 37 40.2 14 15.2 8 8.7 6 6.5 4 4.3 23 25.0 Average 48 52.0 10 10.3 7 7.6 4 4.2 5 5.8 19 20.1
Project No. 0-5392 27
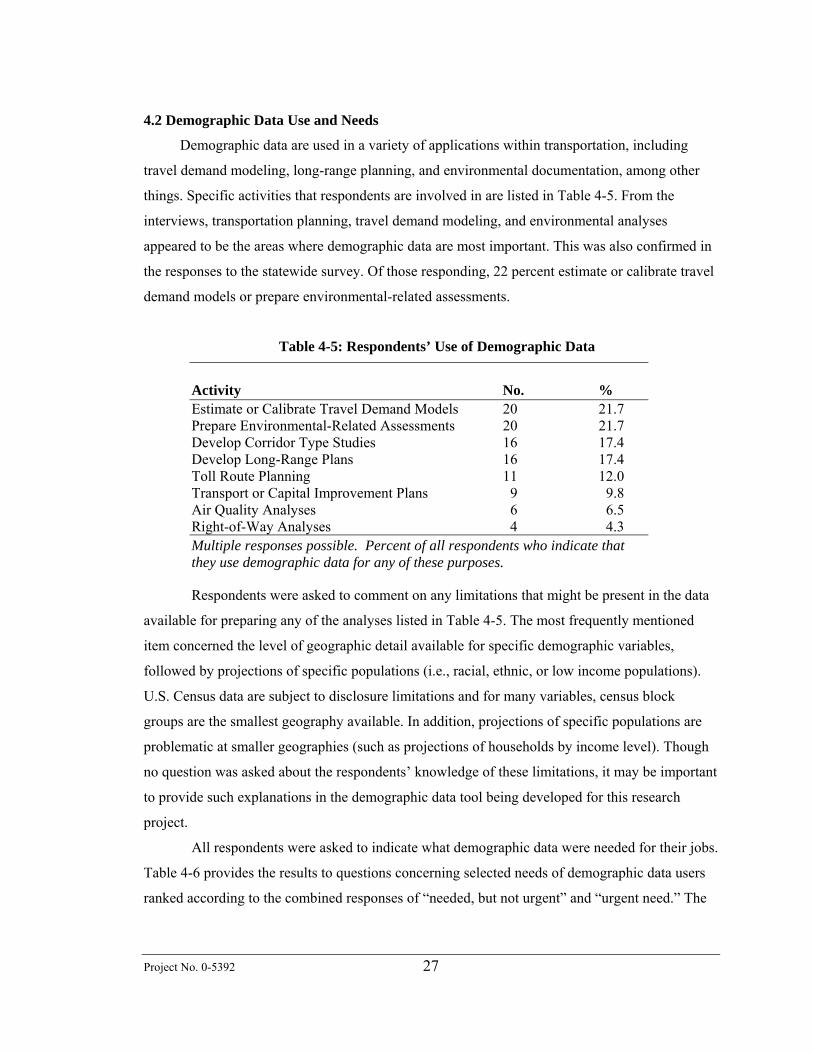
4.2 Demographic Data Use and Needs
Demographic data are used in a variety of applications within transportation, including
travel demand modeling, long-range planning, and environmental documentation, among other
things. Specific activities that respondents are involved in are listed in Table 4-5. From the
interviews, transportation planning, travel demand modeling, and environmental analyses
appeared to be the areas where demographic data are most important. This was also confirmed in
the responses to the statewide survey. Of those responding, 22 percent estimate or calibrate travel
demand models or prepare environmental-related assessments.
Table 4-5: Respondents’ Use of Demographic Data
Activity No. % Estimate or Calibrate Travel Demand Models 20 21.7 Prepare Environmental-Related Assessments 20 21.7 Develop Corridor Type Studies 16 17.4 Develop Long-Range Plans 16 17.4 Toll Route Planning 11 12.0 Transport or Capital Improvement Plans 9 9.8 Air Quality Analyses 6 6.5 Right-of-Way Analyses 4 4.3 Multiple responses possible. Percent of all respondents who indicate that they use demographic data for any of these purposes.
Respondents were asked to comment on any limitations that might be present in the data
available for preparing any of the analyses listed in Table 4-5. The most frequently mentioned
item concerned the level of geographic detail available for specific demographic variables,
followed by projections of specific populations (i.e., racial, ethnic, or low income populations).
U.S. Census data are subject to disclosure limitations and for many variables, census block
groups are the smallest geography available. In addition, projections of specific populations are
problematic at smaller geographies (such as projections of households by income level). Though
no question was asked about the respondents’ knowledge of these limitations, it may be important
to provide such explanations in the demographic data tool being developed for this research
project.
All respondents were asked to indicate what demographic data were needed for their jobs.
Table 4-6 provides the results to questions concerning selected needs of demographic data users
ranked according to the combined responses of “needed, but not urgent” and “urgent need.” The

Project No. 0-5392 28
most urgent need is better tools to access demographic data (29% “urgent need” responses). All
of the data need responses received 10 percent or less of “not needed” responses.
Table 4-6: Data Needs
Non Urgent Not Needed Need Urgent Need Total, Need Item No. % No. % No. % No. %
Additional Demographic Data 3 3.4 65 73.0 21 23.6 86 96.6 Key Demographic Data Tables 8 9.0 61 67.8 21 23.3 82 91.1 Better Data Access Tools 9 10.1 55 61.1 26 28.9 81 90.0
4.3 Training Needs Related to Demographic Data Use During the preliminary interviews, some of the staff mentioned that in smaller MPOs, the
turnover is typically greater than in TxDOT. Because of continued changes in the local areas and
greater regulatory demands placed upon these MPOs, interviewees felt that there is a need for
training on how to interpret the demographic data that is available. Survey respondents were
asked to rank their need of training on various demographic data sources and techniques. Table
4-7 shows the results of these questions. Although 50 percent of the respondents indicated a need
for training on all items, the responses that received the most “non-urgent” and “urgent need”
responses were training on demographic techniques (such as population estimates and
projections) and training on the Census Transportation Planning Package (CTPP).
Table 4-7: Training Needs
Non-Urgent Not Needed Need Urgent Need Total, Need Item No. % No. % No. % No. %
General Demographic Tech.* 15 16.9 57 63.3 18 20.0 75 83.3 CTPP+ 15 16.9 54 60.0 21 23.3 75 83.3 Accessing Data 16 18.0 54 60.0 20 22.2 74 82.2 Estimates & Projections 17 19.1 51 56.7 22 24.4 73 81.1 American Community Survey 21 23.6 52 57.8 17 18.9 69 76.7 American FactFinder 33 37.1 48 53.3 9 10.0 57 63.3 *Includes population estimates and projections techniques. +Census Transportation Planning Package.
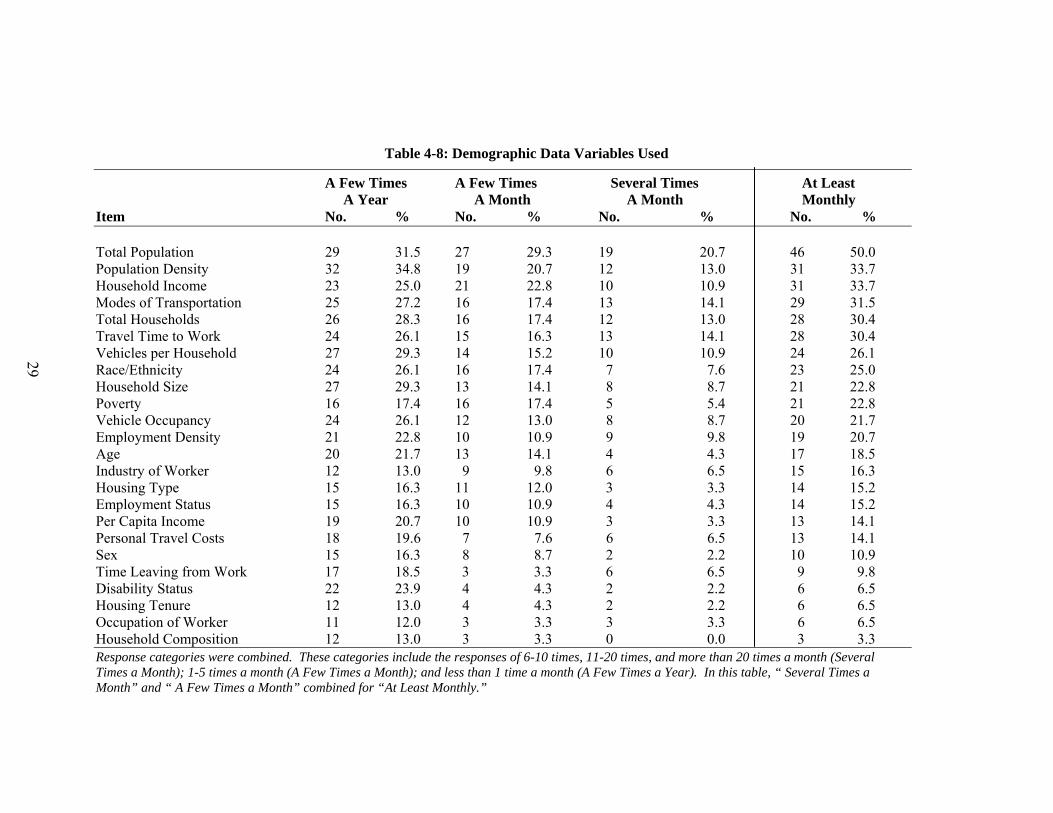
4.4 Demographic Variables Accessed Table 4-8 provides the responses to questions about the demographic variables used for
various analyses and the frequency of that use. Fifty percent of respondents indicated that they
use total population at least once a month, followed by population density (33.7%), household
income (33.7%), and transportation modes (31.5%).
29
Table 4-8: Demographic Data Variables Used
A Few Times A Few Times Several Times At Least A Year A Month A Month Monthly Item No. % No. % No. % No. % Total Population 29 31.5 27 29.3 19 20.7 46 50.0 Population Density 32 34.8 19 20.7 12 13.0 31 33.7 Household Income 23 25.0 21 22.8 10 10.9 31 33.7 Modes of Transportation 25 27.2 16 17.4 13 14.1 29 31.5 Total Households 26 28.3 16 17.4 12 13.0 28 30.4 Travel Time to Work 24 26.1 15 16.3 13 14.1 28 30.4 Vehicles per Household 27 29.3 14 15.2 10 10.9 24 26.1 Race/Ethnicity 24 26.1 16 17.4 7 7.6 23 25.0 Household Size 27 29.3 13 14.1 8 8.7 21 22.8 Poverty 16 17.4 16 17.4 5 5.4 21 22.8 Vehicle Occupancy 24 26.1 12 13.0 8 8.7 20 21.7 Employment Density 21 22.8 10 10.9 9 9.8 19 20.7 Age 20 21.7 13 14.1 4 4.3 17 18.5 Industry of Worker 12 13.0 9 9.8 6 6.5 15 16.3 Housing Type 15 16.3 11 12.0 3 3.3 14 15.2 Employment Status 15 16.3 10 10.9 4 4.3 14 15.2 Per Capita Income 19 20.7 10 10.9 3 3.3 13 14.1 Personal Travel Costs 18 19.6 7 7.6 6 6.5 13 14.1 Sex 15 16.3 8 8.7 2 2.2 10 10.9 Time Leaving from Work 17 18.5 3 3.3 6 6.5 9 9.8 Disability Status 22 23.9 4 4.3 2 2.2 6 6.5 Housing Tenure 12 13.0 4 4.3 2 2.2 6 6.5 Occupation of Worker 11 12.0 3 3.3 3 3.3 6 6.5 Household Composition 12 13.0 3 3.3 0 0.0 3 3.3 Response categories were combined. These categories include the responses of 6-10 times, 11-20 times, and more than 20 times a month (Several Times a Month); 1-5 times a month (A Few Times a Month); and less than 1 time a month (A Few Times a Year). In this table, “ Several Times a Month” and “ A Few Times a Month” combined for “At Least Monthly.”

Project No. 0-5392 30
As would be expected for individuals involved in transportation planning and analyses,
the level of geography used for most applications and most variables is the traffic analysis zone
(27%) as shown in Table 4-9. MPOs use TAZ geography for planning and travel demand
modeling, so it is not surprising that this is the level of geography used for most variables listed.
When limiting the responses to TxDOT only, the geographic level of most uses is at higher levels
of geography: mainly the TxDOT District, county, and Metropolitan Statistical Area (MSA)
levels2.
Table 4-9: Geographic Level of Most Uses (Combined Responses) % of % of All Geographic Level All Responses* TxDOT Responses+
TAZ 26.8 9.1 Block Group 18.2 6.4 MSA 15.0 18.3 Tract 13.4 14.6 County 13.1 18.3 TxDOT District 7.0 25.6 Place 6.6 2.7 *Includes responses by all respondents for all variables listed. +Includes responses by TxDOT respondents for all variables listed.
4.5 Demographic Data Sources Accessed Demographic data users were asked from what sources they obtained demographic data
and at what frequency. Those sources used at least monthly by 50 percent or more of the
respondents include: COG or MPO developed population estimates and projections (71%), U.S.
Census Summary Files (63%), Texas State Data Center Population Projections (56%), Texas
State Data Center Population Estimates for Counties (54.9%), city developed population
estimates and projections (54.4%), and Texas State Data Center Population Estimates for Places
(53.3%), as shown in Table 4-10.
2 Both TxDOT Districts and MSAs are configurations of several counties combined. A MSA is a statistical area designated by the US Office of Management and Budget. Metropolitan areas include an urbanized central county and any surrounding counties with dense populations and/or commuting patterns into the central county. The definition of MSAs change over time, so caution must be taken when comparing data over time.

31
Table 4-10: Frequency of Use for Demographic Data Sources
A Few Times A Few Times Several Times At Least A Year A Month A Month Monthly Item No. % No. % No. % No. %
COG or MPO Dev. Est. & Projections 13 14.4 27 30.0 37 41.1 64 71.1 U.S. Census Summary Files 23 25.6 32 35.6 25 27.8 57 63.3 SDC Population Projections 18 19.8 32 35.2 19 20.9 51 56.0 SDC Population Estimates for Counties 18 19.8 31 34.1 19 20.9 50 54.9 City Dev. Est. & Projections 19 21.1 27 30.0 22 24.4 49 54.4 SDC Estimates for Places 16 17.8 33 36.7 15 16.7 48 53.3 Census Transportation Planning Package 27 29.7 19 20.9 15 16.5 34 37.4 Journey to Work 33 36.3 21 23.1 10 11.0 31 34.1 Census PUMS 26 28.6 27 29.7 3 3.3 30 33.0 TxDOT SAM 19 20.9 18 19.8 11 12.1 29 31.9 TWC Quarterly Emp. Data 18 19.8 18 19.8 7 7.7 25 27.5 County-to-County Workflow Data 30 33.0 15 16.5 9 9.9 24 26.4 BEA Regional Economic Info. System (REIS) 21 23.1 18 19.8 6 6.6 24 26.4 American Community Survey 23 25.6 18 20.0 5 5.6 23 25.6 PL 94-171 24 26.4 11 12.1 2 2.2 13 14.3

Project No. 0-5392 32
Besides these demographic data sources, respondents also use university developed data
(3 responses), school district or TEA data (2 responses), Texas Water Development Board
population projections (1 response), Mexican Government related data (1 response) and other
non-specified data (2 responses). Listed sources that received the largest number of “do not use”
responses include: PL 94-171 (46%), Texas Workforce Commission Quarterly Employment Data
(37%), Bureau of Economic Analysis REIS data (37%), American Community Survey (36%),
and the TxDOT SAM model (32%). Most of these data sources are specialized sources of
information and the number of “do not use” responses is not surprising. One item that does stand
out is the number of “do not use” responses for the American Community Survey (ACS). The
intention of the U.S. Census Bureau is to replace the long-form data for the Decennial Census
with the ACS. Thus transportation planners will be dependent upon the ACS in the future for
such things as information on income levels, poverty, and language spoken at home, among other
items. Additional awareness about this change in data availability and its limitations will be
critical for demographic data users at TxDOT and other transportation related agencies in the
future.

Project No. 0-5392 33
4.6 Demographic Data Tool Preferences
In addition to the questions about data sources and variables used and needed, the
demographic data users were asked about their preferences for accessing demographic data via a
demographic analysis tool as outlined in the original project proposal. First, users were asked to
indicate their preference for accessing demographic data. Overwhelmingly the respondents
expressed a desire to access demographic data through the Internet (86%) (shown in
Table 4-11).
Table 4-11: Preferred Method of Access
Media Method No. %
Internet 77 85.6 CD 11 12.2 DVD 1 1.1 Other 1 1.1
Total 90 Respondents were also asked to rank the importance of specific features that might be
included within a demographic data tool (Table 4-13). Forty-nine percent of respondents felt that
an ability to create user-specific queries was very important, followed by the ability to export the
data to an Excel format for reporting (46%).
Understanding how the demographic data may be utilized within other software and
databases will help refine the features of the demographic data tool. Only 34% of respondents
indicated that mapping features were very important for the design of a demographic data access
tool. This may be a reflection of the data users’ access to other mapping packages where
demographic data may be imported and analyzed. Most users (96%) have access to an ESRI-
based Geographic Information System (GIS)(shown in Table 4-12).
Table 4-12: Geographic Information System Software Used
GIS No. %
ArcView/ArcGIS 68 95.8 TransCAD 35 38.0 GeoMedia 3 3.3 Maptitude 8 8.7 MapInfo 4 4.4 Other GIS 2 2.2

34
Table 4-13: Importance of Selected Features
Of Little Moderately Very Unimportant Importance Important Important Important Item No. % No. % No. % No. % No. %
Data Query Tool 0 0.0 0 0.0 10 11.1 36 40.0 44 48.9 Excel Imports 0 0.0 1 1.1 17 18.9 31 34.4 41 45.6 Maps 1 1.1 2 2.2 21 23.3 35 38.9 31 34.4 Charts & Graphs 0 0.0 5 5.6 26 28.9 33 36.7 26 28.9 Tables of Key Variables 1 1.1 2 2.2 21 23.3 40 44.4 26 28.9 .DBF Export 2 2.2 7 7.8 25 27.8 35 38.9 21 23.3 .CSV Export 7 7.9 14 15.7 34 38.2 20 22.5 14 15.7

Project No. 0-5392 35
4.7 Perceived Demographic Trends Impacting Transportation in Texas
Demographic data users within TxDOT and other transportation related agencies find that the
most significant trend impacting transportation in Texas is total population growth within the
state. Ninety-three percent of respondents indicated that this trend is a significant or very
significant trend impacting Texas transportation. Five trends involving different aspects of total
population growth (state population growth, growth in the Texas triangle, suburban population
growth, exurban population growth, and Hispanic population growth) received 50 percent or
more responses of significant or very significant. Table 4-14 provides the number and percentage
of respondents for each demographic trend, ranked by combined responses of significant or very
significant. Figure 4-1 shows the items with 50 percent or more of responses listed as significant
or very significant.
Table 4-14: Perceptions of Demographic Trends Impacting Transportation
Not Moderately Significant Significant Significant to Very Sign. Item No. % No. % No. % State Population Growth 0 0.0 6 6.6 85 93.4 Suburban Population Growth 0 0.0 14 15.4 77 84.6 Dispersion of Employment Nodes* 1 1.1 18 19.8 72 79.1 Texas Triangle Growth 7 7.7 13 14.3 71 78.0 Increase in Autos per Household 7 7.7 13 14.3 71 78.0 Exurban Population Growth 0 0.0 26 28.6 65 71.4 Work Related Travel 5 5.5 25 27.5 61 67.0 Baby Boom Aging 11 12.2 23 25.6 56 62.2 Hispanic Population Growth 18 17.6 22 24.2 53 58.2 Decrease in Avg. Household Size 18 19.8 28 30.8 45 49.5 Foreign Immigration 23 25.3 27 29.7 41 45.1 Concentration of Poverty 14 15.4 38 41.8 39 42.9 Increase in Minority Auto Ownership 28 30.8 33 36.3 30 33.0 *Over the last fifty years or longer, population within cities in the United States has expanded beyond the central business district. In addition, employers seeking to be close to employees as well as seeking lower cost land have sought out locations in suburban and exurban areas, thus dispersing employment nodes beyond traditional central city locations.

Project No. 0-5392 36
Perceived Significance of Selected Demographic Trends
0 10 20 30 40 50 60 70 80 90 100
Increase in Min. Auto Ownership
Concentration Of Poverty
Foreign Immigration
Decrease in Avg. HH Size
Hisp. Pop. Growth
Baby Boom Aging
Work Related Travel
Exurban Pop Growth
Increase in Autos
TX Triangle Growth
Disp. Of Emp. Nodes
Suburban Pop Growth
State Pop Growth
Tre
nd
Percent of Responses
Figure 4-1: Significant or Very Significant Trends
Nine respondents indicated that other trends were having impacts on transportation. The
item most cited (four responses) concerned rising fuel costs. One respondent indicated a concern
for population age differentials between urban, older-suburban and newer-suburban
neighborhoods. All other respondents did not specify the trend they perceived as impacting
transportation in Texas.
Respondents were asked to indicate their level of agreement with this statement: “TxDOT
adequately considers demographic factors when planning new transportation infrastructure.”
Though a majority of the respondents either agreed or strongly agreed with this statement, the
percentages of the responses varied by organization type (whether the respondent was from
TxDOT or another agency). Only 41 percent of non-TxDOT personnel agreed or strongly agreed
with this statement, compared to 83 percent of TxDOT personnel. Table 4-15 and Figure 4-2
show the responses by respondent type and response.

Project No. 0-5392 37
Table 4-15: Response to Statement: “TxDOT Adequately Considers Demographic Factors…”
Disagree* Undecided Agree* Respondent Type No. % No. % No. % TxDOT Personnel 1 3.3 4 13.3 25 83.3 Others 16 26.2 20 32.8 25 41.0 All 17 18.7 24 26.4 50 54.9 N = 91 Χ2 = 15.1 Cramer’s V = .41 *Responses of disagree (agree) and strongly disagree (agree) combined. Chi-Square significant at the .001 level.
0 10 20 30 40 50 60 70 80 90
Disagree Undecided Agree
TxDOT Others
Figure 4-2: TxDOT’s Consideration of Demographic Factors Regardless of the respondents’ opinions about TxDOT’s use of demographic information
for transportation planning, the majority of the respondents (53%) feel that demographic data are
very important to their job. No one felt that demographic data are unimportant for their own job.
Table 4-16: Importance of Demographic Data for Respondents’ Job
Level of Importance No. %
Very important 48 52.8 Important 28 30.8 Moderately important 13 14.3 Of little importance 2 2.2
Total Responses 91

Project No. 0-5392 38

Project No. 0-5392 39
Chapter 5 : Conclusions
The results of the survey and the interviews show that demographic data are important to
many at TxDOT and other transportation related agencies. However, there are gaps in availability
and knowledge about sources of demographic data available for TxDOT planners. Demographic
information is used at TxDOT, although the number of individuals using demographic data on a
regular basis is in the 50-60 person range. Even when individuals were identified as potential
users because of their title, replies to the survey were received that, in effect, stated that these
individuals did not use demographic data very much. The survey showed that the geographic
level of detail for most TxDOT personnel use was at the district or county levels, whereas MPO
and other staff used data at smaller levels of geographic detail, mainly the TAZ, census tract, or
census block group levels. Since TxDOT is charged with planning for transportation needs
statewide, this is not necessarily surprising. Within TxDOT, demographic data users are found
primarily in the Transportation Planning and Programming and Environmental Affairs Divisions
and in Transportation Planning and Project Development at the District level. Both Project
Development and Environmental Affairs personnel use demographic data primarily for
environmental type analyses and documents, while the other two areas use demographic data for
planning to address transportation needs.
One of the greatest uses of demographic data is related to environmental analyses,
including environmental justice (EJ) studies. TxDOT has recently sponsored research that will
develop a methodology for conducting EJ studies (Victoria et al. 2006). This should provide
some consistency in what demographic data are utilized, at what geographic levels and for what
purposes, as well as some understanding of why those methods and data were used instead of
others.
For EJ and other transportation planning uses, a number of demographic data sources are
available to demographic data users; however, users do not always know where to locate those
sources or how to evaluate their usefulness. In addition, a data source may be used for a project in
one month but it might not be needed again for several months. At that point, the user may have
forgotten how to access that data from the data source. A one-stop source may be valuable for
these users.
The information provided by this research will guide the development of a one-stop
demographic data tool for TxDOT data users. The data tool will be designed so that it can be
accessed through a CD ROM software database platform with the goal of migrating it to a web-

Project No. 0-5392 40
based application during an implementation phase. A users group made up of a small number of
TxDOT and MPO transportation planners will provide feedback to the project team. In addition, a
workshop made up of demographic data users will be held in San Antonio in the spring of 2007,
so that data users can test a preliminary copy of the demographic data tool. Feedback from this
workshop will be used to refine the product so a final version can be distributed to TxDOT
demographic data users in late spring of 2007.
In addition to the development of a demographic data tool, the project team will embark on a
review of the demographic trends that will have impacts on transportation in Texas. Some of
these issues were briefly discussed in Chapter 1 of this document, including: population growth,
changes in age composition and racial and ethnic diversity, and differentials in income disparity.
First, a comprehensive review of the literature of demographic trends as they relate to
transportation will be completed. In consultation with the research management committee, the
research team will outline other areas of inquiry that appear critical to transportation in Texas.
Several trends will be explored in depth during the second year and will conclude with a final
document about demographic trends in Texas.
Project No. 0-5392 41
Appendix: Catalogue of Demographic Data Sources Used in Transportation Planning
The following list of databases was derived from initial research about uses of
demographic information within transportation, as well as from our interviews of selected
TxDOT personnel. Our goal was to uncover public sources of demographic data that are useful
for TxDOT personnel. We believe we have uncovered the majority of sources most valuable to
TxDOT personnel; however, some sources might have been omitted. Additional sources will be
added as they are discovered throughout the course of this research project.
Database: American Community Survey Source: U.S. Census Bureau Reference Date of Latest Data: 2004 (limited by geography) Frequency of Production: Yearly, 6 to 8 months after year of data collection TxDOT Uses: Environmental justice analysis, transportation planning, travel demand
calibration and modeling Geographic Level(s): Block group, tract, county, MSA, state (not available for all areas at this time) Variables: Multiple census variables (population, household, housing) Media: Online, ftp download Additional Notes: The American Community Survey is designed to replace the long form of the
decennial census. Yearly data are available for the nation, states, and populous areas (governmental units with 65,000 or more in population). Data for other areas will be reported on a 3 to 5 year rolling average basis. Data are available for years 2000 to 2004. Some pre-2000 data are available for the test sites of Fort Bend, Harris, Starr, and Zapata counties in Texas. Since CTPP related questions are asked on the long form, this will be the main source of transportation related census data in the future.
Website: http://www.census.gov/acs/www Database: Census 2000, SF 1-4 Source: U.S. Census Reference Date of Latest Data: 2000 Frequency of Production: Every 10 years, generally 1 to 3 years after data collection TxDOT Uses: Environmental justice analysis Geographic Level(s): Block (SF-1, 2), block group, tract, city, ZCTA, county, MSA, state, nation Variables: Various (population, journey to work, income, vehicle ownership) Media: Online, CD or DVD, ftp download Website: http://factfinder.census.gov

Project No. 0-5392 42
Database: Census 2000, Public Use Microdata Samples (1% & 5%) Source: U.S. Census Reference Date of Latest Data: 2000 Frequency of Production: Every 10 years, generally 1 to 3 years after data collection TxDOT Uses: Used to calibrate travel demand models Geographic Level(s): PUMAs Variables: Various (population, journey to work, income, vehicle ownership) Media: DVD, ftp download Website: http://www.census.gov/main/www/pums.html Database: Census 2000, County to County Flow Data Source: U.S. Census Reference Date of Latest Data: 2000 Frequency of Production: Every 10 years, 3 to 4 years after data collection TxDOT Uses: Transportation planning Geographic Level(s): Counties Variables: Total number of commuters by residence county and work county Media: Available to download (Excel and text formats) Additional Notes: These data were derived from the decennial census long-form. Because
the American Community Survey is replacing the long form, there will be changes in this data set.
Website: http://www.census.gov/population/www/cen2000/commuting.html Database: Texas Statewide Analysis Model (SAM) Source: TxDOT (data sources vary) Reference Date of Latest Data: 1998 Frequency of Production: First version created; planned update every 5 years TxDOT Uses: Grant planning; project analysis Geographic Level(s): Counties, TxDOT Districts, state, TAZ Variables: Total population, total households, employment, population projections Media: CD software Website: None

Project No. 0-5392 43
Database: Census Transportation Planning Package 2000 Source: U.S. Census Bureau and Federal Highway Administration Reference Date of Latest Data: 2000 Frequency of Production: Every 10 years TxDOT Uses: Used to calibrate transportation models; used in general transportation planning Geographic Level(s): Traffic Analysis Zone (TAZ) (for some areas) and block group or tract for all
others; county; state Variables: Place of work and place of residence workforce data; modes of transportation;
commute times; demographic characteristics from census data Media: CD Data Extraction Tool Additional Notes: The CTPP is created in partnership between FHWA and the Census Bureau.
Both are working on ways to integrate transportation data within the American Community Survey.
Website: http://www.fhwa.dot.gov/ctpp/
Database: Consumer Expenditure Survey Source: U.S. Bureau of Labor Statistics Reference Date of Latest Data: 2004 Frequency of Production: Every year, 10 year after data collection TxDOT Uses: Used to estimate transportation costs for various
demographic groups Geographic Level(s): National; regions (combination of states); selected MSAs (including
Dallas-Ft. Worth and Houston) Variables: Consumer expenditures by consumer unit type and region; transportation costs
and expenditures on travel among expenditures tabulated Media: Online, ftp, selected publications Website: http://www.bls.gov/cex/home.htm
Project No. 0-5392 44
Database: EnviroMapper (See Specifically Environmental Justice Assessment Tool)
Source: EPA (data sources vary) Reference Date of Latest Data: 2000 (demographic data) Frequency of Production: Demographic data from U.S. Census. Additional data on monitored sites,
environmental cleanup sites, transportation, and other items; updated with various frequencies.
TxDOT Uses: Environmental Justice Geographic Level(s): Census block group Variables: Persons per square mile, per capita income, percent minority, percent persons
below poverty, educational attainment (less than high school diploma, high school diploma, and bachelors or greater), percent persons below age 18 years, percent houses built prior to 1950, and percent of people who speak English less than very well)
Media: Online Website: http://www.epa.gov/enviro/html/em/index.html
Database: Local Employment Dynamics Source: U.S. Census/U.S. Bureau of Labor Statistics Reference Date of Latest Data: 2003 Frequency of Production: Yearly TxDOT Uses: New database in testing phase. Estimate and map out labor sheds by location
(origins and destinations of workers). Geographic Level(s): Labor sheds; county; city; MSA Variables: Total Worker Population by Place of Residence and Place of Work (Labor
Shed/Commute Shed); Industry Employment by Age and Sex; Earnings by Age and Sex; Turnover by Industry, Age, and Sex
Media: Online Additional Information: Texas is one of several states currently partnered with the Census Bureau for
this program. Website: http://lehd.dsd.census.gov/led/index.html

Project No. 0-5392 45
Database: Modern Language Association Language Map Source: U.S. Census 2000 Reference Date of Latest Data: 2000 Frequency of Production: Unknown TxDOT Uses: Used for environmental justice analysis and public hearing preparation
(printing of flyers for dominate languages). Geographic Level(s): ZIP Code Tabulation Area; county Variables: Map of languages spoken at home derived from the 2000 Census Media: Online Website: http://www.mla.org/census_map Database: National Household Travel Survey Source: U.S. Bureau of Transportation Statistics and Federal Highway Administration Reference Date of Latest Data: 2001 Frequency of Production: Varies; scheduled for 2008 TxDOT Uses: Used to calibrate travel demand models Geographic Level(s): National Variables: Combines data from former National Personal Travel Survey and American
Travel Survey Media: Online, various publications Website: http://www.bts.gov/programs/national_household_travel_survey/
Database: Population Estimates by County and Place Source: Texas State Data Center/Texas State Demographer Reference Date of Latest Data: July 1, 2004 Frequency of Production: Yearly TxDOT Uses: Used to control local estimates and calibrate travel demand models. Used for
funding allocations. Used in environmental related analyses. Geographic Level(s): Place; county; MSA; COG; state Variables: Total population by age, sex, race, and ethnicity (at county level) Media: Online (limited), CD, paper Website: http://txsdc.utsa.edu

Project No. 0-5392 46
Database: Population Projections by County Source: Texas State Data Center/Texas State Demographer Reference Date of Latest Data: Projections for 2000 to 2040 Frequency of Production: Every other year TxDOT Uses: Used to control local estimates and calibrate travel demand models; used in
long-range planning Geographic Level(s): County; MSA; COG; state Variables: Total population by age, sex, race, and ethnicity;
households, labor force, school enrollments (every 2-3 years) Media: Online (limited), CD, paper Website: http://txsdc.utsa.edu
Database: Population Projections by County Source: Texas Water Development Board Reference Date of Latest Data: Population projected from 2000 to 2060 Frequency of Production: Last revision, 2004 TxDOT Uses: Used to control local estimates Geographic Level(s): County; water planning regions; state Variables: Total population Media: Online Website: http://www.twdb.state.tx.us/data/popwaterdemand/main.asp Database: Regional Economic Information System (REIS) Source: U.S. Bureau of Economic Analysis Reference Date of Latest Data: 2004 Frequency of Production: Every year TxDOT Uses: Income data used to calibrate travel demand models Geographic Level(s): County, MSA, BEA economic region, state, national Variables: Per capita income; earnings by NAICS; employment by NAICS by place of
work; total population Additional Information: Data are available for 1969 through 2004, so historical data can be reviewed
for economic trends. Population estimates from the U.S. Census Bureau are included in the data.
Media: Online, CD Website: http://www.bea.gov/bea/regional/data.htm

Project No. 0-5392 47
Bibliography
Crane, Randall, Abel Valenzuela, Dan Chatman, Lisa Schweitzer, and Peter J. Wong. 2002. “California Travel Trends and Demographics Study: Final Report.” Los Angeles: Institute of Transportation Studies, University of California, Los Angeles.
Huntley, Lance R. 2003. “Development and Use of Social and Economic Data at MoDOT.”
Jefferson City, MO: Missouri Department of Transportation: Research, Development and Technology Office. Report No. RDT 03-011.
Miller, John. 2003. “Expected Changes in Virginia Transportation Demand by 2025.”
Charlottesville, VA: Virginia Transportation Research Council. http://www.virginiadot.org/projects/resources/VTransTrendsMarch31F.pdf (accessed August 7, 2006).
Murdock, Steve, et al. 2003. The New Texas Challenge: Population Change and the Future
of Texas. College Station, TX: Texas A&M University Press. Murdock, Steve, and David Ellis. 1991. Applied Demography: An Introduction to Basic
Concepts, Methods and Data. Boulder, CO.: Westview Press. Texas State Data Center. 2005. “Estimates of the Total Populations of Counties and Places in
Texas for July 1, 2004 and January 1, 2005.” San Antonio, TX: University of Texas at San Antonio.
Texas State Data Center. 2004. “Projections of the Population of Texas and Counties in
Texas 2000-2040.” San Antonio, TX: University of Texas at San Antonio.
TxDOT Report. 2004. “Texas Statewide Analysis Model, Theory Report.” Austin, TX: Alliance-Texas Engineering Company.
U.S. Census Bureau. 1990. “Census 1990 Summary File 1.” Washington, D.C. U.S. Census Bureau. 2000. “Census 2000 Summary File 1.” Washington, D.C. U.S. Census Bureau 2000. “Census 2000 Geographic Terms and Concepts.” U.S. Census
Bureau, Washington, D.C. Accessed at: http://www.census.gov/geo/www/tiger/glossry2.pdf
U.S. Census Bureau 2006. “County Population Estimates for July 1, 2005.” U.S. Census
Bureau, Washington, D.C. Accessed at: http://www.census.gov/popest/estimates.php Victoria, I., J. Prozzi, G. Torres, C.M. Walton, and J.A. Prozzi 2006 (Forthcoming).
“Identifying, Measuring, and Mitigating Environmental Justice Impacts of Toll Roads” The University of Texas at Austin. Center of Transportation Research. Report 5208-R2