Embed Size (px)
Citation preview

Supplementing Census DataSANDAG Case Study
Supplementing Census DataSANDAG Case Study

DEMOGRAPHIC DATA
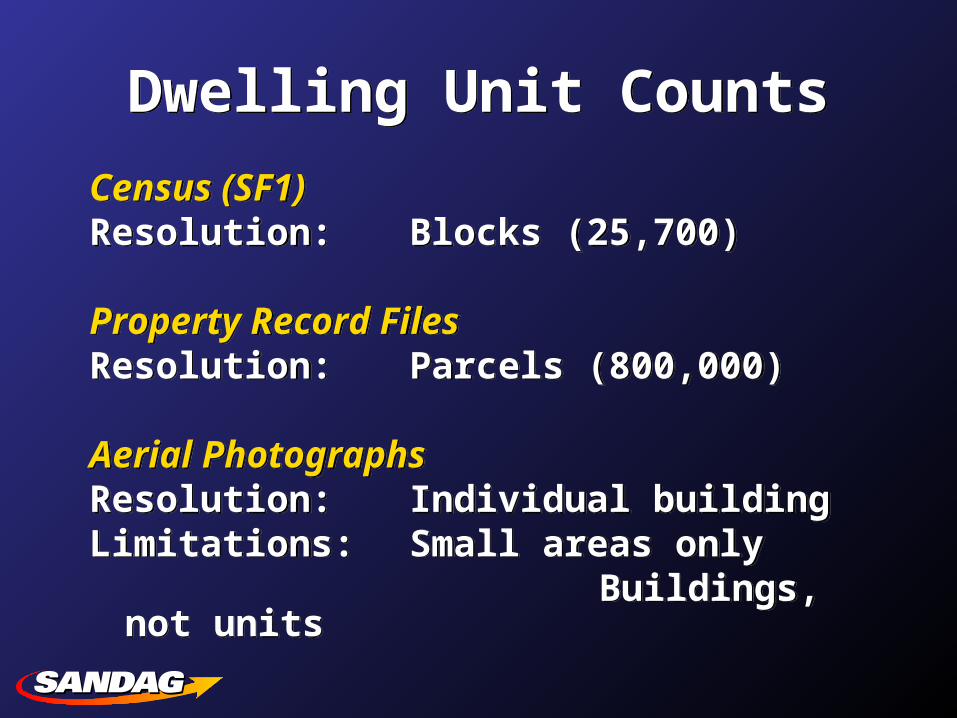
Dwelling Unit CountsDwelling Unit Counts
Census (SF1)Resolution: Blocks (25,700)
Property Record Files Resolution: Parcels (800,000)
Aerial Photographs Resolution: Individual buildingLimitations: Small areas only Buildings, not units
Census (SF1)Resolution: Blocks (25,700)
Property Record Files Resolution: Parcels (800,000)
Aerial Photographs Resolution: Individual buildingLimitations: Small areas only Buildings, not units
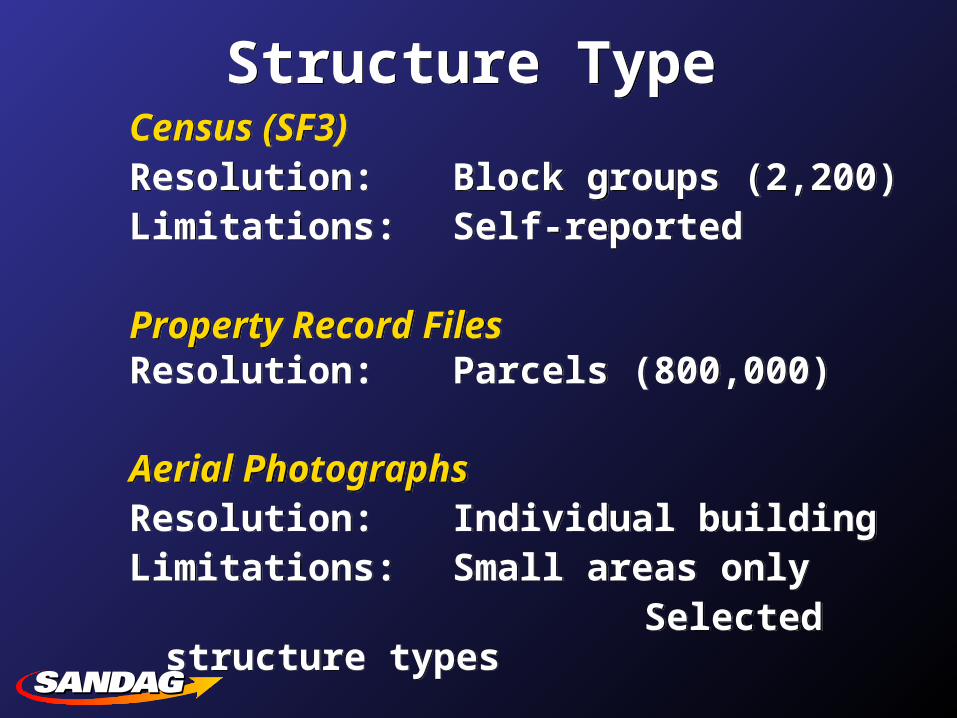
Structure TypeStructure TypeCensus (SF3)Resolution: Block groups (2,200)Limitations: Self-reported
Property Record FilesResolution: Parcels (800,000)
Aerial Photographs Resolution: Individual buildingLimitations: Small areas only Selected structure types
Census (SF3)Resolution: Block groups (2,200)Limitations: Self-reported
Property Record FilesResolution: Parcels (800,000)
Aerial Photographs Resolution: Individual buildingLimitations: Small areas only Selected structure types
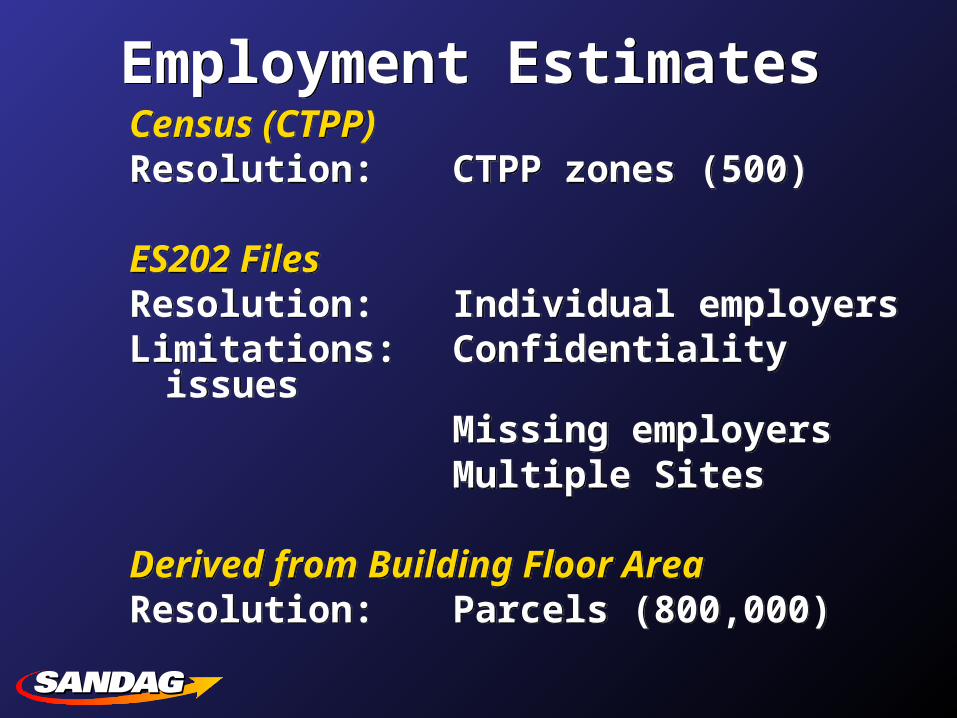
Employment EstimatesEmployment EstimatesCensus (CTPP)Resolution: CTPP zones (500)
ES202 Files Resolution: Individual employersLimitations: Confidentiality issues
Missing employersMultiple Sites
Derived from Building Floor AreaResolution: Parcels (800,000)
Census (CTPP)Resolution: CTPP zones (500)
ES202 Files Resolution: Individual employersLimitations: Confidentiality issues
Missing employersMultiple Sites
Derived from Building Floor AreaResolution: Parcels (800,000)
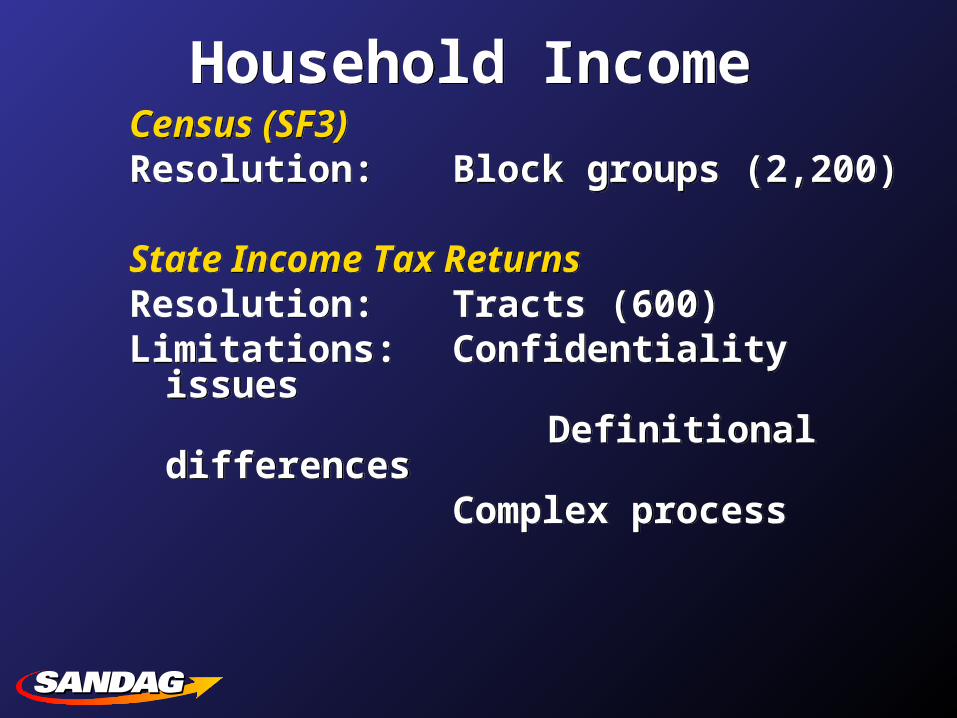
Household IncomeHousehold IncomeCensus (SF3)Resolution: Block groups (2,200)
State Income Tax Returns Resolution: Tracts (600)Limitations: Confidentiality issues Definitional differences
Complex process
Census (SF3)Resolution: Block groups (2,200)
State Income Tax Returns Resolution: Tracts (600)Limitations: Confidentiality issues Definitional differences
Complex process
Case StudyParcel Level Dwelling Units
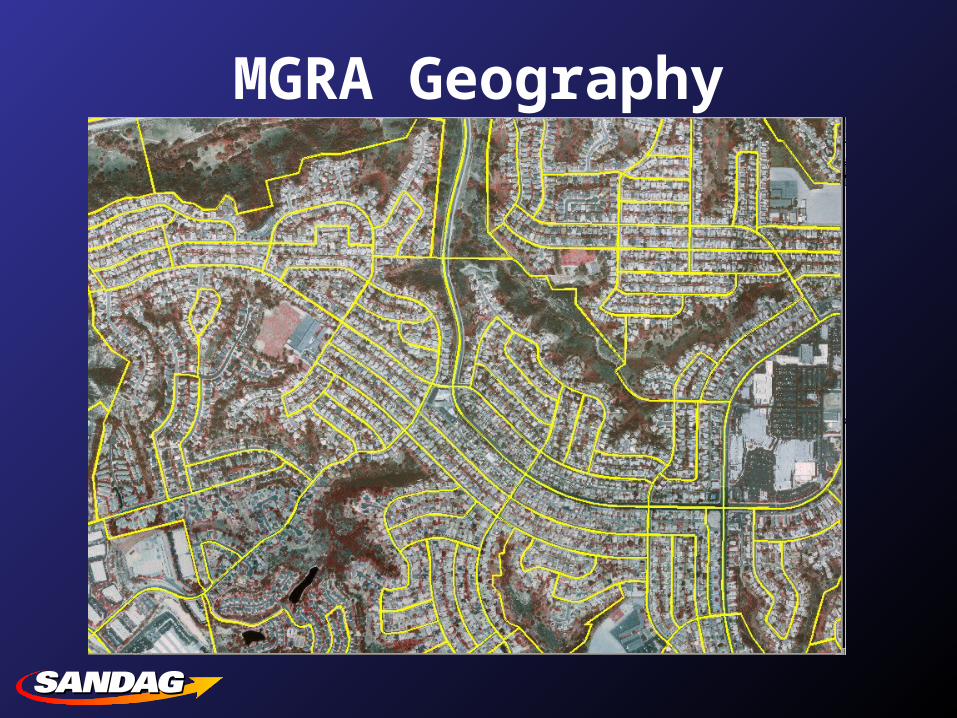
MGRA Geography
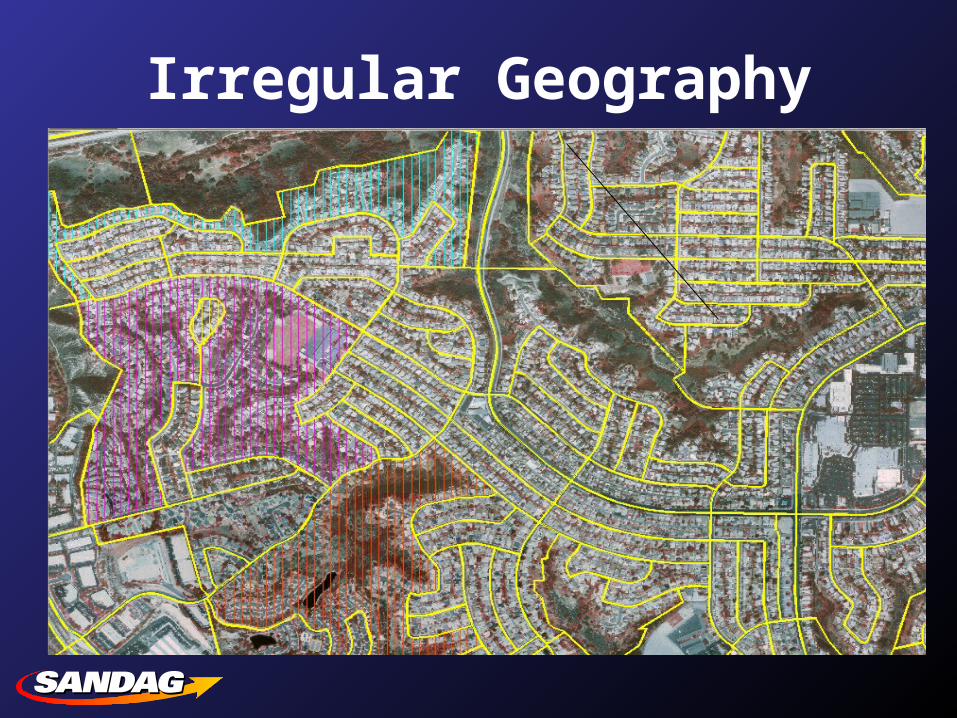
Irregular Geography
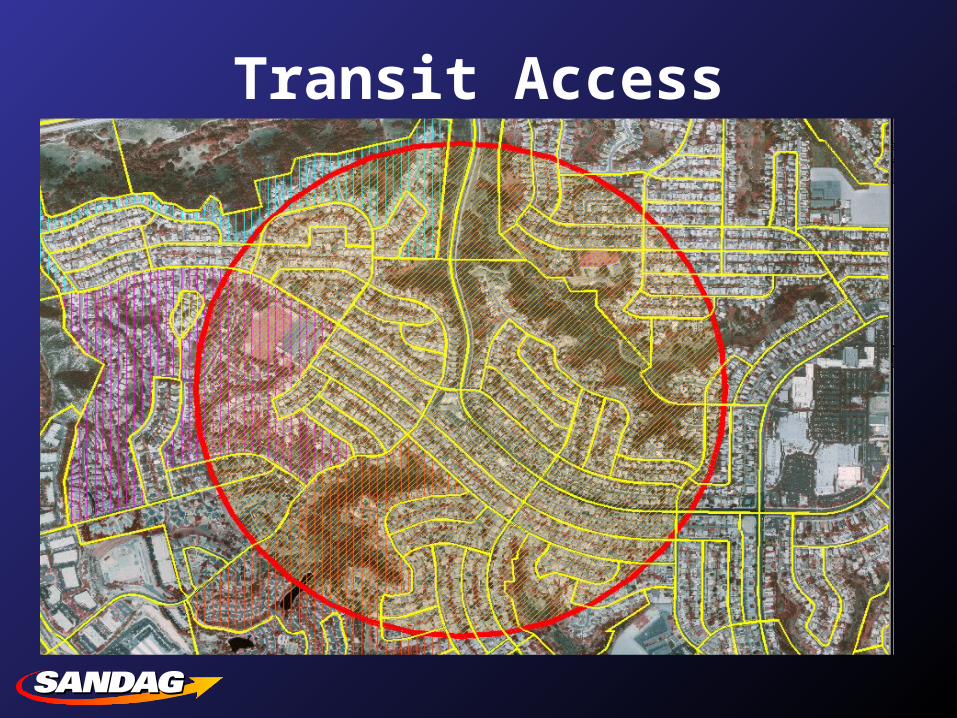
Transit Access
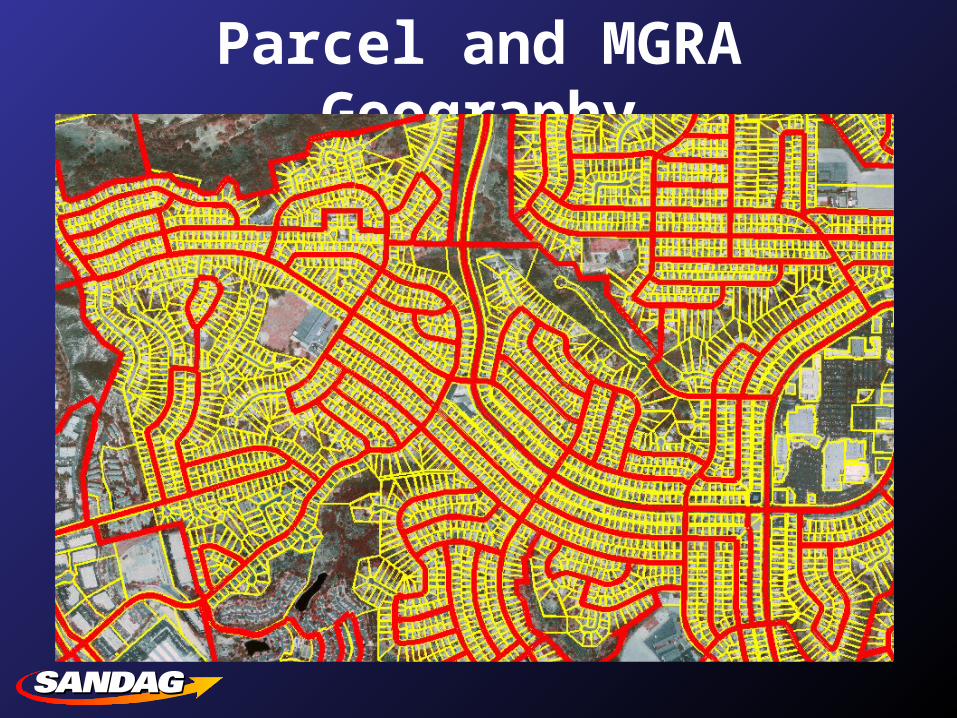
Parcel and MGRA Geography
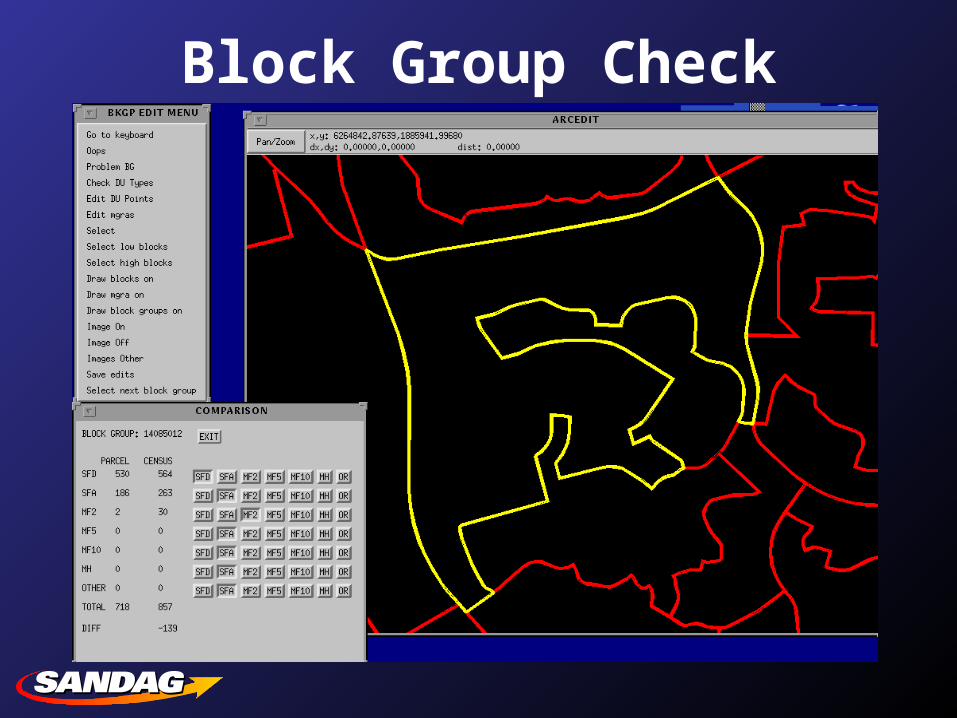
Block Group Check
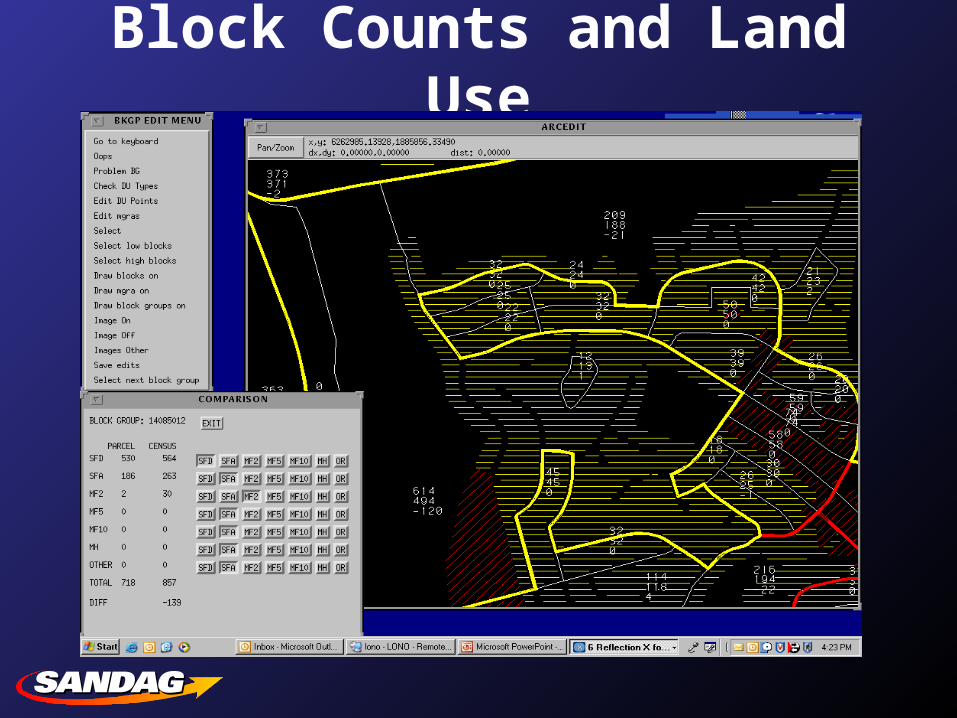
Block Counts and Land Use
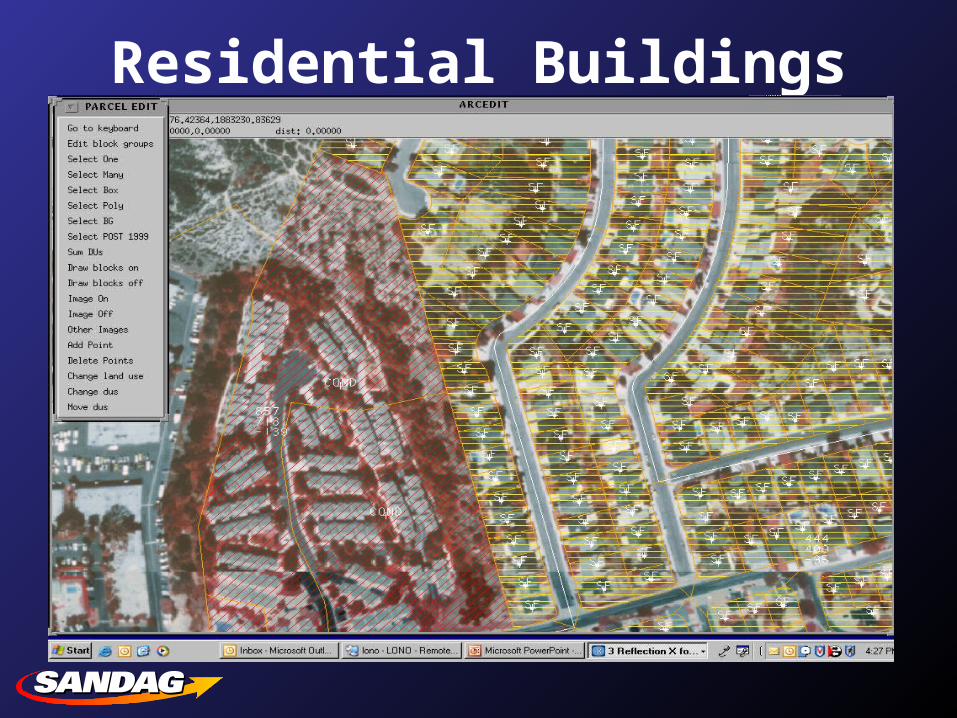
Residential Buildings
Problem AreasProblem Areas
Census Structure typesGeo-coding qualityBlock definitionsSenior housing
Property Record Files Units on public/non-taxable land
Both Units under construction
Census Structure typesGeo-coding qualityBlock definitionsSenior housing
Property Record Files Units on public/non-taxable land
Both Units under construction
TRANSPORTATION DATA
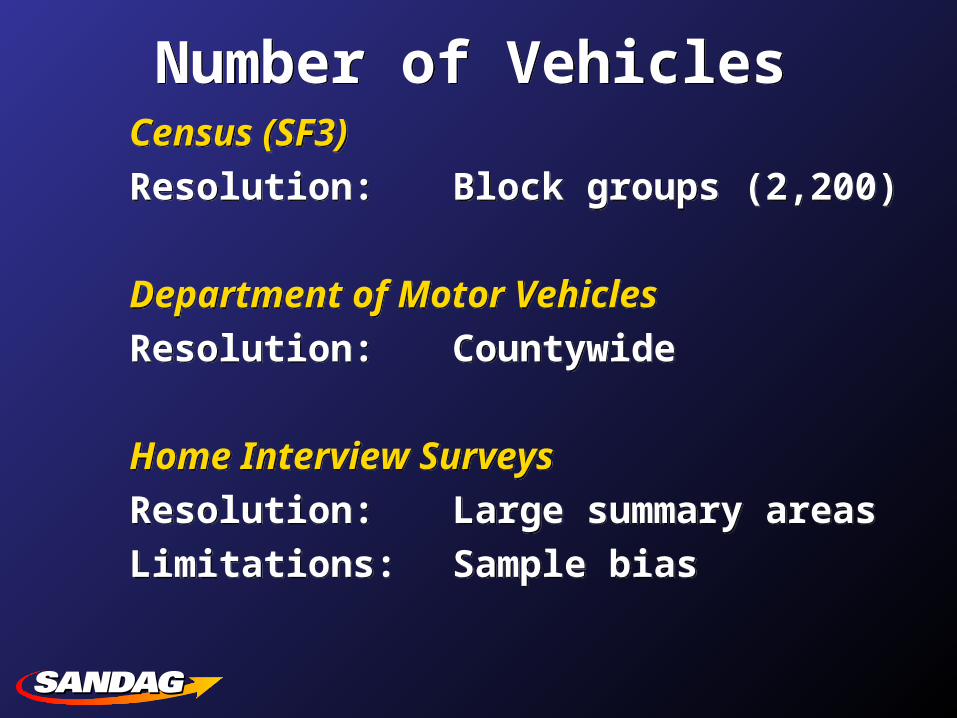
Number of VehiclesNumber of VehiclesCensus (SF3)
Resolution: Block groups (2,200)
Department of Motor Vehicles
Resolution: Countywide
Home Interview Surveys
Resolution: Large summary areas
Limitations: Sample bias
Census (SF3)
Resolution: Block groups (2,200)
Department of Motor Vehicles
Resolution: Countywide
Home Interview Surveys
Resolution: Large summary areas
Limitations: Sample bias
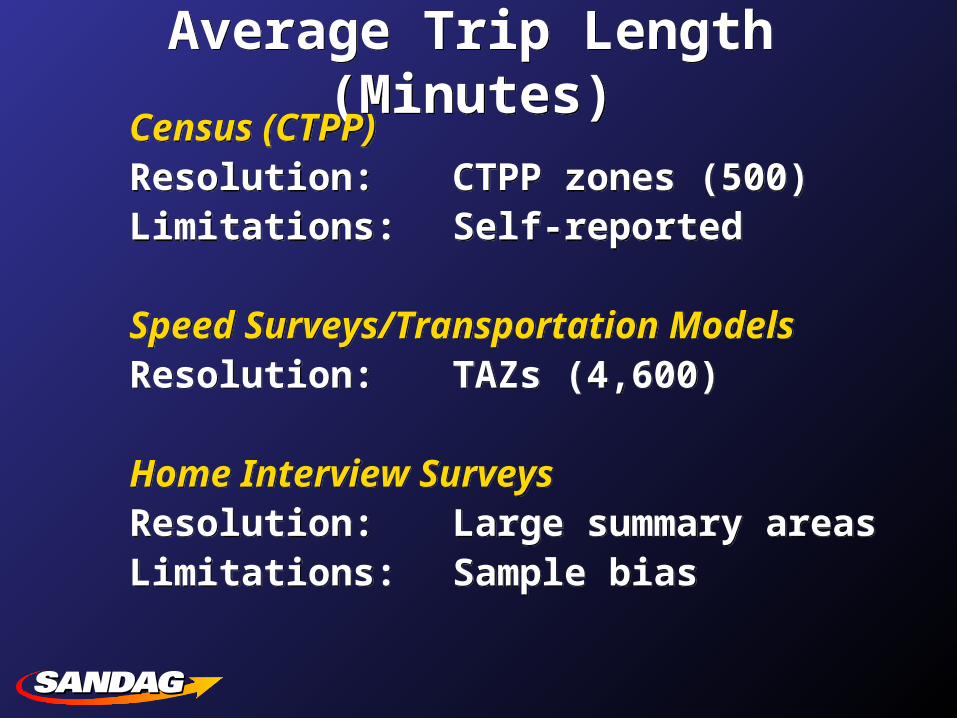
Average Trip Length (Minutes)Average Trip Length (Minutes)Census (CTPP)Resolution: CTPP zones (500)Limitations: Self-reported
Speed Surveys/Transportation Models Resolution: TAZs (4,600)
Home Interview Surveys Resolution: Large summary areasLimitations: Sample bias
Census (CTPP)Resolution: CTPP zones (500)Limitations: Self-reported
Speed Surveys/Transportation Models Resolution: TAZs (4,600)
Home Interview Surveys Resolution: Large summary areasLimitations: Sample bias
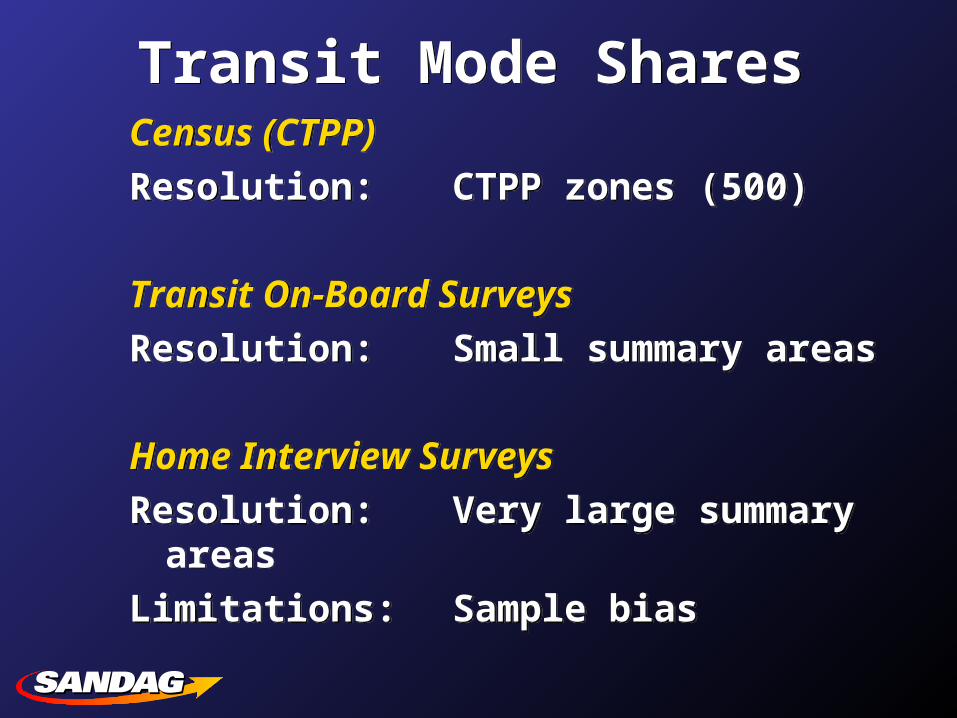
Transit Mode SharesTransit Mode SharesCensus (CTPP)
Resolution: CTPP zones (500)
Transit On-Board Surveys
Resolution: Small summary areas
Home Interview Surveys
Resolution: Very large summary areas
Limitations: Sample bias
Census (CTPP)
Resolution: CTPP zones (500)
Transit On-Board Surveys
Resolution: Small summary areas
Home Interview Surveys
Resolution: Very large summary areas
Limitations: Sample bias
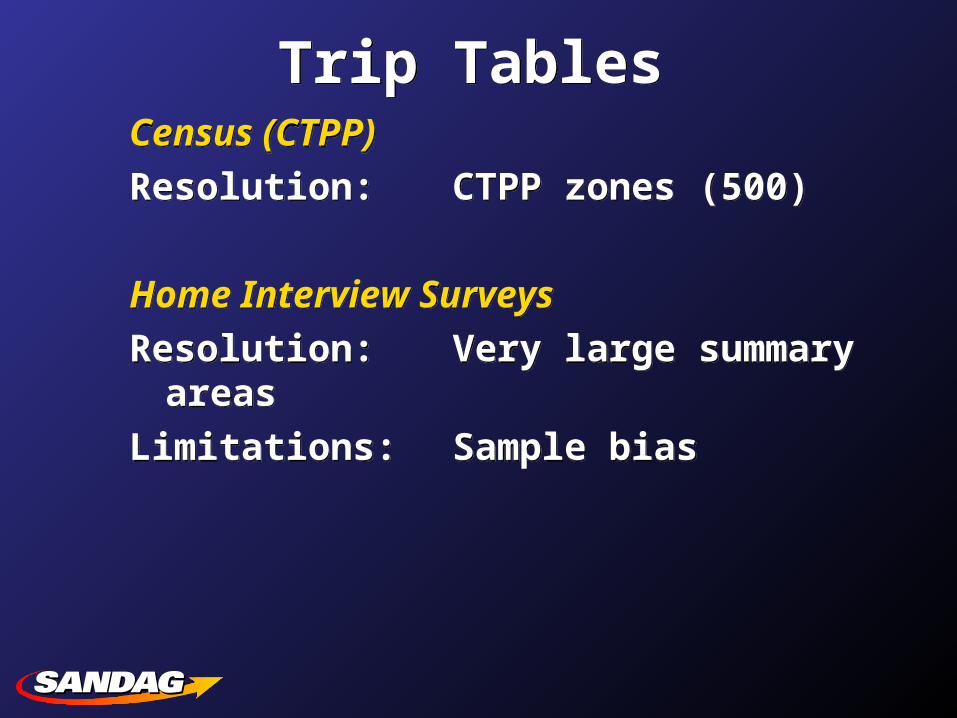
Trip TablesTrip TablesCensus (CTPP)
Resolution: CTPP zones (500)
Home Interview Surveys
Resolution: Very large summary areas
Limitations: Sample bias
Census (CTPP)
Resolution: CTPP zones (500)
Home Interview Surveys
Resolution: Very large summary areas
Limitations: Sample bias

Case StudyAuto Travel Times
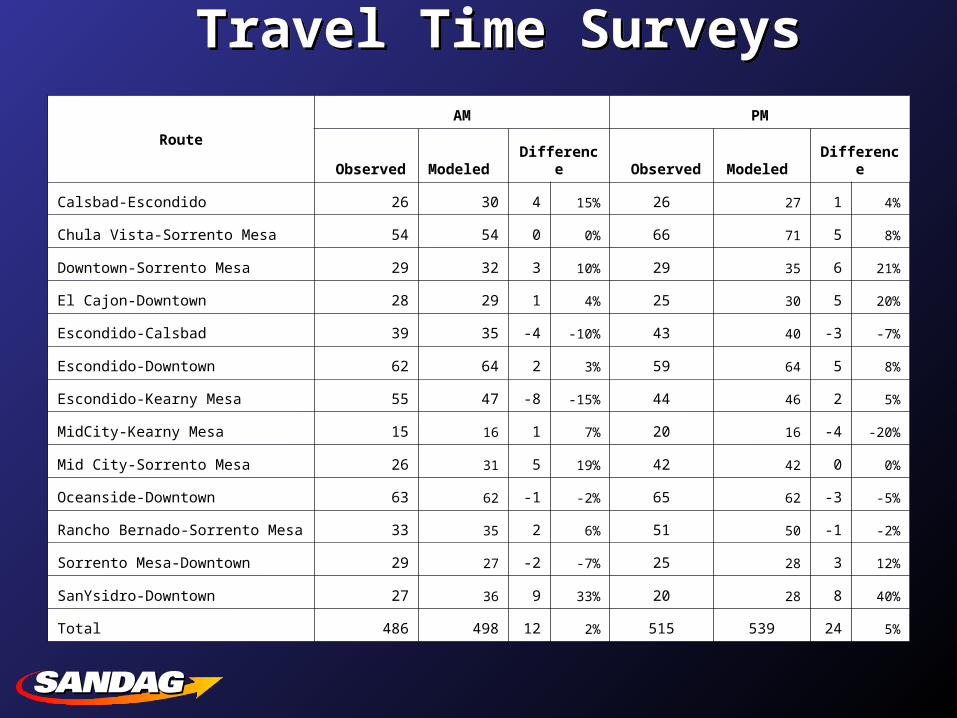
Travel Time SurveysTravel Time Surveys
Route
AM PM
Observed Modeled Difference Observed Modeled Difference
Calsbad-Escondido 26 30 4 15% 26 27 1 4%
Chula Vista-Sorrento Mesa 54 54 0 0% 66 71 5 8%
Downtown-Sorrento Mesa 29 32 3 10% 29 35 6 21%
El Cajon-Downtown 28 29 1 4% 25 30 5 20%
Escondido-Calsbad 39 35 -4 -10% 43 40 -3 -7%
Escondido-Downtown 62 64 2 3% 59 64 5 8%
Escondido-Kearny Mesa 55 47 -8 -15% 44 46 2 5%
MidCity-Kearny Mesa 15 16 1 7% 20 16 -4 -20%
Mid City-Sorrento Mesa 26 31 5 19% 42 42 0 0%
Oceanside-Downtown 63 62 -1 -2% 65 62 -3 -5%
Rancho Bernado-Sorrento Mesa 33 35 2 6% 51 50 -1 -2%
Sorrento Mesa-Downtown 29 27 -2 -7% 25 28 3 12%
SanYsidro-Downtown 27 36 9 33% 20 28 8 40%
Total 486 498 12 2% 515 539 24 5%
California Statewide Travel Survey
• 1,200 San Diego County Households
• 180 Households with GPS-Equipped Vehicles
• 1,000 GPS trips out of 4,700 total survey trips
• February-October 2001
• GeoStats
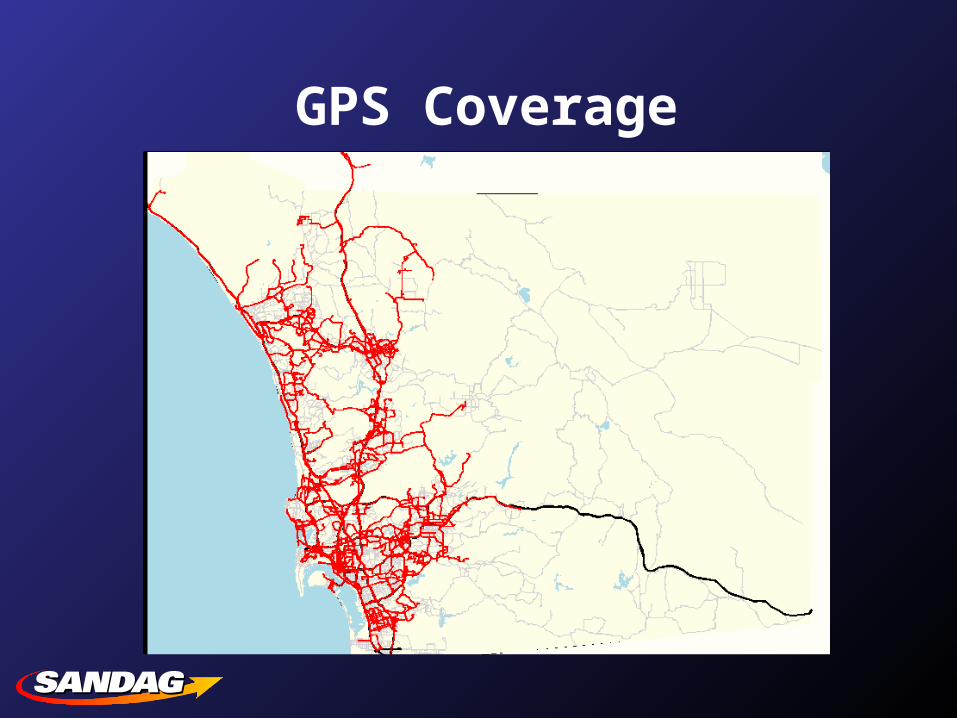
GPS Coverage
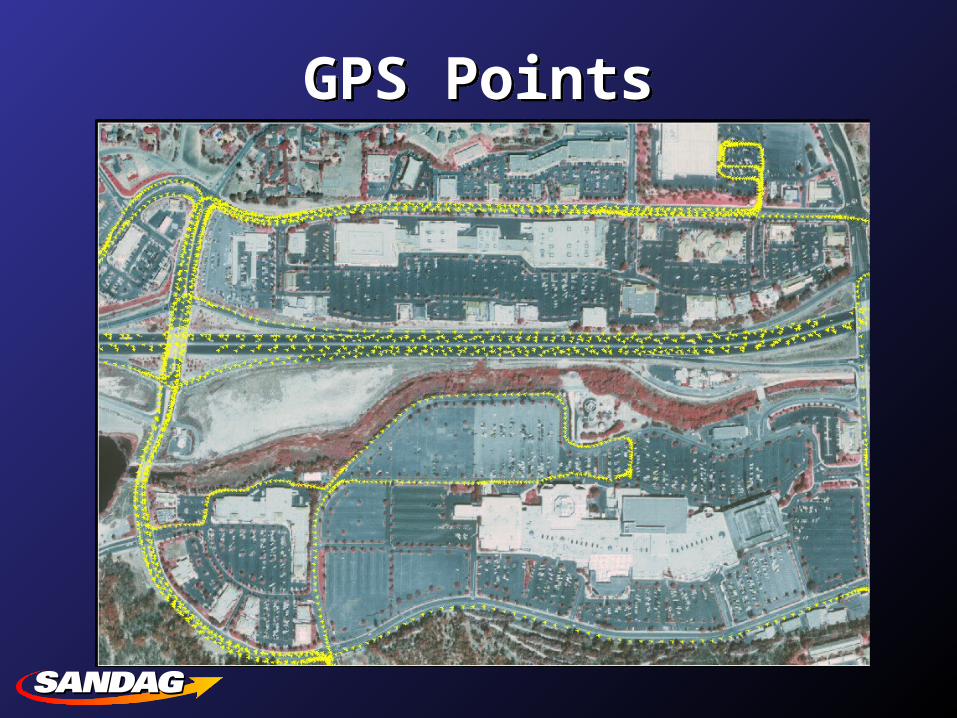
GPS PointsGPS Points
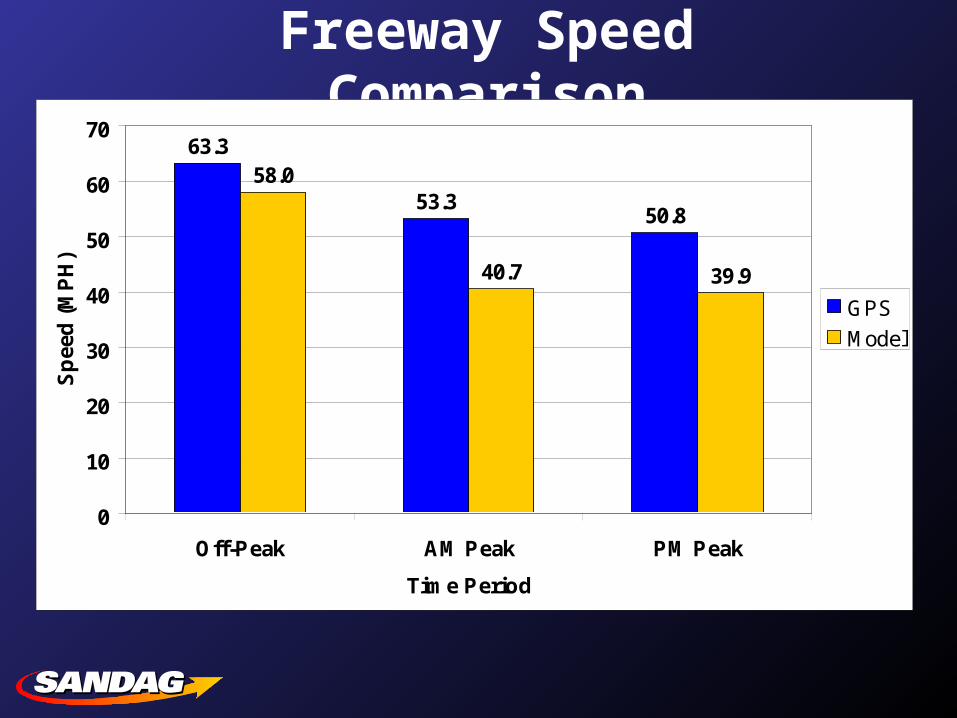
Freeway Speed Comparison63.3
53.350.8
58.0
40.7 39.9
0
10
20
30
40
50
60
70
Off-Peak AM Peak PM Peak
Time Period
Sp
eed
(M
PH
)
GPS
Model
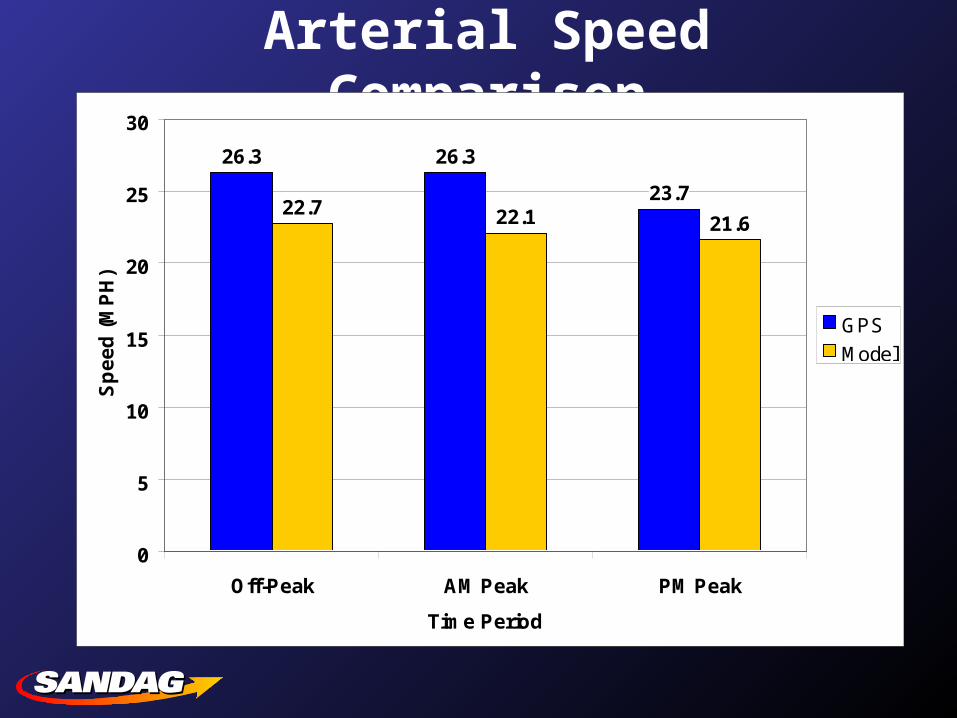
Arterial Speed Comparison
26.3 26.3
23.722.7 22.1 21.6
0
5
10
15
20
25
30
Off-Peak AM Peak PM Peak
Time Period
Sp
ee
d (
MP
H)
GPS
Model
0
5
10
15
20
25
30
35
Minutes Miles Speed
CTPP
Model
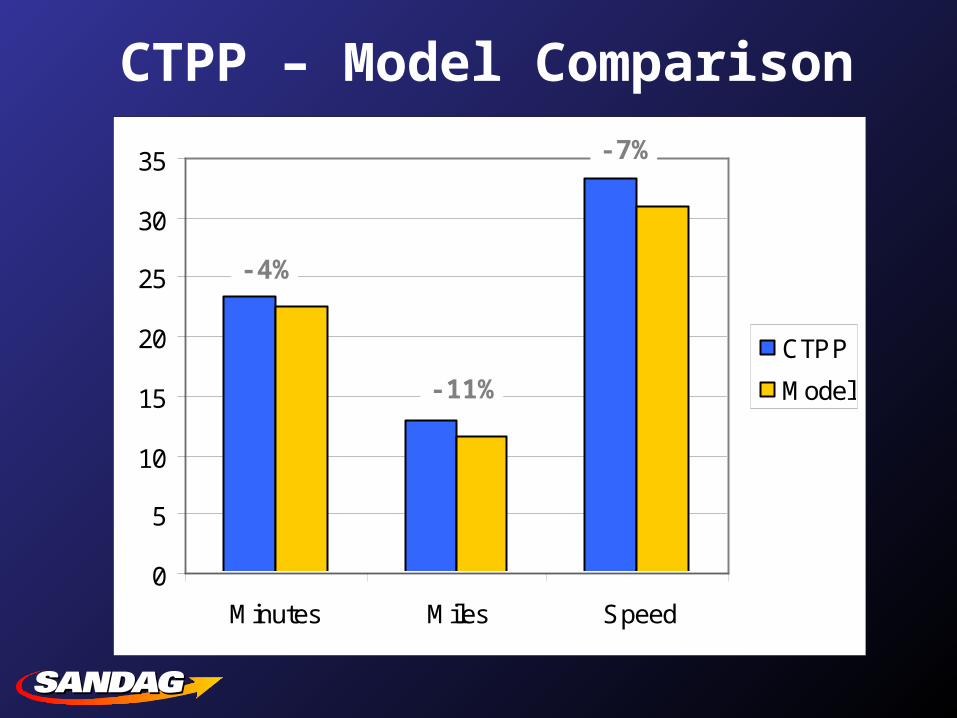
CTPP – Model Comparison
-4%
-11%
-7%
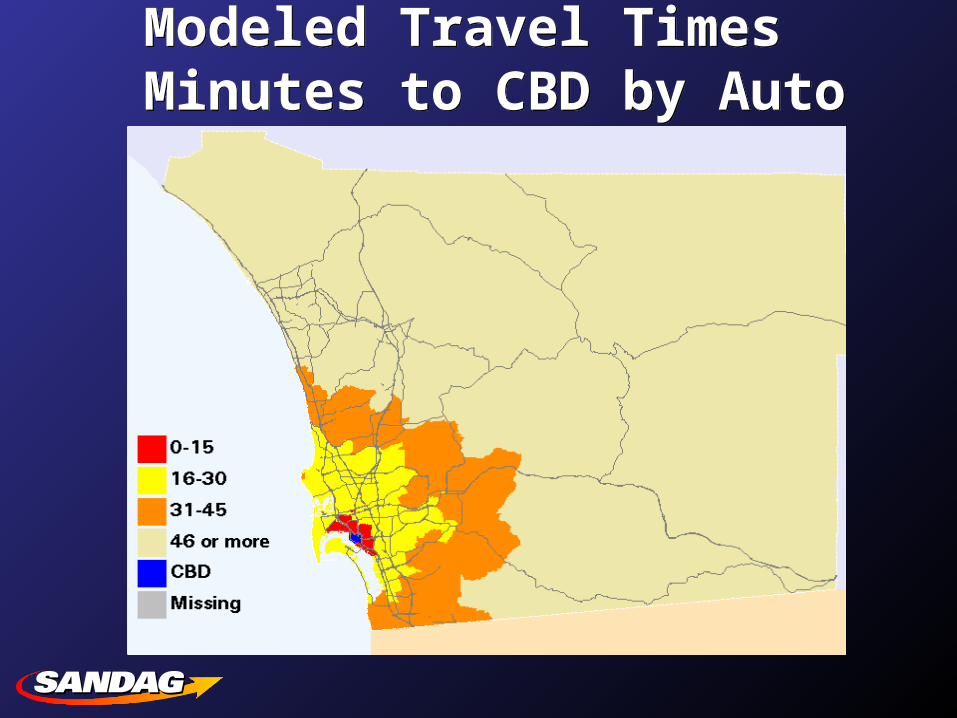
Modeled Travel Times Minutes to CBD by AutoModeled Travel Times
Minutes to CBD by Auto
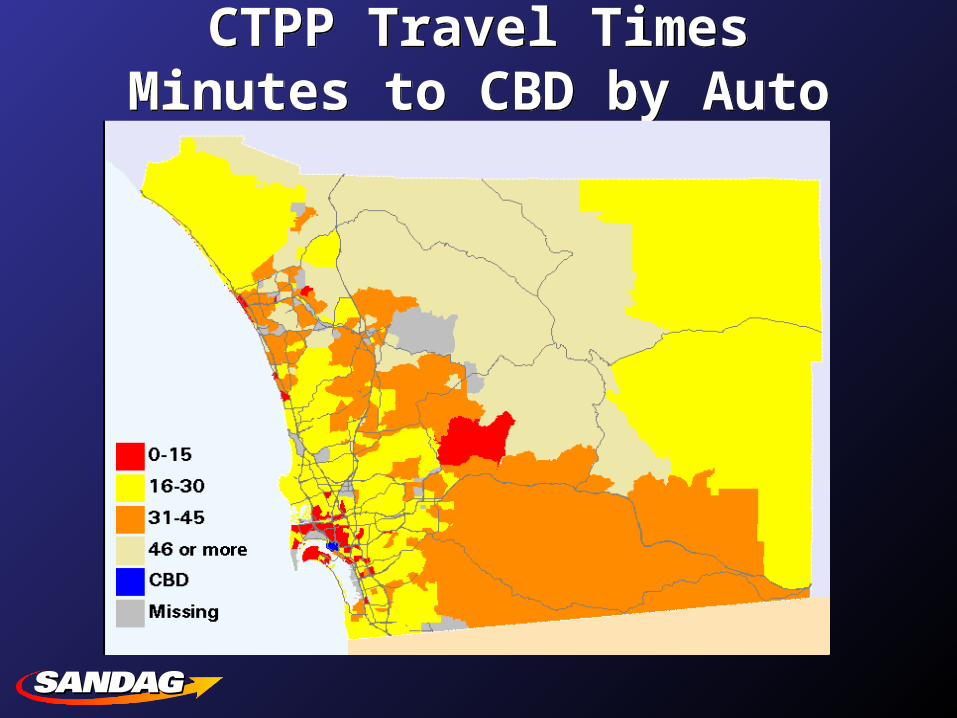
CTPP Travel TimesMinutes to CBD by Auto
CTPP Travel TimesMinutes to CBD by Auto
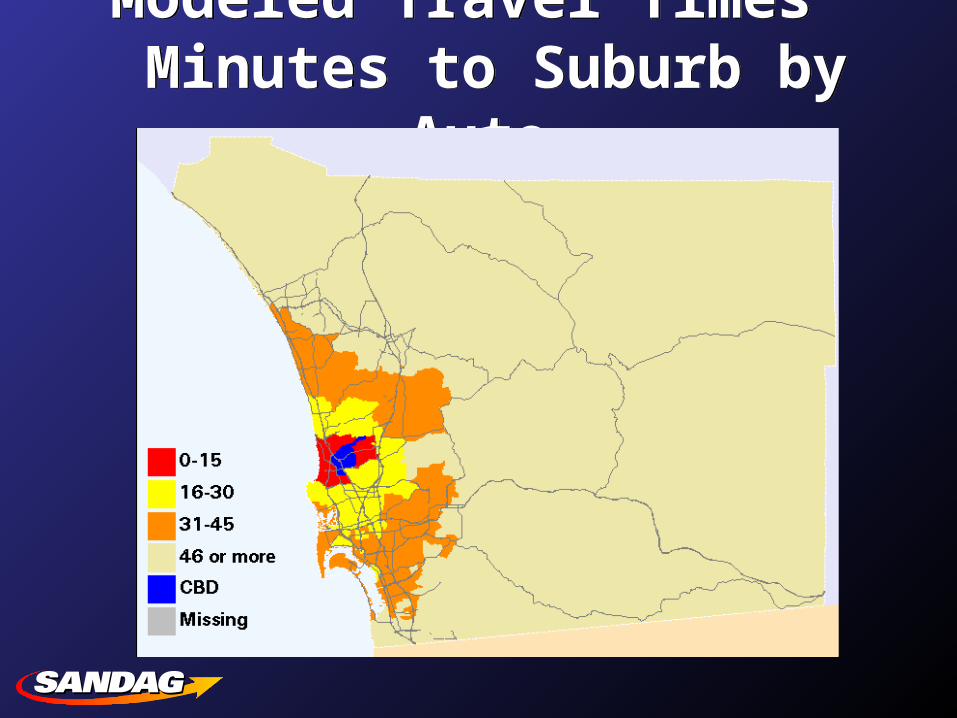
Modeled Travel Times Minutes to Suburb by Auto
Modeled Travel Times Minutes to Suburb by Auto

CTPP Travel TimesMinutes to Suburb by Auto
CTPP Travel TimesMinutes to Suburb by Auto

Supplementing Census DataSANDAG Case Study
Supplementing Census DataSANDAG Case Study