Embed Size (px)
Citation preview
CybertoryTM
Virtual Molecular BiologyLaboratory Manual
Sickle Cell Anemia:A Molecular Disease
Robert M. Horton, Ph.D.Director of Research
Attotron Biosensor [email protected]
© 1999 Attotron Biosensor CorporationAll rights reserved. This document is intended for use by registered beta testers of the Cybertory softwareand their students, and may not be distributed for any other purpose without the express consent of the
copyright holder.
www.attotron.com
Table of ContentsLesson 1: Macromolecular Structures: Hemoglobin and DNA-------------- 3
• Learning objectives-------------------------------------------------------------------------------3• Background----------------------------------------------------------------------------------------- 3• Table 1-1: Types of normal hemoglobin---------------------------------------------------- 3• Figure 1-1:Allosteric effects on the oxygen affinity of hemoglobin------------------- 4• Immaterials------------------------------------------------------------------------------------------5• Procedure------------------------------------------------------------------------------------------- 5
Lesson 2: Gel Electrophoresis and Restriction Enzyme Analysis-----------6• Learning objectives-------------------------------------------------------------------------------6• Background----------------------------------------------------------------------------------------- 6
• Restriction endonucleases-------------------------------------------------------------6• Electrophoresis--------------------------------------------------------------------------- 8
• Immaterials------------------------------------------------------------------------------------------9• Procedure------------------------------------------------------------------------------------------- 9• Using the micropipettor------------------------------------------------------------------------ 10• Table 2-1: DNA tube assignments---------------------------------------------------------- 10• Table 2-2: Molecular size standard---------------------------------------------------------11• Table 2-3: Band migration distances-------------------------------------------------------12• Table 2-4: Semilog plot------------------------------------------------------------------------ 12• Table 2-5: Observed band sizes-------------------------------------------------------------13
Lesson 3: DNA Sequencing-------------------------------------------------------1 4• Learning objectives----------------------------------------------------------------------------- 14• Background--------------------------------------------------------------------------------------- 14• Immaterials---------------------------------------------------------------------------------------- 16• Procedure------------------------------------------------------------------------------------------17• Table 3-1: Sequence data-------------------------------------------------------------------- 18
Lesson 4: Sequence Analysis---------------------------------------------------- 1 9• Learning objectives----------------------------------------------------------------------------- 19• Background--------------------------------------------------------------------------------------- 19• Table 4-1: The genetic code------------------------------------------------------------------20• Immaterials---------------------------------------------------------------------------------------- 20• Procedure------------------------------------------------------------------------------------------21• Table 4-2: Expected band sizes for restriction digestion------------------------------21
Lesson 5: Polymerase Chain Reaction----------------------------------------- 2 3• Learning objectives----------------------------------------------------------------------------- 23• Background--------------------------------------------------------------------------------------- 23• Figure 5-1: Products of defined length accumulate exponentially during PCR-24• Immaterials---------------------------------------------------------------------------------------- 25• Procedure------------------------------------------------------------------------------------------25
Lesson 6: Genotypic Diagnosis-------------------------------------------------- 2 6• Learning objectives----------------------------------------------------------------------------- 26• Background--------------------------------------------------------------------------------------- 26• Procedure------------------------------------------------------------------------------------------26
CybertoryTM Laboratory Manual Sickle Cell Anemia
2
Lesson 1: Macromolecular Structures: Hemoglobin and DNA
Learning Objectives:Review concepts of protein structure:
• primary (1o)• secondary (2o)• tertiary (3o)• quaternary (4o)
Understand basic structure/function relationships in hemoglobin.Understand the basic structural/functional defect in Hemoglobin S.Review DNA structure: DNA strands are
• complementary• antiparallel
Gain familiarity with 3-dimensional molecular visualization software.
BackgroundHemoglobin is a tetrameric protein, which means it consists of four subunits, each of which is a polypeptide chain. The predominant adult hemoglobin, Hemoglobin A, contains the two α and two β subunits.
Table 1-1. Types of normal hemoglobin
Type of hemoglobin where it is found subunitsmyoglobin muscle onehemoglobin A predominant adult hemoglobin α2β2hemoglobin A2 minor adult hemoglobin α2δ2hemoglobin F f e t a l α2γ2hemoglobin E embryonic α2ε2
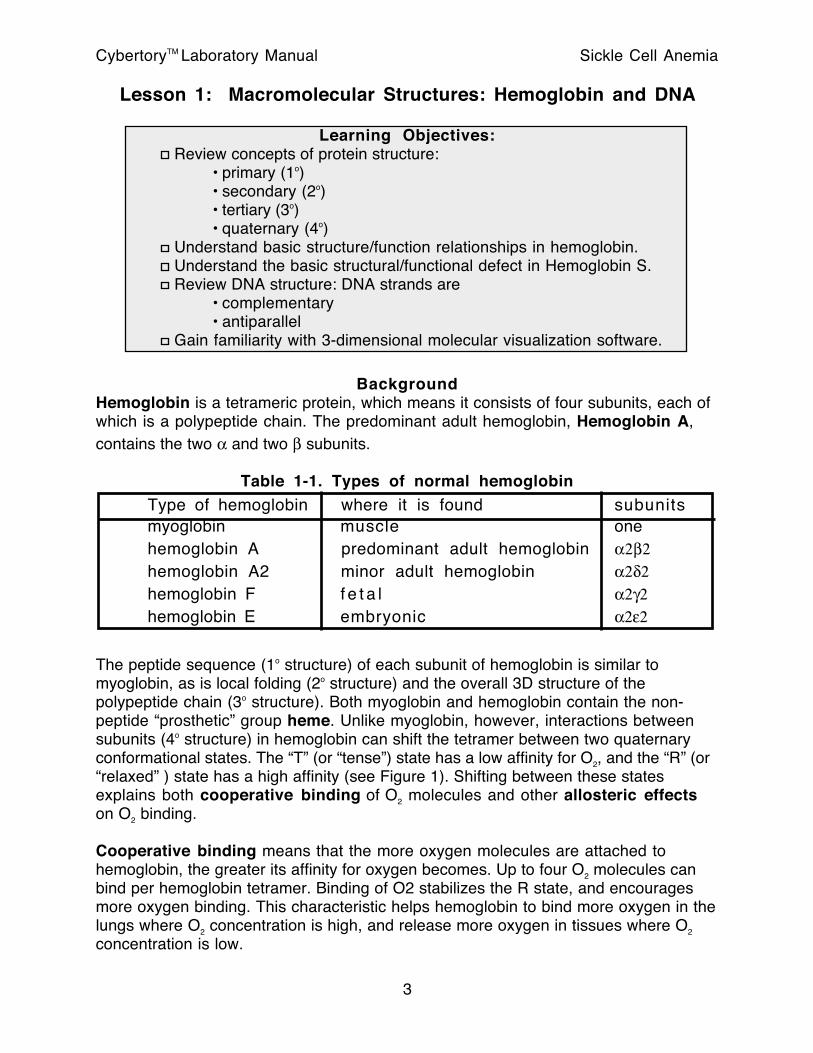
The peptide sequence (1o structure) of each subunit of hemoglobin is similar to myoglobin, as is local folding (2o structure) and the overall 3D structure of the polypeptide chain (3o structure). Both myoglobin and hemoglobin contain the non-peptide “prosthetic” group heme. Unlike myoglobin, however, interactions between subunits (4o structure) in hemoglobin can shift the tetramer between two quaternary conformational states. The “T” (or “tense”) state has a low affinity for O2, and the “R” (or “relaxed” ) state has a high affinity (see Figure 1). Shifting between these states explains both cooperative binding of O2 molecules and other allosteric effects on O2 binding.
Cooperative binding means that the more oxygen molecules are attached to hemoglobin, the greater its affinity for oxygen becomes. Up to four O2 molecules can bind per hemoglobin tetramer. Binding of O2 stabilizes the R state, and encourages more oxygen binding. This characteristic helps hemoglobin to bind more oxygen in the lungs where O2 concentration is high, and release more oxygen in tissues where O2 concentration is low.
CybertoryTM Laboratory Manual Sickle Cell Anemia
3
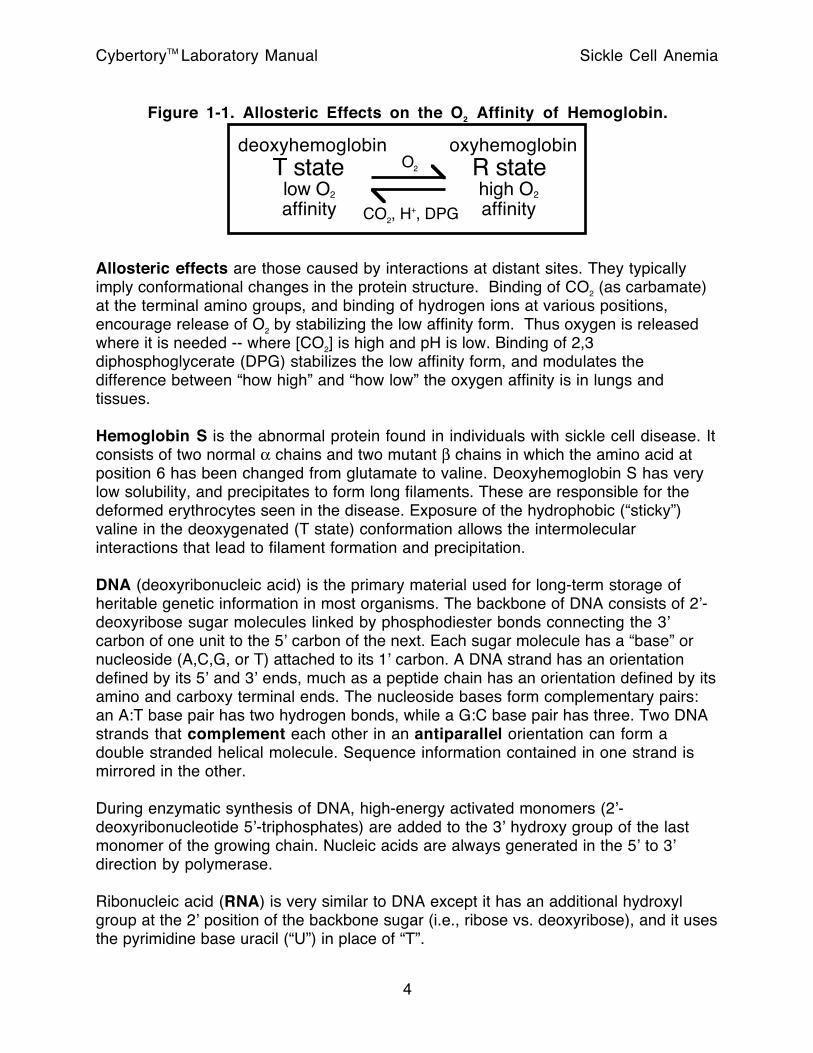
Figure 1-1. Allosteric Effects on the O2 Affinity of Hemoglobin.
T statelow O2
affinity
R statehigh O2
affinity
O2
CO2, H+, DPG
deoxyhemoglobin oxyhemoglobin
Allosteric effects are those caused by interactions at distant sites. They typically imply conformational changes in the protein structure. Binding of CO2 (as carbamate) at the terminal amino groups, and binding of hydrogen ions at various positions, encourage release of O2 by stabilizing the low affinity form. Thus oxygen is released where it is needed -- where [CO2] is high and pH is low. Binding of 2,3 diphosphoglycerate (DPG) stabilizes the low affinity form, and modulates the difference between “how high” and “how low” the oxygen affinity is in lungs and tissues.
Hemoglobin S is the abnormal protein found in individuals with sickle cell disease. It consists of two normal α chains and two mutant β chains in which the amino acid at position 6 has been changed from glutamate to valine. Deoxyhemoglobin S has very low solubility, and precipitates to form long filaments. These are responsible for the deformed erythrocytes seen in the disease. Exposure of the hydrophobic (“sticky”) valine in the deoxygenated (T state) conformation allows the intermolecular interactions that lead to filament formation and precipitation.
DNA (deoxyribonucleic acid) is the primary material used for long-term storage of heritable genetic information in most organisms. The backbone of DNA consists of 2’-deoxyribose sugar molecules linked by phosphodiester bonds connecting the 3’ carbon of one unit to the 5’ carbon of the next. Each sugar molecule has a “base” or nucleoside (A,C,G, or T) attached to its 1’ carbon. A DNA strand has an orientation defined by its 5’ and 3’ ends, much as a peptide chain has an orientation defined by its amino and carboxy terminal ends. The nucleoside bases form complementary pairs: an A:T base pair has two hydrogen bonds, while a G:C base pair has three. Two DNA strands that complement each other in an antiparallel orientation can form a double stranded helical molecule. Sequence information contained in one strand is mirrored in the other.
During enzymatic synthesis of DNA, high-energy activated monomers (2’-deoxyribonucleotide 5’-triphosphates) are added to the 3’ hydroxy group of the last monomer of the growing chain. Nucleic acids are always generated in the 5’ to 3’ direction by polymerase.
Ribonucleic acid (RNA) is very similar to DNA except it has an additional hydroxyl group at the 2’ position of the backbone sugar (i.e., ribose vs. deoxyribose), and it uses the pyrimidine base uracil (“U”) in place of “T”.
CybertoryTM Laboratory Manual Sickle Cell Anemia
4
By convention, DNA and RNA sequences are written with the 5’ end at the left. If the sequences of both strands are shown, the top strand has its 5’ end at the left, and the bottom strand has its 5’ end at the right. If sequences are written in any other orientation the 5’ and 3’ ends must be labeled.
Protein sequences are written with the amino (N) terminus at the left and the carboxy (C) terminus at the right.
ImmaterialsAll of the software used for this lesson is freely available on the Internet.
• NetscapeTM Navigator browser version 4 or higher: http://www.netscape.com• The ChimeTM Molecular viewer plug-in: http://www.mdli.com/download/chimedown.html
• DNA structure tutorial - by Prof. E. Martz, University of Massachusetts Amherst http://www.umass.edu/microbio/chime/dna/index.htm
• Hemoglobin structure tutorial - by Prof. E. Martz http://www.umass.edu/microbio/chime/hemoglob/2frmcont.htm
• Download UMass Chime tutorials (registration page) - http://www.umass.edu/microbio/chime/regisfrm/index.htm
ProcedureI. Open the hemoglobin structure tutorial from within the Netscape browser.II. Click the link labeled “Hemoglobin & Heme”
A. Click the X-labeled buttons in the right hand frame to view particular aspects of the structure.
III. Use the mouse to control the view of the molecule.A. Drag the molecule around to see different angles B. Hold down the shift key and drag the mouse up and down to zoom.C. Click the right mouse button (Windows) or click and hold (Mac) to pop up
the Chime menu. Try various choices:1. “Options : Stereo Display” Try to see the molecule in 3D as you
move it.IV. Click “Back”, then click “Hemoglobin Secondary Structure”
A. View the overall tertiary structure of this hemoglobin β subunit in both backbone and cartoon views.
B. Look at the rainbow coloring scheme and note that the protein portion is a single chain with amino and carboxy termini.
C. Examine the isolated alpha helix and the hydrogen bonds that stabilize this secondary structure.
V. Click “Back”, then click the “Sickle Hemoglobin” linkA. View the mutated amino acid (valine) at position 6 of the β chain.B. Look at the structure of two aggregated hemoglobin S molecules. (Note
that this is not necessarily the same structure formed in the red blood cell, but it shows the general idea.)
CybertoryTM Laboratory Manual Sickle Cell Anemia
5
Lesson 2: Gel Electrophoresis and Restriction Enzyme Analysis
Learning Objectives:Understand how restriction endonucleases are used to cut DNA molecules into fragments.Be able to choose appropriate restriction enzymes for restriction analysis.Understand how DNA molecules are separated by size during agarose gel electrophoresis.Understand how Restriction Fragment Length Polymorphisms (RFLPs) are used to identify DNA sequences.Learn to use the virtual laboratory to set up restriction digestions and run gels.Be able to determine the sizes of DNA fragments from their electrophoretic mobilities.
Background
Restriction endonucleases
A nuclease is an enzyme that breaks the phosphodiester bonds in nucleic acid strands. Ribonuclease (or RNase) breaks down RNA, and deoxyribonuclease (or DNase) breaks DNA. An exonuclease starts at one end of the strand; some enzymes are specifically 5’ exonucleases, and some are 3’ exonucleases. An endonuclease breaks bonds within a strand.
A restriction endonuclease (RE; often just called a restriction enzyme ) cleaves within a DNA strand at a specific recognition sequence. These enzymes are found naturally in many bacterial strains, where they serve as part of an enzymatic system that “restricts” which DNA molecules are allowed to exist unchallenged in the bacterial cell. Most bacterially derived enzymes, including REs, are named after the bacterium of origin; thus, the restriction enzyme EcoRI derives from Escherichia coli strain RI, HindIII comes from Haemophilus influenzae, etc.
Consider as an example EcoRI, whose recognition sequence is given as:
EcoRI G^AATTC
This is a shorthand way of denoting that this enzyme will recognize a double-stranded DNA sequence like the following (where N could be any base, and the ellipses indicate that the sequence could go on for an arbitrary distance beyond the part shown):
5’-...NNNNNNNNNNGAATTCNNNNNNNNNN...-3’3’-...NNNNNNNNNNCTTAAGNNNNNNNNNN...-5’
CybertoryTM Laboratory Manual Sickle Cell Anemia
6
Digestion with EcoRI will cut each strand to produce:
5’-...NNNNNNNNNNG-3’ 5’-AATTCNNNNNNNNNN...-3’3’-...NNNNNNNNNNCTTAA-5’ 3’-GNNNNNNNNNN...-5’
Here is an example with two restriction sites, one for EcoRI and one for HindIII (A^AGCTT):
5’-...NNNNNAAGCTTNNNNNNNNNNNNNNNNNNNGAATTCNNNNNNNNN...-3’3’-...NNNNNTTCGAANNNNNNNNNNNNNNNNNNNCTTAAGNNNNNNNNN...-3’
Digestion with both EcoRI and HindIII gives the following restriction fragments:
5’-...NNNNNA-3’3’-...NNNNNTTCGA-5’
5’-AGCTTNNNNNNNNNNNNNNNNNNNG-3’ 3’-ANNNNNNNNNNNNNNNNNNNCTTAA-5’
5’-AATTCNNNNNNNNN...-3’ 3’-GNNNNNNNNN...-5’
Again, we have used ellipses to indicate that a strand continues on for an arbitrary distance.
Notice two things. First, even though the size of the original DNA molecule was not specified, we know the size of the second restriction fragment (from the HindIII site to the EcoRI site) exactly. This is important because, as we will soon see, DNA fragments are easily classified by size.
The second thing to notice is that the ends of the molecules produced by our digestion have single-stranded overhangs. These are called “sticky ends” because two DNA fragments with complementary overhangs can anneal together. Sealing the backbones together with the enzyme DNA ligase will bind these fragments into a new molecule. This is what first provided the ability to make recombinant DNA; fragments from different sources (say, human DNA and bacterial DNA) can be joined together in a precise manner if they have compatible sticky ends.
The recognition sequences for many type II restriction enzymes are palindromic; this means they have the same sequence reading left to right on the top strand as they do reading right to left on the bottom strand. One result of this is that any sticky ends resulting from digestion with HindIII are complementary (or “compatible”) with each other. thus, without knowing anything else about a DNA sequence, one can know that, if it contains EcoRI sites, the sticky ends produced by digestion of those sites will be compatible with other EcoRI-cut sticky ends.
CybertoryTM Laboratory Manual Sickle Cell Anemia
7
ElectrophoresisElectrophoresis is a very common method for determining DNA fragment sizes. The phosphate groups of DNA make it an acid; they are highly negatively charged in aqueous solution at neutral pH. When negatively charged DNA molecules are placed in an electric field, they migrate toward the positive electrode. A matrix or gel placed in the path of the migrating DNA molecules can retard the progress of larger molecules, thus making it possible to separate a mixture of DNA fragments by size. The most commonly used substances for producing a matrix for electrophoretic separation are agarose (a gelatinous substance purified from the type of agar used in bacterial culture dishes) and polyacrylamide (a covalently cross-linked synthetic polymer).
Migration through a gel depends on the conformation of the molecules as well as their size. Essentially all linear double-stranded DNA molecules have similar conformation in solution. This means they can be separated by size alone more easily than molecules with more complicated conformations, such as proteins or single stranded nucleic acids. To separate these conformationally complex molecules by size, they must first be “denatured” (e.g. with heat or detergent) to destroy their secondary and tertiary structures. Proteins do not have uniform charge, and are commonly given an artificial charge by treatment with an ionic detergent, such as sodium dodecyl sulfate (SDS) before and during electrophoresis. Such denaturation is not necessary for linear double stranded DNA.
Fragment sizes are determined by comparison to the migration of “marker” fragments of known size. The rate of migration of a DNA fragment through a gel is approximately inversely proportional to the logarithm of the size of the fragment. In real world experiments, a semilog plot of migration distance versus fragment size will be more or less linear over some range of fragment sizes, which makes interpolation from a standard curve straightforward. (In the simulated gel, it is exactly linear for all fragment sizes below the molecular size cutoff programmed for the gel.)
When a mixture of DNA fragments is separated by gel electrophoresis, fragments of similar size migrate at the same speed, forming a band. DNA bands are often visualized by staining with the fluorescent dye ethidium bromide (EtBr); this makes the DNA molecules glow orange under ultraviolet light. Other methods of visualizing DNA bands in a gel may involve enzymatic or radioactive detection. These approaches can give much greater sensitivity than fluorescent staining, and can thus be used with much smaller amounts of DNA.
Restriction digestion of a DNA sample produces a set of fragments that can be separated by size using gel electrophoresis. The sizes of the resultant fragments, and hence the pattern of bands on the gel, depend on the presence and positions of the restriction sites. If two alleles of a given gene differ they are said to be polymorphic; if these differences affect restriction sites, then the restriction fragments produced from the two alleles will be different. Such a difference is called a restriction fragment length polymorphism (RFLP).
CybertoryTM Laboratory Manual Sickle Cell Anemia
8
ImmaterialsSoftware:
• The CybertoryTM Virtual Molecular Biology Teaching Laboratory is available at http://www.attotron.com
Virtual supplies:• restriction enzyme Bsu36I (order from BobCoTM, see below)• genetic diagnosis kit containing the following DNA samples (also ordered from
BobCoTM ):• homozygous sickle cell DNA• homozygous normal β globin DNA• four patient samples to be genotyped
• molecular weight marker (free from BobCoTM))• 10X universal restriction enzyme buffer (free from BobCoTM))• water• micropipettor• yellow pipet tips, 0-100 µl• agarose• 0.5X TBE (Tris/Borate/EDTA) electrophoresis buffer• ethidium bromide• gel loading dye
Virtual equipment:• Horizontal agarose gel apparatus• Ultraviolet transilluminator• UV shield and UV resistant safety goggles• DC power supply (~50-500V)
ProcedureRestriction Digestion
Open the file “start.htm” inside a Netscape window.Click “Start SVGA (800 x 600) Kiosk Mode.If no reagents have been ordered on your computer before, you will be asked to place an order with BobCoTM, a Virtual Supply Company.
• Click “OK”.• Note that the BobCoTM catalog contains information about the virtual
reagents, including the sizes of the bands in the molecular size marker and the recognition sequences of various restriction enzymes. You can return to the catalog at any time by choosing “Virtual Catalog” from the “Select Tool” pull-down menu at the upper right of the screen.
• Click the link to go to the “on-line order form.”• When prompted, enter the account password: Laguna• Enter your first and last names and the name of your school. Or your
professional affiliation. Or your favorite football team. Whatever. Do not change the password.
• Choose four restriction enzymes. You will need Bsu36I, which is one of the default choices. Change one of the other enzymes to “DdeI”, which you will need in a later experiment (it pays to plan ahead).
• Under “BobCoTM Certified DNA Samples”, select “Genetic Diagnosis Kit”.
CybertoryTM Laboratory Manual Sickle Cell Anemia
9
• Go to the bottom of the order form and click “Send Order”.• Wait for the window to reload with the new information.
Using the Micropipettor.
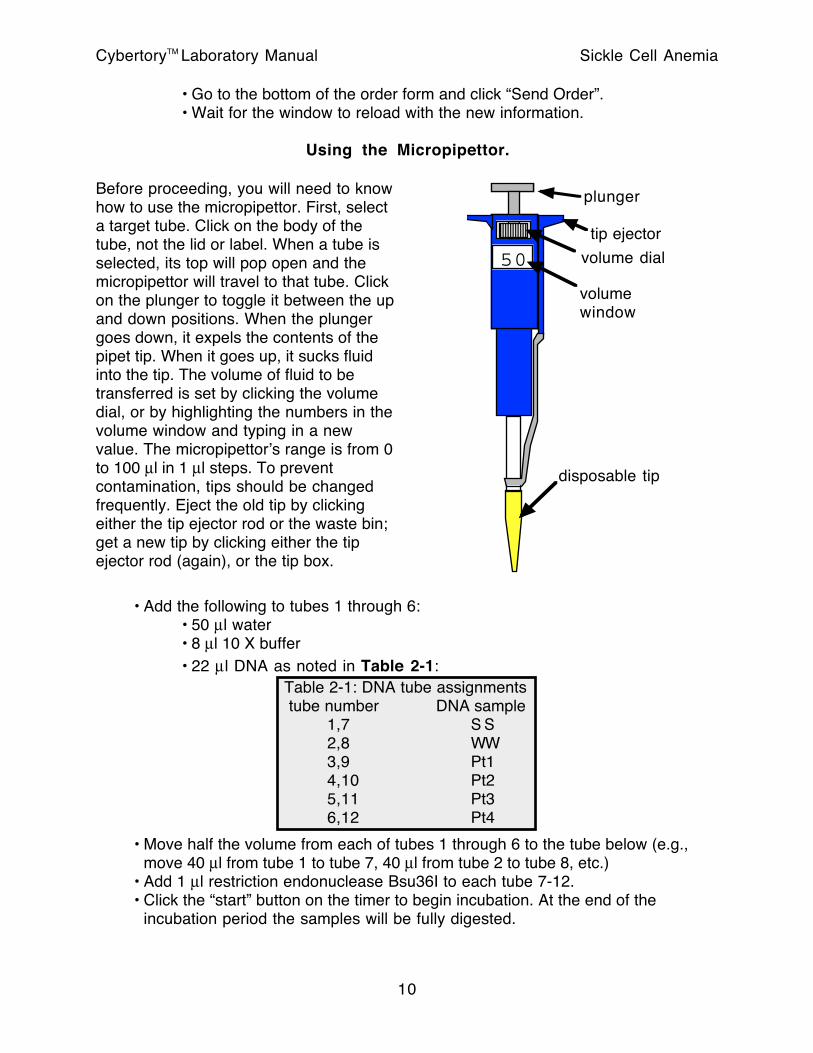
Before proceeding, you will need to know how to use the micropipettor. First, select a target tube. Click on the body of the tube, not the lid or label. When a tube is selected, its top will pop open and the micropipettor will travel to that tube. Click on the plunger to toggle it between the up and down positions. When the plunger goes down, it expels the contents of the pipet tip. When it goes up, it sucks fluid into the tip. The volume of fluid to be transferred is set by clicking the volume dial, or by highlighting the numbers in the volume window and typing in a new value. The micropipettor’s range is from 0 to 100 µl in 1 µl steps. To prevent contamination, tips should be changed frequently. Eject the old tip by clicking either the tip ejector rod or the waste bin; get a new tip by clicking either the tip ejector rod (again), or the tip box.
50
plunger
volume dial
volume window
tip ejector
disposable tip
• Add the following to tubes 1 through 6:• 50 µl water• 8 µl 10 X buffer• 22 µl DNA as noted in Table 2-1:
Table 2-1: DNA tube assignments tube number DNA sample
1,7 S S2,8 WW3,9 Pt14,10 Pt25,11 Pt36,12 Pt4
• Move half the volume from each of tubes 1 through 6 to the tube below (e.g., move 40 µl from tube 1 to tube 7, 40 µl from tube 2 to tube 8, etc.)
• Add 1 µl restriction endonuclease Bsu36I to each tube 7-12.• Click the “start” button on the timer to begin incubation. At the end of the
incubation period the samples will be fully digested.
CybertoryTM Laboratory Manual Sickle Cell Anemia
10
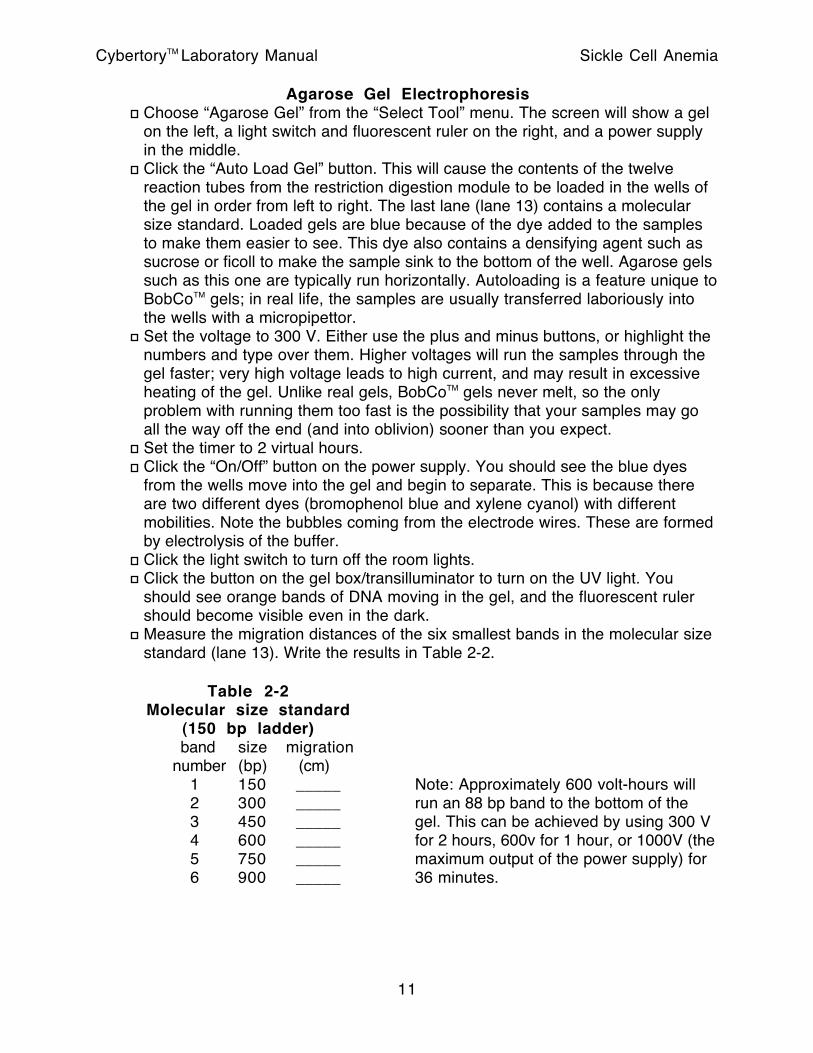
Agarose Gel ElectrophoresisChoose “Agarose Gel” from the “Select Tool” menu. The screen will show a gel on the left, a light switch and fluorescent ruler on the right, and a power supply in the middle.Click the “Auto Load Gel” button. This will cause the contents of the twelve reaction tubes from the restriction digestion module to be loaded in the wells of the gel in order from left to right. The last lane (lane 13) contains a molecular size standard. Loaded gels are blue because of the dye added to the samples to make them easier to see. This dye also contains a densifying agent such as sucrose or ficoll to make the sample sink to the bottom of the well. Agarose gels such as this one are typically run horizontally. Autoloading is a feature unique to BobCoTM gels; in real life, the samples are usually transferred laboriously into the wells with a micropipettor.Set the voltage to 300 V. Either use the plus and minus buttons, or highlight the numbers and type over them. Higher voltages will run the samples through the gel faster; very high voltage leads to high current, and may result in excessive heating of the gel. Unlike real gels, BobCoTM gels never melt, so the only problem with running them too fast is the possibility that your samples may go all the way off the end (and into oblivion) sooner than you expect.Set the timer to 2 virtual hours.Click the “On/Off” button on the power supply. You should see the blue dyes from the wells move into the gel and begin to separate. This is because there are two different dyes (bromophenol blue and xylene cyanol) with different mobilities. Note the bubbles coming from the electrode wires. These are formed by electrolysis of the buffer.Click the light switch to turn off the room lights.Click the button on the gel box/transilluminator to turn on the UV light. You should see orange bands of DNA moving in the gel, and the fluorescent ruler should become visible even in the dark.Measure the migration distances of the six smallest bands in the molecular size standard (lane 13). Write the results in Table 2-2.
Table 2-2Molecular size standard
(150 bp ladder) band size migration number (bp) (cm)
1 150 _____2 300 _____3 450 _____4 600 _____5 750 _____6 900 _____
Note: Approximately 600 volt-hours will run an 88 bp band to the bottom of the gel. This can be achieved by using 300 V for 2 hours, 600v for 1 hour, or 1000V (the maximum output of the power supply) for 36 minutes.
CybertoryTM Laboratory Manual Sickle Cell Anemia
11
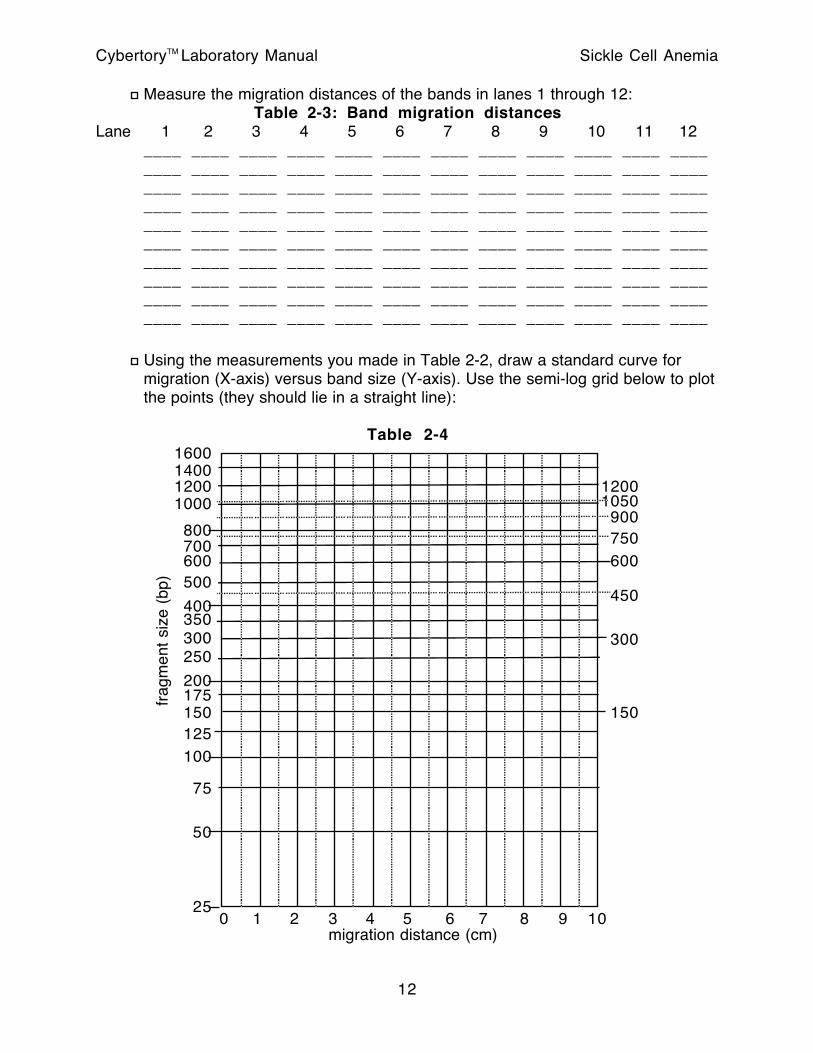
Measure the migration distances of the bands in lanes 1 through 12: Table 2-3: Band migration distances
Lane 1 2 3 4 5 6 7 8 9 10 11 12____ ____ ____ ____ ____ ____ ____ ____ ____ ____ ____ ________ ____ ____ ____ ____ ____ ____ ____ ____ ____ ____ ________ ____ ____ ____ ____ ____ ____ ____ ____ ____ ____ ________ ____ ____ ____ ____ ____ ____ ____ ____ ____ ____ ________ ____ ____ ____ ____ ____ ____ ____ ____ ____ ____ ________ ____ ____ ____ ____ ____ ____ ____ ____ ____ ____ ________ ____ ____ ____ ____ ____ ____ ____ ____ ____ ____ ________ ____ ____ ____ ____ ____ ____ ____ ____ ____ ____ ________ ____ ____ ____ ____ ____ ____ ____ ____ ____ ____ ________ ____ ____ ____ ____ ____ ____ ____ ____ ____ ____ ____
Using the measurements you made in Table 2-2, draw a standard curve for migration (X-axis) versus band size (Y-axis). Use the semi-log grid below to plot the points (they should lie in a straight line):
Table 2-4
0 1 2 3 4 5 6 7 8 9 10migration distance (cm)
frag
men
t si
ze (
bp)
800
400
200
100
50
25
700600500
350300250
150175
125
75
1600
12001000
1400
150
300
450
600750900
10501200
CybertoryTM Laboratory Manual Sickle Cell Anemia
12

Using the standard curve (line, really) in Table 2-4, interpolate the sizes of the bands in lanes 1-12:
Table 2-5: Observed band sizesLane 1 2 3 4 5 6 7 8 9 10 11 12
____ ____ ____ ____ ____ ____ ____ ____ ____ ____ ____ ________ ____ ____ ____ ____ ____ ____ ____ ____ ____ ____ ________ ____ ____ ____ ____ ____ ____ ____ ____ ____ ____ ________ ____ ____ ____ ____ ____ ____ ____ ____ ____ ____ ________ ____ ____ ____ ____ ____ ____ ____ ____ ____ ____ ________ ____ ____ ____ ____ ____ ____ ____ ____ ____ ____ ________ ____ ____ ____ ____ ____ ____ ____ ____ ____ ____ ________ ____ ____ ____ ____ ____ ____ ____ ____ ____ ____ ________ ____ ____ ____ ____ ____ ____ ____ ____ ____ ____ ________ ____ ____ ____ ____ ____ ____ ____ ____ ____ ____ ____
CybertoryTM Laboratory Manual Sickle Cell Anemia
13
Lesson 3: DNA Sequencing
Learning Objectives:Understand the principle of primer extension.Understand the role of synthetic oligonucleotides as primers in directing DNA replication in vitro.Understand the significance of the fact that DNA is synthesized only in the 5’ to 3’ direction by naturally occurring enzymatic systems.Understand the basic principles of Sanger dideoxy chain termination sequencing.Be able to read a sequence from a sequencing gel.Understand the fundamentals of sequencing primer design:
• melting temperature (Tm)• orientation
Background
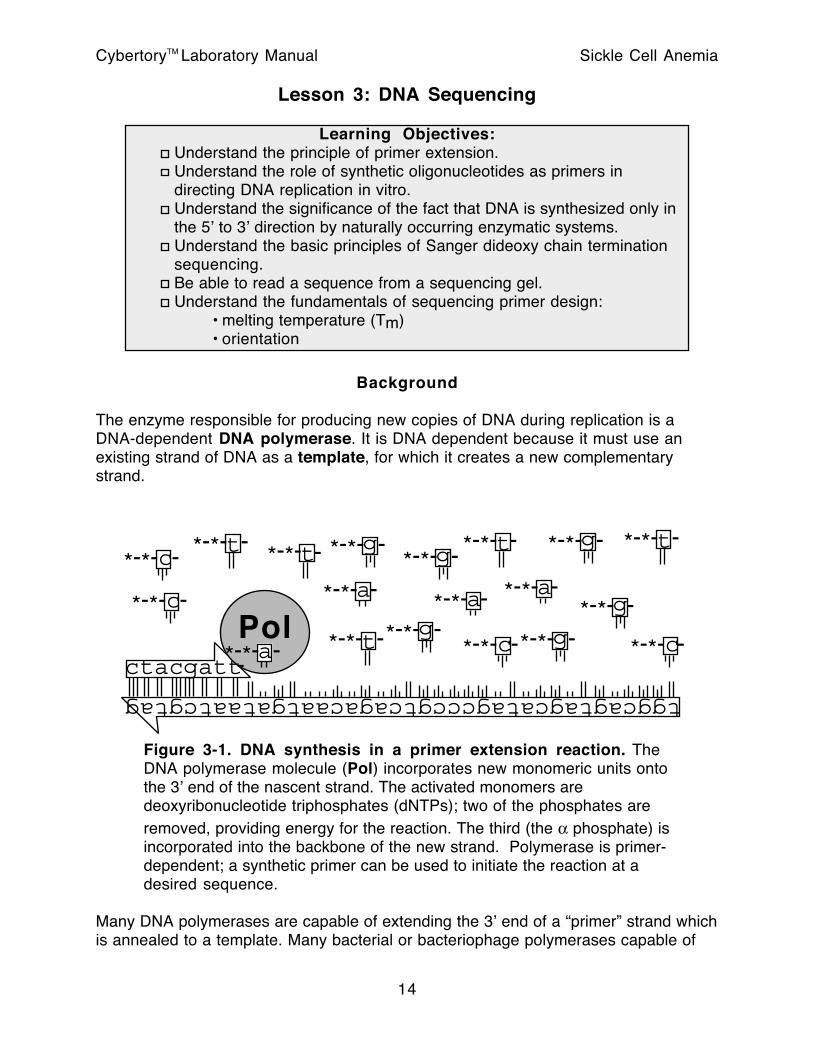
The enzyme responsible for producing new copies of DNA during replication is a DNA-dependent DNA polymerase. It is DNA dependent because it must use an existing strand of DNA as a template, for which it creates a new complementary strand.
Pol
tggcagtagcatagcccgtcagacaatgataatcgtag
ctacgatt
*-*-g*-*-a
*-*-t*-*-t-
*-*-c- *-*-a-*-*-a-
-*-*-c-
--
*-*-t- -*-*-c-*-*-g- *-*-c-
*-*-t-
*-*-g-
*-*-g-*-*-t-*-*-g-
*-*-a-*-*-g-
Figure 3-1. DNA synthesis in a primer extension reaction. The DNA polymerase molecule (Pol) incorporates new monomeric units onto the 3’ end of the nascent strand. The activated monomers are deoxyribonucleotide triphosphates (dNTPs); two of the phosphates are removed, providing energy for the reaction. The third (the α phosphate) is incorporated into the backbone of the new strand. Polymerase is primer-dependent; a synthetic primer can be used to initiate the reaction at a desired sequence.
Many DNA polymerases are capable of extending the 3’ end of a “primer” strand which is annealed to a template. Many bacterial or bacteriophage polymerases capable of
CybertoryTM Laboratory Manual Sickle Cell Anemia
14
carrying out this primer extension reaction are relatively simple proteins consisting of a single amino acid chain. In vivo, much of the enzymatic complexity of DNA replication lies in the process of “priming” DNA synthesis. The process can be greatly simplified in vitro by providing a pre-synthesized primer. Note that enough of the template sequence must be known to design the sequencing primer.
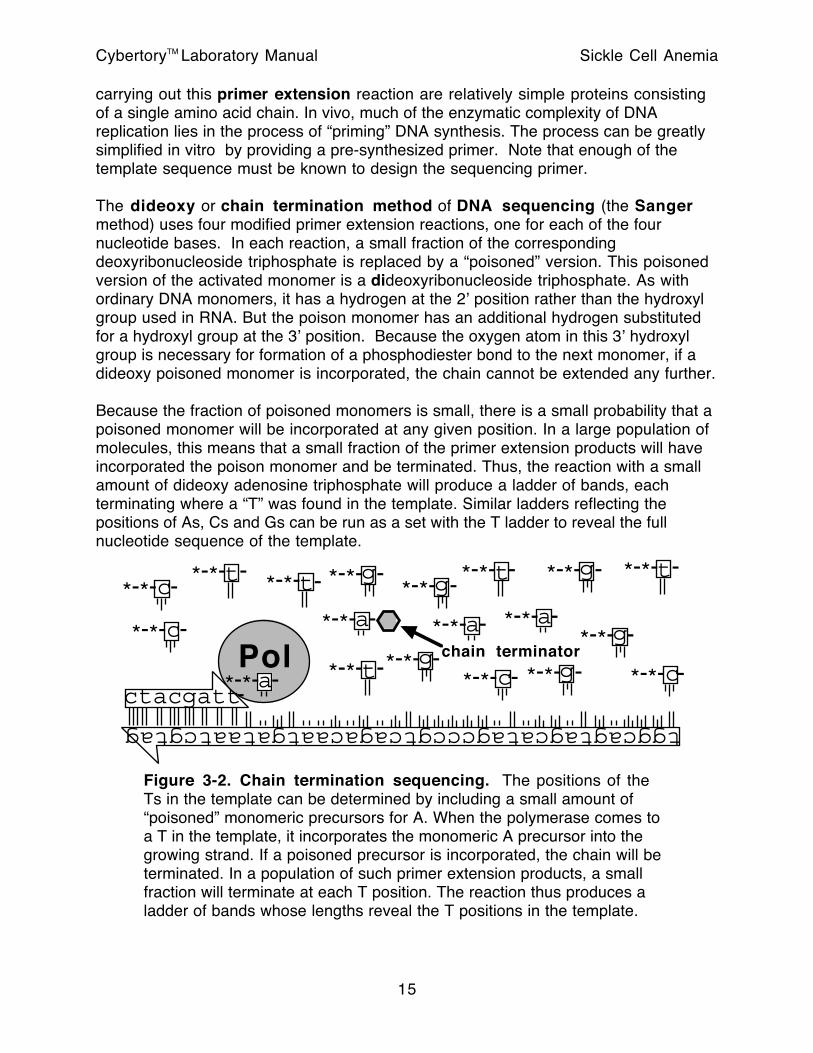
The dideoxy or chain termination method of DNA sequencing (the Sanger method) uses four modified primer extension reactions, one for each of the four nucleotide bases. In each reaction, a small fraction of the corresponding deoxyribonucleoside triphosphate is replaced by a “poisoned” version. This poisoned version of the activated monomer is a dideoxyribonucleoside triphosphate. As with ordinary DNA monomers, it has a hydrogen at the 2’ position rather than the hydroxyl group used in RNA. But the poison monomer has an additional hydrogen substituted for a hydroxyl group at the 3’ position. Because the oxygen atom in this 3’ hydroxyl group is necessary for formation of a phosphodiester bond to the next monomer, if a dideoxy poisoned monomer is incorporated, the chain cannot be extended any further.
Because the fraction of poisoned monomers is small, there is a small probability that a poisoned monomer will be incorporated at any given position. In a large population of molecules, this means that a small fraction of the primer extension products will have incorporated the poison monomer and be terminated. Thus, the reaction with a small amount of dideoxy adenosine triphosphate will produce a ladder of bands, each terminating where a “T” was found in the template. Similar ladders reflecting the positions of As, Cs and Gs can be run as a set with the T ladder to reveal the full nucleotide sequence of the template.
Pol
tggcagtagcatagcccgtcagacaatgataatcgtag
ctacgatt
*-*-g*-*-a
*-*-t*-*-t-
*-*-c- *-*-a- *-*-a-
-*-*-c-
--
*-*-t- -*-*-c- *-*-g- *-*-c-
*-*-t-
*-*-g-
*-*-g-*-*-t-*-*-g-
*-*-a-*-*-g-
chain terminator
Figure 3-2. Chain termination sequencing. The positions of the Ts in the template can be determined by including a small amount of “poisoned” monomeric precursors for A. When the polymerase comes to a T in the template, it incorporates the monomeric A precursor into the growing strand. If a poisoned precursor is incorporated, the chain will be terminated. In a population of such primer extension products, a small fraction will terminate at each T position. The reaction thus produces a ladder of bands whose lengths reveal the T positions in the template.
CybertoryTM Laboratory Manual Sickle Cell Anemia
15
Automated fluorescent sequencing employs a twist on the Sanger approach; the terminating “poisoned” monomers are color-coded with fluorescent tags, with each base having its own color. All terminations can be done in a single reaction and run in a single lane of a gel. The sequence is determined by measuring the color intensities as the bands pass by a detector.
Note that sequence determination by the Sanger method requires that enough of the template sequence be known to design the sequencing primer in the first place. This is usually not as much of a problem as one might think, because recombinant DNA techniques, such as ligation into a cloning vector, make it possible to attach a segment of known sequence to an unknown sequence.
Because sequencing is done by a modified primer extension, and since primers are extended only at their 3’ ends, a sequencing primer must be oriented with its 3’ end pointing toward the area of interest.
Primers must be long enough to bind to the template under the conditions of the reaction. As a general rule, the “melting temperature” of an oligonucleotide (below which it will bind stably and above which it will fall off the template) can be estimated by counting 2 degrees Celsius for each A:T base pair, and 4 degrees for each G:C pair:
Tm = 2(A+T) + 4(G+C)
This formula (Itakura’s Empirical Rule) generally gives a good first approximation to melting temperatures in the range of about 50oC to 75oC.
Since individual bands in a reaction may differ by only one base, they must be analyzed by a very high resolution method. Agarose gels are not suitable for this purpose; higher resolution is achieved with a polyacrylamide matrix.
Also, note that the products of a sequencing reaction are single-stranded. To make migration rate dependent only on molecular size, the secondary structure of the single-stranded DNA molecules must be removed by denaturation. This is done by using a chaotropic agent like urea, and by running at elevated temperature.
Immaterials• dNTP/ddNTP mixtures for A, C, G,
and T reactions• radiolabel (α32PdATP)• DNA polymerase• Reaction Buffer• primers (custom synthesized)• template DNAs (order from
BobCoTM)
• X-ray film, cassette & developer• sequence gel apparatus• polyacrylamide / bisacrylamide /
TMED• urea (7M final concentration in gel)• 0.5X TBE buffer
CybertoryTM Laboratory Manual Sickle Cell Anemia
16
Procedure
Choose the templates to sequence. The sequencing gel has twelve lanes, so you can run three templates at a time (four reactions are run on each template, one for each ddNTP.)
• The templates will be taken from the reaction tubes which you have worked with for restriction analysis. If you have not restarted the program since that experiment, the DNA will still be in the tubes, and you may proceed. Begin by sequencing the DNA from tubes 1,2, and 3.
• If you have restarted the program since the last experiment, you will need to put DNA in the tubes. Choose “Restriction Enzymes” from the “Select Tool” menu. Pipet samples “SS”, “WW”, and “Pt1-4”into tubes 1-6, in order.
• NOTE: You must be sure to have clean tubes for this reaction. If one of the reaction tubes has had some other sequence in it before, this can mess up the experiment. To get clean tubes, close the CybertoryTM window and reclick the “launch in Kiosk mode” button.
• YOU MUST KEEP THE TEMPLATES FROM BEING CONTAMINATED. Change tips appropriately.
Specify a primer sequence by typing or cutting-and-pasting into the “primer” box. For this experiment, use the following primer sequence:
Primer Hb1.5: ccatggtgcacctgactcct• The BobCoTM catalog has some standard primer sequences that you may
be able to copy.The sequencing reactions will be run for you automatically, and the samples will be loaded on the gel when you press “autoload”.
CautionBe aware that the sequencing samples are radioactive (32P is a β emitter). Use appropriate handling procedures; wear gloves, work behind a Plexiglas shield, do not eat or drink in the lab, dispose of waste appropriately, and monitor constantly for contamination using a Geiger counter.
Read each sequence and record the results in Table 3-1. The order of the lanes in each set of reactions is “A,C,G,T”. Read the sequence up from the bottom. Note any unusual features of the sequences. If any position appears to have bands in more than one lane, make a note of the position and which lanes the bands are in.Repeat the procedure to sequence the samples in tubes 4, 5, and 6. (DNA from Pt2, Pt3, and Pt4). The program may crash unless you reenter the sequencing module before doing another set of reactions; just go to one of the other modules (the sequence analysis modules loads the quickest), then come back to sequencing.
CybertoryTM Laboratory Manual Sickle Cell Anemia
17
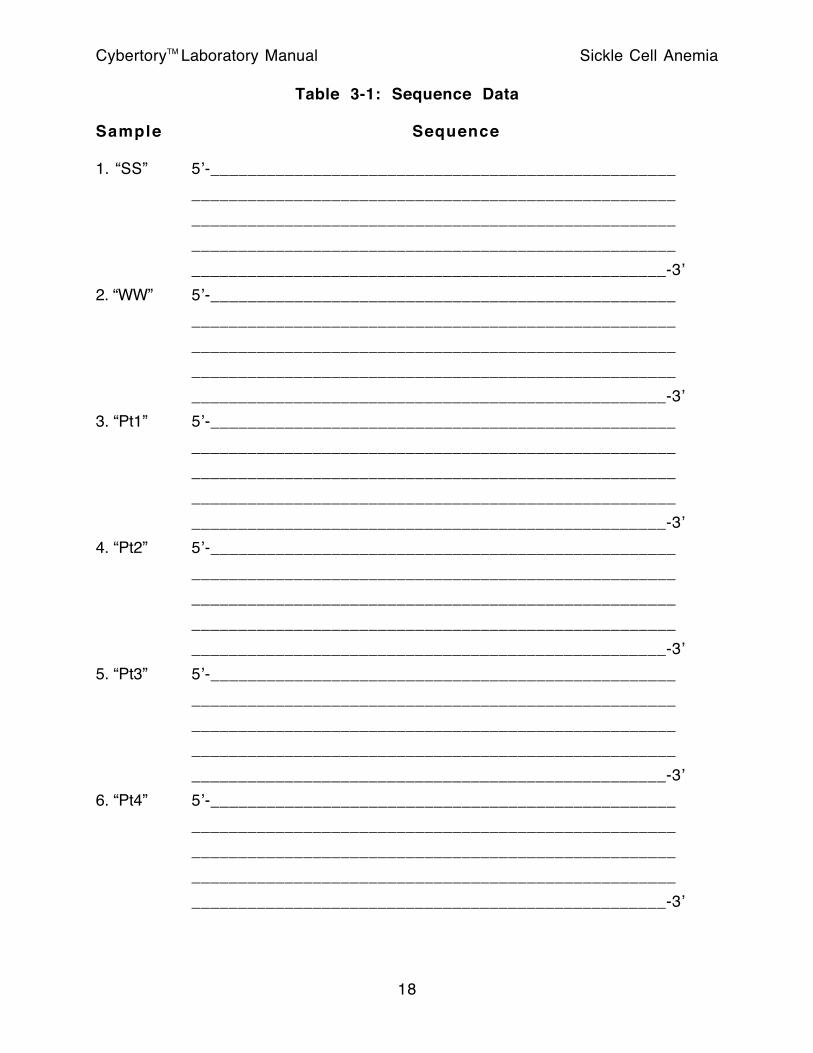
Table 3-1: Sequence Data
Sample Sequence
1. “SS” 5’-__________________________________________________
____________________________________________________
____________________________________________________
____________________________________________________
___________________________________________________-3’
2. “WW” 5’-__________________________________________________
____________________________________________________
____________________________________________________
____________________________________________________
___________________________________________________-3’
3. “Pt1” 5’-__________________________________________________
____________________________________________________
____________________________________________________
____________________________________________________
___________________________________________________-3’
4. “Pt2” 5’-__________________________________________________
____________________________________________________
____________________________________________________
____________________________________________________
___________________________________________________-3’
5. “Pt3” 5’-__________________________________________________
____________________________________________________
____________________________________________________
____________________________________________________
___________________________________________________-3’
6. “Pt4” 5’-__________________________________________________
____________________________________________________
____________________________________________________
____________________________________________________
___________________________________________________-3’
CybertoryTM Laboratory Manual Sickle Cell Anemia
18
Lesson 4: Sequence analysis
•
Learning Objectives:Know the basic structure of a typical protein-coding gene:
• promoter• transcription start site• 5’ untranslated region• translation start site• exons• introns• polyadenylation site
Understand the importance of and the enzymes required for: • DNA replication• transcription• translation• reverse transcription
Understand the importance of the translational reading frame.Be able to use simple software tools for
• translation of genetic sequences to protein• locating restriction sites in a DNA sequence• “reverse translation” - identifying a gene sequence capable of
encoding a given peptide.
Background
DNA replication is a complicated process in vivo. In vitro it is greatly simplified by providing synthetic primers; the only enzyme required for primer extension in vitro is DNA polymerase.
Transcription is the process of copying the information from a DNA sequence into an RNA molecule. This process is catalyzed by RNA polymerase. Unlike DNA polymerase, RNA polymerase is not primer dependent. Transcription begins at specialized DNA sequences called promoters. The actual start site of transcription near or within the promoter region is precisely determined in some genes, while in others transcription may begin at a variety of bases.
In bacteria, messenger RNA is translated almost as soon as it is made. The ribosomes which carry out protein synthesis can be attached to bacterial mRNA even while it is still being transcribed.
In eukaryotes, the transcription and translation processes are divided between the nucleus and the cytoplasm. The mRNAs may be extensively processed before being handed over to the ribosomes. The 3’ end is usually polyadenylated, that is, a string of “A”s is added by a template independent RNA polymerizing enzyme called terminal transferase. Segments of the RNA may be removed entirely, and the remaining pieces hooked back together in a process called splicing. Segments that are removed during
CybertoryTM Laboratory Manual Sickle Cell Anemia
19
splicing are called introns, and the segments retained are called exons. Only sequence information contained in exons can be translated into protein, but even some of the exon sequences are untranslated. Translation usually begins at a methionine codon (ATG) near a ribosome binding site; the portion of the mRNA upstream of this site is called the 5’ untranslated region. Translation ends at a stop codon (TAA, TAG, or TGA in most organisms). The portion of the mRNA downstream of the stop codon is the 3’ untranslated region.
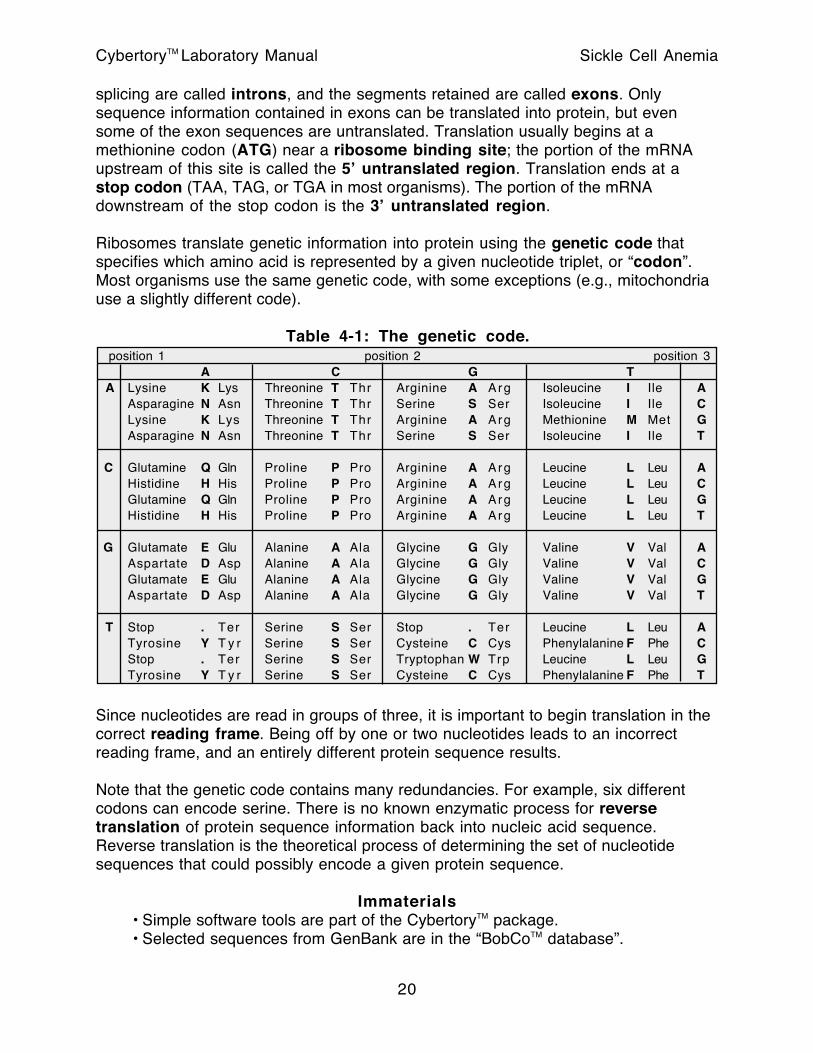
Ribosomes translate genetic information into protein using the genetic code that specifies which amino acid is represented by a given nucleotide triplet, or “codon”. Most organisms use the same genetic code, with some exceptions (e.g., mitochondria use a slightly different code).
Table 4-1: The genetic code. position 1 position 2 position 3
A C G T A Lysine K Lys Threonine T Thr Arginine A Arg Isoleucine I Ile A
Asparagine N Asn Threonine T Thr Serine S Ser Isoleucine I Ile CLysine K Lys Threonine T Thr Arginine A Arg Methionine M Met GAsparagine N Asn Threonine T Thr Serine S Ser Isoleucine I Ile T
C Glutamine Q Gln Proline P Pro Arginine A Arg Leucine L Leu AHistidine H His Proline P Pro Arginine A Arg Leucine L Leu CGlutamine Q Gln Proline P Pro Arginine A Arg Leucine L Leu GHistidine H His Proline P Pro Arginine A Arg Leucine L Leu T
G Glutamate E Glu Alanine A Ala Glycine G Gly Valine V Val AAspartate D Asp Alanine A Ala Glycine G Gly Valine V Val CGlutamate E Glu Alanine A Ala Glycine G Gly Valine V Val GAspartate D Asp Alanine A Ala Glycine G Gly Valine V Val T
T Stop . Ter Serine S Ser Stop . Ter Leucine L Leu ATyrosine Y T y r Serine S Ser Cysteine C Cys Phenylalanine F Phe CStop . Ter Serine S Ser Tryptophan W Trp Leucine L Leu GTyrosine Y T y r Serine S Ser Cysteine C Cys Phenylalanine F Phe T
Since nucleotides are read in groups of three, it is important to begin translation in the correct reading frame. Being off by one or two nucleotides leads to an incorrect reading frame, and an entirely different protein sequence results.
Note that the genetic code contains many redundancies. For example, six different codons can encode serine. There is no known enzymatic process for reverse translation of protein sequence information back into nucleic acid sequence. Reverse translation is the theoretical process of determining the set of nucleotide sequences that could possibly encode a given protein sequence.
Immaterials• Simple software tools are part of the CybertoryTM package.• Selected sequences from GenBank are in the “BobCoTM database”.
CybertoryTM Laboratory Manual Sickle Cell Anemia
20
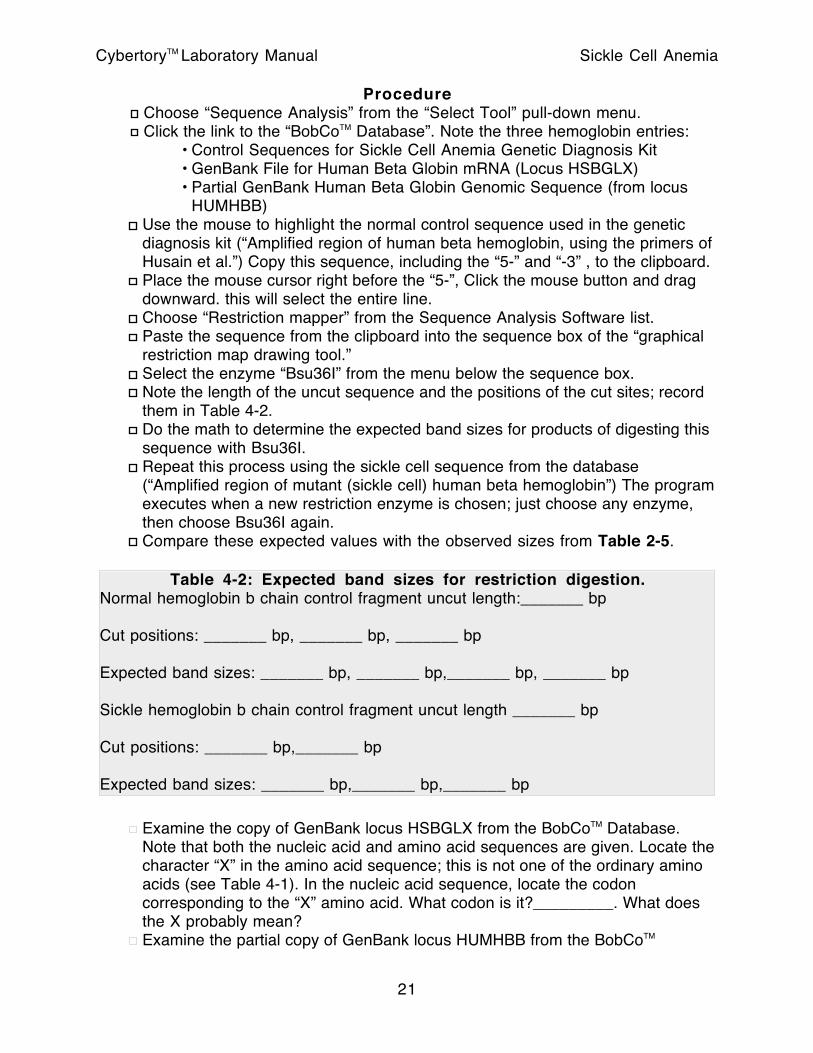
ProcedureChoose “Sequence Analysis” from the “Select Tool” pull-down menu.Click the link to the “BobCoTM Database”. Note the three hemoglobin entries:
• Control Sequences for Sickle Cell Anemia Genetic Diagnosis Kit• GenBank File for Human Beta Globin mRNA (Locus HSBGLX)• Partial GenBank Human Beta Globin Genomic Sequence (from locus
HUMHBB)Use the mouse to highlight the normal control sequence used in the genetic diagnosis kit (“Amplified region of human beta hemoglobin, using the primers of Husain et al.”) Copy this sequence, including the “5-” and “-3” , to the clipboard.Place the mouse cursor right before the “5-”, Click the mouse button and drag downward. this will select the entire line.Choose “Restriction mapper” from the Sequence Analysis Software list.Paste the sequence from the clipboard into the sequence box of the “graphical restriction map drawing tool.”Select the enzyme “Bsu36I” from the menu below the sequence box.Note the length of the uncut sequence and the positions of the cut sites; record them in Table 4-2.Do the math to determine the expected band sizes for products of digesting this sequence with Bsu36I.Repeat this process using the sickle cell sequence from the database (“Amplified region of mutant (sickle cell) human beta hemoglobin”) The program executes when a new restriction enzyme is chosen; just choose any enzyme, then choose Bsu36I again. Compare these expected values with the observed sizes from Table 2-5.
Table 4-2: Expected band sizes for restriction digestion.Normal hemoglobin b chain control fragment uncut length:_______ bp
Cut positions: _______ bp, _______ bp, _______ bp
Expected band sizes: _______ bp, _______ bp,_______ bp, _______ bp
Sickle hemoglobin b chain control fragment uncut length _______ bp
Cut positions: _______ bp,_______ bp
Expected band sizes: _______ bp,_______ bp,_______ bp
Examine the copy of GenBank locus HSBGLX from the BobCoTM Database. Note that both the nucleic acid and amino acid sequences are given. Locate the character “X” in the amino acid sequence; this is not one of the ordinary amino acids (see Table 4-1). In the nucleic acid sequence, locate the codon corresponding to the “X” amino acid. What codon is it?_________. What does the X probably mean?Examine the partial copy of GenBank locus HUMHBB from the BobCoTM
CybertoryTM Laboratory Manual Sickle Cell Anemia
21
Database. The line beginning with “CDS” gives the base positions of the exons contributing to the coding sequence. Write these numbers down.Copy the sequence given into a text processor. Edit it so that it only contains the coding region. Copy this region to the clipboard. Don’t worry about removing the numbers, line breaks, or spaces.
HINT: Use a text processor file to save the sequences that you are working with to disk periodically, so you can pick up where you left off if something goes wrong.
Open the “Sequence Massager” tool. Paste the edited coding sequence into the box.Click “remove numbers”, “remove white space”, and “remove line breaks.”Click “show triplets” to check your work. A complete reading frame should have a whole number of triplets. Click “remove white space.” This sequence is the beta globin coding sequence. Save it is a text processor file for later use. (While you’re here, note that the Sequence Massager can “reverse” and “complement” a sequence. This will come in handy for PCR primer design.)Select the massaged beta globin coding sequence and copy it o the clipboard. Close the Sequence Massager window.Select the “Protein Translator” link from the Sequence Analysis software tools page. Paste the massages hemoglobin sequence into the “DNA sequence” box.Click the “translate” button to convert the DNA sequence to an RNA sequence (in which the “T”s are replaced by “U”s).Click the “translate” button to generate the amino acid sequence. Compare this sequence to that given in the GenBank locus HUMHBB file. Compare it to that in GenBank locus HSBGLX. Notice any significant differences? Any errors? HINT: the comments in HSBGLX say nothing about sickle cell beta globin.
Copy the DNA version of the beta globin coding sequence to the clipboard. Click “Sequence Pattern Finder” from the Sequence Analysis Software page.Paste the beta globin coding sequence into the “Target Sequence” box.Type the sequence “PEEK” (not including the quotes) into the “peptide sequence” box. This represents “Proline-Glutamate-Glutamate-Lysine” (see Table 4-1.) The first glutamate residue is the one changed to valine in sickle cell anemia.Click the “reverse translate” button. This generates an ambiguous RNA sequence. Letters besides a,c,g, and u represent sets of nucleotides. for example, “n” represents any base, while “r” represents “a or g” (purines).Click “disambiguate” to replace each ambiguous code with a set of bases it represents (set off in square brackets.) Note that this is an RNA sequence; click “RNA->DNA” to to convert the “u”s to “t”s before searching the beta globin DNA sequence for a match.The “list matches”, “list offsets” and “highlight patterns” buttons provide different ways to show a match between the pattern and the target sequence.
Go to the bottom of the BobCoTM Database page. Click the link to the “Full GenBank Entry”. Scroll through it to get an idea of the kinds and quantity of data that can be found in GenBank.
CybertoryTM Laboratory Manual Sickle Cell Anemia
22
Lesson 5: Polymerase Chain Reaction
Learning Objectives:Understand how the Polymerase Chain Reaction (PCR) is used to
• amplify DNA.• generate a DNA fragment of defined size.
Know the fundamental principles of PCR primer design:• annealing temperature• importance of matches at the 3’ end• sequence and orientation• avoid “primer-dimer” artifacts• choose a sequence unique to desired target
Design primers to perform simulated PCR experiments.
BackgroundThe Polymerase Chain Reaction (PCR) is a technique for in vitro amplification of DNA sequences. It is important to understand that this process results in a product of fixed size, which means that PCR products can be visualized (and isolated) as bands on a gel.
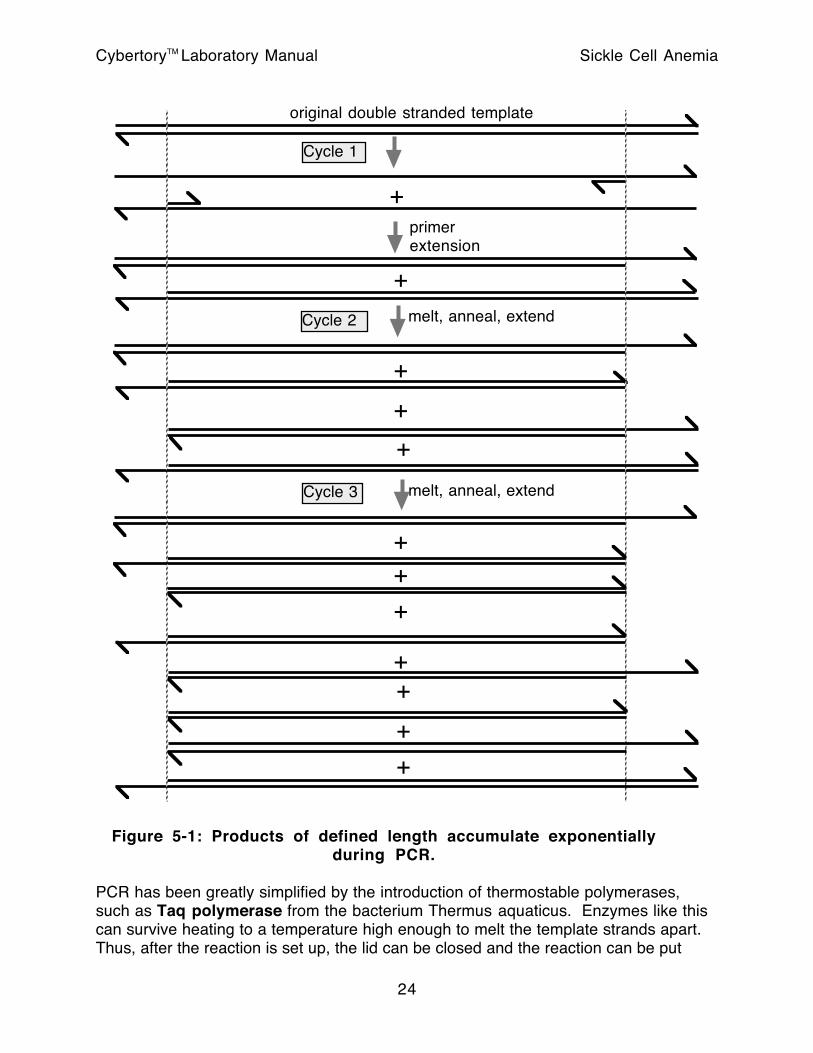
PCR is basically two simultaneous complementary primer extension reactions, repeated over and over. The product extended from each primer serves as a template for extension from the other primer in the next round. To a first approximation, the number of DNA strands doubles in each round. The 5’ end of all PCR-generated DNA strands is defined by the annealing position of the primer from which it was extended. The strands that accumulate exponentially also have their 3’ ends defined by the 5’ end of the PCR-generated strands used as templates. After the third round of PCR, the majority of PCR produced DNA strands are of the same size, reaching from the 5’ end of the left hand primer to the 5’ end of the right hand primer. This situation can best be appreciated by studying Figure 5-1, and by calculating the number of strands of this precisely defined length that would be expected after higher numbers of cycles.
This is why PCR products can form clean bands on agarose gel electrophoresis, even though we have no way to tell the polymerase to stop other than letting it run off the end of the template.
The DNA stick figures used in Figure 5-1 are conceptually useful in understanding primer design. The primer sequences must have their 3’ ends pointing into the area to be amplified. Some mismatches between the primer and the template can be tolerated. Since the primer molecule is physically incorporated into the product, intentional mismatches in the primers can be used to introduce changes in the product relative to the original template. This provides a simple technique for performing site-directed mutagenesis. Mismatches can destabilize primer binding; this effect may be accounted for by using longer primers or lower annealing temperatures if the primers do not match exactly. Mismatches near the 3’ end of the primer are more likely to prevent it from priming efficiently.
CybertoryTM Laboratory Manual Sickle Cell Anemia
23
original double stranded template
+
melt, anneal, extend
primer extension
+
+
+
+
+
+
+
melt, anneal, extend
Cycle 1
Cycle 2
Cycle 3
+
+
+
+
Figure 5-1: Products of defined length accumulate exponentiallyduring PCR.
PCR has been greatly simplified by the introduction of thermostable polymerases, such as Taq polymerase from the bacterium Thermus aquaticus. Enzymes like this can survive heating to a temperature high enough to melt the template strands apart. Thus, after the reaction is set up, the lid can be closed and the reaction can be put
CybertoryTM Laboratory Manual Sickle Cell Anemia
24
through the replication cycles simply by heating and cooling repeatedly. A machine to automate this process is called a thermal cycler, or simply a PCR machine.
Simple templates, such as plasmid DNA, generally produce fewer artifacts than more complex templates, such as human genomic DNA. Longer primers and higher annealing temperatures may be needed to increase priming specificity for templates of higher complexity.
Designing primers to amplify individual genes or subsets of genes from multigene families may require careful consideration of both the desired targets and the undesired related sequences. Multiple sequence alignments are useful for this task.
Pairs of primers that are complementary to one another at their 3’ ends may form “primer-dimer” artifacts, which are primer extension products in which each primer acts as a template for extension of the other, and the intended template is left out.
Immaterials• template (use sample kit from BobCoTM)• primers (custom synthesized)• DNA polymerase• dNTPs• 10X Buffer (Tris/KCl)
• thermal cycler• disposable tubes, tips, etc.• Materials for restriction digestion and
agarose gel electrophoresis
ProcedureNote: This simulator is in the prototype stage, and does not have a graphical interface for mixing up reactions (yet). In reality, PCRs are set up much like restriction digestion reactions.
• Close the CybertoryTM window, then relaunch it from the Kiosk Mode Launcher window. This will give us nice fresh tubes and reagents to work with. Wait for it to finish loading completely.
• Choose “PCR Demo” from the “Select Tool” menu.• Enter the following primer sequences (or copy them from the BobCoTM catalog):
Primer 1: tcagggcagagccatcPrimer 2: agcatcaggagtggaca
• Select the “Normal beta globin” template.• Be sure the number 1 is in the “Reaction Tube Number” box.• Click the “RUN” button. The output will be automatically copied to reaction tube 1.• Enter “2” into the “reaction tube number” box, and RUN the reaction again. Tubes 1
and 2 should now contain the same product.• Switch the template to “mutant beta globin” and run reactions for tubes 3 and 4.• Go to the “Restriction Enzymes” module. Tubes 1-4 may look empty, but they
(should) have dried DNA in them. Add 50 µl H20 to each of these tubes.• Add 1µl DdeI to tubes 2 and 4. Incubate, and run a gel. The band patterns should
resemble those in Xu et al. “First unaffected pregnancy using preimplantation genetic diagnosis for sickle cell anemia.” JAMA 281(18):1701-6, May 1999.
CybertoryTM Laboratory Manual Sickle Cell Anemia
25
Lesson 6: Genotypic Diagnosis
Learning Objectives:Understand the relative strengths and weaknesses of genotypic versus phenotypic diagnostic approaches in several example systems.Develop a better understanding of genetic diagnosis techniques as used in the medical literature.Be able to find papers on genetic diagnosis in the medical literature.
BackgroundMolecular biology techniques, particularly PCR-based techniques, are increasingly important tools for diagnosis of infectious and inherited diseases, determining predispositions to certain disorders, predicting the effectiveness of particular therapies for a given individual, etc.
In many cases a genetic test can be contrasted to other diagnostic approaches that measure the disease state more directly. For example, sickle cell anemia can be diagnosed by examining the red blood cells. The clinical severity of disease may not be predictable from limited genotypic testing. Even sickle cell disease is affected by a variety of factors besides the presence of valine at position 6 in the beta globin chain.
Genetic tests may (or may not) have advantages that recommend them over conventional “phenotypic” tests. Some phenotypic tests, such as viral drug resistance, are difficult and expensive to perform, and may require long periods of time. Genetic analysis may be faster, simpler, and even cheaper in some cases. Genetic diagnoses can sometimes be made before a phenotype is presented, as with preimplantation diagnosis of embryos.
Many technical advances, including biosensors for detecting specific gene sequences promise to make genetic testing faster, cheaper, and more reliable in the future.
ImmaterialsPubMed Medline: http://www.ncbi.nlm.nih.gov/pubmed
Procedure• Search the current medical literature for reports dealing with genetic diagnosis.• Search for papers dealing with “PCR” and “RFLP”.• Read one of these papers. See if the methods section makes more sense than
before you took the CybertoryTM workshop.• Try to locate and read at least one paper critical of genetic diagnosis.
CybertoryTM Laboratory Manual Sickle Cell Anemia
26