Embed Size (px)
Citation preview
International Journal of Management Studies ISSN(Print) 2249-0302 ISSN (Online)2231-2528 http://www.researchersworld.com/ijms/
_______________________________________________- 1 - Vol-II, Issue-1, June 2015
CUSTOMER-SATISFACTION ANALYSIS AT
SAN FRANCISCO INTERNATIONAL AIRPORT
Xiao Wang,
Bentley University
Waltham, MA, U.S.A.
Mengnan Hong,
Bentley University
Waltham, MA, U.S.A.
Paul D. Berger,
Bentley University
Waltham, MA, U.S.A.
ABSTRACT
In this paper, we seek to find the drivers of overall satisfaction at San Francisco International airport (SFO). Our analysis is based on a sample of over 3,000 customers at
SFO who were surveyed in mid-2013. We use stepwise linear multiple regression to
determine which variables, and at what levels, are significant predictors of overall
satisfaction. We find that several variables are impactful, and for the majority of variables, not surprisingly, it is the extreme ratings on the scale (Unacceptable on one end,
Outstanding on the other end) that make a difference.
Keywords: Satisfaction analysis, multiple regression, Stepwise regression, San international
airport, Survey data.
International Journal of Management Studies ISSN(Print) 2249-0302 ISSN (Online)2231-2528 http://www.researchersworld.com/ijms/
_______________________________________________- 2 - Vol-II, Issue-1, June 2015
Introduction:
The objective of this analysis is to gain an understanding of the factors that may influence customers’ satisfaction at the San Francisco International Airport (SFO). A questionnaire was designed by airport
staff and was collected by customer interviews using a stratified random sample of flights. The
interviews were held at all airport terminals and boarding areas from May 1 through May 23, 2013. Our
focus is to determine the variables/factors that are statistically significant in terms of predicting overall satisfaction with SFO. Our primary analysis utilizes stepwise linear multiple regression in this endeavor,
as described in the Methodology section.
Literature Review:
Most of the work done to analyze how satisfied customers are at airports relates to a specific airport. Al
Refaie et al. (2014) studied potential drivers of satisfaction and loyalty at the Jordan airport. They
studied very different factors than those in this study - primarily, ticket pricing and flight performance.
Their results indicated that satisfaction was related to the reservation process, ticketing process, and perceived value. Loyalty was driven most by service recovery, price and perceived value.
Another study was done by Mattazo et al. (2012), studying customer satisfaction at the Augusto Severo
airport in Brazil; (as an aside, in 2014, this airport stopped serving civilian flights and is currently serving the military exclusively.) They used multiple linear regression and adaptive modelling, and
determined that key variables affecting satisfaction were confidence in the safety of the premises,
waiting time for a taxi, availability and quality of seats in the airport, as well as prices of the food at terminal restaurants. The variables considered varied substantially from our study.
Another study by Suki (2014) considered passenger satisfaction with airline service at the major airport
in Malaysia. Using structural equation modelling, and a sample of n = 300, Suki's key finding was that
customer service is a major determinant of the content of word-of-mouth and recommendations. A study by Chang (2013) examined factors affecting airport access mode-choice by elders at Taiwan
Airport. His key finding was that the elderly strongly prefer to be driven to the airport by family
members as opposed to taking a taxi, relative to the general population. A study by Baker (2013) examined not just one airport, but focused on several airports, while
comparing different airlines: legacy airlines vs. low-cost airlines. Perhaps surprisingly, he found that the
low-cost airlines received significantly better ratings on service quality than the legacy airlines. A study that examined the San Francisco Airport (SFO) was conducted more than 30 years ago by
Harvey (1987), based on a survey conducted in 1980. He focused on choice of 3 airports in the San
Francisco Bay area including SFO. He also distinguished between business travellers and non-business
travellers. His main findings, using multinomial logit models, were that ground access time and frequency of direct flights to destinations were the key factors in airport choice and that the effects were
not linear. A study that followed up the Harvey (1987) study was by Hess and Polak (2005). They also
used multinomial logit models and found results that reinforced the earlier study. Yet another follow up study about airport choice was conducted by Ishii et al. (2009) of 4 airports in the San Francisco Bay
area. They also distinguished between business travellers and non-business ("leisure") travellers, and the
results were somewhat similar to those of the Harvey (1987) and Hess and Polak (2005) studies in that
they also used multinomial logit models and found that non-price characteristics, such as airport access time, airport delay, flight frequency, the availability of particular airport–airline combinations, and early
arrival times, strongly affected choice probabilities.
None of these studies of airport choice in the San Francisco area were similar to the study in this paper, which looked at SFO in particular, and did not at all focus on choice among different airports. Our study
went into greater detail at one specific airport (SFO) and considered very different variables than the
other studies cited. Also, there are many studies of other issues at airports, such as productivity at airports, employee satisfaction at airports, and scheduling aircraft; we did not cite these articles, viewing
them as too peripheral to our study. There were also a few other studies of various activities in airports
outside the United States (e.g., the main airport in the UAE) that we did not reference, since they either
duplicated findings of other studies or did not deal explicitly with customer satisfaction.
International Journal of Management Studies ISSN(Print) 2249-0302 ISSN (Online)2231-2528 http://www.researchersworld.com/ijms/
_______________________________________________- 3 - Vol-II, Issue-1, June 2015
Method:
The complete dataset includes 69 variables and 3536 observations. Each variable represents a question in the questionnaire; however, we do not utilize all of the variables. For space considerations, we do not
include the questionnaire, in its entirely, in this paper. We will, however, list and describe in detail the
questions that we shall use in our analysis.
Variables Description:
We selected the following questions from the questionnaire as candidate variables for our analysis. In
order to ensure the accuracy of the model, we conducted data cleaning, including scale recoding, as
shall be described, to satisfy the ordinal characteristics of the answers. As noted, our goal was to determine which variables affect overall satisfaction with SFO. Thus, our dependent variable, Y, is part
of a section, with the instruction : "How does SFO rate on each of the following attributes?"
Specifically, Y represented SFO overall, with the "attribute" worded: "SFO Airport as a whole."
The possible choices for a responder were: 1 = Unacceptable
2 = Below Average
3 = Average 4 = Good
5 = Outstanding
6 = Have never used or visited
If the responder did not reply to the question, it was coded as a 0. These responder choices were utilized
for all of the independent ("X") variables also. Table 1 lists the 14 independent variables we used. These
14 variables (along with Y) represent all of the attributes listed in that section of the questionnaire. The independent variables are listed as questions A through N, and in the table, we continue the precise
labeling as reference back to the section 7 of the questionnaire.
Table 1: Attributes/Independent Variables
Variable label Attribute
Q7A_Art Artwork and exhibitions
Q7B_Food Restaurants
Q7C_Shops Retail shops and concessions
Q7D_Signs Signs and directions inside SFO
Q7E_Walk Escalators/elevators/moving walkways
Q7F_Screens Information on screens/monitors
Q7G_Info.arr Information booths - lower level
Q7H_Info.dep Information booths - upper level
Q7I_Wifi Accessing and using free Wifi at SFO
Q7J_Road Signs and directions on SFO roadways
Q7K_Park Airport parking facilities
Q7L_Airtrain Airtrain
Q7M_LTPark Long term parking lot shuttle bus
Q7N_Rental Airport car rental center
Data Preparation:
As noted earlier, each question in the questionnaire has seven possible values on the database. We delete
those observations with a "0," indicating a missing value. A value of 6 (supposedly) stands for those customers who have never used or visited this criterion. There were 70 observations for Y with the value, 6.
The answer actually does not make sense, since each responder was a "customer" at the SFO airport. It
International Journal of Management Studies ISSN(Print) 2249-0302 ISSN (Online)2231-2528 http://www.researchersworld.com/ijms/
_______________________________________________- 4 - Vol-II, Issue-1, June 2015
would not appear viable that a customer who never used/visited this airport answered the questionnaire. Thus, we also deleted all observations for which Y was coded "6." We, of course, want to consider the
responses of those customers who used/visited SFO airport and evaluated Y; thus, Y ranged from 1 to 5.
We did not want to commit to a linear relationship between Y and any of the independent variables. Therefore, we created 5 dummy variables for each of the 14 "X's." This will allow us to capture non-
linearity relationships up to a 4th degree equation (which is more than sufficient non-linearity,
especially for these X's which should all exhibit a monotonic relationship with Y, if any relationship at
all. It was reasonable for a response to be coded "6" for one or more of the independent variables. After all, some responders perhaps never used the parking facilities, or never rented a car at SFO, etc. Indeed,
the minimum number of 6's for any X was 90 (for Q7D_Signs). Thus, we set the coded-value 6 in each
variable as the reference category and replaced each of the original 14 variables by the following 5 dummy variables (illustrating this for Q7A_Art, and at this point, dropping the "Q7X_" part of the
variable name for exposition/brevity purposes.)
Art-Out = 1 if the response is Outstanding, 0 otherwise.
Art-Good = 1 if the response is Good, 0 otherwise. Art-Ave = 1 if the response is Average, 0 otherwise.
Art-B.Ave = 1 if the response is Below Average, 0 otherwise.
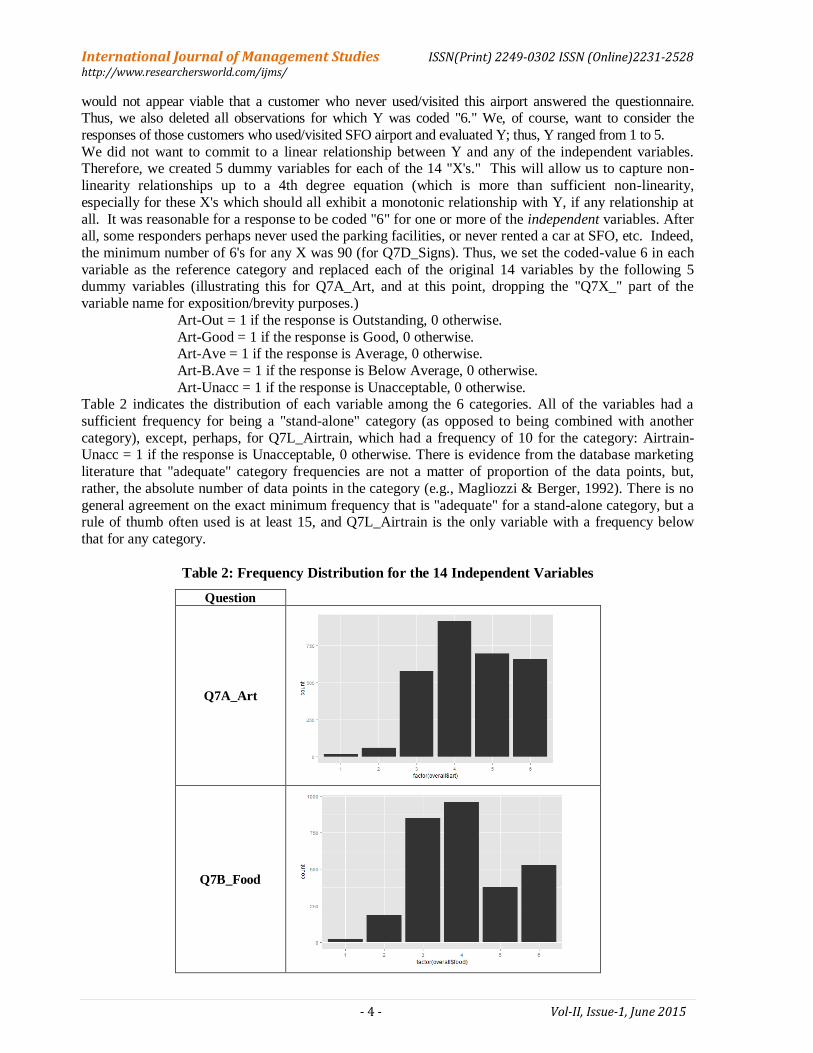
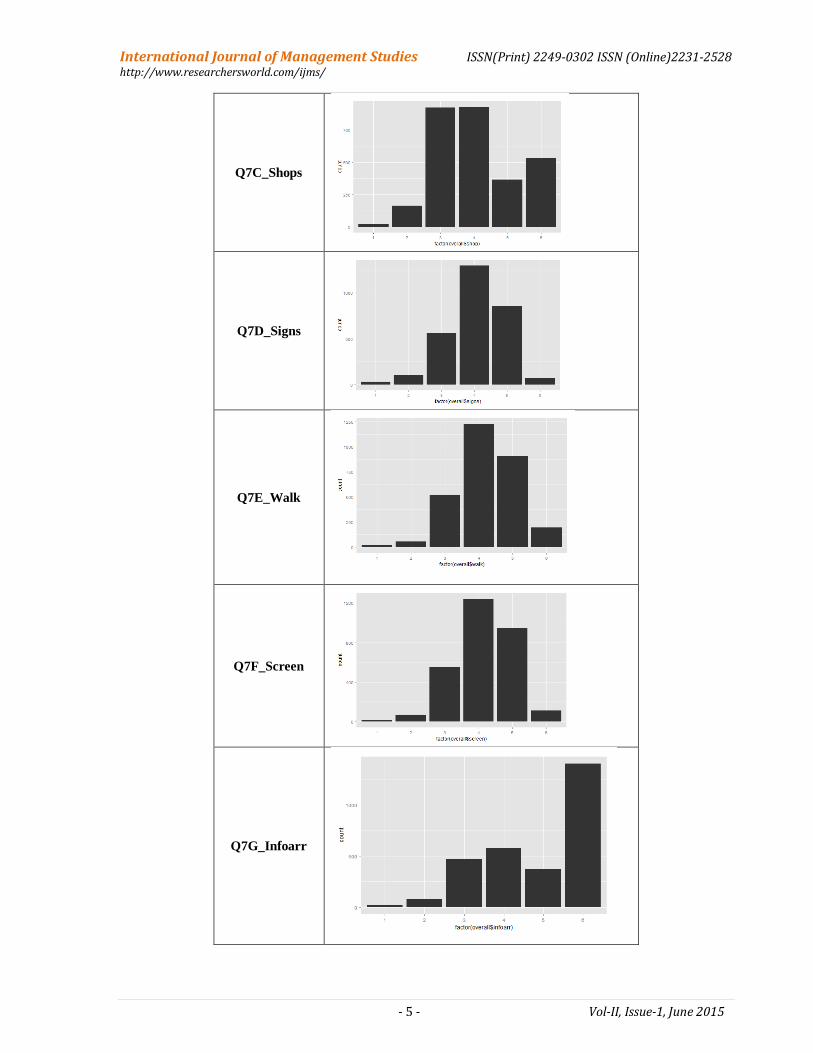
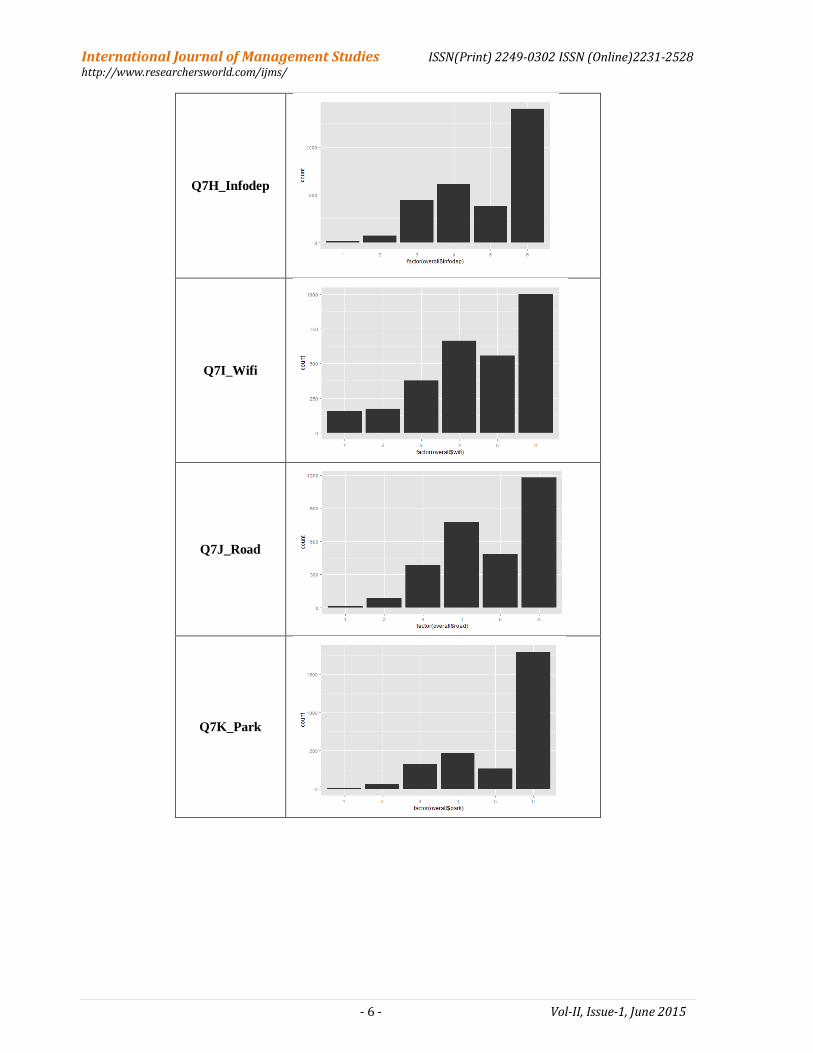
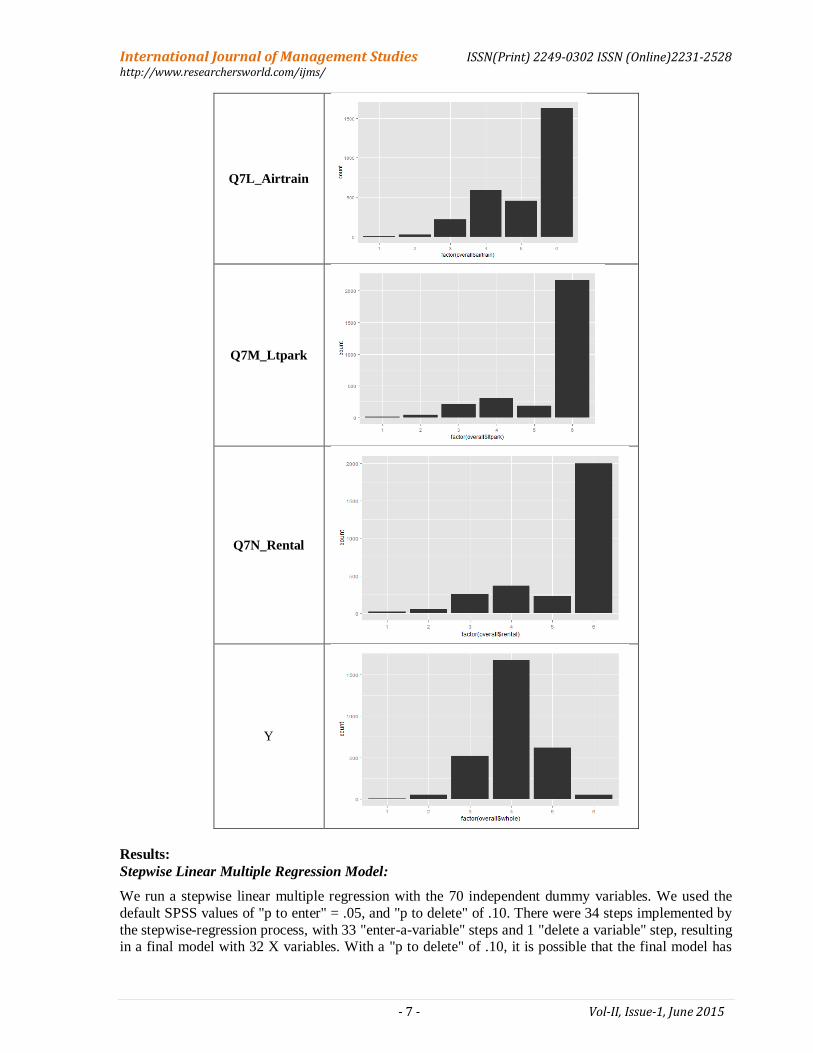
Art-Unacc = 1 if the response is Unacceptable, 0 otherwise. Table 2 indicates the distribution of each variable among the 6 categories. All of the variables had a
sufficient frequency for being a "stand-alone" category (as opposed to being combined with another
category), except, perhaps, for Q7L_Airtrain, which had a frequency of 10 for the category: Airtrain-Unacc = 1 if the response is Unacceptable, 0 otherwise. There is evidence from the database marketing
literature that "adequate" category frequencies are not a matter of proportion of the data points, but,
rather, the absolute number of data points in the category (e.g., Magliozzi & Berger, 1992). There is no
general agreement on the exact minimum frequency that is "adequate" for a stand-alone category, but a rule of thumb often used is at least 15, and Q7L_Airtrain is the only variable with a frequency below
that for any category.
Table 2: Frequency Distribution for the 14 Independent Variables
Question
Q7A_Art
Q7B_Food
International Journal of Management Studies ISSN(Print) 2249-0302 ISSN (Online)2231-2528 http://www.researchersworld.com/ijms/
_______________________________________________- 5 - Vol-II, Issue-1, June 2015
Q7C_Shops
Q7D_Signs
Q7E_Walk
Q7F_Screen
Q7G_Infoarr
International Journal of Management Studies ISSN(Print) 2249-0302 ISSN (Online)2231-2528 http://www.researchersworld.com/ijms/
_______________________________________________- 6 - Vol-II, Issue-1, June 2015
Q7H_Infodep
Q7I_Wifi
Q7J_Road
Q7K_Park
International Journal of Management Studies ISSN(Print) 2249-0302 ISSN (Online)2231-2528 http://www.researchersworld.com/ijms/
_______________________________________________- 7 - Vol-II, Issue-1, June 2015
Q7L_Airtrain
Q7M_Ltpark
Q7N_Rental
Y
Results:
Stepwise Linear Multiple Regression Model:
We run a stepwise linear multiple regression with the 70 independent dummy variables. We used the
default SPSS values of "p to enter" = .05, and "p to delete" of .10. There were 34 steps implemented by
the stepwise-regression process, with 33 "enter-a-variable" steps and 1 "delete a variable" step, resulting in a final model with 32 X variables. With a "p to delete" of .10, it is possible that the final model has
International Journal of Management Studies ISSN(Print) 2249-0302 ISSN (Online)2231-2528 http://www.researchersworld.com/ijms/
_______________________________________________- 8 - Vol-II, Issue-1, June 2015
variables with a p-value between .05 and .10 (as opposed to a p-value < .05); however, only one of the 32 final-model variables has a p-value over .05, Shop-Out, with a p-value of .061.
The R2 for our model is 0.546, and the adjusted R
2 is 0.541. Table 3 shows the ANOVA table for the
final model. The p-value of the F test can be seen to be .000 (0, to three significant digits.)
Table 3: ANOVA Table for final model of stepwise regression
Sum of Squares df Mean Square F Sig.
Regression 767.66 32 23.989 106.864 .000
Residual 637.086 2838 0.224
Total 1404.746 2870
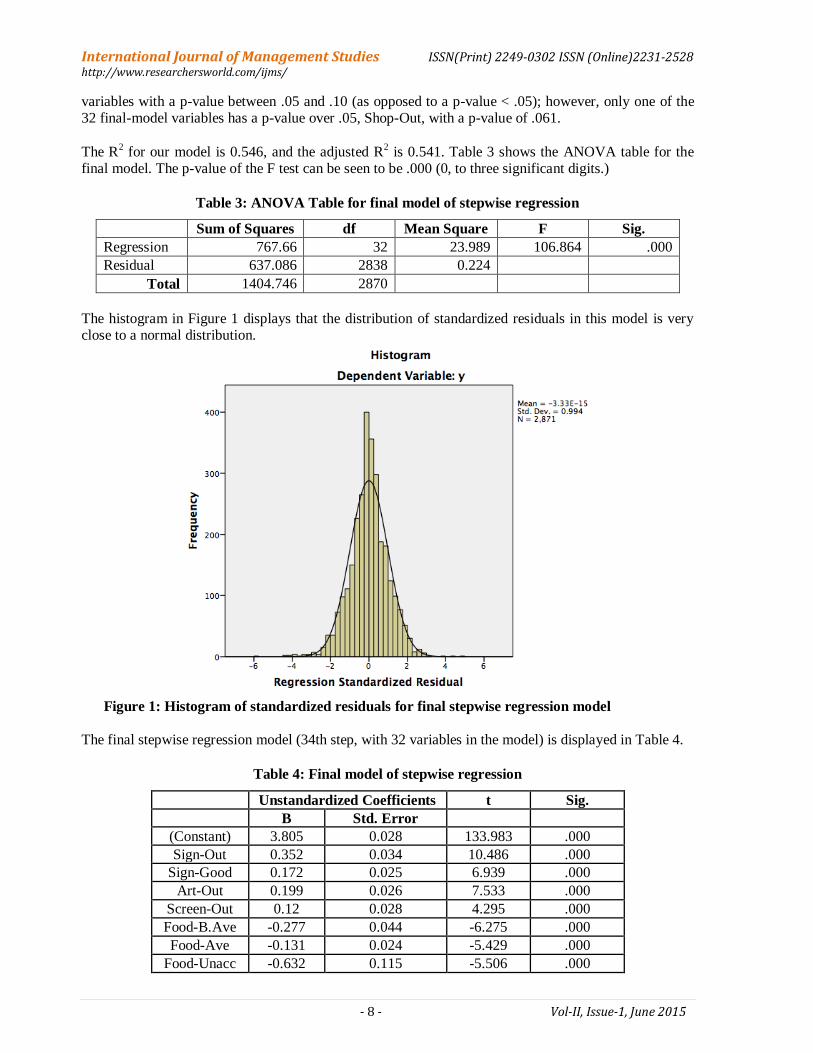
The histogram in Figure 1 displays that the distribution of standardized residuals in this model is very close to a normal distribution.
Figure 1: Histogram of standardized residuals for final stepwise regression model
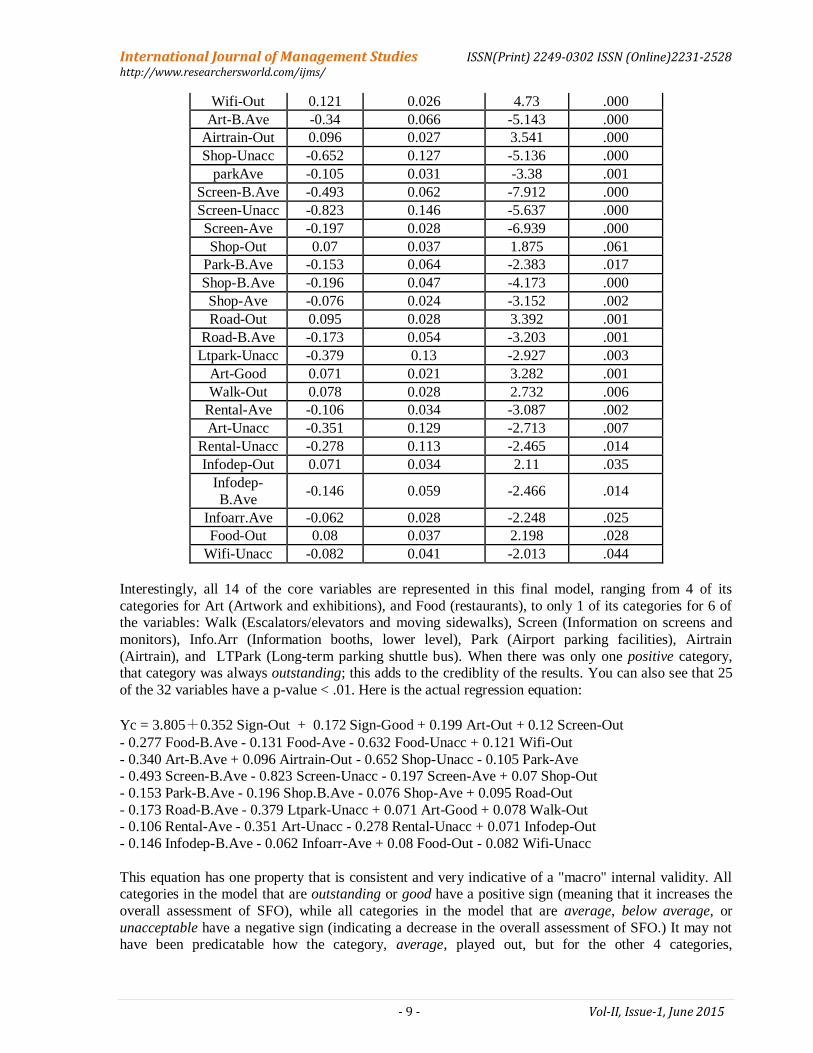
The final stepwise regression model (34th step, with 32 variables in the model) is displayed in Table 4.
Table 4: Final model of stepwise regression
Unstandardized Coefficients t Sig.
B Std. Error
(Constant) 3.805 0.028 133.983 .000
Sign-Out 0.352 0.034 10.486 .000
Sign-Good 0.172 0.025 6.939 .000
Art-Out 0.199 0.026 7.533 .000
Screen-Out 0.12 0.028 4.295 .000
Food-B.Ave -0.277 0.044 -6.275 .000
Food-Ave -0.131 0.024 -5.429 .000
Food-Unacc -0.632 0.115 -5.506 .000
International Journal of Management Studies ISSN(Print) 2249-0302 ISSN (Online)2231-2528 http://www.researchersworld.com/ijms/
_______________________________________________- 9 - Vol-II, Issue-1, June 2015
Wifi-Out 0.121 0.026 4.73 .000
Art-B.Ave -0.34 0.066 -5.143 .000
Airtrain-Out 0.096 0.027 3.541 .000
Shop-Unacc -0.652 0.127 -5.136 .000
parkAve -0.105 0.031 -3.38 .001
Screen-B.Ave -0.493 0.062 -7.912 .000
Screen-Unacc -0.823 0.146 -5.637 .000
Screen-Ave -0.197 0.028 -6.939 .000
Shop-Out 0.07 0.037 1.875 .061
Park-B.Ave -0.153 0.064 -2.383 .017
Shop-B.Ave -0.196 0.047 -4.173 .000
Shop-Ave -0.076 0.024 -3.152 .002
Road-Out 0.095 0.028 3.392 .001
Road-B.Ave -0.173 0.054 -3.203 .001
Ltpark-Unacc -0.379 0.13 -2.927 .003
Art-Good 0.071 0.021 3.282 .001
Walk-Out 0.078 0.028 2.732 .006
Rental-Ave -0.106 0.034 -3.087 .002
Art-Unacc -0.351 0.129 -2.713 .007
Rental-Unacc -0.278 0.113 -2.465 .014
Infodep-Out 0.071 0.034 2.11 .035
Infodep-
B.Ave -0.146 0.059 -2.466 .014
Infoarr.Ave -0.062 0.028 -2.248 .025
Food-Out 0.08 0.037 2.198 .028
Wifi-Unacc -0.082 0.041 -2.013 .044
Interestingly, all 14 of the core variables are represented in this final model, ranging from 4 of its
categories for Art (Artwork and exhibitions), and Food (restaurants), to only 1 of its categories for 6 of the variables: Walk (Escalators/elevators and moving sidewalks), Screen (Information on screens and
monitors), Info.Arr (Information booths, lower level), Park (Airport parking facilities), Airtrain
(Airtrain), and LTPark (Long-term parking shuttle bus). When there was only one positive category, that category was always outstanding; this adds to the crediblity of the results. You can also see that 25
of the 32 variables have a p-value < .01. Here is the actual regression equation:
Yc = 3.805+0.352 Sign-Out + 0.172 Sign-Good + 0.199 Art-Out + 0.12 Screen-Out
- 0.277 Food-B.Ave - 0.131 Food-Ave - 0.632 Food-Unacc + 0.121 Wifi-Out
- 0.340 Art-B.Ave + 0.096 Airtrain-Out - 0.652 Shop-Unacc - 0.105 Park-Ave - 0.493 Screen-B.Ave - 0.823 Screen-Unacc - 0.197 Screen-Ave + 0.07 Shop-Out
- 0.153 Park-B.Ave - 0.196 Shop.B.Ave - 0.076 Shop-Ave + 0.095 Road-Out
- 0.173 Road-B.Ave - 0.379 Ltpark-Unacc + 0.071 Art-Good + 0.078 Walk-Out - 0.106 Rental-Ave - 0.351 Art-Unacc - 0.278 Rental-Unacc + 0.071 Infodep-Out
- 0.146 Infodep-B.Ave - 0.062 Infoarr-Ave + 0.08 Food-Out - 0.082 Wifi-Unacc
This equation has one property that is consistent and very indicative of a "macro" internal validity. All categories in the model that are outstanding or good have a positive sign (meaning that it increases the
overall assessment of SFO), while all categories in the model that are average, below average, or
unacceptable have a negative sign (indicating a decrease in the overall assessment of SFO.) It may not have been predicatable how the category, average, played out, but for the other 4 categories,
International Journal of Management Studies ISSN(Print) 2249-0302 ISSN (Online)2231-2528 http://www.researchersworld.com/ijms/
_______________________________________________- 10 - Vol-II, Issue-1, June 2015
expectations are realized. Of course, not all categories of all variables are in the model; recall that we had 70 eligible (categorical) variables.
From the specific coefficients of the variables in the regression model, we can see the impact of each
dummy variable (and, we should remember that, because this model is the result of a stepwise regression, there is relatively little correlation among the variables.) As mentioned earlier, the reference
(“dummy”) category of each dummy variable represents those customers who never visited/used this
attribute. Also, as noted earlier, if the coefficient of a variable is positive, it suggests that if a customer
selects this answer, it has a positive influence on his/her overall opinion of the SFO airport, and if the coefficient of a variable is negative, it suggests that if a customer selects this answer, it has a negative
influence on his/her overall opinion of the SFO airport, and, all the categories in the final model are
statistically significant. The magnitude of the coefficient reflects how much positive or negative impact this variable is predicted to have on the dependent variable (overall opinion about SFO.) Among these
32 variables, 20 of them have negative coefficients and 12 have positive coefficients. The absolute
values are all less than 1, which demonstrates that there no single variable that changes a customer’s
overall evaluation by as much as one full point. Three variables have coefficients that have absolute values larger than 0.5 while others are in the range
from 0.07 to 0.493; the three all have negative coefficients. The coefficients are
-.632 for Food-Unacc, -0.652 for Shop-Unacc and -0.823 for Screen-Unacc. Note how these largest coefficients accompany categories at the extreme; this is another result that is “as it should be.”
Apparently, Screen-Unacc (recall: “Screen” refers to information on screen and monitors) has the
comparatively greatest influence on customers’ overall opinion (holding all other variables constant.) With other variables being held constant, the average evaluation of the whole SFO airport decreases by
.823 (on, basically, the 1-5 scale), when the customer believes that the information on the screens and
monitors is unacceptable, compared with customers who selected never used in the question
Q7F_Screens - see Table 1. The variable, Sign-Out, with the coefficient at .352, has the comparatively greatest positive influence on the
overall evaluations. With other variables held constant, the average evaluation of the whole SFO airport
increases by .352 when the customer believes that the signs and directions inside SFO are outstanding compared with customers who selected never used in question Q7D_Signs – again, see Table 1.
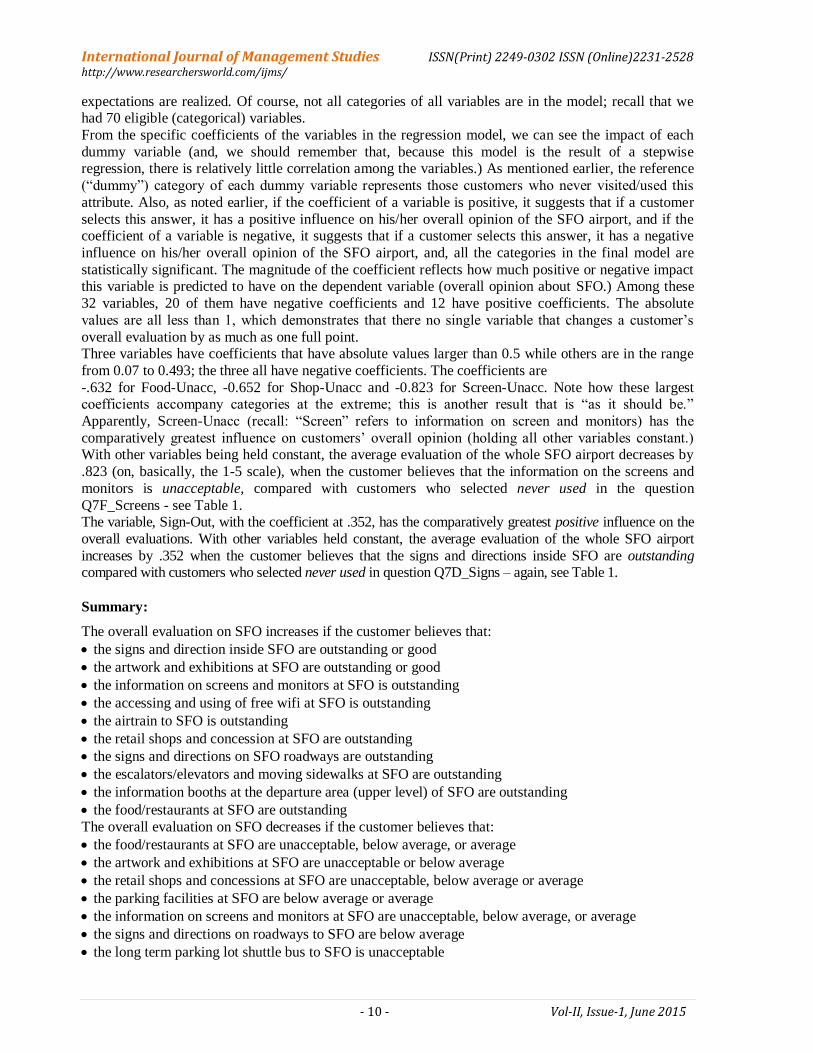
Summary:
The overall evaluation on SFO increases if the customer believes that:
the signs and direction inside SFO are outstanding or good
the artwork and exhibitions at SFO are outstanding or good
the information on screens and monitors at SFO is outstanding
the accessing and using of free wifi at SFO is outstanding
the airtrain to SFO is outstanding
the retail shops and concession at SFO are outstanding
the signs and directions on SFO roadways are outstanding
the escalators/elevators and moving sidewalks at SFO are outstanding
the information booths at the departure area (upper level) of SFO are outstanding
the food/restaurants at SFO are outstanding
The overall evaluation on SFO decreases if the customer believes that:
the food/restaurants at SFO are unacceptable, below average, or average
the artwork and exhibitions at SFO are unacceptable or below average
the retail shops and concessions at SFO are unacceptable, below average or average
the parking facilities at SFO are below average or average
the information on screens and monitors at SFO are unacceptable, below average, or average
the signs and directions on roadways to SFO are below average
the long term parking lot shuttle bus to SFO is unacceptable
International Journal of Management Studies ISSN(Print) 2249-0302 ISSN (Online)2231-2528 http://www.researchersworld.com/ijms/
_______________________________________________- 11 - Vol-II, Issue-1, June 2015
the rental car center at SFO is unacceptable
the information booth at the arrival area is average
the information booth at departure area is below average
the wifi is unacceptable
There are six categorical variables that might be thought of as conspicuous by their absence. One is
Signs-Unacc and another is Park-Unacc. In the case of both "Sign" and "Park," the category of below
average (B.Ave) is significant and negative in the stepwise regression final model, while the category unacceptable, which is obviously a worse assessment than below average, was not in the final model of
the stepwise regression. In examining these two variable, we find (1) that Sign-Unacc has a p-value
(.055) that is just a relatively tiny amount above .05, and does (as would be expected) have a negative
coefficient, and (2) that Park-Unacc has a relatively small p-value (.149) and also has a negative coefficient. Therefore, it would seem quite reasonable to ascribe these two variables not being in the
stepwise regression final model as a case of being close to inclusion in the final model, being
directionally correct, but simply suffering the vagaries of multiple regression analysis and a complex pattern of variables' overlapping contribution to determining overall satisfaction.
The other four categorical variables that seem "missing" are Road-Unacc (since Road-B. Ave is significant
and negative), Infoarr-B.Ave and Infoarr-Unacc (since Infoarr.Ave is significant negative), and Infodep.Unacc (since Infodep-B.Ave is significant and negative). These four variables do not have
especially low p-values (if they were to enter the model), and we have no explanation why they did not enter
the final model, except that possibly, it is related to the fact that in all of these cases, only about 50% of the
customers indicated either non-use or left the question blank.
Discussion:
Based on the results of the stepwise regression analysis, we can make certain inferences, if the survey
results hold true. For Art, about 20 times as many customers indicated outstanding or good (significant positive) than
indicated either below average or unacceptable (significant negative.) So, no change is strongly
suggested for this variable.
For Food (restaurants), we have a different situation. About 3 times as many customers indicated either average, below average or unacceptable (significant negative), than indicated outstanding (significant
positive). So, we would view this as a strong endorsement to improve the food/restaurants. Changing the
lower ratings to good would at least remove the negative effect on satisfaction; it might take too many resources to change these ratings to outstanding, which would be needed to obtain a positive effect.
For Shops (retail shopping and concessions), we have, basically, the same relative frequencies and
pattern of significance as for Food. Again, about 3 times as many customers indicated either average,
below average or unacceptable (significant negative), than indicated outstanding (significant positive). Thus, we have the same recommendation as above for Food.
For Signs (signs and directions inside SFO), about 74% of the customers indicated either outstanding or
good (significant positive). None of the other categories had a significant coefficient. So, we would view this in a similar way to Art, with no strong indication that there should be changes.
For Walk (escalators/elevators and walkways), about 34 percent of the customers indicated outstanding
(significant positive), while there were no categories with a significant negative. So, unless changes would result in raising indications all the way to outstanding, it is likely not cost effective to make changes.
For Screens (information on screens and monitors), about 23% of the customers indicated either
average, below average or unacceptable (significant negative). The rest were either good or outstanding
(the latter being significant positive). So, unless it is very cost effective, we would view this as, perhaps, at most, a modest indication that there should be change.
For Infoarr (information booths on arrival [upper] floor), under 20% of the customers gave a rating of
unacceptable, below average, or average (the latter, significant negative). This suggests that changes should be implemented only if relatively cost effective to achieve a status of good (and eliminate the
International Journal of Management Studies ISSN(Print) 2249-0302 ISSN (Online)2231-2528 http://www.researchersworld.com/ijms/
_______________________________________________- 12 - Vol-II, Issue-1, June 2015
negative effect.) For Infodep (information booth on departure [lower] floor), again, under 20% gave a rating of unacceptable, below average, or average (the latter two, significant negative). However, for
Infodep, there is a significant positive coefficient for outstanding. So, again, we mention cost
effectiveness, but in this case, if ratings rose to outstanding, there would be not only the elimination of the negative effect, but, indeed, a positive effect.
For Wifi, the only effect was a negative one for the category Wifi.Unacc. Since this category was
chosen by only 5.3% of the customers, there is no strong indication for change.
For Road (signs and directions on SFO roadways), only about 3% of the customers chose unacceptable or below average (the latter, significant negative). Given this low number, and the fact that to achieve a
significant positive, the ratings would need to reach outstanding, there is no real indication of need for
change. The situation for Park (parking facilities at SFO) is similar. Only about 13% chose either unacceptable or below average or average (the latter two, significant negative), while none of the other
categories were significant. No change seems indicated.
For Airtrain, only 42% of the customers indicated an opinion, and only about 1% indicated either
unacceptable or below average. Since rating the airtrain as outstanding has a significant positive coefficient, and about 15% of the remaining 41% (42% - 1%) already rate the airtrain as outstanding, no
change is strongly indicated.
For both LTPark (long-term parking) and Rental (car rental center), a rating of unacceptable had a significant negative coefficient, while no other categories were significant. Given that for each variable,
fewer than 1% of the customers gave a rating of unacceptable, no change is indicated.
References:
[1] Al-Rafaie, Abbas, Bata, Nour, Eteiwi, and Issam Jalham (2014). Examining Factors that Affect
Passengers' Overall Satisfaction and Loyalty: Evidence from Jordan Airport, Jordan Journal of
Mechanical and Industrial Engineering, 8(2), p. 94-101.
[2] Baker, David (2013). Service quality and Customer Satisfaction in the Airline Industry: A Comparison between Legacy Airlines and Low-Cost Airlines, American Journal of Tourism
Research, 2(1), p. 67-77.
[3] Chang, Yu-Chun (2013). Factors Affecting Airport Access Mode-choice for Elderly Air Passengers, Transportation Research Part E: Logistics and Transportation Review, 57, p.105-112.
[4] Harvey, Greig (1987). Airport Choice in a Multiple Airport Region, Transportation Research Part
A: General, 21(6), p. 439-449.
[5] Hess, Stephane, and John W. Polak (2005). Mixed Logit Modelling of Airport Choice in Multi-Airport Regions, Journal of Air Transport Management, 11(2), p. 59-68.
[6] Ishii, Jun, Sunyoung, Jun, and Kurt Van Dender (2009). Air Travel Choices In Multi-Airport
Markets, Journal of Urban Economics,65(2), p. 216-227 [7] Magliozzi, Thomas, and Paul D. Berger (1992). List Segmentation Strategies in Direct Marketing,
OMEGA: The International Journal of Management Science, 21(1), p.61-72.
[8] Mattozo, Teofilo C., Silva, Gutembergue S., Costa, Jose A., and Fernandes–Neto, Andre P. (2012). Logistic Regression Applied to Airport Customer Satisfaction Using Hierarchical Quality Model,
Intelligent Data Engineering and Automated Learning - IDEAL 2012, Volume 74-35, p. 558-567.
[9] Suki, Norazah, M. (2014). Passenger Satisfaction with Airline Service Quality in Malaysia: A
Structural Equation Modeling Approach, Research in Transportation Business and Management, 10(1), p. 26-32.
*****