Embed Size (px)
Citation preview
CUSTOMER SATISFACTION
SURVEY, RESULT ANALYSIS AND
UTILIZATION IN A GLOBAL
FORESTRY COMPANY
Pauliina Leppänen
Bachelor’s thesis
November 2016
International Business
Financial Management
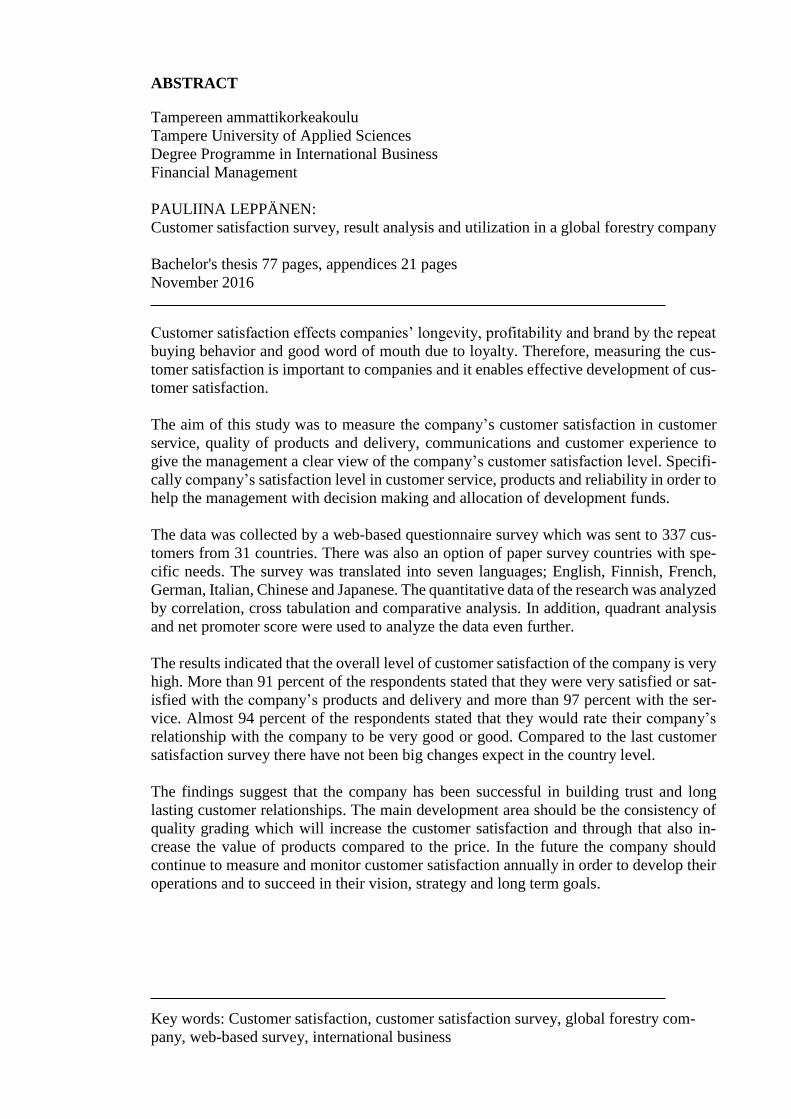
ABSTRACT
Tampereen ammattikorkeakoulu
Tampere University of Applied Sciences
Degree Programme in International Business
Financial Management
PAULIINA LEPPÄNEN:
Customer satisfaction survey, result analysis and utilization in a global forestry company
Bachelor's thesis 77 pages, appendices 21 pages
November 2016
Customer satisfaction effects companies’ longevity, profitability and brand by the repeat
buying behavior and good word of mouth due to loyalty. Therefore, measuring the cus-
tomer satisfaction is important to companies and it enables effective development of cus-
tomer satisfaction.
The aim of this study was to measure the company’s customer satisfaction in customer
service, quality of products and delivery, communications and customer experience to
give the management a clear view of the company’s customer satisfaction level. Specifi-
cally company’s satisfaction level in customer service, products and reliability in order to
help the management with decision making and allocation of development funds.
The data was collected by a web-based questionnaire survey which was sent to 337 cus-
tomers from 31 countries. There was also an option of paper survey countries with spe-
cific needs. The survey was translated into seven languages; English, Finnish, French,
German, Italian, Chinese and Japanese. The quantitative data of the research was analyzed
by correlation, cross tabulation and comparative analysis. In addition, quadrant analysis
and net promoter score were used to analyze the data even further.
The results indicated that the overall level of customer satisfaction of the company is very
high. More than 91 percent of the respondents stated that they were very satisfied or sat-
isfied with the company’s products and delivery and more than 97 percent with the ser-
vice. Almost 94 percent of the respondents stated that they would rate their company’s
relationship with the company to be very good or good. Compared to the last customer
satisfaction survey there have not been big changes expect in the country level.
The findings suggest that the company has been successful in building trust and long
lasting customer relationships. The main development area should be the consistency of
quality grading which will increase the customer satisfaction and through that also in-
crease the value of products compared to the price. In the future the company should
continue to measure and monitor customer satisfaction annually in order to develop their
operations and to succeed in their vision, strategy and long term goals.
Key words: Customer satisfaction, customer satisfaction survey, global forestry com-
pany, web-based survey, international business
3
CONTENTS
1 INTRODUCTION ............................................................................................. 5
2 RESEARCH PLAN ........................................................................................... 6
2.1 Customer satisfaction in UPM Timber and its importance ........................ 6
2.2 Research objective, purpose and research questions ................................. 8
2.2.1 Objective ......................................................................................... 8
2.2.2 Purpose ............................................................................................ 8
2.2.3 Research questions .......................................................................... 9
2.3 Concepts and theories of customer satisfaction ......................................... 9
2.3.1 Customer satisfaction ...................................................................... 9
2.3.2 Quality ........................................................................................... 12
2.3.3 Customer relationship management .............................................. 13
2.3.4 Customer satisfaction and loyalty ................................................. 14
2.4 Research data ........................................................................................... 16
2.4.1 Data collection .............................................................................. 16
2.4.2 Data analysis ................................................................................. 18
2.4.3 Limitations of the research ............................................................ 20
2.5 Thesis process .......................................................................................... 22
3 WEB-BASED SURVEY QUESTIONNAIRE AND UPM TIMBER ............ 23
3.1 UPM Timber and the forest industry ....................................................... 23
3.1.1 The forest industry in Finland ....................................................... 24
3.3 Survey design ........................................................................................... 25
3.4 Survey execution ...................................................................................... 28
6 SUMMARY .................................................................................................... 30
REFERENCES ...................................................................................................... 31
4
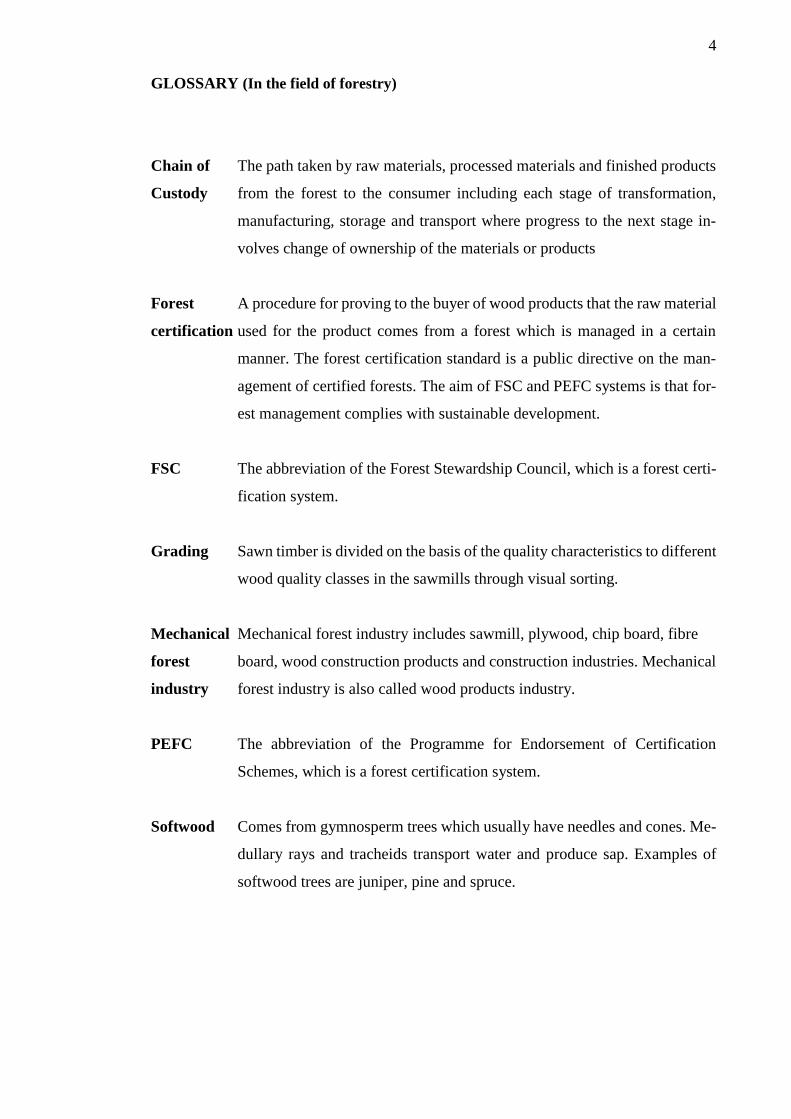
GLOSSARY (In the field of forestry)
Chain of The path taken by raw materials, processed materials and finished products
Custody from the forest to the consumer including each stage of transformation,
manufacturing, storage and transport where progress to the next stage in-
volves change of ownership of the materials or products
Forest A procedure for proving to the buyer of wood products that the raw material
certification used for the product comes from a forest which is managed in a certain
manner. The forest certification standard is a public directive on the man-
agement of certified forests. The aim of FSC and PEFC systems is that for-
est management complies with sustainable development.
FSC The abbreviation of the Forest Stewardship Council, which is a forest certi-
fication system.
Grading Sawn timber is divided on the basis of the quality characteristics to different
wood quality classes in the sawmills through visual sorting.
Mechanical Mechanical forest industry includes sawmill, plywood, chip board, fibre
forest board, wood construction products and construction industries. Mechanical
industry forest industry is also called wood products industry.
PEFC The abbreviation of the Programme for Endorsement of Certification
Schemes, which is a forest certification system.
Softwood Comes from gymnosperm trees which usually have needles and cones. Me-
dullary rays and tracheids transport water and produce sap. Examples of
softwood trees are juniper, pine and spruce.
5
1 INTRODUCTION
Loyal customers and long lasting customer relationships are one of cornerstones of UPM
Timber’s strategy. They want to ensure long-term commitment and continuity and their
vision is to be customer’s number one choice. Therefore, high level of customer satisfac-
tion is essential to their strategy and long term goals. Customer satisfaction, quality, cus-
tomer relationship management and loyalty are the main concepts of this thesis. The con-
cepts are described in detail in the chapters later on and they are working as a direction
of the thesis.
This thesis is marketing research about the customer satisfaction of UPM Timber. The
company commissioned a customer satisfaction survey in order to give the company’s
management a clear view of the company’s customer satisfaction level and help them
with decision making and allocation of development funds. The objective of this thesis is
to gather information about UPM Timber’s customer satisfaction in order to get a clear
picture of the quality of the company’s performance in different aspects and how they
could improve their customer service level.
The main objectives of this research are the data collection from company’s customers,
the analysis of the data and to identify improvement areas and suggest development ideas
how the company can improve their customer service level based on the analysis. UPM
Timber has done this type of research earlier and therefore this research also analyses the
development in customer satisfaction between this and the previous satisfaction survey.
The research is conducted as a quantitative research. The data for the research is collected
by a web-based questionnaire survey using the Qualtrics, the online survey software tool.
Statistical data is processed with Tixel and Qualtrics. In addition to comparative, correla-
tion and cross tabulation analysis, this research is using quadrant analysis and net pro-
moter score to analyse the quantitative data. The research also includes qualitative anal-
ysis of open-ended questions.
The next chapters explains in detail the research plan of the thesis. The research plan
includes the objective and the purpose of the research, the research methods and the main
concepts related the topic.
6
2 RESEARCH PLAN
2.1 Customer satisfaction in UPM Timber and its importance
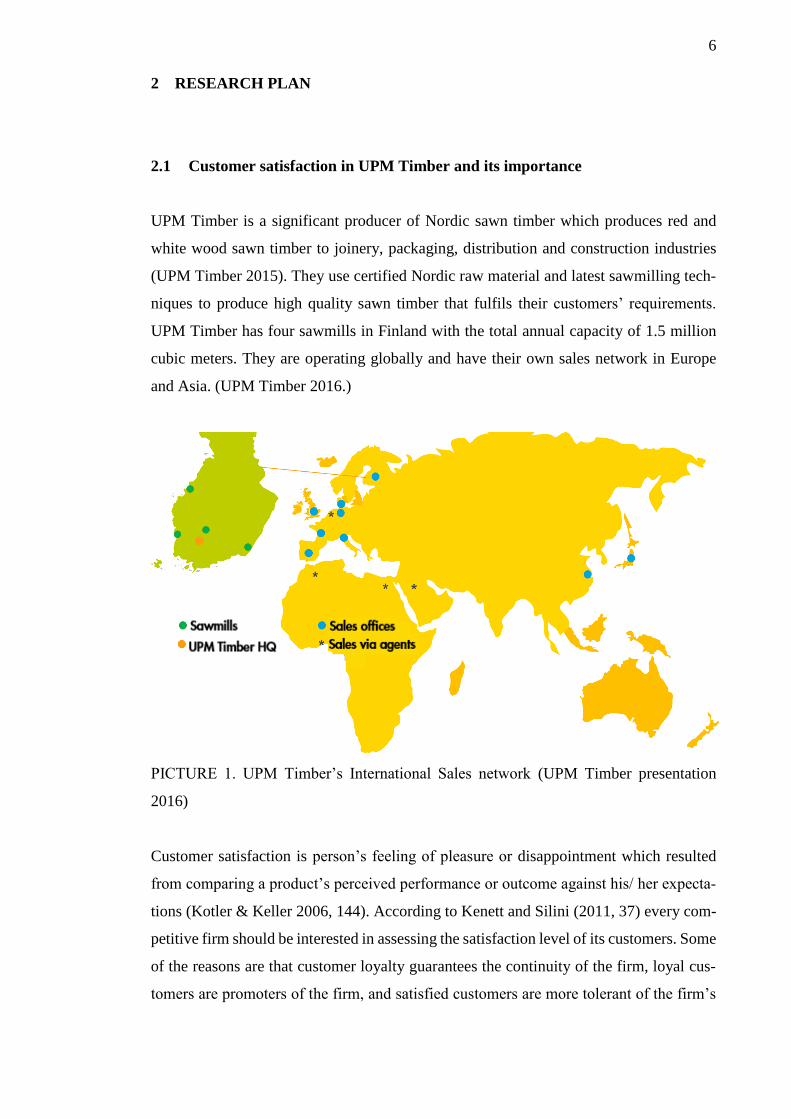
UPM Timber is a significant producer of Nordic sawn timber which produces red and
white wood sawn timber to joinery, packaging, distribution and construction industries
(UPM Timber 2015). They use certified Nordic raw material and latest sawmilling tech-
niques to produce high quality sawn timber that fulfils their customers’ requirements.
UPM Timber has four sawmills in Finland with the total annual capacity of 1.5 million
cubic meters. They are operating globally and have their own sales network in Europe
and Asia. (UPM Timber 2016.)
PICTURE 1. UPM Timber’s International Sales network (UPM Timber presentation
2016)
Customer satisfaction is person’s feeling of pleasure or disappointment which resulted
from comparing a product’s perceived performance or outcome against his/ her expecta-
tions (Kotler & Keller 2006, 144). According to Kenett and Silini (2011, 37) every com-
petitive firm should be interested in assessing the satisfaction level of its customers. Some
of the reasons are that customer loyalty guarantees the continuity of the firm, loyal cus-
tomers are promoters of the firm, and satisfied customers are more tolerant of the firm’s
7
mistakes and of choices such as changes in service levels or price increases. Loyal cus-
tomer and long lasting customer relationships are one of cornerstones in UPM Timber’s
strategy. They want to ensure long-term commitment and continuity and their vision is to
be customer’s no 1. choice (Timber SBU Strategy 2016-2020). Therefore, high level of
customer satisfaction is essential to their strategy and in order to achieve their long term
goals.
Quality has become an increasingly important means of competition on the world market.
A strategy based on management commitment to continuous quality improvement has
therefore to be applied more generally and systematically in any organization to enable it
to keep its position on the market. (Bergman & Klefsjö 1994, 15.) In a competitive market
such as sawn timber industry it is important for UPM Timber to continuously measure
and develop the quality of products and services in order to keep their good position in
the market.
Annual customer satisfaction surveys (ACSS) are conducted in order to: identify key
drivers of satisfaction and prioritize actions; compare data over time to identify patterns
in customers’ experiences; disseminate the results throughout the appropriate audiences
within the company to drive change within the organization (Kenett & Salini 2011, 6). In
2013 company went through big changes when they withdrew from further processing
business and focused only on sawn timber production. UPM Timber conducted customer
satisfaction survey in 2014 to measure their success in customer satisfaction with the cur-
rent operating model and to prioritize their actions. After two years from the last survey,
measurement of customer satisfaction was needed from the business strategy perspective
and from the operative standpoint.
In addition, the importance of satisfied customers is emphasized by the European Busi-
ness Excellence Model, developed by the European Foundation for Quality Management
(EFQM). The criterion customer satisfaction is the weightiest criterion and accounts for
20 percent of the total points in the scoring system when companies assess and measure
their own excellence. This means, that understanding the customers, and measuring cus-
tomers’ satisfaction is an important element in companies’ continuous quality improve-
ment, which leads to improved business performance, including economic performance.
(Neely 2002, 280.)
8
By conducting a customer satisfaction research UPM Timber gets relevant information
about their current level of customer satisfaction. The research’s focus areas are customer
service, quality of products, delivery reliability, communications and customer experi-
ence. From these company can identify areas were they need to improve and get area-
specific information about how customers experience their services. UPM Timber can
utilize analysed results in their customer satisfaction and quality development. When op-
erating worldwide customers satisfaction development can be challenging and the service
level can vary between countries. A global customers satisfaction survey for 27 countries
will give regional information and help with customer satisfaction development chal-
lenges in a global business.
2.2 Research objective, purpose and research questions
2.2.1 Objective
The objective of this research is to gather information about UPM Timber’s customer
satisfaction to get a clear understanding of the quality of company’s different aspects of
services and based on that information identify development areas to increase their cus-
tomer service level. To get a clear understanding of the customers satisfaction the objec-
tive is to execute customer satisfaction survey and analyse the results of survey by using
different methods. Afterwards to compare the results with 2014 results and analyse the
change and development in customer satisfaction and in customer service and other op-
erations.
2.2.2 Purpose
The purpose of the research is to collect information on customer satisfaction to give the
management a clear view of the company’s customer satisfaction level and more specif-
ically satisfaction of each attribute that the company provides to its customers in order to
help the management with decision making and allocation of development funds. The
goal is to increase the customer satisfaction of the forestry company. The attempt to meas-
ure and improve customer satisfaction is aimed at increasing the population of those we
satisfy and to satisfy at a higher level those who are loyal to us (Goldstein 2009, 119).
9
2.2.3 Research questions
Customers worldwide within various industries trust in UPM Timber’s professional ser-
vice and stable quality (Timber 2015). This research will give current information about
how customers evaluate the company’s performance based on their experiences.
To achieve the objective of research and gain a clear picture about the quality of com-
pany’s customer service level, product satisfaction and reliability and how they could
improve their customer satisfaction level the main research questions have to be an-
swered: What is the company’s level of customer satisfaction? How the company can
develop their customer experience and improve their customer service level?
To be able to answer the question above the research need to gather information the re-
search needed to answer what aspects of business operations needs to be improved in
order to improve the customer experience and how can the company utilize these findings
in customer satisfaction development. Comparison between these results and the previous
customer satisfaction survey was essential to know is the level of satisfaction increased
or decreased and what areas have changed during the past two years.
2.3 Concepts and theories of customer satisfaction
2.3.1 Customer satisfaction
According to Richard Gerson and Machosky Brenda (1993, 5) customer satisfaction is
the customer’s perception that his or her expectations have been met or surpassed.
There are different dimensions in customer satisfaction. According to Hüseyin Güngör
(2007, 18) cognitive satisfaction dimension is how customers rationally calculate the
product or services they are receiving which are mostly related with the objective product
attributes like product quality and price. Emotional satisfaction is the hedonic or experi-
ential benefits that customers cannot calculate rationally or objectively. It is about trust
and relationship (cf. Robinette et al., 2001). Both cognitive and emotional satisfaction are
important for UPM Timber because they want their customers to be satisfied with the
10
quality and price but also to have emotional satisfaction to build long lasting relationships
and great trust in what they do.
Transactional satisfaction is event specific and can be defined as the post consumption
evaluative judgment of a particular transaction. General satisfaction is about all previous
transaction experiences over time. General satisfaction is thus the outcome of a learning
process where the customer learns from (or remembers) all previous transaction experi-
ences over time. (Güngör 2007, 19-20.) This research is focusing on general satisfaction
dimension by studying the current level of overall customer satisfaction of UPM Timber.
UPM Timber’s one goal is to establish long-term relationships with satisfied customers.
According to Richard Gerson and Brenda Machosky (1993, 30) this is established by
understanding and identifying customers’ needs, meeting and exceeding their expecta-
tions, closing or removing any perceptual gaps that may exist between what the business
believes was delivered and the customers believe was received, and trying continuously
to improve the service quality efforts a little bit at a time. This research will help UPM
Timber with service quality improvements and in closing these gaps between the business
and the customers and thereby to build long-term relationships.
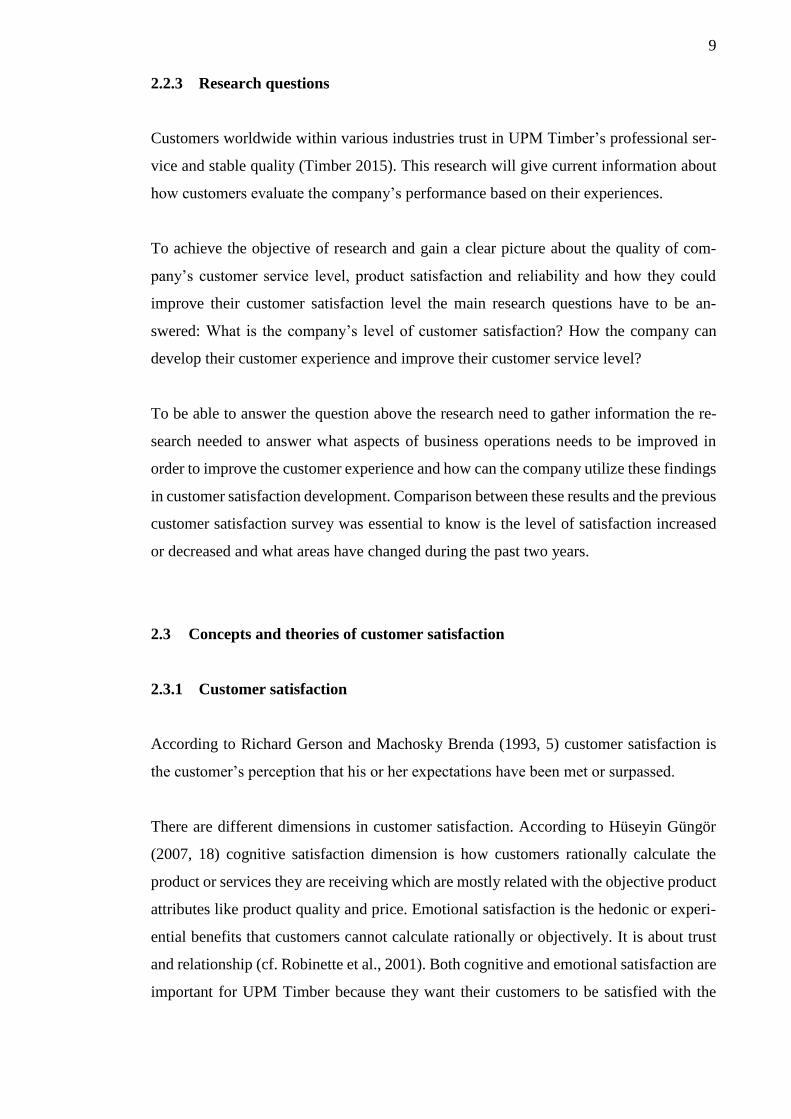
According to Derek Allen (2004, 2) improvements in product and service quality will
increase customer satisfaction which leads to desirable business outcomes (see Figure 1).
This assumption is also foundation to this research. By measuring customer satisfaction
level we can identify aspects in need of development and through them to increase the
satisfaction level and improve the company's operations.
FIGURE 1. Fundamental assumption driving customer satisfaction measurement (Allen
2004, 2)
11
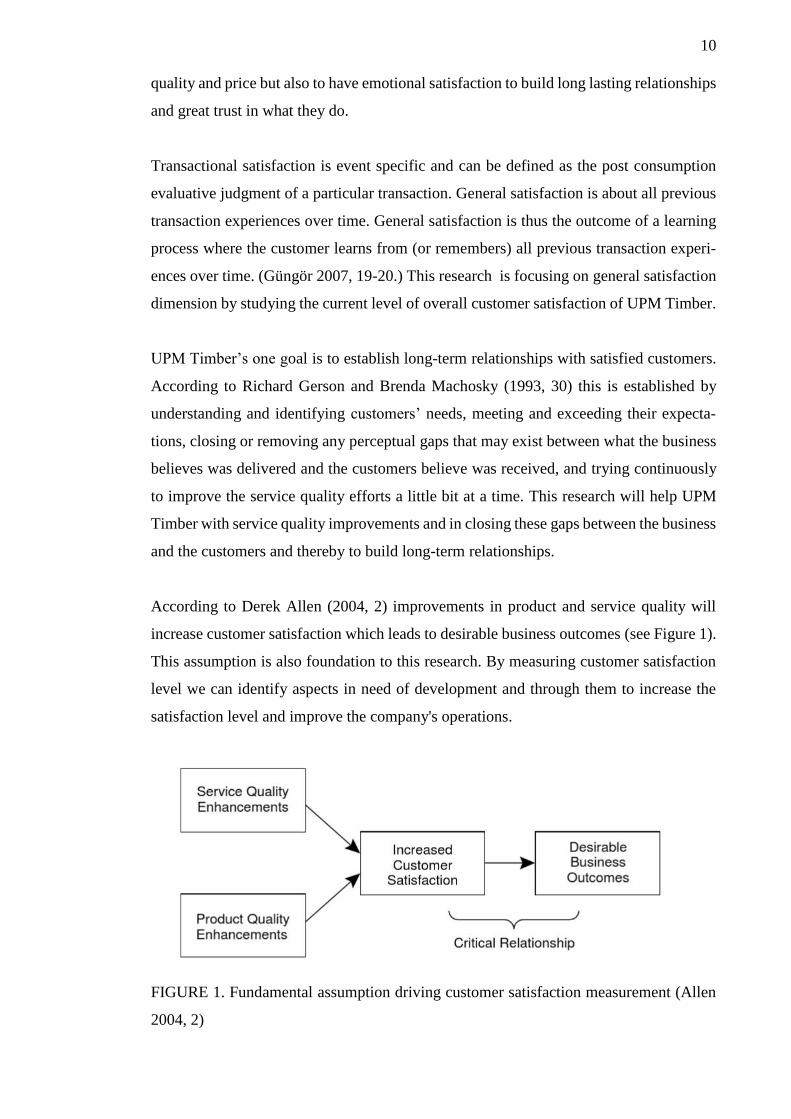
Figure 2 shows the relationship between customer satisfaction and business outcomes.
According to Derek Allen (2004, 116) customer satisfaction effects on business outcomes
and profitability directly by buying behavior and indirectly by customer retention. Un-
derstanding this relationship is essential for the research and its helps to understand rea-
sons for the development of customer satisfaction.
FIGURE 2. Customer satisfaction effect on business outcomes (Allen 2004, 116)
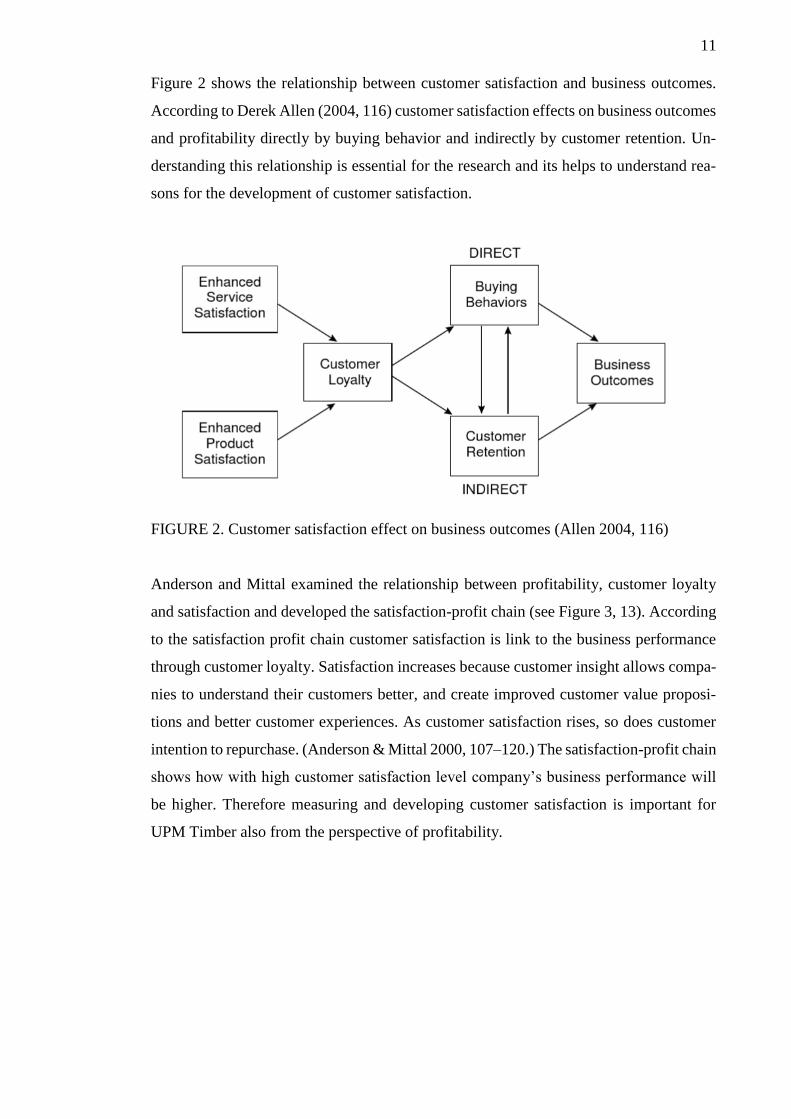
Anderson and Mittal examined the relationship between profitability, customer loyalty
and satisfaction and developed the satisfaction-profit chain (see Figure 3, 13). According
to the satisfaction profit chain customer satisfaction is link to the business performance
through customer loyalty. Satisfaction increases because customer insight allows compa-
nies to understand their customers better, and create improved customer value proposi-
tions and better customer experiences. As customer satisfaction rises, so does customer
intention to repurchase. (Anderson & Mittal 2000, 107–120.) The satisfaction-profit chain
shows how with high customer satisfaction level company’s business performance will
be higher. Therefore measuring and developing customer satisfaction is important for
UPM Timber also from the perspective of profitability.
12
FIGURE 3: The Satisfaction-Profit Chain (Anderson & Mittal, 2000)
2.3.2 Quality
The quality of the product is its ability to satisfy the needs and expectations of the cus-
tomer (Bergman & Klefsjö 1994, 16). The definition presented by Montgomery (1996):
Quality is the extent to which products meet the requirements of people who use them
(Hayes 2008, 1). According to Gerson and Machosky (1993, 12) there a distinct relation-
ship among quality, customer service and customer satisfaction because quality and ser-
vice are whatever the customer says they are and if you provide the these according to
your customer’s definitions, customer satisfaction will follow.
According to Morris Wilburn (2006, 3) brand image influences current customer and an
image of overall quality will make an owner more satisfied with a product. Company
image adds something intangible to purchasing, owning and using a product. UPM is a
big brand globally in the forestry industry and it gives overall high quality image to some
customers in Asia and Europe and especially in Finland. This also creates value for some
customers who are selling their products to end users who are aware of the brand.
It is conclusive that organizations that consistently deliver superior customer service gen-
erally enjoy more repeat business, less price elasticity, higher price points, more cross-
selling opportunities, greater marketing efficiency, and a host of other factors that usually
lead to earnings growth (DiJulius 2011, 8). Excellent customer service is one part of the
UPM Timber customer promise and they strive to be customer orientated throughout the
supply chain. With the current market prices of sawn timber, loyal customers who are not
13
so price sensitive and are willing to pay more for quality have been key factor in UPM
Timber’s profitability.
2.3.3 Customer relationship management
Customer relationship management is the combination of strategies and technologies that
empower relationship programs, reorienting the entire organization to a concentrated fo-
cus on satisfying customers (Boone & Kurtz 2015, 358). According to Ballantyne, Chris-
topher and Payne (2002,16) CMR is a strategic approach to improving shareholder value
through the development of appropriate relationships with key customers and customer
segments. Whereas according to Francis Buttle (2008, 15) CRM is the core business strat-
egy that integrates internal processes and functions, and external networks, to create and
deliver value to targeted customers at a profit.
An important rationale for CRM is that it improves business performance by enhancing
customer satisfaction and driving up customer loyalty. There is a compelling logic to the
model, which has been dubbed the ‘satisfaction–profit chain’. (Buttle 2008, 43.) For UPM
Timber great customer relationship management is important to the fundamental basis to
achieve their vision to be the customer’s number one choice and their strategic goals with
customers. Deeper strategic customer collaboration and higher share of volume to top
category customers are two main strategic goals of the company for the next four years
(Timber SBU Strategy 2016-2020). These can be only achieved by a great customer re-
lationship management.
The leaky bucket theory is the model that seeks to describe the process of customer gain
and loss, otherwise known as customer churn (Blythe 2009, 21). It shows how keeping
customers by filling the leaks in the bucket is more useful than continually acquiring new
customers to keep the bucket full. UPM Timber is currently focusing on retaining their
customers because they are selling all their capacity to their current customers. According
to Jim Blythe (2009, 21) customer retention is one of the key concepts in relationship
marketing but still most companies concentrate on recruiting new customers to replace
customers who move on, rather than seeking to retain customers.
14
Amy Gallo (2014) emphasizes the importance of keeping the right customers. Keeping
the right customer is valuable. Depending on which study you believe, and what industry
you’re in, acquiring a new customer is anywhere from five to 25 times more expensive
than retaining an existing one (Gallo 2014). Fred Reichheld also points out that biggest
opportunity to keep costs down for business is to building loyal relationships with cus-
tomers and other stakeholders and how small increase in customer retention can produce
high increase in profit. UPM Timber is also taking advantage of the customer retention
by building loyal and long-lasting relationships with customers and by categorising cus-
tomer in order to concentrate more on the top category customers.
2.3.4 Customer satisfaction and loyalty
Loyalty and long-term relationships with customers are important part of UPM Timber’s
strategy because they concentrate heavily on their current customers and they want to
have a stable position in their strategic markets. As widely agreed (e.g., Reichheld, 1993,
1996, 2001; Oliver, 1997; Heskett, Sasser, & Schlesinger, 1997) there are many positive
effects of customer loyalty such as revenue growth due to repurchases as well as referrals,
cost decline due to lower acquisition costs and serving experienced customers, and in-
crease in employee retention due to job satisfaction and pride (Güngör 2007, 14).
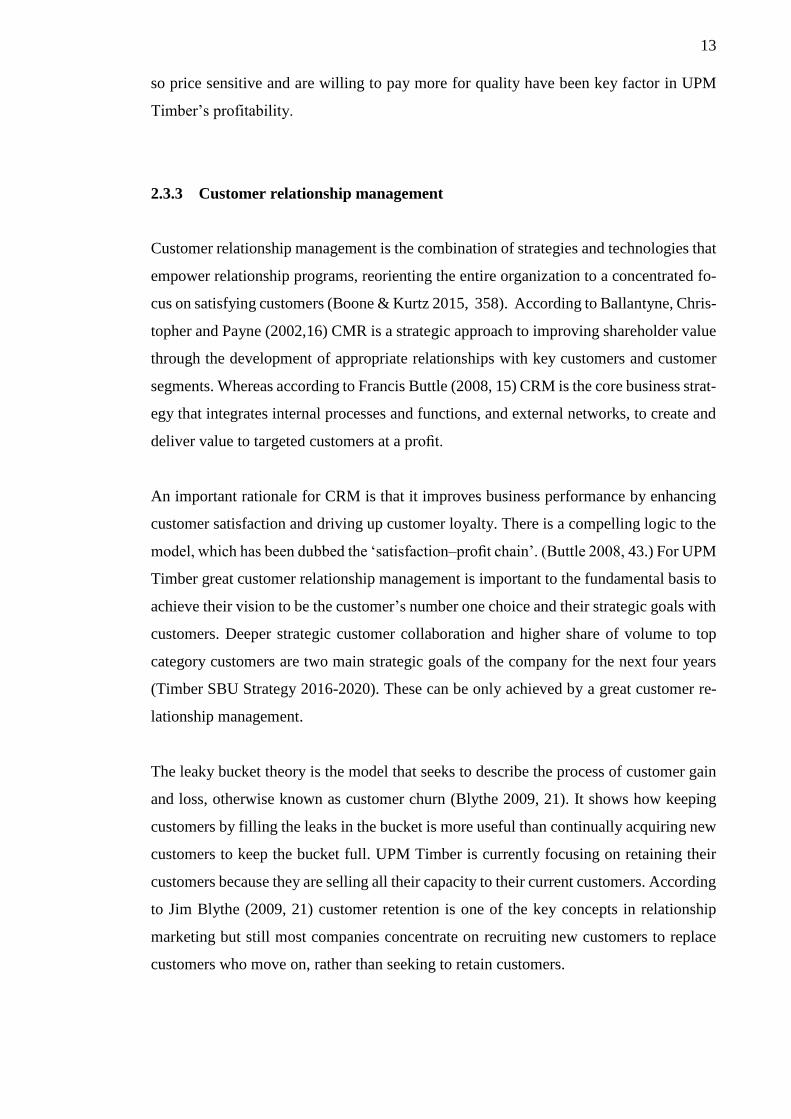
The American Customer Satisfaction Index (ACSI) is the world’s most comprehensive
assessment of customer sentiment (Barwise & Meehan 2004, 9). One of the most com-
pelling empirical linkages between customer satisfaction and profitability involves the
American Customer Satisfaction Index (ACSI) shown in Figure 4 on page 16, which as-
sumption is that for most companies repeat customers are a considerable profit source
(Allen 2004, 12-13). The theoretical framework ACSI model of customer loyalty starts
with customers expectation and perceived quality which affects the customer satisfaction
and perceived value of the product or service. Customer satisfaction, as measured by the
ACSI index, has two antecedents: customer complaints and, ultimately, customer loyalty
(Allen 2004, 13). This shows how researching customers’ expectations and perceived
quality can give information about the customer satisfaction level and how customer sat-
isfaction and loyalty are connected.
15
FIGURE 4. The ACSI model of customer loyalty (Allen 2004, 13)
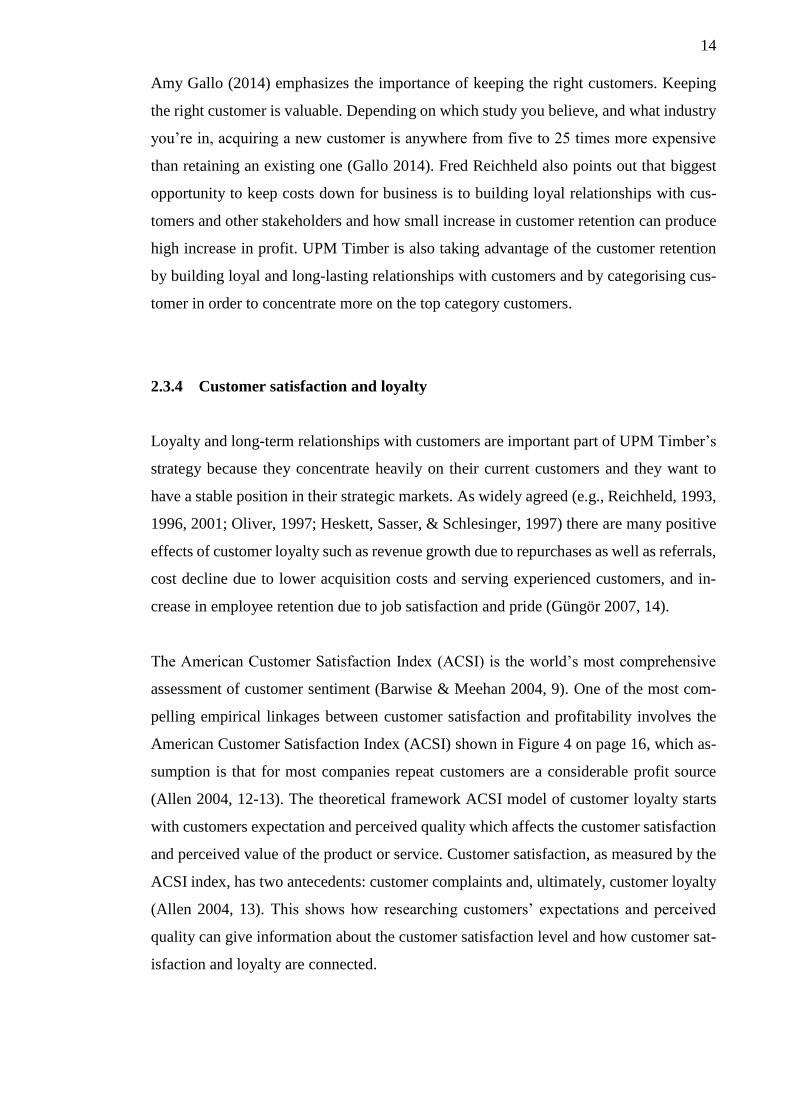
Derek Allen and Tanniru Rao suggested a causal chain for the relationship between loy-
alty and satisfaction which shows how customer satisfaction affect both affective and
cognitive loyalty (see Figure 5). The brand image perceptions directly affect the emo-
tional component of loyalty whereas value perceptions and customer satisfaction a have
an impact on the more rational aspects of loyalty. Finally, customer satisfaction and the
two loyalty measures directly affect customer retention. (Allen & Rao 2000, 8-9.)
FIGURE 5. Relationship between loyalty and satisfaction (Allen & Rao 2000, 9)
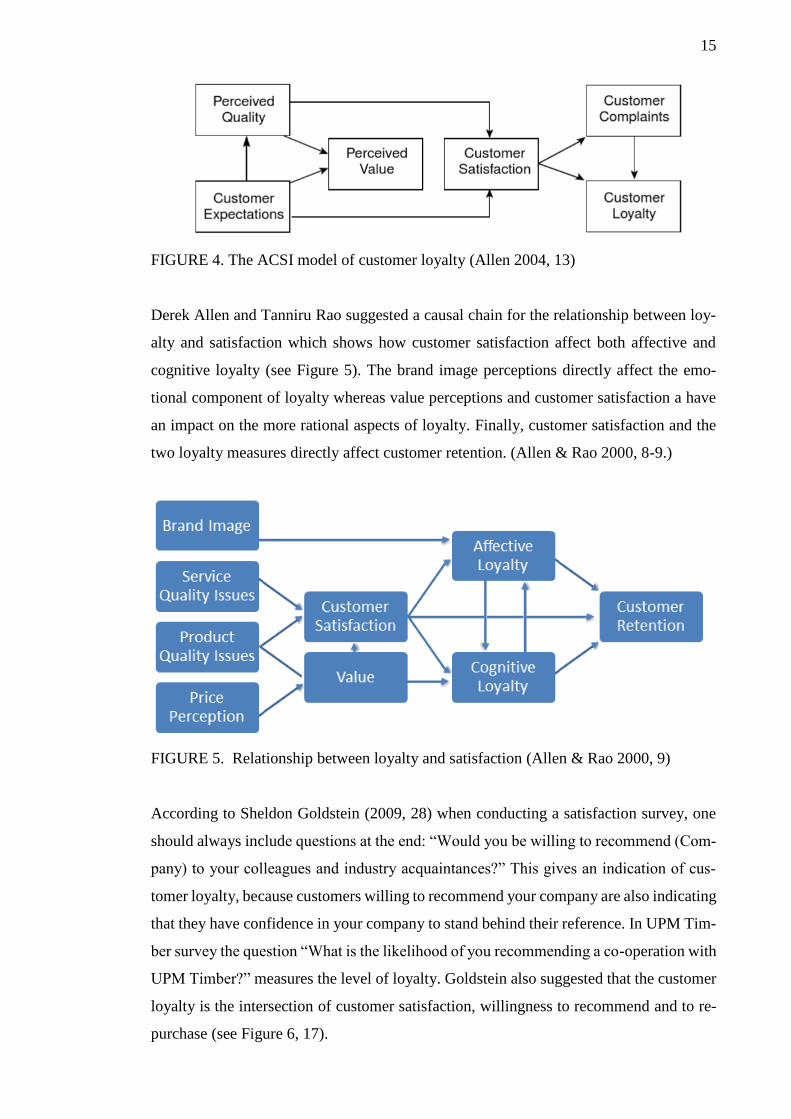
According to Sheldon Goldstein (2009, 28) when conducting a satisfaction survey, one
should always include questions at the end: “Would you be willing to recommend (Com-
pany) to your colleagues and industry acquaintances?” This gives an indication of cus-
tomer loyalty, because customers willing to recommend your company are also indicating
that they have confidence in your company to stand behind their reference. In UPM Tim-
ber survey the question “What is the likelihood of you recommending a co-operation with
UPM Timber?” measures the level of loyalty. Goldstein also suggested that the customer
loyalty is the intersection of customer satisfaction, willingness to recommend and to re-
purchase (see Figure 6, 17).
16
FIGURE 6. Customer loyalty (Goldstein 2009, 28)
2.4 Research data
2.4.1 Data collection
The research is conducted as a quantitative research. Quantitative data allows to establish
baselines for performance and compare performance (Goldstein 2009, 8). To achieve the
purpose of research UPM Timber is conducting customer satisfaction survey to its cus-
tomers. The quantitative data from customer satisfaction surveys is usually a response by
the customer to a question about an attribute that the company provides to its customers
(Goldstein 2009, 13). The aim of this study is to measure customer satisfaction in cus-
tomer service, quality of products, delivery reliability, communications and customer ex-
perience. The survey is planned on the basis of the focus areas and the topics of the survey
are service in sales, products and deliveries, communications and relationship and value.
UPM Timber has conducted a master's thesis about the most important attributes for the
customers. The questions and the studied attributes are being chosen on the basis this
master's thesis. With these topics and attributes the research gives the management a clear
picture of customer satisfaction in different aspects.
Web-based survey is a good way to conduct UPM Timber’s customer satisfaction survey
because it is an effective and fast way to gather responses from worldwide customer base.
17
If the sample size is fairly large and widely distributed geographically online administra-
tion is the best option. Access to the appropriate list makes an online survey a reasonable
choice. (Ritter & Sue 2007, 5.) In addition, Valerie Sue’s and Ritter Lois’s arguments
supported the decision of data collection method. The survey invitations are sent out
based on a closed customer lists which are checked by the sales people. According to Ron
Kenett and Silvia Salini (2011, 90) these surveys are particularly appropriate for research
among clients for instance customer satisfaction.
According to Bob Hayes (2008, 76) benefits of collecting customer feedback using web-
based surveys are that it is relatively inexpensive to conduct and response rates are typi-
cally higher than for other methods because they are easier to complete and respondents
can respond at their own convenience. Convenience is significant factor when choosing
the data collecting method because our target population is full of busy people. Web-
based surveys also give immediate information how many people and how have they
responded to the survey which is essential for this research. It enables the process of get-
ting answers from each country and sending reminders to non-respondents and sales team
to contact the right customers. In addition to tracking who replied, with survey software
you also should be able to limit replies to one respondent (Ritter & Sue 2007, 17).
In this research the data is collected by a web-based questionnaire survey. The customer
satisfaction survey is done online by using the Qualrtics, the online survey software tool.
There is an option of paper survey for countries with specific needs. The survey has seven
language option; English, Finnish, French, German, Italian, Chinese and Japanese. With
web-based survey and seven language options it is possible to reach all customers world-
wide and to maximize questionnaire responses. This helps the management to allocate
development funds to the right area and dealt with country specific problems. This re-
search is also exploiting the data collected in previous customer satisfaction surveys.
The survey is sent to 337 selected customers from 31 countries on 1st of April and the
survey is open at least for three weeks, if needed four weeks. The target population of this
survey is UPM Timber’s key customers who buys their products frequently. This target
group includes directors, purchaser and purchasing managers, managing directors, pro-
duction managers and full-time sales assistants in these companies who work closely with
UPM Timber.
18
Obtaining high response rates can be challenging when conducting online survey research
(Sue & Ritter 2007, 93). The response rates for Web-based surveys are approximately
30%, but the studies are limited in number (Sue & Ritter 2007, 8). The goal of the research
is to get 135 responses to reach 40% response rate. To reach the same response rate 30,9%
as in year 2014 the survey needs to get 105 responses. In order to maximize the response
rate the survey is designed to be short only with the essential questions. After one week
follow-up reminders will be sent to non-respondents and later on the sales people remind
the customers who haven’t yet responded to the survey after the reminder message.
2.4.2 Data analysis
The quantitative data of the research is analysed by correlation and cross tabulation. Re-
sponse differences between different countries and continents can be effectively analysed
with cross tabulation. Comparative analysis is used to compare the differences in 2016
and 2014 survey results. Statistical data is processed with Tixel and Qualtrics. Statistical
Programme Tixel is an extension of Excel, which is designed to analyse statistics. The
online survey software Qualtrics offers cross tabulation tool for multivariate analysis. The
research also includes qualitative analysis of open-ended questions.
In addition to comparative, correlation and cross tabulation analysis this research is using
quadrant analysis and net promoter score to analyse the data. Integrating a basic analysis
with more advanced tools, provides insights into non-obvious patterns and important re-
lationships between the survey variables which can significantly affect findings and rec-
ommendations derived from a survey (Kenett & Salini 2011, 3-4).
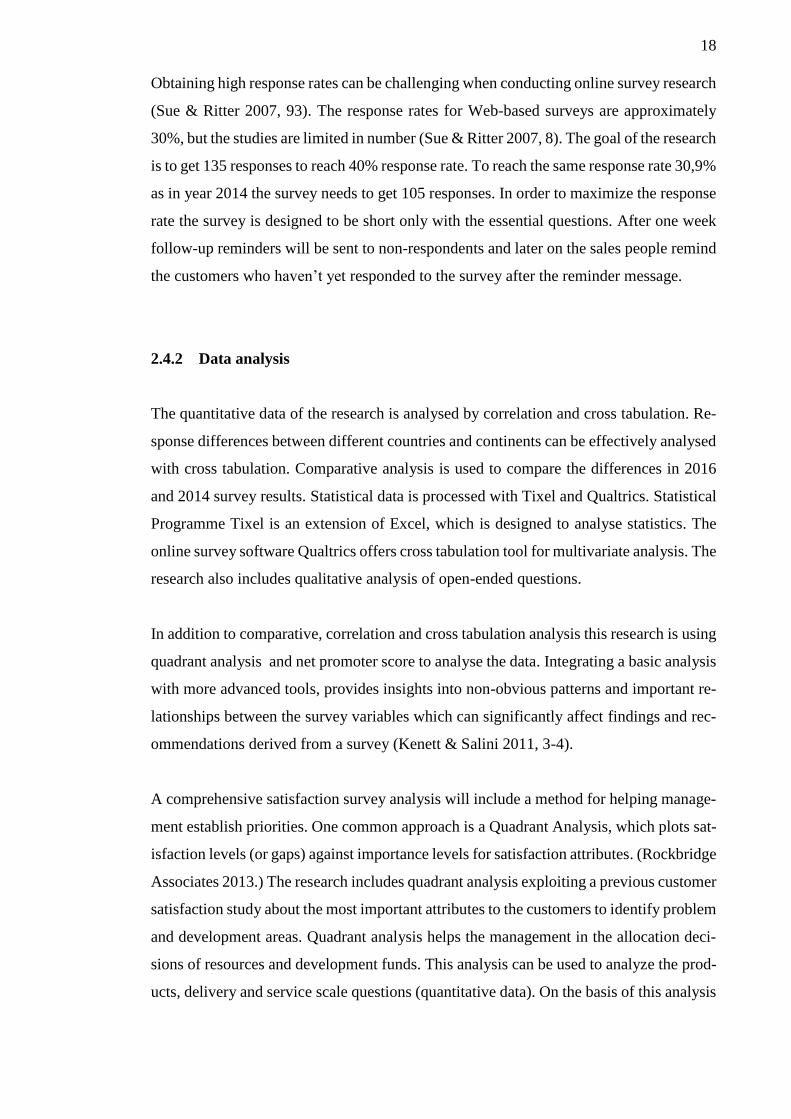
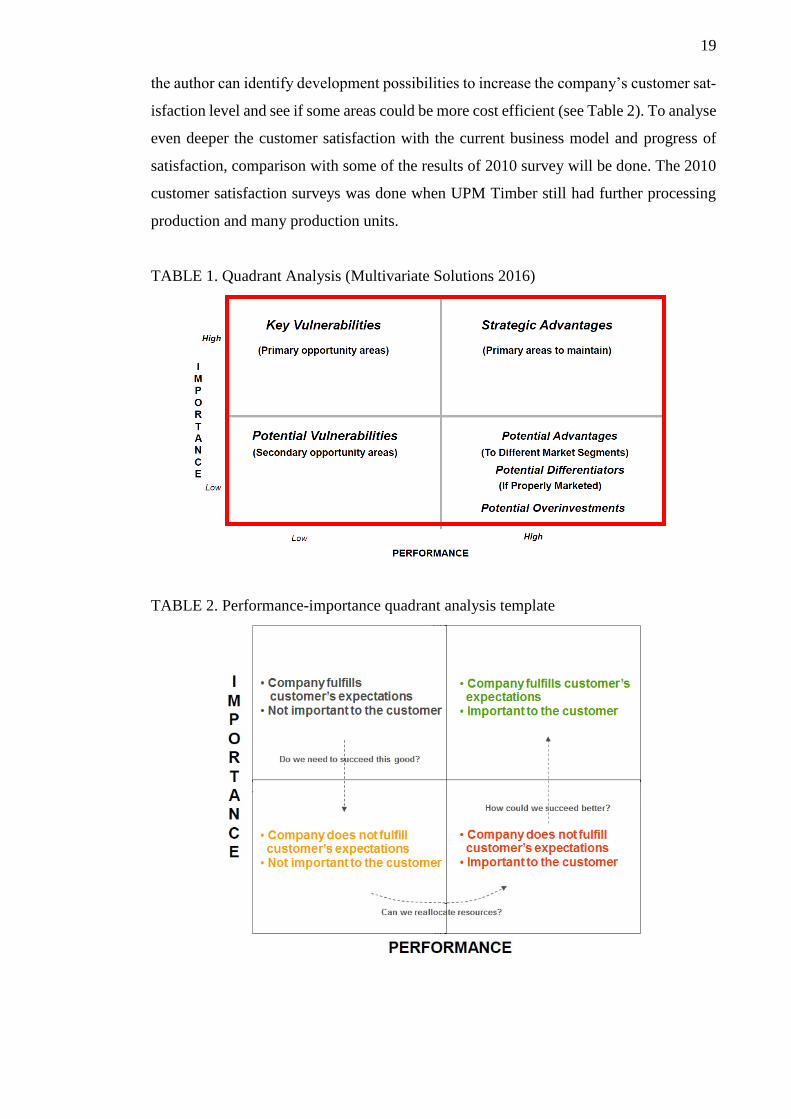
A comprehensive satisfaction survey analysis will include a method for helping manage-
ment establish priorities. One common approach is a Quadrant Analysis, which plots sat-
isfaction levels (or gaps) against importance levels for satisfaction attributes. (Rockbridge
Associates 2013.) The research includes quadrant analysis exploiting a previous customer
satisfaction study about the most important attributes to the customers to identify problem
and development areas. Quadrant analysis helps the management in the allocation deci-
sions of resources and development funds. This analysis can be used to analyze the prod-
ucts, delivery and service scale questions (quantitative data). On the basis of this analysis
19
the author can identify development possibilities to increase the company’s customer sat-
isfaction level and see if some areas could be more cost efficient (see Table 2). To analyse
even deeper the customer satisfaction with the current business model and progress of
satisfaction, comparison with some of the results of 2010 survey will be done. The 2010
customer satisfaction surveys was done when UPM Timber still had further processing
production and many production units.
TABLE 1. Quadrant Analysis (Multivariate Solutions 2016)
TABLE 2. Performance-importance quadrant analysis template
20
Bain's Net Promoter System is based on the fundamental perspective that every compa-
ny's customers can be divided into three categories. "Promoters" with score from 10 to 9
are loyal enthusiasts who praise the company to friends and colleagues. "Passives" with
score from 8 to 7 are satisfied but unenthusiastic customers who can be easily wooed by
the competition. And "detractors" with score 6 or lower are unhappy customers. (Bain &
Company) For UPM Timber loyalty is essential to gain the long lasting relationships and
keep their current customers from strategist markets.
The Net Promoter Score of a company is the percentage of promoter minus the percentage
of detractors (Bain & Company). Net Promoter Score is using scale from 10 to 0 so with
the survey scale from poor to very good need to be converted to numbers. Therefore an-
swers “very good” represents promoters and “good” answers are passives. And compa-
nies with “fair” or “poor” answers are detractors. We need to keep in mind and take into
account in the calculations that because the scale four of the survey cannot be divided by
to eleven so the amount of detractors is less and amount of promotors is more than with
the actual results. NPS with a low-response-rate surveys process can lead to confusing
and misleading results (Reichheld & Markey 2011, 110). Therefore, the response rate
have to be taken into account also.
2.4.3 Limitations of the research
It is important that researchers recognize internet surveys’ opportunities and limitations
so that they may make informed decisions when selecting a data collection method (Rit-
ter & Sue 2007, 3). With online surveys there are some limitations to the research. In
web-based surveys some customers might give quick answers and not think so much
about the questions or even skip some of the questions. Cultural differences and custom-
ers’ honesty also play a role in the limitations of the research.
High response rate eliminates the possibility of unit non-response error. Ron Kenett and
Silvia Salini (2011, 43) define unit non-response as the choice not to participate in the
survey by a population unit that has been selected for the survey. Because target popula-
tion is selected the challenge is to get enough responses from these specific population
units. With low response rate the research have too small sample from the target popula-
tion which may lead to sampling error or even to the results of the survey being unusable
21
for generalization. Therefore, customers will get actively reminders about the survey from
the sales team and by email. In addition, personalized invitations to the survey will moti-
vate more customers to response.
Item non-response error occurs when the unit does not respond to specific items and there
is missing answer to one or more questions in the questionnaire (Kenett & Salini 2011,
42-44). This error is very probable because some customers might skip one or two ques-
tions in the questionnaire. In small numbers this error will not be a limitation for the
research. But in case for example if many customers leaves the questionnaire unfinished
there might be a big item non-response error in the last questions which will affect the
validity of the research.
In web-based surveys there is also the problem of abandonment. Respondents can easily
quit in the middle of a questionnaire (Ritter & Sue 2007, 13). Therefore, the questionnaire
is design to be short and to the point. Valerie Sue and Ritter Lois suggested that if the
questionnaire is easy to navigate and fun to complete respondents are less likely to quit
the questionnaire. To test the navigation of the survey and overall flow the survey will be
sent to 35 UPM Timber’s employees from different units for preliminary testing.
Cultural differences can be a limitation to the research. Morris Wilburn (2006, 95) states
that comparing responses from different countries can be problematic because the cultural
differences. The issue here is that a given point on a rating scale may not correspond to
the same intensity of attitude in all the countries which can occur for many reasons; for
example, one country may have cultural norms against making extreme statements. This
should be taken into account when analyzing the results especially with respondent from
Japan and China where the cultural norm is to be more over polite when giving feedback.
Because of the anonymity that web-based survey gives, the cultural differences have only
a small impact to the research. Online survey gives respondents better environment to be
truthful compared to face-to-face or phone interviews. Survey also highlights the ano-
nymity by stating that the name and the company boxes are optional. In addition, rather
than giving a scale from 1 to 9 minimizing the scale option to four options helps with the
correspondence problem.
22
2.5 Thesis process
Chapter 3 explains in detail how the survey was designed and executed and gives back-
ground information about the previous studies of customer satisfaction in the company.
In chapter 3 there is also information about the company and the forestry industry in Fin-
land.
Chapter 4 discusses the results of the survey and shows key findings in the comparison
between 2014 and 2016 customer satisfaction surveys. It also includes the quadrant anal-
ysis and the net promoter score.
Chapter 5 concludes the research by identifying the key findings of the research and anal-
yses how the company can utilise these findings in their customer satisfaction develop-
ment.
Chapter 6 is a summary of the research process.
23
3 WEB-BASED SURVEY QUESTIONNAIRE AND UPM TIMBER
3.1 UPM Timber and the forest industry
UPM Timber is part of the UPM-Kymmene Oyj company. UPM is a global bio and forest
industry company with personnel in 45 countries and production in 13 countries. UPM's
business structure consists of six business areas: UPM Biorefining, UPM Energy, UPM
Raflatac, UPM Specialty Papers, UPM Paper ENA (Europe & North America), UPM
Plywood, UPM Biocomposites and UPM Biochemicals. In the UPM Biorefining business
area, UPM combines integrated production of pulp, renewable diesel and sawn timber
with a supply chain of wood raw material (UPM-Kymmene Oyj 2016). UPM’s products
are based on renewable raw materials and are recyclable. UPM leads the integration of
bio and forest industries into a new, sustainable and innovation-driven future and their
products offer alternatives to replace non-renewable fossil-based materials (UPM-Kym-
mene Oyj 2016). UPM’s sales in 2015 were 10,1 billion and 20 percentage of the sales
were generated by Biorefining business area (UPM-Kymmene Oyj 2016, 4).
UPM Timber is one of the leading sawn timber producers in Finland and they sell sawn
timber worldwide. UPM Timber employs around 410 people and is headquartered in
Tampere, Finland (UPM Timber 2016). All sawn timber produced by UPM Timber can
be sold either as PEFC™ or FSC® certified. They have four sawmills in Finland:
Alholma in Pietarsaari, Kaukas in Lappeenranta, Korkeakoski in Juupajoki and Seikku in
Pori. There are currently 77 industrial sawmills in Finland and the biggest sawmill is
UPM Kaukas with annual production capacity of 510,000 million cubic meters of red-
wood and whitewood sawn timber. UPM Timber production volume of 1.5 million m3 is
0,5% of the global softwood volumes and approximately 15% of the Finnish volumes
(Timber SBU Strategy 2016-2020). Therefore, UPM Timber is a big part of the Finnish
sawmilling industry and has an important role in the forest industry.
24
3.1.1 The forest industry in Finland
The forestry industry is one of the biggest industrial sectors in Finland and it has substan-
tive effect in the Finnish economy. The forest industry is a major contributor to wellbeing
in Finland and it is the main source of income for many regions. The sector accounts for
approximately 20 per cent of Finland’s export revenue and it directly employs about
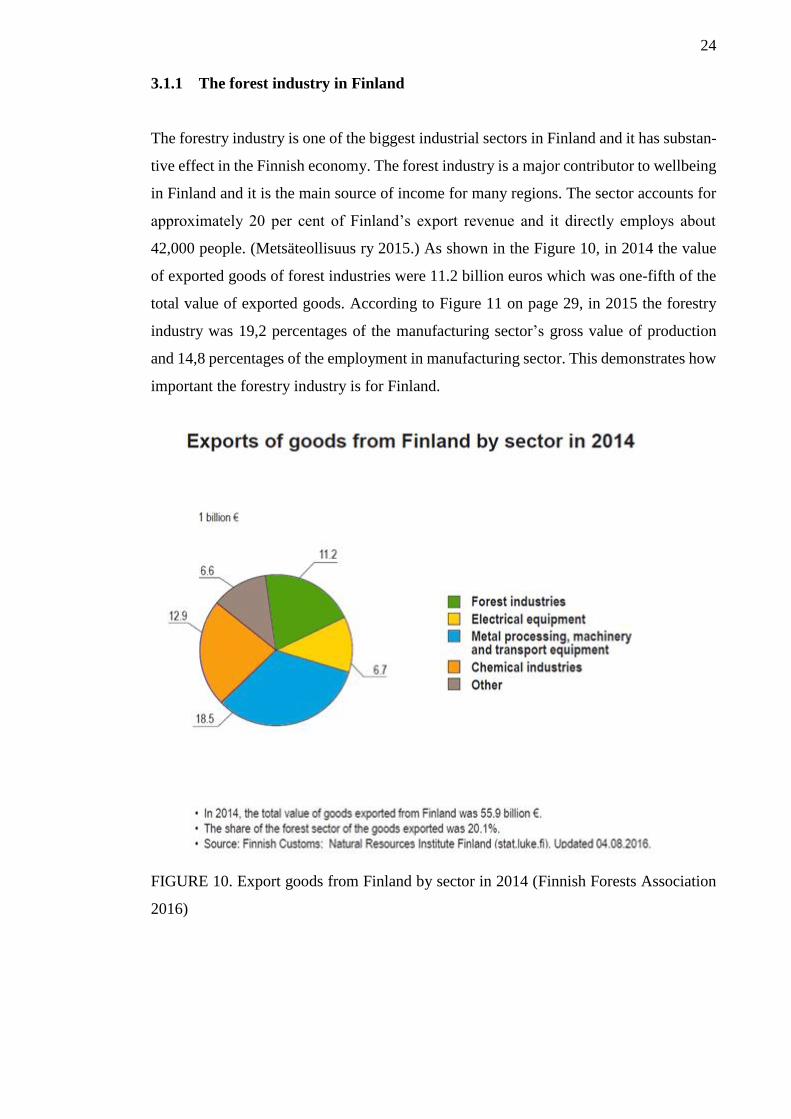
42,000 people. (Metsäteollisuus ry 2015.) As shown in the Figure 10, in 2014 the value
of exported goods of forest industries were 11.2 billion euros which was one-fifth of the
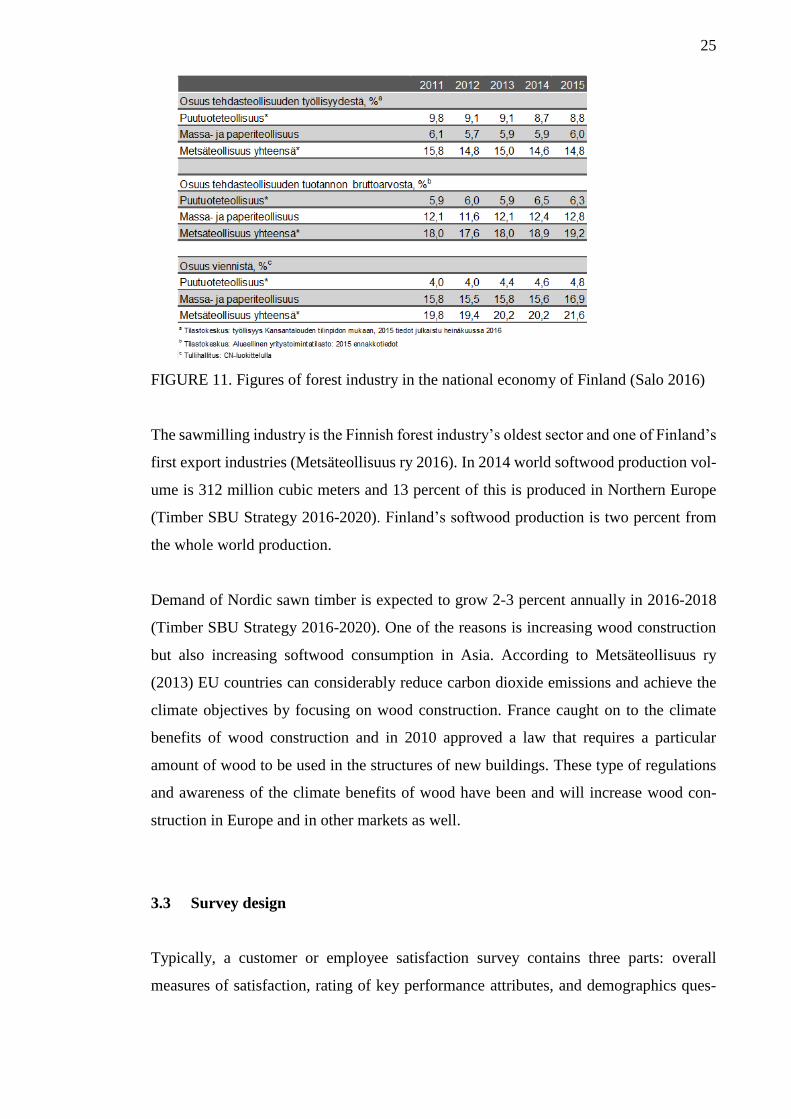
total value of exported goods. According to Figure 11 on page 29, in 2015 the forestry
industry was 19,2 percentages of the manufacturing sector’s gross value of production
and 14,8 percentages of the employment in manufacturing sector. This demonstrates how
important the forestry industry is for Finland.
FIGURE 10. Export goods from Finland by sector in 2014 (Finnish Forests Association
2016)
25
FIGURE 11. Figures of forest industry in the national economy of Finland (Salo 2016)
The sawmilling industry is the Finnish forest industry’s oldest sector and one of Finland’s
first export industries (Metsäteollisuus ry 2016). In 2014 world softwood production vol-
ume is 312 million cubic meters and 13 percent of this is produced in Northern Europe
(Timber SBU Strategy 2016-2020). Finland’s softwood production is two percent from
the whole world production.
Demand of Nordic sawn timber is expected to grow 2-3 percent annually in 2016-2018
(Timber SBU Strategy 2016-2020). One of the reasons is increasing wood construction
but also increasing softwood consumption in Asia. According to Metsäteollisuus ry
(2013) EU countries can considerably reduce carbon dioxide emissions and achieve the
climate objectives by focusing on wood construction. France caught on to the climate
benefits of wood construction and in 2010 approved a law that requires a particular
amount of wood to be used in the structures of new buildings. These type of regulations
and awareness of the climate benefits of wood have been and will increase wood con-
struction in Europe and in other markets as well.
3.3 Survey design
Typically, a customer or employee satisfaction survey contains three parts: overall
measures of satisfaction, rating of key performance attributes, and demographics ques-
26
tions (Chisholm, 1999). UPM Timber’s customer satisfaction survey starts with de-
mographics questions. The questionnaire is structured in five parts which measures key
performance attributes: Demographics, Products and deliveries, Service in sales, Com-
munications and Relationship and value. The part of products and deliveries is focused
on quality and its stability, consistency of grading and delivery reliability. In the service
in sales the focus is on customer service, accuracy of sales documentation and on the daily
work and professionalism of area managers and sales office personnel. And the last part
of the survey focuses on the value of products and services and the relationship with UPM
timber in addition to overall performance.
According to Ritter and Sue (2007, 90) the survey invitation should explain why the sur-
vey is important and inform the reader of the approximate time needed to complete the
survey. Therefore, the cover letter clearly states the purpose of the survey and the time
estimate to complete it (see Appendix 1). The cover letter which worked as invitation to
the survey was signed by Director of Sales and Supply Management to motive customers
to response to the survey and to create image of important message. For further details
look at the Appendix 1. Cover Letter of the customer satisfaction survey.
The survey had matrix tables, open-ended and multiple choice questions. The questions
about products and deliveries and service were design to matrix tables with scale of four
from very dissatisfied to very satisfied. The three questions about relationship and value
were also in matrix table with scale of four from poor to very good. Communications part
had two simple multiple choice questions with yes or no options. Open-ended questions
were used to investigate further why respondent was not satisfied and to get improvement
suggestion to UPM Timber’s sales and supply-chain services and to level of service in
general.
The survey started with four demographics questions. The name of the company and re-
spondent’s name questions were highlighted to be optional. The matrix table about prod-
ucts and delivery had seven questions and one open-ended questions if the respondent
answered very dissatisfied to at least one questions. The same question came with the
same logic after service matrix table to get detailed information about respondents dissat-
isfaction. The service sections had eight questions in the matrix table. The second and
third parts of the survey were ended with general open-ended question about improve-
ments in sales and supply-chain services. In the communications part’s first question, if
27
the respondent answered “No”, there opened open-ended question how UPM Timber
could improve marketing and communications. Over all there was 11 questions and 3
additional questions. If you count all the questions in the matrix tables there were 26
questions in the questionnaire. For further details look at the Appendix 2. UPM Timber
Customer satisfaction survey 2016.
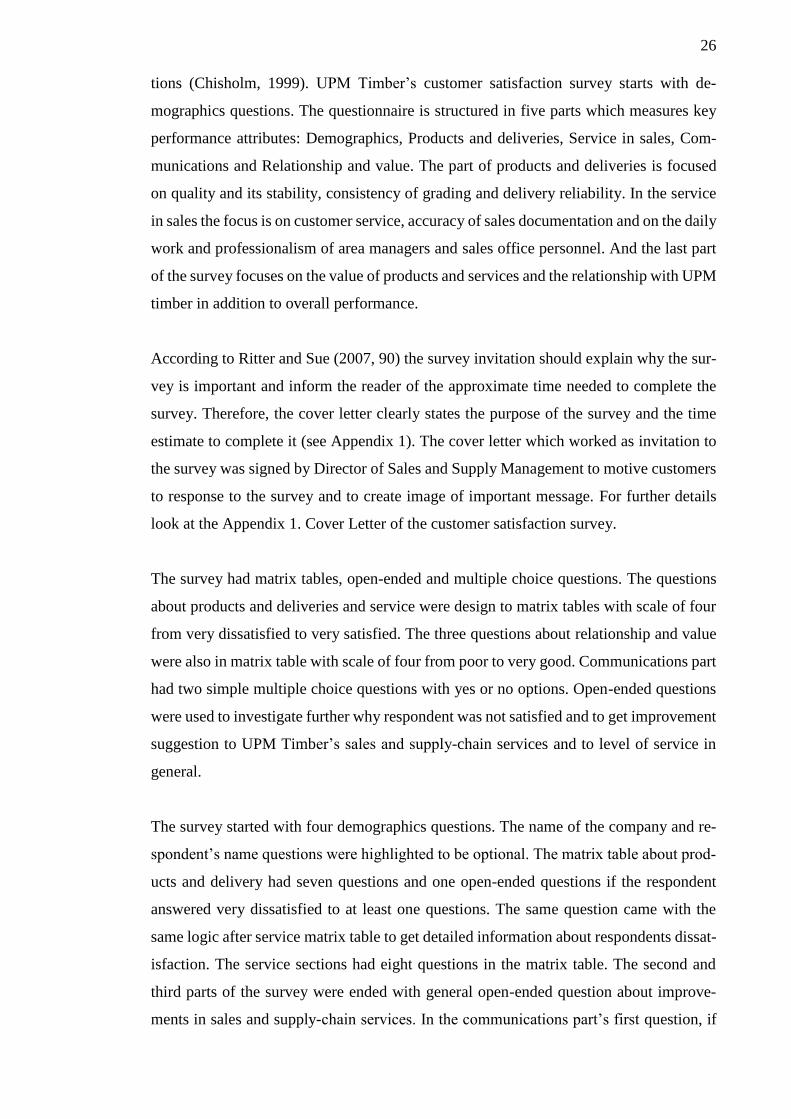
Quality dimensions availability, responsiveness, timeliness, completeness and pleasant-
ness of support that Bob Hayes (2009, 13) listed are important to take into account in
designing the survey (see Figure 12, 32). Therefore, the questionnaire survey have ques-
tions about all these areas. For example the question are sales assistants service-minded
and professional deals with the pleasantness of the support (see Appendix 2, 2). These
dimensions were also mentioned in the master’s thesis about the most important attributes
for customers.
FIGURE 12. Some quality dimensions for staff support areas and their definitions (Hayes
2009, 13)
At the end of the survey these was a thank you message explaining how respondents
answers are important and why (see Appendix 2, 4). Short but pleasant ending message
gives a good impression of the company and the respondents feel appreciated.
28
3.4 Survey execution
Link to the survey in the e-mail invitation makes the survey easily accessible and it is also
an interactive approach, is personal, and can provide the respondents with anonymity
(Ritter & Sue, 89). Therefore, the survey link was send by email from communication
managers email. By this invitations going to a spam folder was avoided and invitations
came from a familiar person. In addition, according to Ritter Lois and Valerie Sue (2007,
5) responses to online surveys are greatest when respondents are first contacted by e-mail.
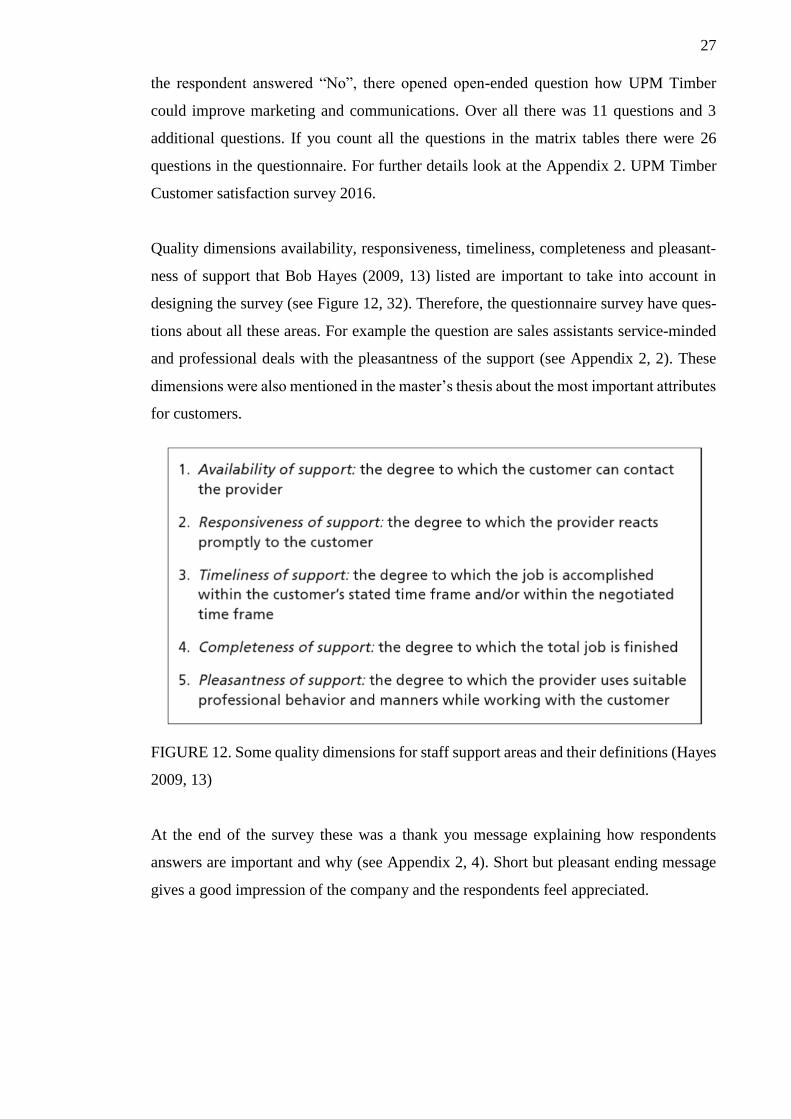
The email invitations were sent in 1st of September. The email had link to the survey’s
with the same language as the invitation was depending on the customers country. Most
of the invitations were in English (see Table 3, 33), but for example to Algeria and Mo-
rocco the invitations were in French and to three customers in Poland they were in Ger-
man.
TABLE 3. Customers by the survey language
Survey language
%
English 40,06
French 25,52
Finnish 13,95
German 10,09
Chinese 3,86
Japanese 3,56
Italian 2,97
After one week the reminders were sent by email to all non-respondents. After this the
sales people received list of non-respondents so they could remind their customers when
you are contacting them. After three weeks to achieve higher response rate the survey
was continued by week. Informing about longer opening of the survey work as a reminder
to those who haven’t yet responded to the survey. Couple of days before closing of the
survey sales people got the current non-respondent lists to increase the response rate of
their country or area. By continuing the opening days of the survey with a week, responses

29
increased by 34 and the response rate went up from 30,6% to 40,7%. Out of 337 custom-
ers 136 responded to the survey and the overall response rate was 40,7% which is higher
than the 30% average of online surveys.
30
6 SUMMARY
The purpose of thesis was fulfilled and this thesis gave the company’s management a
clear view of the company’s customer satisfaction level and will help them with decision
making and how to allocate the development funds. The objective of gathering infor-
mation about UPM Timber’s customer satisfaction to get a clear picture about the quality
of the company’s performance in different aspects and how they could improve their cus-
tomer service level was achieved. The data collection by web-based surveys was really
successful and the company should you use it also in the future because it is cost effective
way to reach their global customer base. Overall the research was success and it provided
all the wanted knowledge and answered all the research questions.
If the satisfaction survey was performed again the questionnaire could have questions
about the easiness of doing business with the company, representative’s availability and
about product range and specifications which were the topic in many open comments. All
of these are also important factors in customer satisfaction. UPM Timber should also
consider other survey tools in the future which have options to show the percentage or
length of the survey on each page so that the respondents see how far are they in finishing
the survey. This will reduce the problem of abandonment in the middle of a questionnaire.
The online survey tool could also have more visual options to make the survey more
attractive.
According to Kenett and Silini (2011, 6) annual customer satisfaction surveys are con-
ducted in order to identify key drivers of satisfaction and prioritize actions, to compare
data over time to identify patterns in customers’ experiences and also to disseminate the
results throughout the appropriate audiences within the company to drive change within
the organization. To ensure long-term commitment and loyalty of customers and UPM
Timber’s vision to be customer’s number one choice their customer satisfaction need to
be at high level. Also according to Nink Marco (2013) unless companies actively monitor
the strength of their customer relationships, few know they have a problem until it's too
late. Therefore, customer satisfaction development is essential to their strategy and long
term goals. Their customer satisfaction should be continued to be monitored and meas-
ured in the future, preferably annually to get the most benefits from it.
31
REFERENCES
Abalo, J., Varela, J. & Vicente, V. 2007. Importance values for Importance–Performance
Analysis: A formula for spreading out values derived from preference rankings. Journal
of Business Research 60, 115–121. Spain: University of Santiago de Compostela & Uni-
versity of Sevilla.
Allen, D. & Rao, R. 2000. Analysis of customer satisfaction data: a comprehensive guide
to multivariate statistical analysis in customer satisfaction, loyalty, and service quality
research. Milwaukee: ASQ Quality Press. 8-9
Allen, D. 2004. Customer Satisfaction Research Management: A Comprehensive Guide
to Integrating Customer Loyalty and Satisfaction Metrics in the Management of Complex
Organizations. Milwaukee, US: ASQ Quality Press. 2, 12-13, 31-32, 116
Gallo, A. 2014. The Value of Keeping the Right Customers. Harvard Business School
Publishing. Read 15.9.2016. https://hbr.org/2014/10/the-value-of-keeping-the-right-cus-
tomers
Anderson E. & Mittal V. 200. Strengthening the Satisfaction-Profit Chain. Journal of Ser-
vice Research 3 (2), 107-120.
Bain & Company. Measuring Your Net Promoter Score. Net Promoter System®. Read
08.09.2016. http://www.netpromotersystem.com/about/measuring-your-net-promoter-
score.aspx
Ballantyne, D., Christopher, M. & Payne, A. 2002. Relationship Marketing, Creating
Stakeholder Value. Oxford: Butterworth-Heinemann Elsevier. 16
Barwise, P. & Meeham, S. 2004. Simply better: winning and keeping customers by de-
livering what matters most. Boston, MA: Harvard Business School Press. 9
Beard, R. 2014. Why customer satisfaction is important. Released 20.1.2014. Read
31.8.2016. http://blog.clientheartbeat.com/why-customer-satisfaction-is-important/
Bell, D., McBride, P. & Wilson, G. 1994. Managing quality. Oxford: Butterworth-Heine-
mann. 180, 208
Bergman, B. & Klefsjö, B. 1994. Quality: from customer needs to customer satisfaction.
Lund: Studentlitteratur. 15-16
Blythe, J. 2009. Key Concepts in Marketing. London: SAGE Publications Ltd. 21
Boone, L. & Kurtz, D. 2014. Contemporary Marketing. 16th edition. Update 2015. Man-
son, Ohio: Cengage Learning. 358
Brunila, O. & Hämäläinen, E. 2015. Suomen sahateollisuuden logistiikka. Brahea Centre
at the University of Turku. 11
Buttle, F. 2008. Customer relationship management: concepts and technologies. 2th edi-
tion. Oxford: Butterworth-Heinemann Elsevier. 15, 43
32
Cates, T. 2013. Five Tips for Creating Relationships That Drive Sales. MarketingProfs
LLC. Read 24.10.2016. http://www.marketingprofs.com/articles/2013/11420/five-tips-
for-creating-relationships-that-drive-sales
Chisholm, J. 1999. Using the Internet to measure customer satisfaction and loyalty. Edited
by Ron Zemke and John A. Woods. Best Practices in Customer Service. New York:
AMACOM. 305-317
CustomerGauge. General Electric. NPS® Benchmarks. Read 25.20.2016.
https://npsbenchmarks.com/general_electric
DiJulius, J. 2011. What's the Secret?: To Providing a World-Class Customer Experience.
1st edition. Hoboken, US: Wiley. 8
Finnish Forests Association. 2016. Forest industry. Read 12.10.2016
http://www.smy.fi/en/forest-fi/graphs/forest-industry/
Gerson, R. & Machosky, B. 1993. Measuring Customer Satisfaction. Menlo Park, US:
Course Technology / Cengage Learning. 5, 12
Goldstein, S. 2009. Superior Customer Satisfaction and Loyalty: Engaging Customers to
Drive Performance. Milwaukee, US: ASQ Quality Press. 8, 13, 28
Güngör, H. 2007. Emotional Satisfaction of Customer Contacts. Amsterdam, NL:
Vossiuspers UvA. 14, 19-20
Hansen, E. and Weinfurter, S. 1999. Softwood lumber quality requirements: Examining
the supplier/buyer perception gap. Wood and Fiber Science. Volume 31(1), 91
Hayes, B. 2008. Measuring Customer Satisfaction and Loyalty: Survey Design, Use, and
Statistical Analysis Methods. 3rd edition. Milwaukee, US: ASQ Quality Press. 1, 13, 76
Keller, K. & Kotler, P. 2006. Marketing Management. 12th edition. Upper Saddle River,
New Jersey: Prentice-Hall. 144
Kenett, R. & Salini, S. 2011. Statistics in Practice: Modern Analysis of Customer Sur-
veys: with Applications using R. Edition one. Hoboken, GB: Wiley. 3-4, 6, 37, 42-44, 90
Lang, S. 2016. Does cultural bias affect your survey responses?. Clicktools. Read
8.11.2016. http://www.clicktools.com/cultural-bias-affect-your-surveys/
Leszinski R. & Marn M. V. 1997. Setting value, not price. McKinsey & Company. Read
17.11. 2016. http://www.mckinsey.com/business-functions/marketing-and-sales/our-in-
sights/setting-value-not-price
Linton, I. 2016. Why Is Quality Important for a Business?. Houston Chronicle. Read
24.10.2016. http://smallbusiness.chron.com/quality-important-business-57470.html
Metsäteollisuus ry. 2013. Puun käyttö luo kilpailukykyä koko EU:lle. Read 27.9.2016.
http://www.metsateollisuus.fi/tietoa-alasta/puutuoteteollisuus-ja-puurakenta-
minen/saha_ja_levyteollisuus/Puun-kaytto-luo-kilpailukykya-koko-EU-lle-212.html
33
Metsäteollisuus ry. 2015. The Finnish forest industry in figures. Read 28.9.2016.
http://www.forestindustries.fi/statistics/The-Finnish-forest-industry-in-figures-
1274.html
Metsäteollisuus ry. 2016. Saha- ja levyteollisuus. Read 28.9.2016.
http://www.metsateollisuus.fi/tietoa-alasta/puutuoteteollisuus-ja-puurakenta-
minen/saha_ja_levyteollisuus/
Multivariate Solutions. 2016. Customer Satisfaction Measures. Read 12.09.2016.
http://www.mvsolution.com/wp-content/uploads/Customer-Satisfaction-Measures.pdf
Nink, M. 2013. B2Bs Win by Building Relationships, Not Selling on Price. Gallup. Read
4.11.2016. http://www.gallup.com/businessjournal/165389/b2bs-win-building-relation-
ships-not-selling-price.aspx
Neely, A. 2002. Business Performance Measurement: Theory and Practice. Cambridge:
Cambridge University Press. 280
Pulido, A., Stone, D. & Strevel, J. 2014. The three Cs of customer satisfaction: Con-
sistency, consistency, consistency. McKinsey & Company. Read 17.11.2016.
http://www.mckinsey.com/industries/retail/our-insights/the-three-cs-of-customer-satis-
faction-consistency-consistency-consistency
Reichheld, F. & Markey, B. 2011. The ultimate question 2.0: how net promoter compa-
nies thrive in a customer-driven world. Boston, MA: Harvard Business Review Press ©
2011. 110
Reichheld, F. 2011. Prescription for Cutting Costs. Read 15.9.2016.
http://www.bain.com/Images/BB_Prescription_cutting_costs.pdf
Ritter, L. & Sue, V. 2007. Conducting Online Surveys. Los Angeles: SAGE Publications.
3, 5, 7-8, 13, 17, 89-90, 93
Rockbridge Associates. 2013. Measuring the Importance of Customer Satisfaction At-
tributes. Read 06.09.2016. http://rockresearch.com/measuring-the-importance-of-cus-
tomer-satisfaction-attributes/
Sahateollisuus ry. 2016. Sahatavaran vienti TOP20 maat 2015. Read 10.10.2016.
http://www.sahateollisuus.com/sites/all/files/media/tiedostot/suomi_top20_2015.pdf
Sahateollisuus ry. 2016. Suomen vientituotteet TOP10. Read 10.10.2016.
http://www.sahateollisuus.com/sites/all/files/media/tiedostot/suomi_top10_vien-
tituoteet_2014_2015b.pdf
Salo, R. 2016. Metsäteollisuus Suomen kansantaloudessa. Metsäteollisuus ry. Read
12.10.2016. http://www.metsateollisuus.fi/tilastot/toimialat/10-Metsäteollisuus
Sheh, R. 2013. Transit Capacity and Quality of Service Manual. The Rulebase Founda-
tion.
Satmetrix Systems. What Is Net Promoter?. Net Promoter System®. Read 24.20.2016.
https://www.netpromoter.com/know/
34
UPM-Kymmene Oyj. 2016. About us. Read 9.10.2016. http://www.upm.com/About-
us/Pages/default.aspx
UPM-Kymmene Oyj. 2016. Annual Report 2015. 4
UPM-Kymmene Oyj. 2016. UPM Group presentation.
UPM Timber. Published 2015. Read 31.8.2016. www.upmtimber.com
UPM Timber. 2015. Sustainable timber products. 3-5.
UPM Timber. 2016. Kotimaan asiakaspäivä
UPM Timber. 2016. Timber SBU Strategy 2016-2020.
UPM Timber. 2016. UPM TIMBER alueellinen merkitys.
UPM Timber. 2016. UPM Timber presentation.
Wilburn, M. 2006. Managing the Customer Experience: A Measurement-Based Ap-
proach. Milwaukee, US: ASQ Quality Press. 3, 95