Embed Size (px)
Citation preview
International Journal of Information Technology and Business Management 29
th May 2014. Vol.25 No.1
© 2012 – 2014 JITBM & ARF. All rights reserved
ISSN 2304-0777 www.jitbm.com
79
A COMPARATIVE ANALYSIS OF CUSTOMER SATISFACTION
RATINGS OF TELCO PRODUCTS AND SERVICES AMONG UDS
STUDENTS IN GHANA
Dr. Gordon Terkpeh Sabutey1, Moses Dumayiri
2 and Dr. A. A. Saah
3
1Head of Department & Lecturer, Procurement and Marketing, School of Business and Law, University for
Development Studies, Wa Campus, Ghana / Adjunct Lecturer, Institute of Distance Learning, Kwame Nkrumah
University of Science and Technology, Kumasi, Ghana. 2Assistant Lecturer, Department of Banking and Finance, School of Business and Law, University for Development
Studies, Wa Campus, Ghana 3Research Fellow & Head of Department, Centre for E-Learning Technologies, Institute of Distance Learning,
Kwame Nkrumah University of Science and Technology (KNUST), Kumasi, Ghana.
Abstract
This study seeks to assess overall customer satisfaction and loyalty as well as sustainability of products and service
quality delivered by Mobile Telecommunication Network and Vodafone to students of University for Development
Studies. The problem of this study was whether customers are satisfied with Telco service delivery in Ghana.
Specifically, this study sets out to figure out various Telco products and services offered to customers, examine the
sustainability of the company’s products and services and to look at the marketing strategies and mechanisms put in
place to satisfy and maintain customers. The main research designs used for the study were survey and case study. A
Structured questionnaire was used to collect data from hundred (100) individual subscribers selected from the two
Telecom groups via cluster and simple random sampling procedures. Descriptive statistics and one way Analysis of
Variance were used for the data analysis. The findings indicated that irrespective of mobile telecom network on
University for Development Studies Tamale Campus, customer satisfaction was low; neither equal to nor better than
desire and expectation of customers. Overall Customer Satisfaction ratings among subscribers of Mobile
Telecommunication Network in University for Development Studies significantly differ and that relatively, customers
of Mobile Telecommunication Network rated their satisfaction with service quality higher than those of Vodafone.
The management of Mobile Telecommunication Network and Vodafone would need to develop strategies to deal
with the customer dissatisfaction. The research contributes to the body of knowledge in the area of Customer
Satisfaction in the Ghana’s Telco groups and provides important managerial implications.
Keywords: Comparative Analysis, Customer Satisfaction Ratings, ANOVA, UDS Students
1.0 INTRODUCTION
Historically, state-owned incumbent operators
provided telecommunication services on a monopoly
basis in most markets in the past.
Telecommunications operators were treated as part of
public administration along with postal services and
licenses were not considered as necessary. In many
cases licenses for incumbent telecommunications
operators were prepared as part of the privatization
process [9]. However, in recent times, many
telecommunication networks operate in Ghana;
among them are Vodafone, Tigo, MTN, Airtel,
Kasapa and Glo. Mobile telecommunication service
International Journal of Information Technology and Business Management 29
th May 2014. Vol.25 No.1
© 2012 – 2014 JITBM & ARF. All rights reserved
ISSN 2304-0777 www.jitbm.com
80
provision is increasingly becoming a lucrative
business venture, making competition very keen.
MTN is the market leader in the increasingly
competitive mobile telecommunications industry in
Ghana followed by Vodafone.
The Gaps or Problem that called for this study were
clearly identified as the fact that customers mostly
complain of dissatisfaction among Telco Groups. It is
often not uncommon among subscribers complaining
of unsatisfactory services making them indifferent
regarding which network to use leading to multi-SIM
card usage. This has culminated to multi-SIM card
usage by subscribers on the premise that any of the
networks can “disappoint at any time.” As leading
service providers in Ghana, with MTN subscriber
base hitting 10 million about 54% in 2010 of the
whole market share while that of Vodafone was
about 4.2 million, we cannot afford to ignore them in
matters regarding national development since
communication is a vital tool in the development of
nations.
In views of the above problem, the research sought to
undertake a comparative study to assess the state of
customer satisfaction with both MTN and Vodafone
products and services. Specifically, the objectives for
study seeks to: identify various products and services
MTN and Vodafone offer to their customers; identify
both MTN and Vodafone customers most preferred
product or service; to discover and analyse the
reasons for the use of multiple sim card, examine the
extent of subscribers satisfaction and loyalty with
both MTN and Vodafone products and services;
examine the sustainability of the companies’ products
and services; and examine the marketing strategies
and mechanisms put in place to satisfy and maintain
customers so as to recommend possible solutions to
address and minimize these gaps, enhance business
operations among Telco Groups and provide
literature to promote teaching and learning in schools
and colleges across the globe.
In order to achieve these objectives, the study was
structured on the following questions: What products
and services do MTN and Vodafone provide to its
customers? Which product or service is the most
preferred choice among MTN and Vodafone
customers? How satisfied and loyal are the
subscribers to MTN and Vodafone products and
services? How sustainable are the products and
services MTN and Vodafone provide to its
customers? What are the marketing strategies and
mechanisms put in place to satisfy and maintain
customers.
The study is important in many ways to marketing
practitioners, policy makers and customers. To
management of mobile telecom networks, this
research will become a document that can serve as a
guide for corporate service to improve on its services.
This study will provide a more reliable perspective
for evaluating the level of their customer satisfaction
with the services they deliver. It will also serve as an
invaluable source of information that brings to light
the switching intention of their customers. It will
uncover dimensions of service quality that customers
consider as important as well as customers’ intentions
to switch to networks of their competitors and
provide support for management strategic decisions
in several critical areas of operation as well as
creating and delivering customer value, achieving
customer satisfaction and loyalty and building long
term relationship with profitable customers. To
policy makers like government agencies such as
National Communication Authority and ministry of
communication, the findings of this study will
provide an insight into a more reliable guide to
monitoring the impact of Telco Groups.
2.0 THEORETICAL FRAMEWORK
The following provide the theoretical and conceptual
framework for the study:
2.1 Customers satisfaction in mobile Telecom
networks in Ghana
The state of customer satisfaction with service
delivery is not clear as there is scanty documentation
of the issue. According to a discussion paper on
telecommunication development and investment in
Ghana [4], the authors noted that the goals set by the
government have only partly been met - especially
with respect to development in the rural areas – and
quality of service is still low. There is therefore, a
wide spread dissatisfaction with the general telecom
development in Ghana among users and decision
makers.
International Journal of Information Technology and Business Management 29
th May 2014. Vol.25 No.1
© 2012 – 2014 JITBM & ARF. All rights reserved
ISSN 2304-0777 www.jitbm.com
81
2.2 Customer satisfaction and Behaviour intention
Customer satisfaction (CS) impacts the behavior of
customers in a number of ways. First, CS is found to
be a key determinant of customer detention [17].
Again, according to [14] CS is regarded as a
necessary antecedent of customer loyalty, which in
turn drives profitability and performance. It must be
pointed out that, customer loyalty and retention are
not always attributable to customer satisfaction. It is
because a customer may not be satisfied with the
service/product but may find it difficult to switch to a
competitor because of the circumstances he/she is
faced with. This is most common in most services
context. For example, with mobile telecom service a
customer may be reluctant to change his phone
number because he has given it to a number of
persons in his business or social life. Such a customer
may be dissatisfied but may be compelled to stay
loyal.
2.3 Disconfirmation models
Disconfirmation models are models that suggest that
customer satisfaction/dissatisfaction is the disparity
that exist between the performance of a
product/service and some cognitive or emotional
standards of the customer. [12] was the first to
propound and develop the expectancy
disconfirmation theory. The theory has been tested
and confirmed in several studies [15]. According to
expectation disconfirmation theory, customers after
consuming a product/service compare their
perception of product/service performance against
their expectation before the service encounter. When
outcome or perceived performance is equal to
expectation, confirmation occurs. Negative
disconfirmation occurs when perceived performance
of product/service is less than expected. Customer
satisfaction occurs by confirmation of consumer
expectation and dissatisfaction is caused by
disconfirmation of consumer expectations.
Within the disconfirmation school of thought, more
recent researches revealed that desire instead of
expectation in comparison with perceived
performance should be used in determining customer
satisfaction [15]. Therefore, desire disconfirmation
has been suggested as a better substitute. Desire and
expectation are both cognitive standards and it is not
clear which one provides a better explanation of CS.
[6] propose in an empirical justified study, a
contingency theory that incorporates both expectation
and desire disconfirmation. They conclude that both
desire and expectation simultaneously affect overall
customer satisfaction (OCS). This view was also
supported by [3].
2.4 Integrated marketing communication (IMC)
Integrated marketing communications (IMC) is a
process for managing customer relationships that
drive brand value primarily through communication
efforts [13]. Such efforts often include cross-
functional processes that create and nourish
profitable relationships with customers and other
stake-holders by strategically controlling or
influencing all messages sent to these groups and
encouraging data-driven, purposeful dialog with
them. IMC includes the coordination and integration
of all marketing communication tools, avenues, and
sources within a company into a seamless program in
order to maximize the impact on end users at a
minimal cost [1]. This integration affects all firms’
business-to-business, marketing channel, customer-
focused, and internally directed communications [7]
[5].
Promotion is one element of marketing mix
components or tools embraced by businesses. This
element has its own tools that include advertising,
sales promotion etc. For example, MTN promotes
phones with free airtime and personal selling
activities, sim cards, modems etc. It also includes
internet or online and offline marketing. Integration
of all these promotional tools, along with other
components of marketing mix, is a way to gain an
edge over a competitor. Online marketing channels
include any e-marketing campaigns or programs on
search engines including email, internet radio, and
internet TV. Offline marketing channels are
traditional print (newspaper, magazine), mail order,
public relations, industrial relations, billboard,
traditional radio, and television. A company develops
its integrated marketing communication programmer
using all the elements of the marketing mix (product,
price, place, and promotion). Integrated marketing
communications plans are vital to achieving success
[2].
2.4.1 IMC components
Integrated marketing communication tools include:
advertising management, advertising design:
International Journal of Information Technology and Business Management 29
th May 2014. Vol.25 No.1
© 2012 – 2014 JITBM & ARF. All rights reserved
ISSN 2304-0777 www.jitbm.com
82
theoretical frameworks and types of appeals;
advertising design: message strategies and
executional frameworks; advertising media selection.
Promotional Tools also comprise trade promotions,
consumer promotions, personal selling, database
marketing, and customer relations management;
public relations and sponsorship programs, whereas
integration tools utilizes internet Marketing [6].
2.5 Marketing mix components (Variables)
The Internet has changed the way business is done in
the current world. The variables of segmentation,
targeting and positioning are addressed differently.
The way new products and services are marketed
have changed even though the aim of business in
bringing economic and social values remain
unchanged. Indeed, the bottom line of increasing
revenue and profit are still the same. Marketing was
once seen as a one way where firms broadcast their
offerings and value proposition. Marketing efforts
incorporate the "marketing mix, i.e. tools or
variables".
There are 7 Marketing Ps or tools the business
employs to augment its operations. These are:
Product, price, place, promotion, people, processes
and physical evidence. Businesses are to understand
what the consumer's wants and needs are. The
product characteristics have to match the specifics of
what someone wants to buy. Hence, the concept to be
noted is consumer, but not product because the taste
and preferences are important. Price (Cost to
Consumer) assists the business to understand the
consumer's cost to satisfy the want or need. Place
(Convenience) is the buying experience that relates to
delivery mechanism. Convenience may include
aspects of the physical or virtual location, access
ease, transaction service time, and hours of
availability. Moreover, promotion (communication)
is the mechanism put in place to make
communication effective to attract customers or
consumers as well as augment business or services
operations.
The other three Ps such as people, processes and
physical evidence is a marketing strategy tool that
expands the number of controllable variables from
the four [4] originally mixed model to seven [7]. The
traditional marketing mix model was primarily
directed and useful for tangible products, for
example, in the case of MTN, black berry product,
modem, and promotion phones. The 7Ps model is
more useful for services industries of which Telco
groups are not exclusive and arguably also for
knowledge-intensive environment. People directly or
indirectly involve in the consumption of a service are
an important part of the extended marketing mix.
Knowledgeable workers, employees, management
and other consumers often add significant value to
the total product or service offered. Process is a flow
of activities by which services are consumed. The
MTN, Vodafone, etc. follow a strategic process to get
its products and services consumed by its subscribers
through the marketing mix components. Also,
Physical Evidence is the ability and environment in
which the service is delivered, both tangible goods
that help to communicate and perform the services
(e.g. MTN internet service) and intangible experience
of existing customers and the ability of the business
to relay that customer satisfaction to potential
customers [2] [16].
2.6 Relationship marketing
This term was first defined as a form of marketing
developed from direct response marketing campaigns
which emphasizes customer retention and
satisfaction, rather than a dominant focus on sales
transactions. According to [8], [11] suggest that there
are four distinct types of marketing: Transactional
marketing which talks about exchange of values
between two parties; Database marketing which talks
about market transaction and information exchange,
interaction marketing which talks about face-to-face
interaction between customers and representatives of
the supplier; and finally, net-work marketing also
talks about a marketing or sales personality creating
mutual interest and strong relationship among
stakeholders, for example, customers, suppliers,
insurance companies and advertisers.
As a practice, relationship marketing recognizes the
long term value of customer relationships and
extends communication beyond intrusive advertising
and sales promotional messages. The overall goals of
relationship marketing are to find, attract and win
new clients, nurture and retain those the company
already has, entice former clients back into the fold,
and reduce the cost of marketing and client service as
practiced by Telco Groups. Relationship marketing
nowadays, denotes a company-wide business strategy
embracing all client-facing departments like
telecommunication customer care unit and marketing
International Journal of Information Technology and Business Management 29
th May 2014. Vol.25 No.1
© 2012 – 2014 JITBM & ARF. All rights reserved
ISSN 2304-0777 www.jitbm.com
83
department and even beyond. When an
implementation is effective; people, processes, and
technologies including the other components of the
marketing mix work in synergy to increase
profitability, and reduce operational costs.
3.0 MATERIALS AND METHODS
3.1 Research design and study population
[10] Indicated clearly that the research design serves
as a framework or blueprint for conducting marketing
or business research. It specifies the details of the
procedures necessary for obtaining the information
needed to structure or solve research problems. This
study therefore, employed the qualitative and
quantitative approach to conduct the research.
Specifically, the case study and the survey designs
were used. The target population in this study was
made up of students of University for Development
Studies, 2010/2011 academic year admitted. Seven
thousand and twenty eight (7,028) fresh university
students were enrolled to pursue various academic
programmes both degree and diploma. In this
research the accessible population was made up of
students of the UDS on Tamale campus. The UDS
operates with four (4) campuses in Tamale,
Nyanpkala, Navrongo in Upper East Region and Wa
in the Upper West Region. The campuses are similar
in character so the study obtained valid and reliable
results with a degree of true reflection on all students
in the UDS.
3.2 Sample size and sampling techniques
A sample of 100 respondents was selected for the
study. A total of 50 male and female students each
were sampled from UDS, Tamale campus. At least
each faculty was fairly represented. This was possible
through cluster, simple random and purposive
sampling techniques. For purposes of gathering
reliable and representative data, every female and
male student in each category had an equal chance of
being selected.
3.3 Data processing and analysis
The Raw data from the field were coded and entered
into the SPSS spread sheet where appropriate
transformation and processing was done. Data was
analyzed using descriptive statistics and one way
Analysis of Variance (ANOVA).
4.0 EMPIRICAL RESULTS AND
DISCUSSIONS
4.1 Socio-Demographic Characteristics of
respondents
The socio-demographic variables considered in this
study include age, gender and marital status of the
respondents.
4.1.1 Distribution of the respondents by age
In respect of the respondents age, Table 1 shows that
majority (73%) of the of the respondents are found
within the age cohort of 21-30 years while the
remaining 12%,10%, 3% and 2% fall within the age
range of under 20 years, 21-30years, 31-40years, 41-
50 and 50+, respectively. This age distribution clearly
depicts the youthful nature of the students. Young
people participate in different activities which require
them to use Product and Services offered by the
Telco groups.
4.1.2 Distribution of the respondents by Gender
The distribution analysis of the respondents by
gender shows that 32.0% of the respondents were
males and 68.0% were females. This gave an idea
that both males and females on UDS campus
consume products and services accessible from MTN
and Vodafone as indicated in the Table 1.
4.1.3 Distribution of the respondents by marital
status
The survey conducted on MTN and Vodafone cell’s
customers on UDS campus indicated that 12.0% of
the respondents were married while 86.0% were
singles. Only 2% of the respondents divorced.
Irrespective of marital status and age, most people
require products and services from
telecommunication networks like MTN and
Vodafone.
International Journal of Information Technology and Business Management 29
th May 2014. Vol.25 No.1
© 2012 – 2014 JITBM & ARF. All rights reserved
ISSN 2304-0777 www.jitbm.com
84
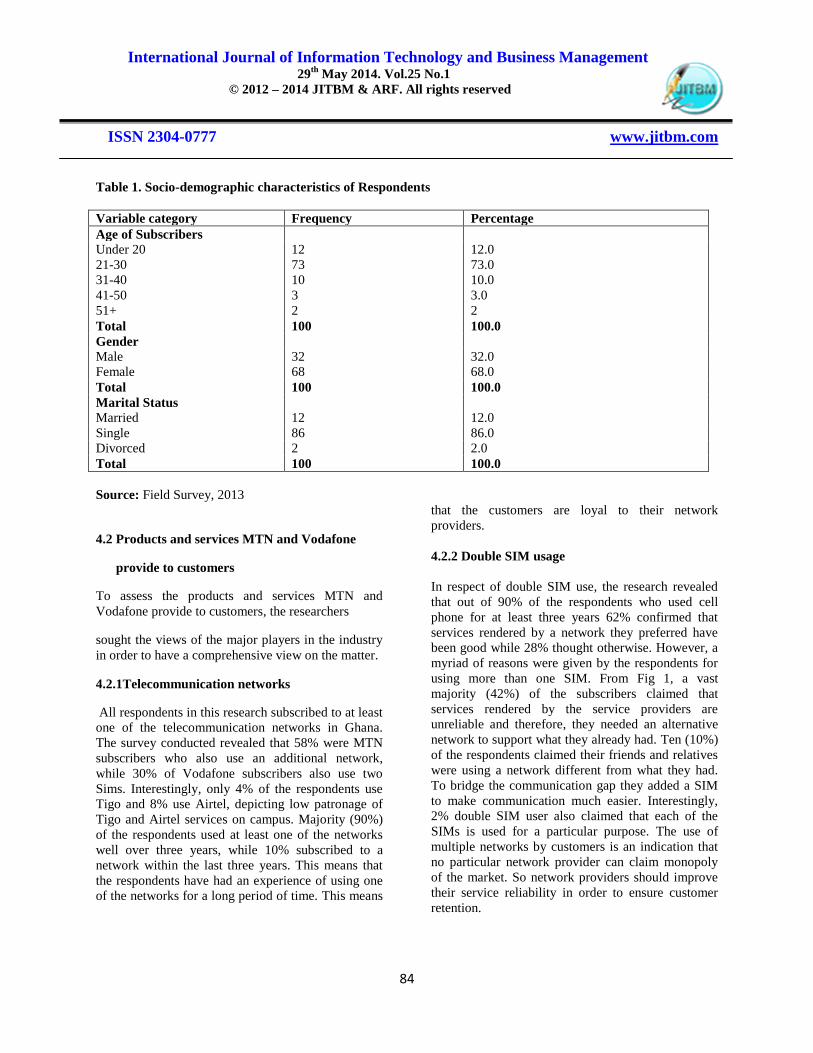
Table 1. Socio-demographic characteristics of Respondents
Variable category Frequency Percentage
Age of Subscribers
Under 20 12 12.0
21-30
31-40
41-50
51+
73
10
3
2
73.0
10.0
3.0
2
Total 100 100.0
Gender
Male 32 32.0
Female 68 68.0
Total 100 100.0
Marital Status
Married 12 12.0
Single 86 86.0
Divorced 2 2.0
Total 100 100.0
Source: Field Survey, 2013
4.2 Products and services MTN and Vodafone
provide to customers
To assess the products and services MTN and
Vodafone provide to customers, the researchers
sought the views of the major players in the industry
in order to have a comprehensive view on the matter.
4.2.1Telecommunication networks
All respondents in this research subscribed to at least
one of the telecommunication networks in Ghana.
The survey conducted revealed that 58% were MTN
subscribers who also use an additional network,
while 30% of Vodafone subscribers also use two
Sims. Interestingly, only 4% of the respondents use
Tigo and 8% use Airtel, depicting low patronage of
Tigo and Airtel services on campus. Majority (90%)
of the respondents used at least one of the networks
well over three years, while 10% subscribed to a
network within the last three years. This means that
the respondents have had an experience of using one
of the networks for a long period of time. This means
that the customers are loyal to their network
providers.
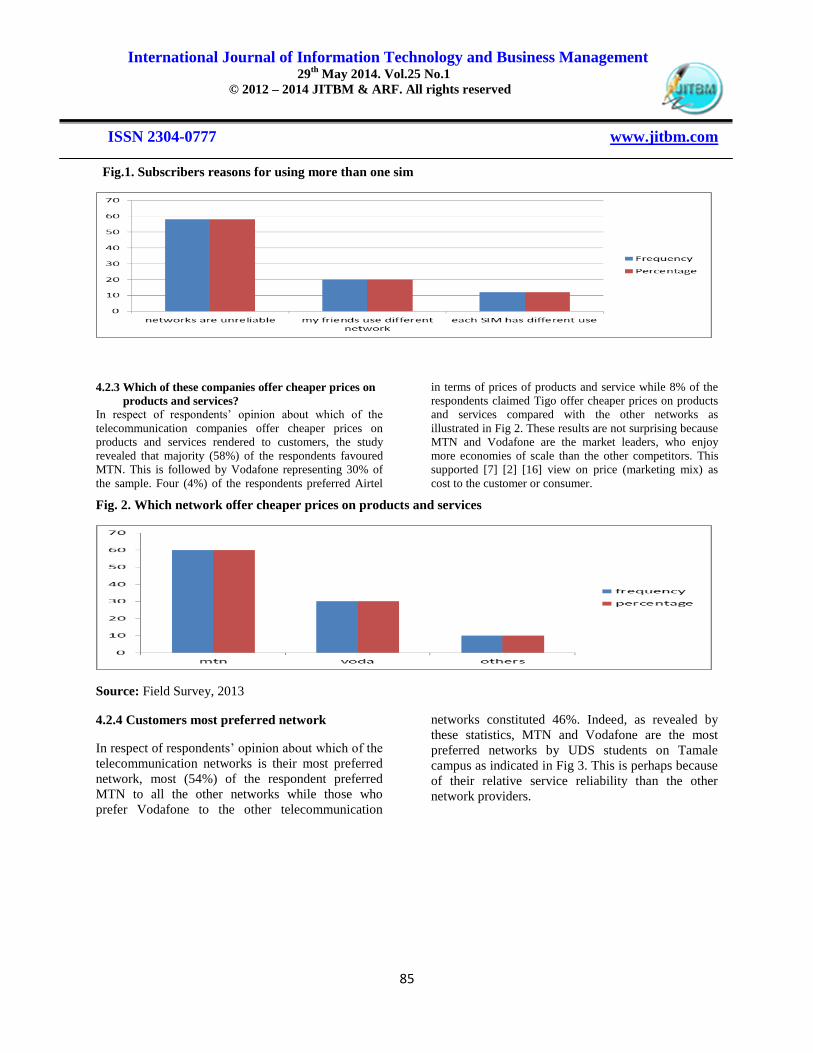
4.2.2 Double SIM usage
In respect of double SIM use, the research revealed
that out of 90% of the respondents who used cell
phone for at least three years 62% confirmed that
services rendered by a network they preferred have
been good while 28% thought otherwise. However, a
myriad of reasons were given by the respondents for
using more than one SIM. From Fig 1, a vast
majority (42%) of the subscribers claimed that
services rendered by the service providers are
unreliable and therefore, they needed an alternative
network to support what they already had. Ten (10%)
of the respondents claimed their friends and relatives
were using a network different from what they had.
To bridge the communication gap they added a SIM
to make communication much easier. Interestingly,
2% double SIM user also claimed that each of the
SIMs is used for a particular purpose. The use of
multiple networks by customers is an indication that
no particular network provider can claim monopoly
of the market. So network providers should improve
their service reliability in order to ensure customer
retention.
International Journal of Information Technology and Business Management 29
th May 2014. Vol.25 No.1
© 2012 – 2014 JITBM & ARF. All rights reserved
ISSN 2304-0777 www.jitbm.com
85
Fig.1. Subscribers reasons for using more than one sim
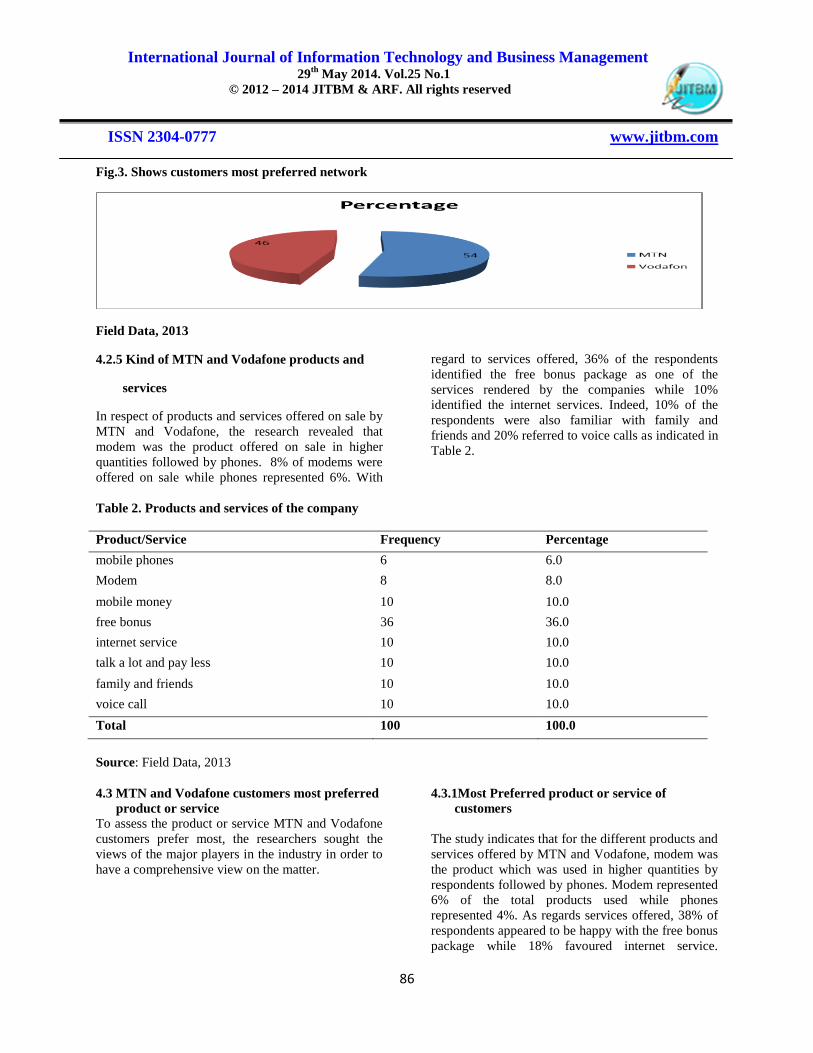
4.2.3 Which of these companies offer cheaper prices on
products and services?
In respect of respondents’ opinion about which of the
telecommunication companies offer cheaper prices on
products and services rendered to customers, the study
revealed that majority (58%) of the respondents favoured
MTN. This is followed by Vodafone representing 30% of
the sample. Four (4%) of the respondents preferred Airtel
in terms of prices of products and service while 8% of the
respondents claimed Tigo offer cheaper prices on products
and services compared with the other networks as
illustrated in Fig 2. These results are not surprising because
MTN and Vodafone are the market leaders, who enjoy
more economies of scale than the other competitors. This
supported [7] [2] [16] view on price (marketing mix) as
cost to the customer or consumer.
Fig. 2. Which network offer cheaper prices on products and services
Source: Field Survey, 2013
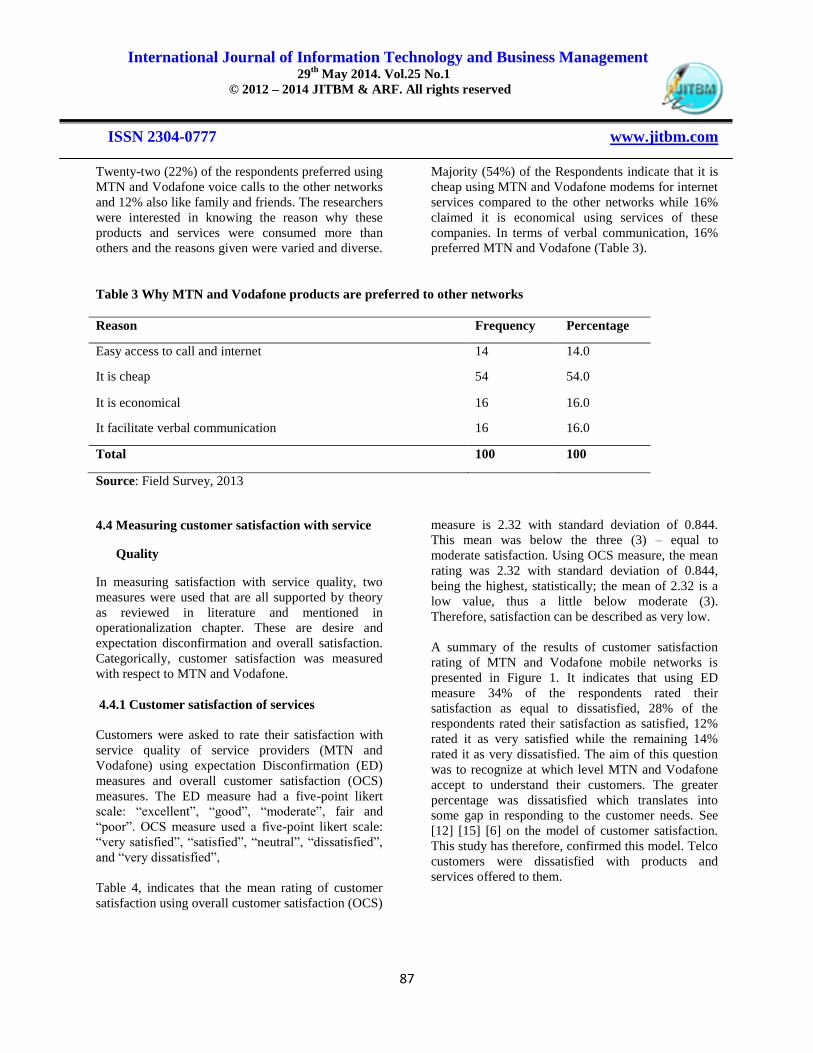
4.2.4 Customers most preferred network
In respect of respondents’ opinion about which of the
telecommunication networks is their most preferred
network, most (54%) of the respondent preferred
MTN to all the other networks while those who
prefer Vodafone to the other telecommunication
networks constituted 46%. Indeed, as revealed by
these statistics, MTN and Vodafone are the most
preferred networks by UDS students on Tamale
campus as indicated in Fig 3. This is perhaps because
of their relative service reliability than the other
network providers.
International Journal of Information Technology and Business Management 29
th May 2014. Vol.25 No.1
© 2012 – 2014 JITBM & ARF. All rights reserved
ISSN 2304-0777 www.jitbm.com
86
Fig.3. Shows customers most preferred network
Field Data, 2013
4.2.5 Kind of MTN and Vodafone products and
services
In respect of products and services offered on sale by
MTN and Vodafone, the research revealed that
modem was the product offered on sale in higher
quantities followed by phones. 8% of modems were
offered on sale while phones represented 6%. With
regard to services offered, 36% of the respondents
identified the free bonus package as one of the
services rendered by the companies while 10%
identified the internet services. Indeed, 10% of the
respondents were also familiar with family and
friends and 20% referred to voice calls as indicated in
Table 2.
Table 2. Products and services of the company
Product/Service Frequency Percentage
mobile phones 6 6.0
Modem 8 8.0
mobile money 10 10.0
free bonus 36 36.0
internet service 10 10.0
talk a lot and pay less 10 10.0
family and friends 10 10.0
voice call 10 10.0
Total 100 100.0
Source: Field Data, 2013
4.3 MTN and Vodafone customers most preferred
product or service
To assess the product or service MTN and Vodafone
customers prefer most, the researchers sought the
views of the major players in the industry in order to
have a comprehensive view on the matter.
4.3.1Most Preferred product or service of
customers
The study indicates that for the different products and
services offered by MTN and Vodafone, modem was
the product which was used in higher quantities by
respondents followed by phones. Modem represented
6% of the total products used while phones
represented 4%. As regards services offered, 38% of
respondents appeared to be happy with the free bonus
package while 18% favoured internet service.
International Journal of Information Technology and Business Management 29
th May 2014. Vol.25 No.1
© 2012 – 2014 JITBM & ARF. All rights reserved
ISSN 2304-0777 www.jitbm.com
87
Twenty-two (22%) of the respondents preferred using
MTN and Vodafone voice calls to the other networks
and 12% also like family and friends. The researchers
were interested in knowing the reason why these
products and services were consumed more than
others and the reasons given were varied and diverse.
Majority (54%) of the Respondents indicate that it is
cheap using MTN and Vodafone modems for internet
services compared to the other networks while 16%
claimed it is economical using services of these
companies. In terms of verbal communication, 16%
preferred MTN and Vodafone (Table 3).
Table 3 Why MTN and Vodafone products are preferred to other networks
Reason Frequency Percentage
Easy access to call and internet 14 14.0
It is cheap 54 54.0
It is economical 16 16.0
It facilitate verbal communication 16 16.0
Total 100 100
Source: Field Survey, 2013
4.4 Measuring customer satisfaction with service
Quality
In measuring satisfaction with service quality, two
measures were used that are all supported by theory
as reviewed in literature and mentioned in
operationalization chapter. These are desire and
expectation disconfirmation and overall satisfaction.
Categorically, customer satisfaction was measured
with respect to MTN and Vodafone.
4.4.1 Customer satisfaction of services
Customers were asked to rate their satisfaction with
service quality of service providers (MTN and
Vodafone) using expectation Disconfirmation (ED)
measures and overall customer satisfaction (OCS)
measures. The ED measure had a five-point likert
scale: “excellent”, “good”, “moderate”, fair and
“poor”. OCS measure used a five-point likert scale:
“very satisfied”, “satisfied”, “neutral”, “dissatisfied”,
and “very dissatisfied”,
Table 4, indicates that the mean rating of customer
satisfaction using overall customer satisfaction (OCS)
measure is 2.32 with standard deviation of 0.844.
This mean was below the three (3) – equal to
moderate satisfaction. Using OCS measure, the mean
rating was 2.32 with standard deviation of 0.844,
being the highest, statistically; the mean of 2.32 is a
low value, thus a little below moderate (3).
Therefore, satisfaction can be described as very low.
A summary of the results of customer satisfaction
rating of MTN and Vodafone mobile networks is
presented in Figure 1. It indicates that using ED
measure 34% of the respondents rated their
satisfaction as equal to dissatisfied, 28% of the
respondents rated their satisfaction as satisfied, 12%
rated it as very satisfied while the remaining 14%
rated it as very dissatisfied. The aim of this question
was to recognize at which level MTN and Vodafone
accept to understand their customers. The greater
percentage was dissatisfied which translates into
some gap in responding to the customer needs. See
[12] [15] [6] on the model of customer satisfaction.
This study has therefore, confirmed this model. Telco
customers were dissatisfied with products and
services offered to them.
International Journal of Information Technology and Business Management 29
th May 2014. Vol.25 No.1
© 2012 – 2014 JITBM & ARF. All rights reserved
ISSN 2304-0777 www.jitbm.com
88
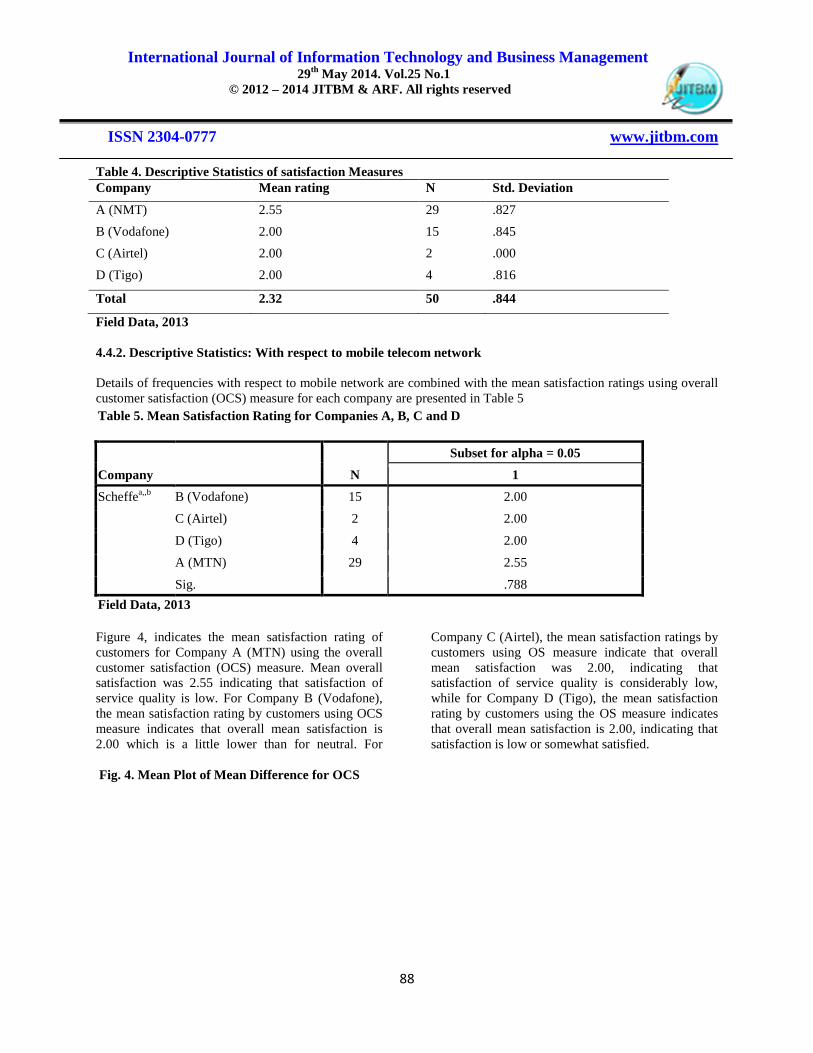
Table 4. Descriptive Statistics of satisfaction Measures
Company Mean rating N Std. Deviation
A (NMT) 2.55 29 .827
B (Vodafone) 2.00 15 .845
C (Airtel) 2.00 2 .000
D (Tigo) 2.00 4 .816
Total 2.32 50 .844
Field Data, 2013
4.4.2. Descriptive Statistics: With respect to mobile telecom network
Details of frequencies with respect to mobile network are combined with the mean satisfaction ratings using overall
customer satisfaction (OCS) measure for each company are presented in Table 5 Table 5. Mean Satisfaction Rating for Companies A, B, C and D
N
Subset for alpha = 0.05
Company 1
Scheffea,,b
B (Vodafone) 15 2.00
C (Airtel) 2 2.00
D (Tigo) 4 2.00
A (MTN) 29 2.55
Sig. .788
Field Data, 2013
Figure 4, indicates the mean satisfaction rating of
customers for Company A (MTN) using the overall
customer satisfaction (OCS) measure. Mean overall
satisfaction was 2.55 indicating that satisfaction of
service quality is low. For Company B (Vodafone),
the mean satisfaction rating by customers using OCS
measure indicates that overall mean satisfaction is
2.00 which is a little lower than for neutral. For
Company C (Airtel), the mean satisfaction ratings by
customers using OS measure indicate that overall
mean satisfaction was 2.00, indicating that
satisfaction of service quality is considerably low,
while for Company D (Tigo), the mean satisfaction
rating by customers using the OS measure indicates
that overall mean satisfaction is 2.00, indicating that
satisfaction is low or somewhat satisfied.
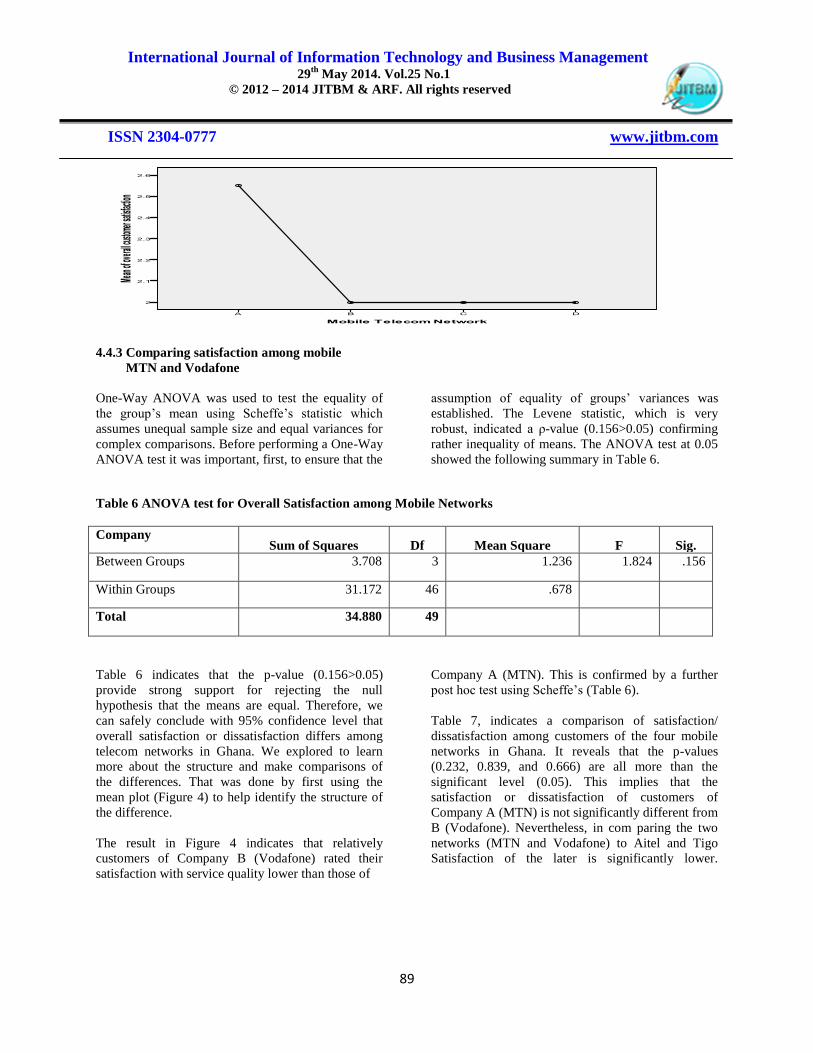
Fig. 4. Mean Plot of Mean Difference for OCS
International Journal of Information Technology and Business Management 29
th May 2014. Vol.25 No.1
© 2012 – 2014 JITBM & ARF. All rights reserved
ISSN 2304-0777 www.jitbm.com
89
4.4.3 Comparing satisfaction among mobile
MTN and Vodafone
One-Way ANOVA was used to test the equality of
the group’s mean using Scheffe’s statistic which
assumes unequal sample size and equal variances for
complex comparisons. Before performing a One-Way
ANOVA test it was important, first, to ensure that the
assumption of equality of groups’ variances was
established. The Levene statistic, which is very
robust, indicated a ρ-value (0.156>0.05) confirming
rather inequality of means. The ANOVA test at 0.05
showed the following summary in Table 6.
Table 6 ANOVA test for Overall Satisfaction among Mobile Networks
Company Sum of Squares Df Mean Square F Sig.
Between Groups 3.708 3 1.236 1.824 .156
Within Groups 31.172 46 .678
Total 34.880 49
Table 6 indicates that the p-value (0.156>0.05)
provide strong support for rejecting the null
hypothesis that the means are equal. Therefore, we
can safely conclude with 95% confidence level that
overall satisfaction or dissatisfaction differs among
telecom networks in Ghana. We explored to learn
more about the structure and make comparisons of
the differences. That was done by first using the
mean plot (Figure 4) to help identify the structure of
the difference.
The result in Figure 4 indicates that relatively
customers of Company B (Vodafone) rated their
satisfaction with service quality lower than those of
Company A (MTN). This is confirmed by a further
post hoc test using Scheffe’s (Table 6).
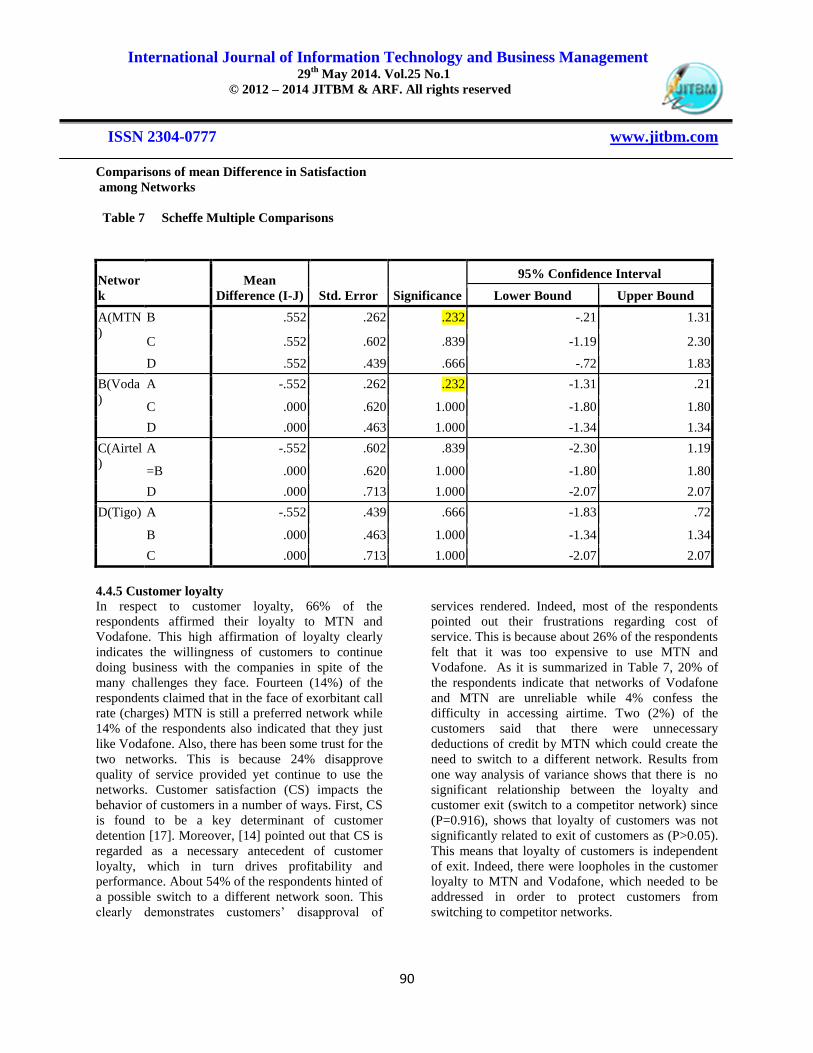
Table 7, indicates a comparison of satisfaction/
dissatisfaction among customers of the four mobile
networks in Ghana. It reveals that the p-values
(0.232, 0.839, and 0.666) are all more than the
significant level (0.05). This implies that the
satisfaction or dissatisfaction of customers of
Company A (MTN) is not significantly different from
B (Vodafone). Nevertheless, in com paring the two
networks (MTN and Vodafone) to Aitel and Tigo
Satisfaction of the later is significantly lower.
International Journal of Information Technology and Business Management 29
th May 2014. Vol.25 No.1
© 2012 – 2014 JITBM & ARF. All rights reserved
ISSN 2304-0777 www.jitbm.com
90
Comparisons of mean Difference in Satisfaction
among Networks
Table 7 Scheffe Multiple Comparisons
Networ
k
Mean
Difference (I-J) Std. Error Significance
95% Confidence Interval
Lower Bound Upper Bound
A(MTN
)
B .552 .262 .232 -.21 1.31
C .552 .602 .839 -1.19 2.30
D .552 .439 .666 -.72 1.83
B(Voda
)
A -.552 .262 .232 -1.31 .21
C .000 .620 1.000 -1.80 1.80
D .000 .463 1.000 -1.34 1.34
C(Airtel
)
A -.552 .602 .839 -2.30 1.19
=B .000 .620 1.000 -1.80 1.80
D .000 .713 1.000 -2.07 2.07
D(Tigo) A -.552 .439 .666 -1.83 .72
B .000 .463 1.000 -1.34 1.34
C .000 .713 1.000 -2.07 2.07
4.4.5 Customer loyalty In respect to customer loyalty, 66% of the
respondents affirmed their loyalty to MTN and
Vodafone. This high affirmation of loyalty clearly
indicates the willingness of customers to continue
doing business with the companies in spite of the
many challenges they face. Fourteen (14%) of the
respondents claimed that in the face of exorbitant call
rate (charges) MTN is still a preferred network while
14% of the respondents also indicated that they just
like Vodafone. Also, there has been some trust for the
two networks. This is because 24% disapprove
quality of service provided yet continue to use the
networks. Customer satisfaction (CS) impacts the
behavior of customers in a number of ways. First, CS
is found to be a key determinant of customer
detention [17]. Moreover, [14] pointed out that CS is
regarded as a necessary antecedent of customer
loyalty, which in turn drives profitability and
performance. About 54% of the respondents hinted of
a possible switch to a different network soon. This
clearly demonstrates customers’ disapproval of
services rendered. Indeed, most of the respondents
pointed out their frustrations regarding cost of
service. This is because about 26% of the respondents
felt that it was too expensive to use MTN and
Vodafone. As it is summarized in Table 7, 20% of
the respondents indicate that networks of Vodafone
and MTN are unreliable while 4% confess the
difficulty in accessing airtime. Two (2%) of the
customers said that there were unnecessary
deductions of credit by MTN which could create the
need to switch to a different network. Results from
one way analysis of variance shows that there is no
significant relationship between the loyalty and
customer exit (switch to a competitor network) since
(P=0.916), shows that loyalty of customers was not
significantly related to exit of customers as (P>0.05).
This means that loyalty of customers is independent
of exit. Indeed, there were loopholes in the customer
loyalty to MTN and Vodafone, which needed to be
addressed in order to protect customers from
switching to competitor networks.
International Journal of Information Technology and Business Management 29
th May 2014. Vol.25 No.1
© 2012 – 2014 JITBM & ARF. All rights reserved
ISSN 2304-0777 www.jitbm.com
91
Table 7 Why customers want to switch to other networks
Reason Frequency Percentage
they deduct my credit for no reason 12 12.0
difficult to access airtime 14 14.0
network is unreliable 30 30.0
too expensive to use 40 40.0
my friends use different lines 12 12.0
Total 100 100
Source: Field Survey, 2013
4.5 Sustainability of the products and services
MTN and Vodafone provide to customers
To assess the sustainability of the products and
services MTN and Vodafone provide to their
customers, the researchers sought the views of the
major stakeholders in the industry in order to have a
comprehensive view on the matter.
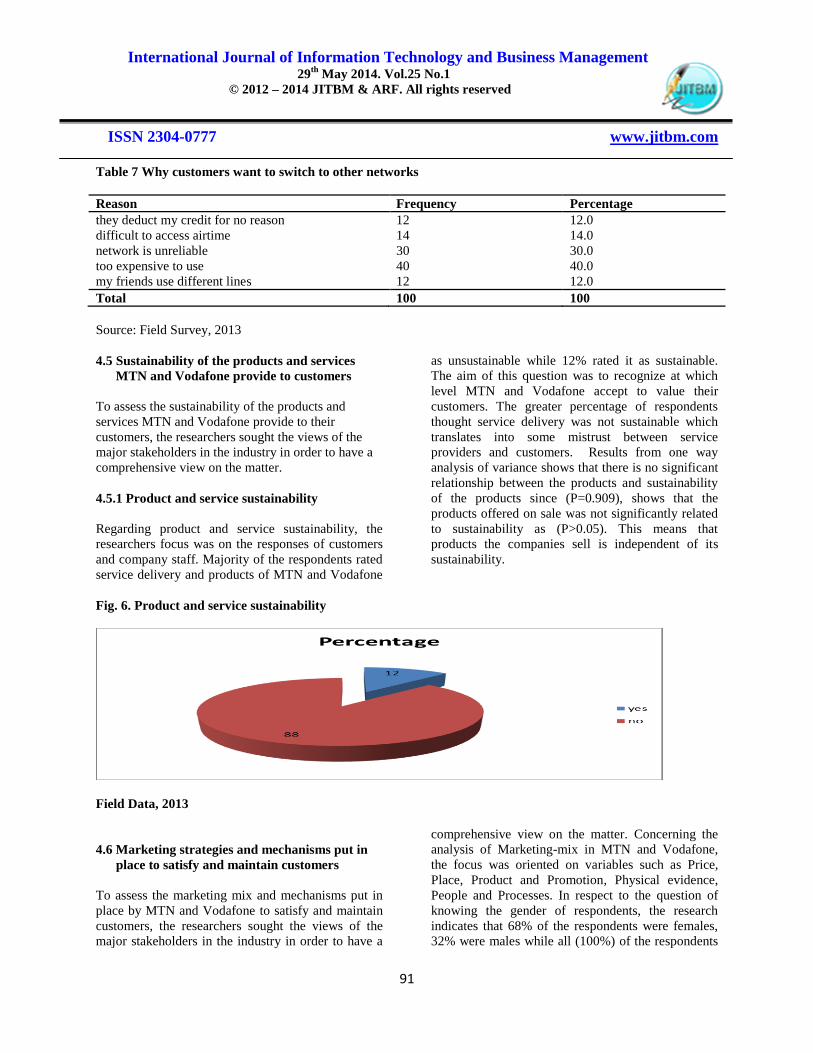
4.5.1 Product and service sustainability
Regarding product and service sustainability, the
researchers focus was on the responses of customers
and company staff. Majority of the respondents rated
service delivery and products of MTN and Vodafone
as unsustainable while 12% rated it as sustainable.
The aim of this question was to recognize at which
level MTN and Vodafone accept to value their
customers. The greater percentage of respondents
thought service delivery was not sustainable which
translates into some mistrust between service
providers and customers. Results from one way
analysis of variance shows that there is no significant
relationship between the products and sustainability
of the products since (P=0.909), shows that the
products offered on sale was not significantly related
to sustainability as (P>0.05). This means that
products the companies sell is independent of its
sustainability.
Fig. 6. Product and service sustainability
Field Data, 2013
4.6 Marketing strategies and mechanisms put in
place to satisfy and maintain customers
To assess the marketing mix and mechanisms put in
place by MTN and Vodafone to satisfy and maintain
customers, the researchers sought the views of the
major stakeholders in the industry in order to have a
comprehensive view on the matter. Concerning the
analysis of Marketing-mix in MTN and Vodafone,
the focus was oriented on variables such as Price,
Place, Product and Promotion, Physical evidence,
People and Processes. In respect to the question of
knowing the gender of respondents, the research
indicates that 68% of the respondents were females,
32% were males while all (100%) of the respondents
International Journal of Information Technology and Business Management 29
th May 2014. Vol.25 No.1
© 2012 – 2014 JITBM & ARF. All rights reserved
ISSN 2304-0777 www.jitbm.com
92
affirmed having cell phones. The Researchers asked
this question in order to know the MTN and
Vodafone subscribers in UDS possessing cell phones.
This is due to the fact that holding a mobile phone
was said to be costly.
4.6.1 Price of products
For the different products and services offered by
MTN and Vodafone to UDS students, modems were
the products which were used in higher quantities
while voice call, internet and mobile money services
were the most patronised. Modem represented 6% of
the total products while voice call represented 22%,
internet service 18% and mobile money 4%. The
researchers were interested in knowing the reasons
why these product and services were consumed more
than others and the reason given was the value or cost
of these products.
Concerning the price of modem, Table 4.6.1 shows
that 56% of the respondents declared that the price of
MTN and Vodafone was expensive, 20% as very
expensive, 18% as cheap, while 6% found it very
cheap. It is seen that a greater number of respondents
declared the price being expensive. This created a
constant migration from one network to another
telecommunication company, because 50% of MTN
and Vodafone clients complained about price.
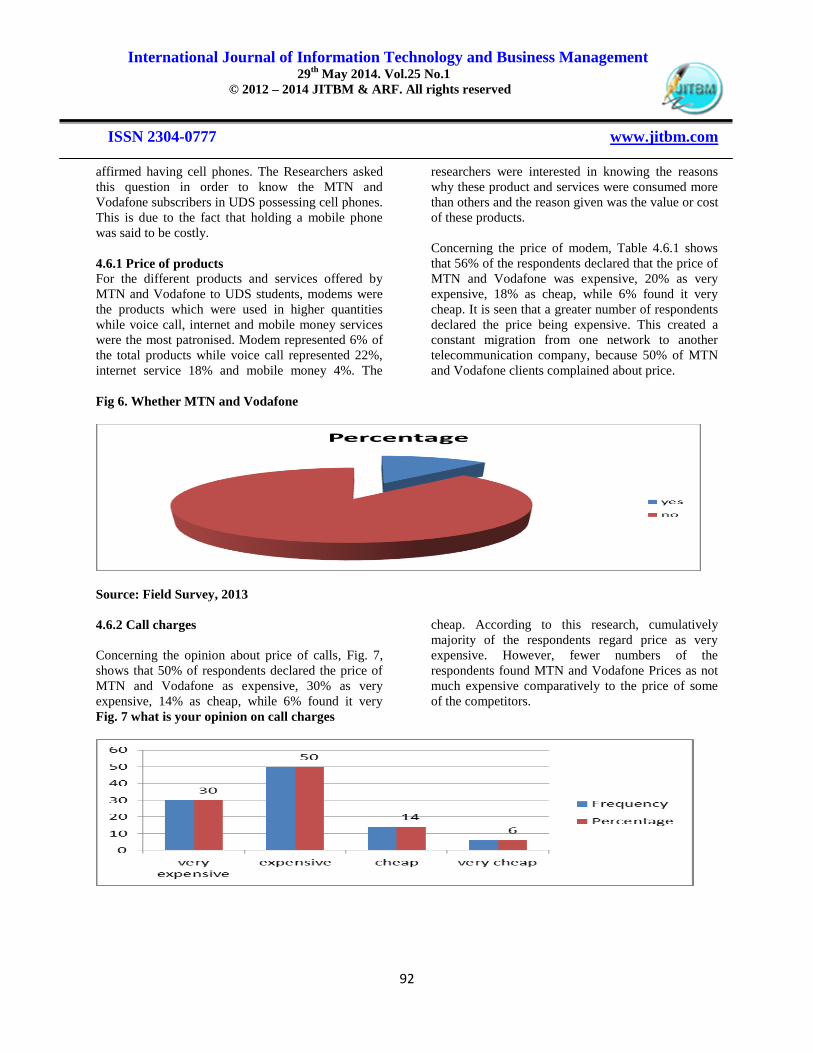
Fig 6. Whether MTN and Vodafone
Source: Field Survey, 2013
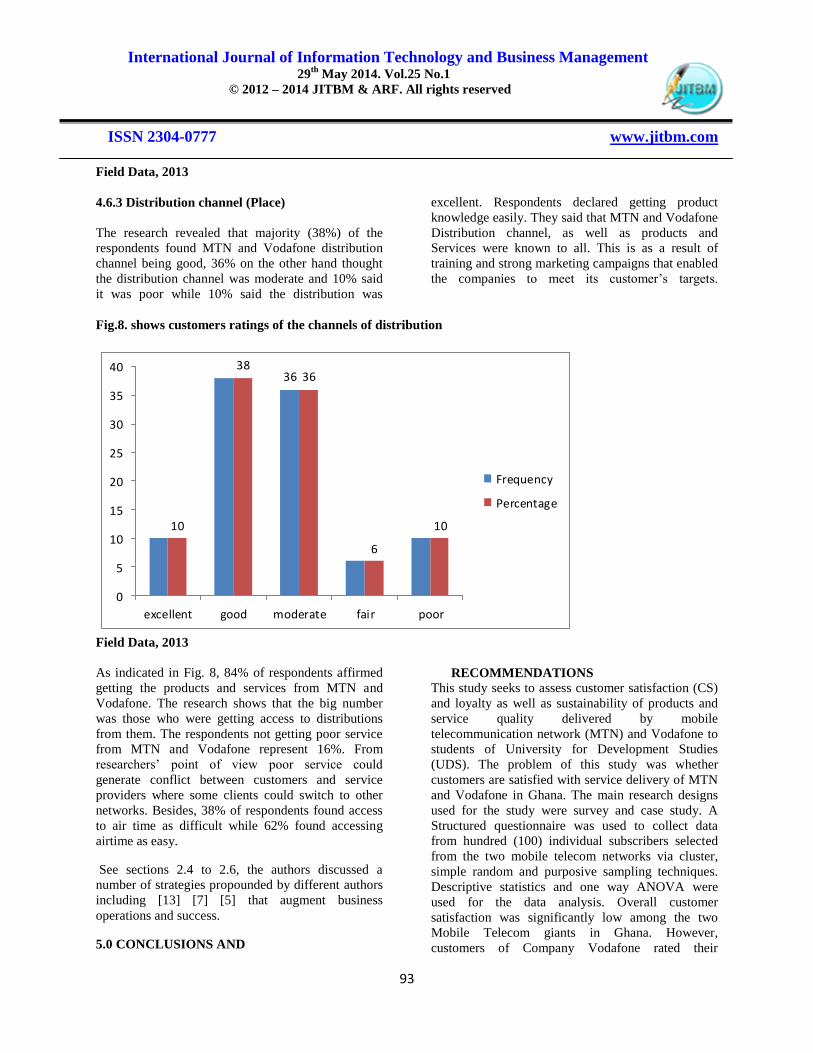
4.6.2 Call charges
Concerning the opinion about price of calls, Fig. 7,
shows that 50% of respondents declared the price of
MTN and Vodafone as expensive, 30% as very
expensive, 14% as cheap, while 6% found it very
cheap. According to this research, cumulatively
majority of the respondents regard price as very
expensive. However, fewer numbers of the
respondents found MTN and Vodafone Prices as not
much expensive comparatively to the price of some
of the competitors.
Fig. 7 what is your opinion on call charges
International Journal of Information Technology and Business Management 29
th May 2014. Vol.25 No.1
© 2012 – 2014 JITBM & ARF. All rights reserved
ISSN 2304-0777 www.jitbm.com
93
Field Data, 2013
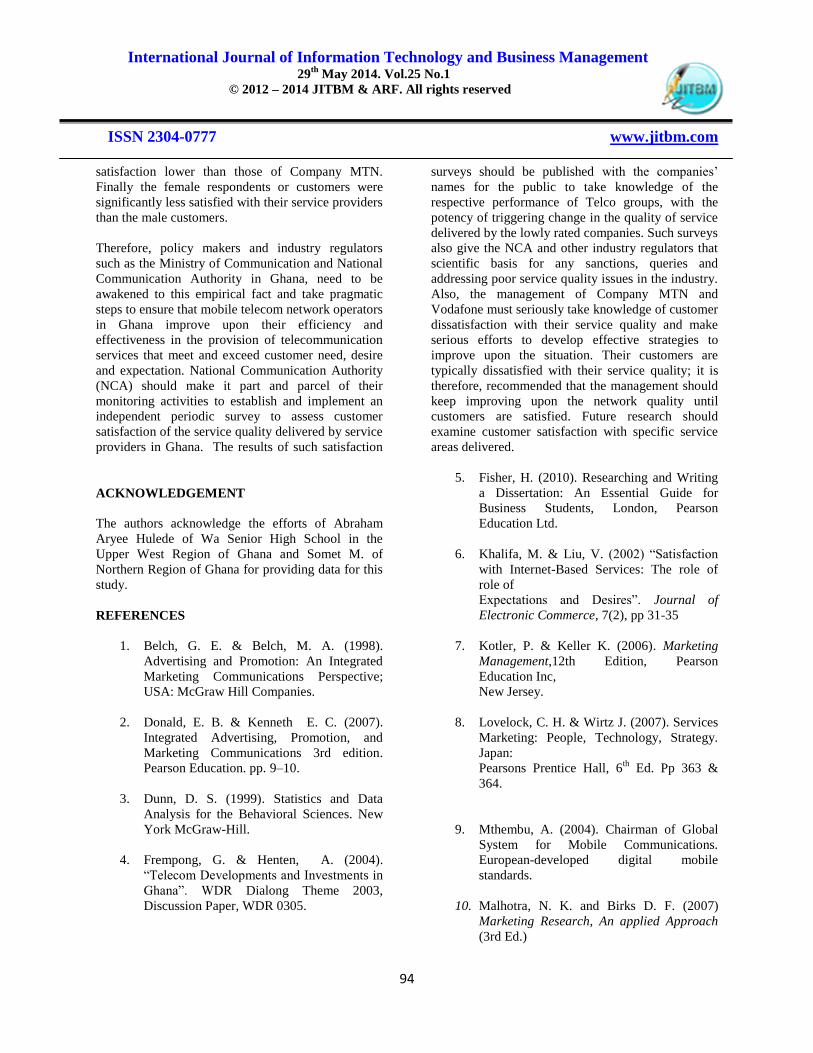
4.6.3 Distribution channel (Place)
The research revealed that majority (38%) of the
respondents found MTN and Vodafone distribution
channel being good, 36% on the other hand thought
the distribution channel was moderate and 10% said
it was poor while 10% said the distribution was
excellent. Respondents declared getting product
knowledge easily. They said that MTN and Vodafone
Distribution channel, as well as products and
Services were known to all. This is as a result of
training and strong marketing campaigns that enabled
the companies to meet its customer’s targets.
Fig.8. shows customers ratings of the channels of distribution
36
10
38 36
6
10
0
5
10
15
20
25
30
35
40
excellent good moderate fair poor
Frequency
Percentage
Field Data, 2013
As indicated in Fig. 8, 84% of respondents affirmed
getting the products and services from MTN and
Vodafone. The research shows that the big number
was those who were getting access to distributions
from them. The respondents not getting poor service
from MTN and Vodafone represent 16%. From
researchers’ point of view poor service could
generate conflict between customers and service
providers where some clients could switch to other
networks. Besides, 38% of respondents found access
to air time as difficult while 62% found accessing
airtime as easy.
See sections 2.4 to 2.6, the authors discussed a
number of strategies propounded by different authors
including [13] [7] [5] that augment business
operations and success.
5.0 CONCLUSIONS AND
RECOMMENDATIONS
This study seeks to assess customer satisfaction (CS)
and loyalty as well as sustainability of products and
service quality delivered by mobile
telecommunication network (MTN) and Vodafone to
students of University for Development Studies
(UDS). The problem of this study was whether
customers are satisfied with service delivery of MTN
and Vodafone in Ghana. The main research designs
used for the study were survey and case study. A
Structured questionnaire was used to collect data
from hundred (100) individual subscribers selected
from the two mobile telecom networks via cluster,
simple random and purposive sampling techniques.
Descriptive statistics and one way ANOVA were
used for the data analysis. Overall customer
satisfaction was significantly low among the two
Mobile Telecom giants in Ghana. However,
customers of Company Vodafone rated their
International Journal of Information Technology and Business Management 29
th May 2014. Vol.25 No.1
© 2012 – 2014 JITBM & ARF. All rights reserved
ISSN 2304-0777 www.jitbm.com
94
satisfaction lower than those of Company MTN.
Finally the female respondents or customers were
significantly less satisfied with their service providers
than the male customers.
Therefore, policy makers and industry regulators
such as the Ministry of Communication and National
Communication Authority in Ghana, need to be
awakened to this empirical fact and take pragmatic
steps to ensure that mobile telecom network operators
in Ghana improve upon their efficiency and
effectiveness in the provision of telecommunication
services that meet and exceed customer need, desire
and expectation. National Communication Authority
(NCA) should make it part and parcel of their
monitoring activities to establish and implement an
independent periodic survey to assess customer
satisfaction of the service quality delivered by service
providers in Ghana. The results of such satisfaction
surveys should be published with the companies’
names for the public to take knowledge of the
respective performance of Telco groups, with the
potency of triggering change in the quality of service
delivered by the lowly rated companies. Such surveys
also give the NCA and other industry regulators that
scientific basis for any sanctions, queries and
addressing poor service quality issues in the industry.
Also, the management of Company MTN and
Vodafone must seriously take knowledge of customer
dissatisfaction with their service quality and make
serious efforts to develop effective strategies to
improve upon the situation. Their customers are
typically dissatisfied with their service quality; it is
therefore, recommended that the management should
keep improving upon the network quality until
customers are satisfied. Future research should
examine customer satisfaction with specific service
areas delivered.
ACKNOWLEDGEMENT
The authors acknowledge the efforts of Abraham
Aryee Hulede of Wa Senior High School in the
Upper West Region of Ghana and Somet M. of
Northern Region of Ghana for providing data for this
study.
REFERENCES
1. Belch, G. E. & Belch, M. A. (1998).
Advertising and Promotion: An Integrated
Marketing Communications Perspective;
USA: McGraw Hill Companies.
2. Donald, E. B. & Kenneth E. C. (2007).
Integrated Advertising, Promotion, and
Marketing Communications 3rd edition.
Pearson Education. pp. 9–10.
3. Dunn, D. S. (1999). Statistics and Data
Analysis for the Behavioral Sciences. New
York McGraw-Hill.
4. Frempong, G. & Henten, A. (2004).
“Telecom Developments and Investments in
Ghana”. WDR Dialong Theme 2003,
Discussion Paper, WDR 0305.
5. Fisher, H. (2010). Researching and Writing
a Dissertation: An Essential Guide for
Business Students, London, Pearson
Education Ltd.
6. Khalifa, M. & Liu, V. (2002) “Satisfaction
with Internet-Based Services: The role of
role of
Expectations and Desires”. Journal of
Electronic Commerce, 7(2), pp 31-35
7. Kotler, P. & Keller K. (2006). Marketing
Management,12th Edition, Pearson
Education Inc,
New Jersey.
8. Lovelock, C. H. & Wirtz J. (2007). Services
Marketing: People, Technology, Strategy.
Japan:
Pearsons Prentice Hall, 6th
Ed. Pp 363 &
364.
9. Mthembu, A. (2004). Chairman of Global
System for Mobile Communications.
European-developed digital mobile
standards.
10. Malhotra, N. K. and Birks D. F. (2007)
Marketing Research, An applied Approach
(3rd Ed.)
International Journal of Information Technology and Business Management 29
th May 2014. Vol.25 No.1
© 2012 – 2014 JITBM & ARF. All rights reserved
ISSN 2304-0777 www.jitbm.com
95
England, Prentice Hall, Inc.
11. Nicole, E. C. & Brodie R. J. Munro H. J.
(1995). Understyanding Contemporary
Marketing:
Development of a Classification Scheme.
Journal of Marketing Management, 13 No.
6, Pp 501-522.
12. Oliver, R. L. (1986). A cognitive model of
the antecedent and consequences of
customer
Satisfaction. Journal of Marketing Research,
17, November P 460 – 469.
13. Ryals, B. & Knox A. (2001). Cross-
functional Issues in the Implementations of
Relationship
Marketing through CRM. European
Management Journal, 19(5), p.534-542.
14. Reichheld, F. (1996) The Loyalty Effect.
Boston, Havard Business School Press.
15. Sattari, S. (2007) Application of
Disconfirmation Theory Customer
Satisfaction Determination Model – Case of
Prepaid Mobiles in Iran, Master‟s Thesis ,
LTU
Sweden.
16. Strokes and Rob (2008). eMarketing: The
Essential Guide To Online Marketing. Quirk
. ISBN 9780620411356.)
17. Zeithaml, V. (2003) Services Marketing;
Integragrating Customer Focus across the
form, New
York,3rd
Ed, Mc Graw Hill.