Embed Size (px)
Citation preview
E&P Business TrendCSFB Oil & Gas Conference
London, June 8th, 2005
A. BelottiSenior Vice PresidentE&P Business Planning

2
Disclaimer
This presentation contains forward-looking statements regarding future events and the future results of Eni that are based on current expectations, estimates, forecasts, and projections about the industries in which Eni operates and the beliefs and assumptions of the management of Eni. In particular, among other statements, certain statements with regard to management objectives, trends in results of operations, margins, costs, return on equity, risk management and competition are forward-looking in nature. Words such as ‘expects’, ‘anticipates’, ‘targets’, ‘goals’, ‘projects’, ‘intends’, ‘plans’, ‘believes’, ‘seeks’, ‘estimates’, variations of such words, and similar expressions are intended to identify such forward-looking statements. These forward-looking statements are only predictions and are subject to risks, uncertainties, and assumptions that are difficult to predict because they relate to events and depend on circumstances that will occur in the future. Therefore, Eni’s actual results may differ materially and adversely from those expressed or implied in any forward-looking statements. Factors that might cause or contribute to such differences include, but are not limited to, economic conditions globally, the impact of competition, political and economic developments in the countries in which Eni operates, regulatory developments in Italy and internationally and changes in oil prices and in the margins for Eni products. Any forward-looking statements made by or on behalf of Eni speak only as of the date they are made. Eni does not undertake to update forward-looking statements to reflect any changes in Eni’s expectations with regard thereto or any changes in events, conditions or circumstances on which any such statement is based. The reader should, however, consult any further disclosures Eni may make in documents it files with the US Securities and Exchange Commission.

Production Trend
Capital Investment
Projects
New Opportunities
Highlights
3

4
High Quality Portfolio to Fuel Future Growth
� Strong organic production growth
� Solid reserve replacement ratio
� World scale projects
� Selective Exploration
Solid upstream Portfolio
Efficiency and strong cash generation
� Focus on efficiency
� Strong cash flow per boe
� New initiatives in producing regions
� Access to high potential areas
� New themes
New opportunities
SustainableMedium/Long term growth
5
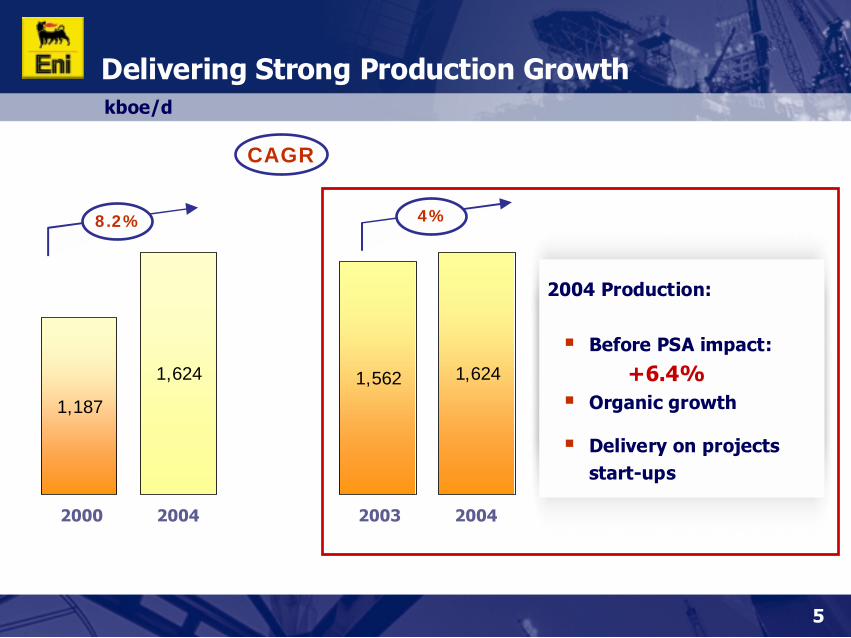
Delivering Strong Production Growthkboe/d
1,6241,5621,624
1,187
0
200
400
600
800
1000
1200
1400
1600
1800
2000 2004 2003 2004
4%
2004 Production:
� Before PSA impact:
+6.4%� Organic growth
� Delivery on projects start-ups
CAGR
8.2%
6
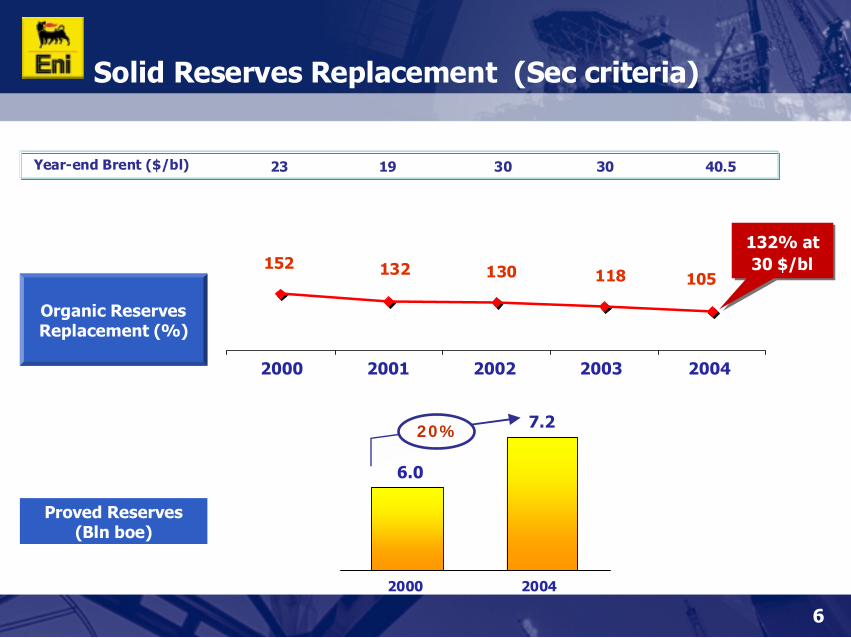
Solid Reserves Replacement (Sec criteria)
105130152 132 118
2000 2001 2002 2003 2004
Organic Reserves Replacement (%)
23 19 30 30 40.5Year-end Brent ($/bl)
Proved Reserves (Bln boe)
132% at30 $/bl
132% at30 $/bl
6.0
7.2
2000 2004
20%
7
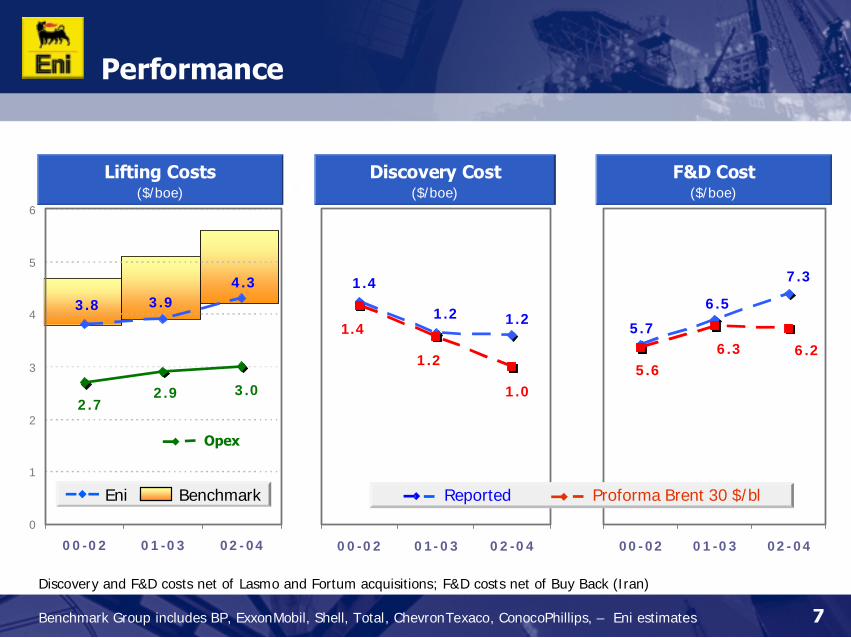
Performance
Discovery and F&D costs net of Lasmo and Fortum acquisitions; F&D costs net of Buy Back (Iran)
Benchmark Group includes BP, ExxonMobil, Shell, Total, ChevronTexaco, ConocoPhillips, – Eni estimates
1.21.2
1.4
1.4
1.2
1.0
0,0
0,5
1,0
1,5
2,0
00-02 01-03 02-04
5.7
6.5
7.3
6.26.35.6
0,0
2,0
4,0
6,0
8,0
10,0
00-02 01-03 02-04
F&D Cost($/boe)
Discovery Cost($/boe)
Proforma Brent 30 $/blReported
0
1
2
3
4
5
6
00-02 '01-03 '02-04
Opex
Lifting Costs($/boe)
4.33.93.8
2.92.7
3.0
0
1
2
3
4
5
6
00-02 01-03 02-04
BenchmarkEni
8
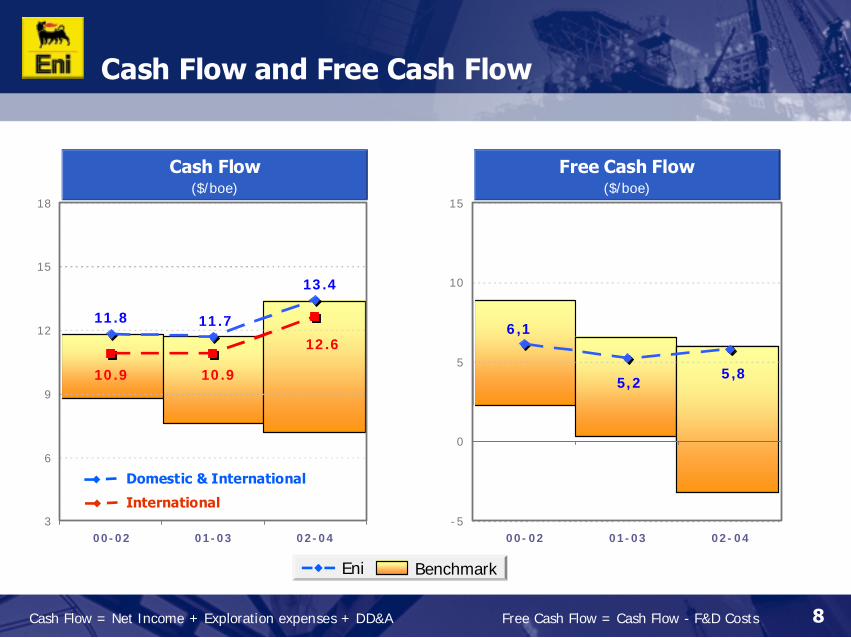
Cash Flow and Free Cash Flow
Cash Flow = Net Income + Exploration expenses + DD&A
3
4
5
6
7
8
9
10
11
12
13
14
15
16
17
18
00-02 '01-03 '02-04
13.4
11.711.8
12.6
10.910.9
3
6
9
12
15
18
00-02 01-03 02-04
International
Domestic & International
Cash Flow($/boe)
Free Cash Flow = Cash Flow - F&D Costs
-5-4-3-2-10123456789
101112131415
00-02 '01-03 '02-04
Free Cash Flow($/boe)
5,85,2
6,1
-5
0
5
10
15
00-02 01-03 02-04
BenchmarkEni

Highlights
Capital Investment
Projects
New Opportunities
Production Trend
9

10
Maintaining a Strong Production Growthkboe/d
1,624
1,187
>1,700
2000 2004 2005 2008
2,000
CAGR
8.2%
>5%
Reference conditions: Brent 30 $/bl 2005, 28 $/bl 2006, 26 $/bl 2007, 25 $/bl 2008
05/08 Growth� Driven by projects
build up and new start-ups
� Portfolio management
05/08 Replac. Ratio� Target >100%
11
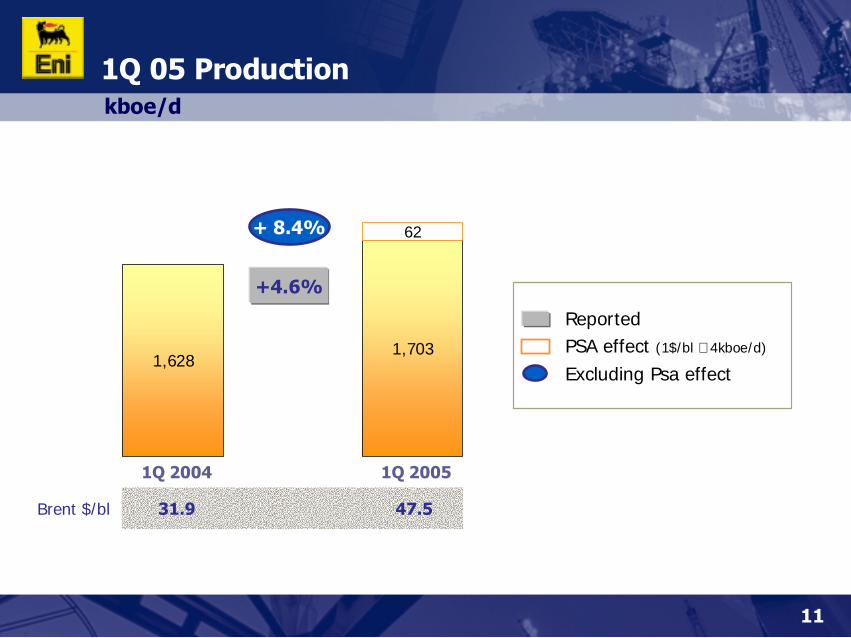
kboe/d
1Q 05 Production
1,7031,628
62
1000
1100
1200
1300
1400
1500
1600
1700
1800
1Q 2004 1Q 2005
+ 8.4%
+4.6%
31.9 47.5Brent $/bl
Reported PSA effect (1$/bl ∼ 4kboe/d)
Excluding Psa effect

12
Selectivity and Operatorship
25
98
7
9 7
59
2000 2004 2008
5%
37%
58%
6%
16%
78%
2004 1,62 mln boe/d 2008 2,00 mln boe/d
≥10030 ÷ 100<30kboe/d
7%
49%
44%
2000 1,19 mln boe/d
N° of producing countries
1560
2200
3100
830
1300
1040
2000 2004 2008
Gross Equity
Operated production(kboe/d)
13
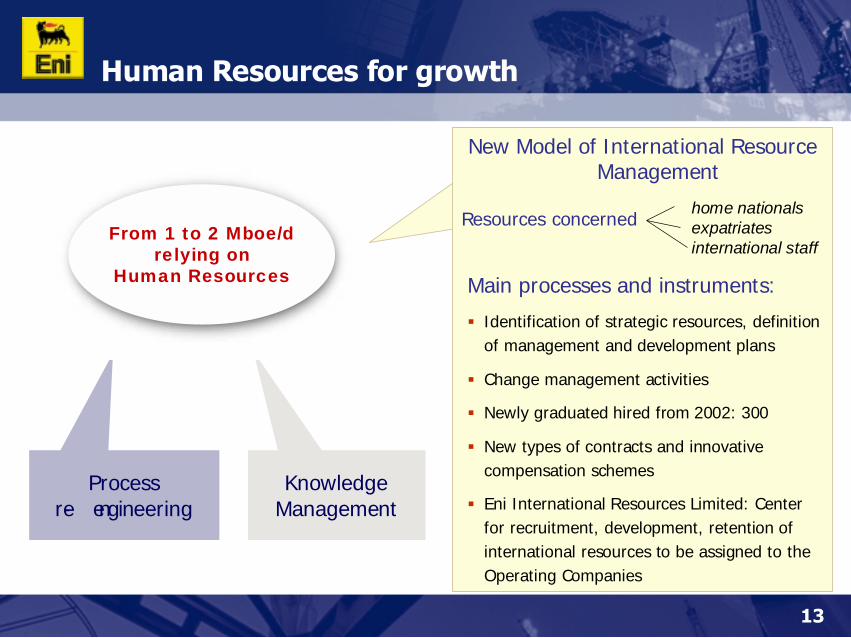
Human Resources for growth
KnowledgeManagement
Processre- engineering
From 1 to 2 Mboe/d relying on
Human Resources
New Model of International ResourceManagement
Resources concerned
Main processes and instruments:
� Identification of strategic resources, definitionof management and development plans
� Change management activities
� Newly graduated hired from 2002: 300
� New types of contracts and innovative compensation schemes
� Eni International Resources Limited: Center for recruitment, development, retention of international resources to be assigned to the Operating Companies
home nationalsexpatriatesinternational staff
14
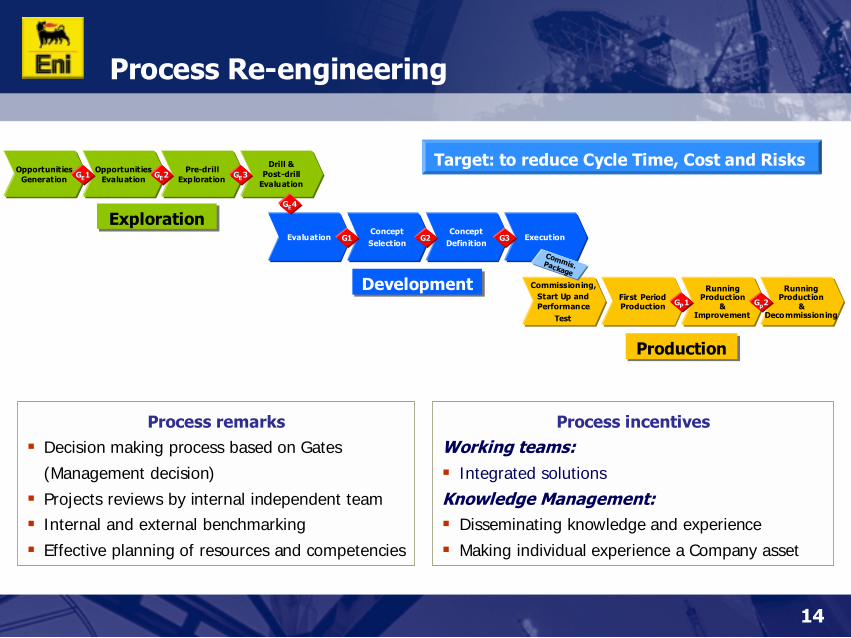
Process Re-engineering
Opportunities Generation
Opportunities Evaluation
Pre-drillExploration
Drill & Post-drill
EvaluationGGEE11 GGEE22 GGEE33
EvaluationConcept Selection
Concept Definition
ExecutionG1G1 G2G2 G3G3
ExplorationExploration
DevelopmentDevelopment Commissioning, Start Up and Performance
Test
First Period Production
Running Production
&Improvement
Running Production
& Decommissioning
GGPP11 GGpp22
ProductionProduction
GGEE44
Commis. Package
Process remarks� Decision making process based on Gates
(Management decision)
� Projects reviews by internal independent team� Internal and external benchmarking
� Effective planning of resources and competencies
Process incentivesWorking teams:� Integrated solutions
Knowledge Management:� Disseminating knowledge and experience
� Making individual experience a Company asset
Target: to reduce Cycle Time, Cost and Risks
Highlights
Production Trend
Projects
New Opportunities
Capital Investment
15
16
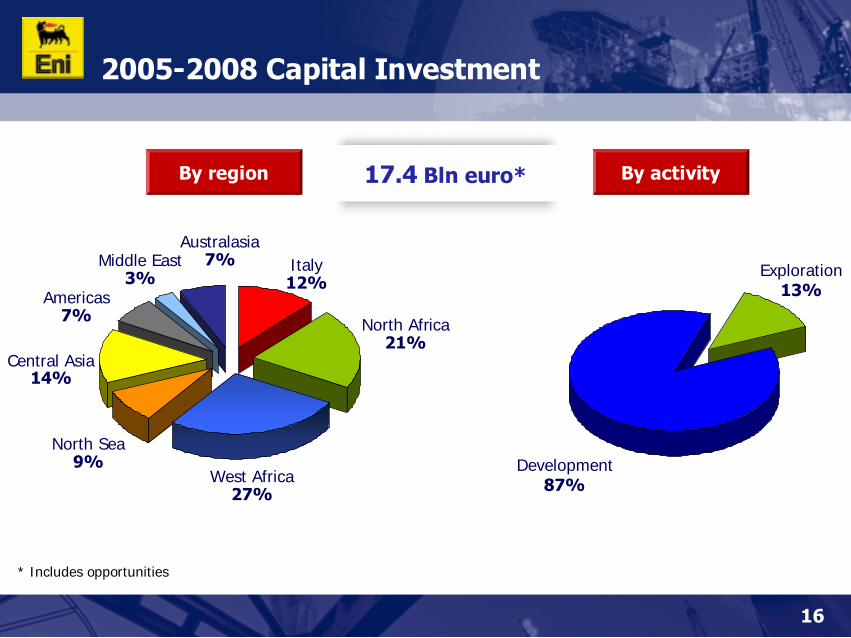
2005-2008 Capital Investment
By region By activity
Exploration13%
Development87%
Italy12%
North Africa 21%
West Africa 27%
North Sea9%
Central Asia14%
Americas7%
Middle East3%
Australasia7%
* Includes opportunities
17.4 Bln euro*
17
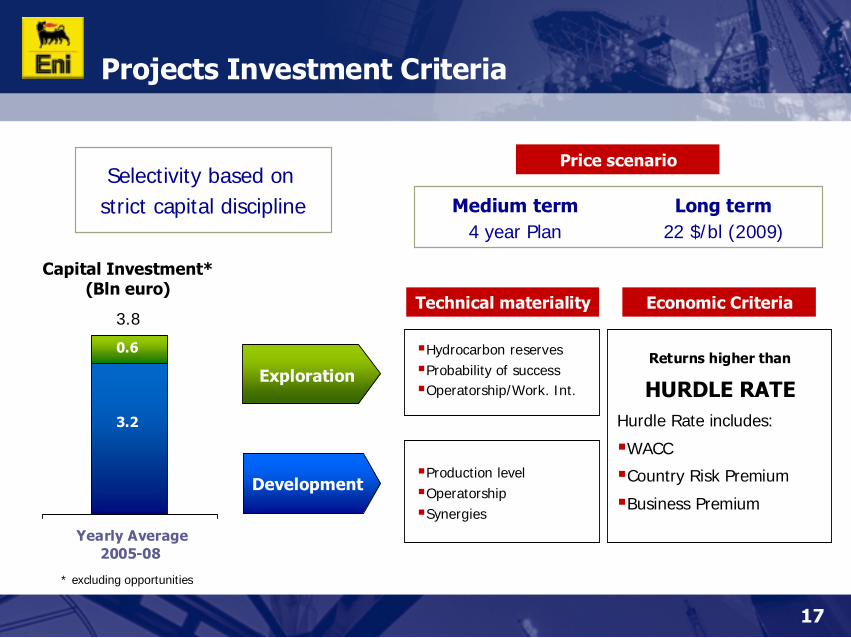
Projects Investment Criteria
Development
Exploration
Yearly Average 2005-08
3.8
Capital Investment*(Bln euro)
0.6
3.2
Technical materiality
�Hydrocarbon reserves�Probability of success �Operatorship/Work. Int.
�Production level�Operatorship�Synergies
Economic Criteria
Returns higher than
HURDLE RATEHurdle Rate includes:
�WACC
�Country Risk Premium
�Business Premium
Selectivity based on strict capital discipline
Price scenario
Medium term Long term4 year Plan 22 $/bl (2009)
* excluding opportunities
18
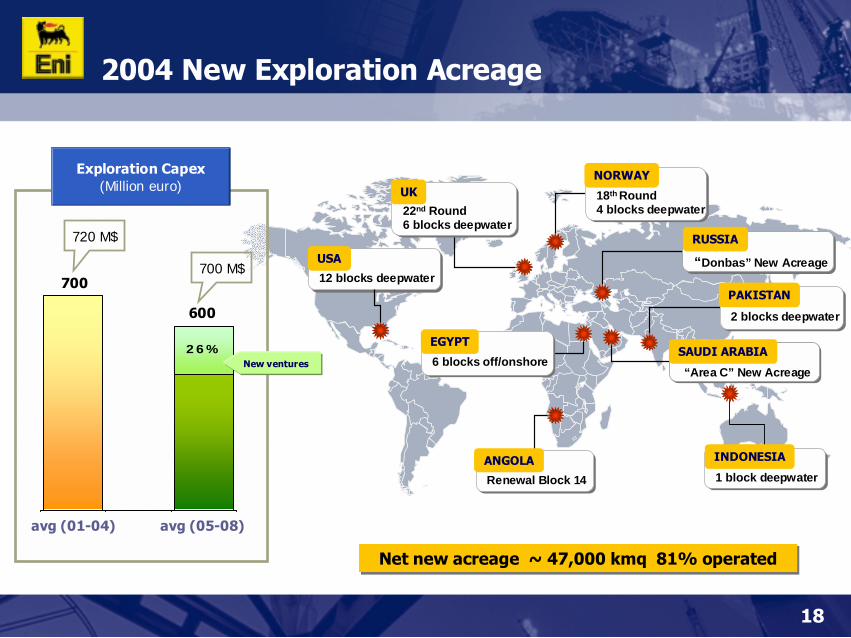
2004 New Exploration Acreage
Net new acreage ~ 47,000 kmq 81% operatedNet new acreage ~ 47,000 kmq 81% operated
6 blocks off/onshore6 blocks off/onshoreEGYPT
12 blocks deepwater12 blocks deepwaterUSA
18th Round4 blocks deepwater18th Round4 blocks deepwater
NORWAY
22nd Round 6 blocks deepwater22nd Round 6 blocks deepwater
UK
2 blocks deepwater2 blocks deepwater
PAKISTAN
Renewal Block 14Renewal Block 14ANGOLA
1 block deepwater1 block deepwaterINDONESIA
“Donbas” New Acreage“Donbas” New Acreage
RUSSIA
“Area C” New Acreage“Area C” New AcreageSAUDI ARABIA26%
0
0
0
0
0
0
0
0
0
0
New ventures
avg (05-08)avg (01-04)
600
720 M$
700 M$
Exploration Capex(Million euro)
700

19
New Acreage in Saudi Arabia – Area C
� “Area C” covers 52,000 square kilometres, located in prolific Rub Al Khali basin
� Eni (50%), Repsol-YPF (30%) and SaudiAramco (20%)
� First exploration period: 5 years
� Concession agreement
� Commercial discoveries of gas developed for domestic market with floor price and take or pay
Aram
co E
aste
rnPr
ovin
ce
Opera
ted
Area
Joint Venture (Shell Op. 40%,
TFE 30% SA 30%)
Gawar oil and gas Field
Rub-Al’Khali
Basin
Shaybah oil Field
20
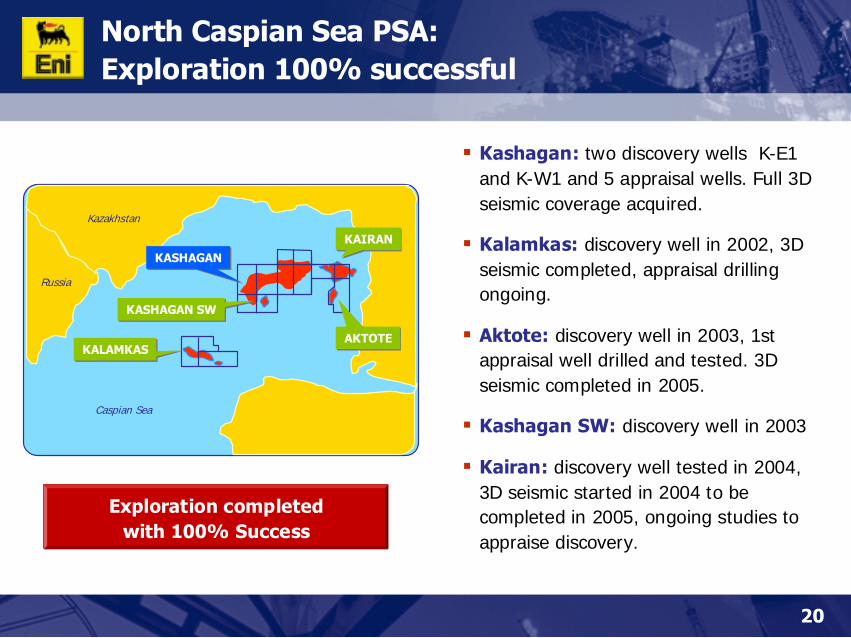
North Caspian Sea PSA: Exploration 100% successful
� Kashagan: two discovery wells K-E1 and K-W1 and 5 appraisal wells. Full 3D seismic coverage acquired.
� Kalamkas: discovery well in 2002, 3D seismic completed, appraisal drillingongoing.
� Aktote: discovery well in 2003, 1st appraisal well drilled and tested. 3D seismic completed in 2005.
� Kashagan SW: discovery well in 2003
� Kairan: discovery well tested in 2004, 3D seismic started in 2004 to becompleted in 2005, ongoing studies toappraise discovery.
Russia
Kazakhstan
Caspian Sea
KASHAGAN SWKASHAGAN SW
KALAMKASKALAMKAS
KAIRANKAIRAN
AKTOTEAKTOTE
KASHAGANKASHAGAN
Exploration completedwith 100% Success

Highlights
Production Trend
Capital Investment
New Opportunities
Projects
21
22
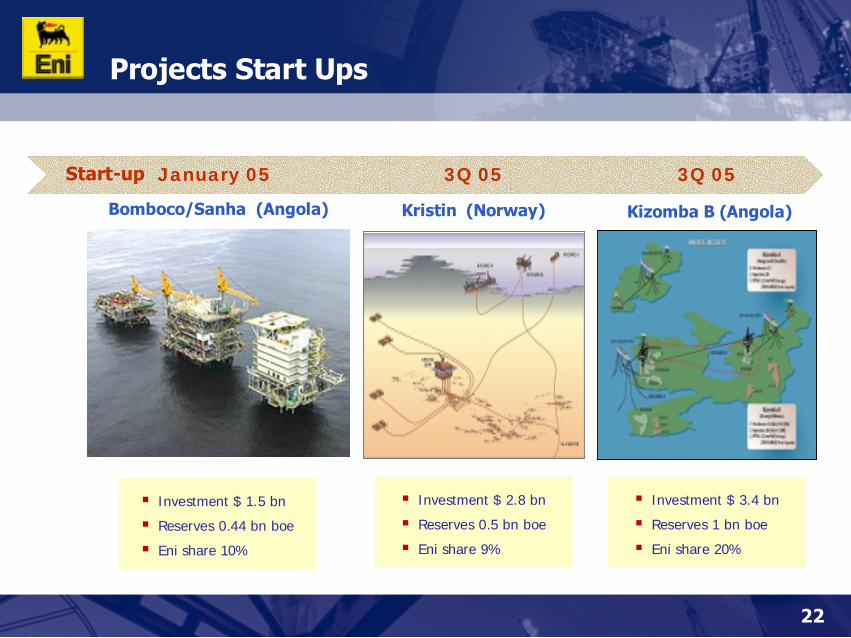
Projects Start Ups
Start-up
Bomboco/Sanha (Angola)
� Investment $ 1.5 bn
� Reserves 0.44 bn boe
� Eni share 10%
January 05
� Investment $ 2.8 bn
� Reserves 0.5 bn boe
� Eni share 9%
Kristin (Norway)
3Q 05
Kizomba B (Angola)
� Investment $ 3.4 bn
� Reserves 1 bn boe
� Eni share 20%
3Q 05
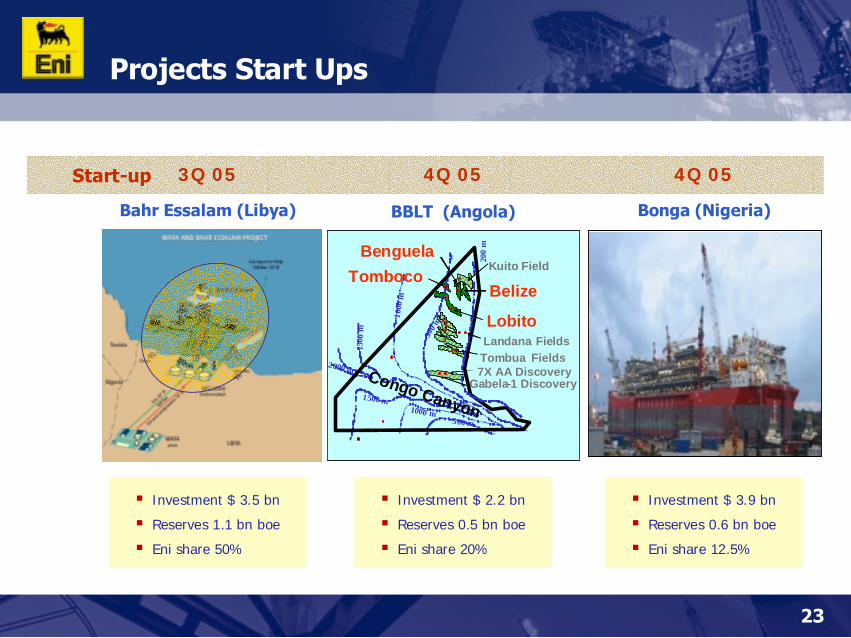
23
Projects Start Ups
� Investment $ 3.9 bn
� Reserves 0.6 bn boe
� Eni share 12.5%
Bonga (Nigeria)
� Investment $ 3.5 bn
� Reserves 1.1 bn boe
� Eni share 50%
Bahr Essalam (Libya)
3Q 05 4Q 05Start-up
Bahr Essalam
BBLT (Angola)
� Investment $ 2.2 bn
� Reserves 0.5 bn boe
� Eni share 20%
4Q 05
2000 m15
0 0 m
1500 m10
00 m
1000 m50
0 m500 m
200
m
Congo Canyon
Lobito
Belize
Tombua Fields7X AA Discovery
BenguelaKuito Field
Tomboco
Landana Fields
Gabela-1 Discovery
2000 m15
0 0 m
1500 m10
00 m
1000 m50
0 m500 m
200
m
Congo Canyon
Lobito
Belize
Tombua Fields7X AA Discovery
BenguelaKuito Field
Tomboco
Landana Fields
Gabela-1 Discovery
24
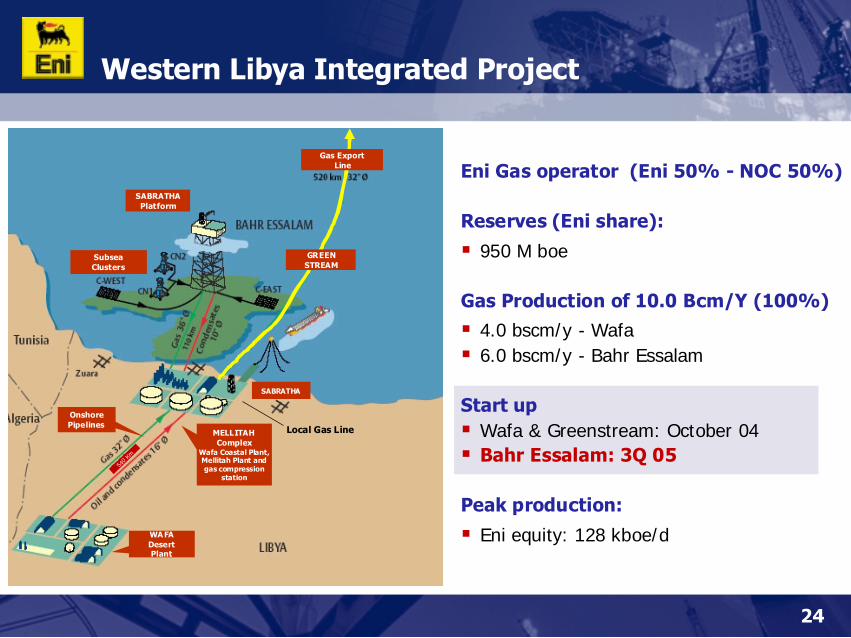
Western Libya Integrated Project
Eni Gas operator (Eni 50% - NOC 50%)
Reserves (Eni share):
� 950 M boe
Gas Production of 10.0 Bcm/Y (100%)� 4.0 bscm/y - Wafa� 6.0 bscm/y - Bahr Essalam
Start up� Wafa & Greenstream: October 04� Bahr Essalam: 3Q 05
Peak production:
� Eni equity: 128 kboe/d
Local Gas Line
540 K
m
Onshore Pipelines
WA FADesert Plant
MELLITAHComplex
Wafa Coastal Plant, Mellitah Plant and gas compression
station
SABRATHA
SABRATHAPlatform
SubseaClusters
Gas Export Line
GREEN STREAM
25
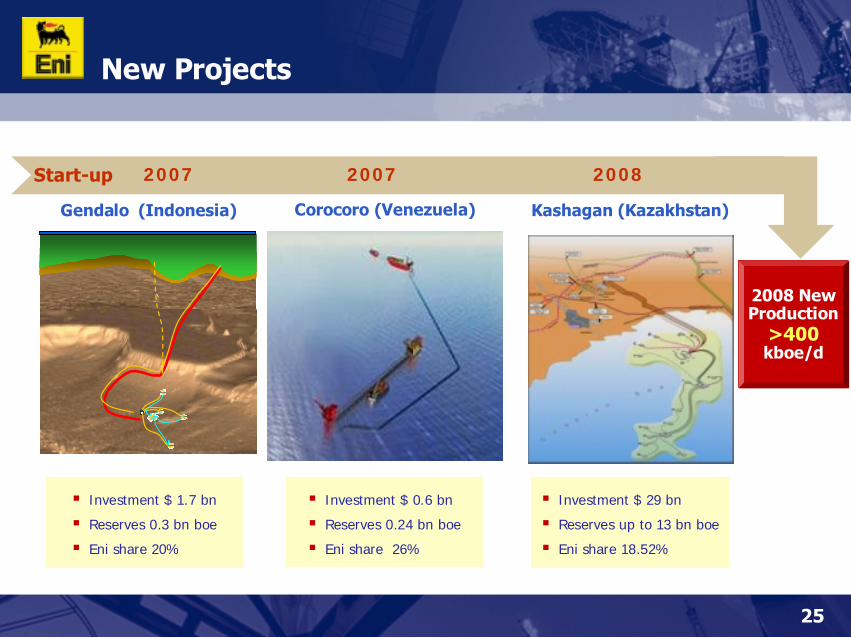
New Projects
2007 2008Start-up
� Investment $ 29 bn
� Reserves up to 13 bn boe
� Eni share 18.52%
Kashagan (Kazakhstan)
� Investment $ 0.6 bn
� Reserves 0.24 bn boe
� Eni share 26%
Corocoro (Venezuela)
2008 New Production
>400kboe/d
� Investment $ 1.7 bn
� Reserves 0.3 bn boe
� Eni share 20%
Gendalo (Indonesia)
2007
26
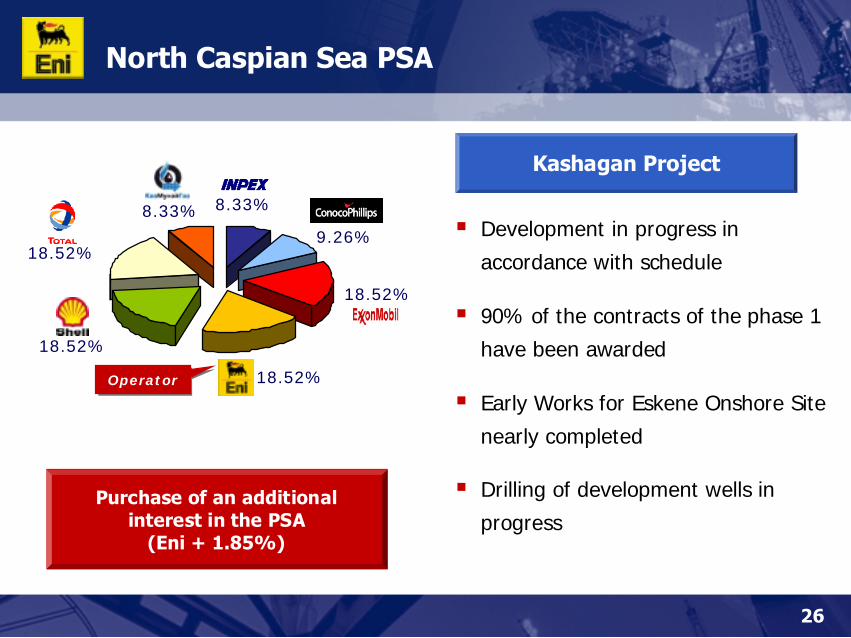
North Caspian Sea PSA
Purchase of an additional interest in the PSA
(Eni + 1.85%)
OperatorOperator 18.52%
18.52%
9.26%
8.33%
18.52%
18.52%
8.33%� Development in progress in
accordance with schedule
� 90% of the contracts of the phase 1
have been awarded
� Early Works for Eskene Onshore Site
nearly completed
� Drilling of development wells in
progress
Kashagan Project
27
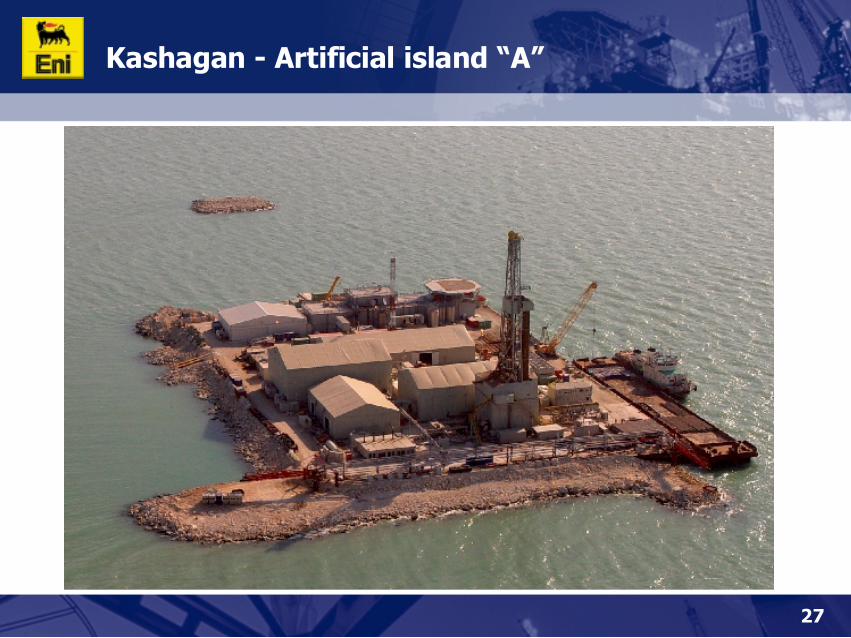
Kashagan - Artificial island “A”

28
Kashagan - Onshore Early Works Progress
29
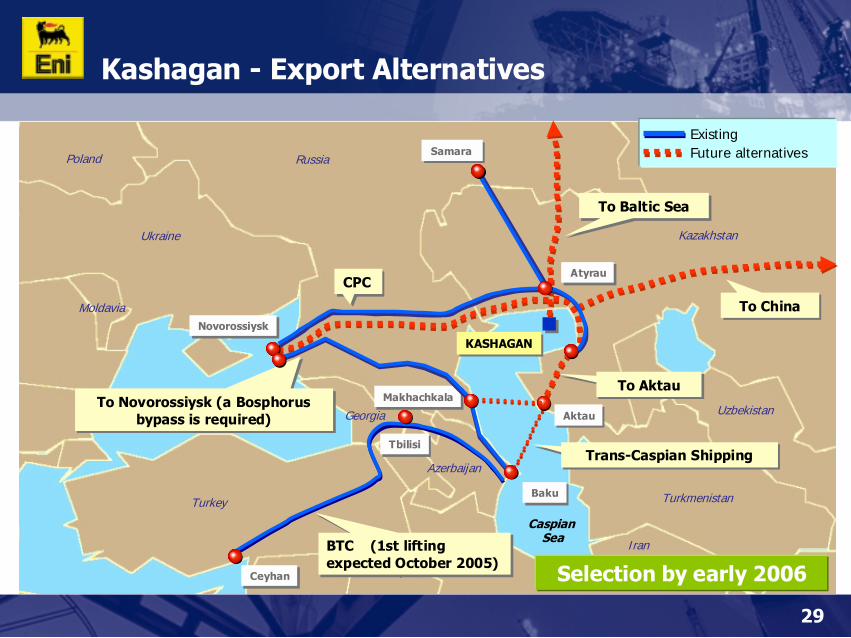
Kashagan - Export Alternatives
Iraq
CaspianSea
KASHAGANKASHAGAN
Samara Samara
Turkey
Uzbekistan
Kazakhstan
Russia
Iran
Georgia
Ukraine
Moldavia
Poland
Turkmenistan
Azerbaijan
CeyhanCeyhan
BTC (1st lifting expected October 2005)BTC (1st lifting expected October 2005)
TbilisiTbilisi
BakuBaku
AtyrauAtyrau
NovorossiyskNovorossiysk
CPCCPC
To Novorossiysk (a Bosphorusbypass is required)
To Novorossiysk (a Bosphorusbypass is required) AktauAktau
To AktauTo Aktau
Trans-Caspian ShippingTrans-Caspian Shipping
To ChinaTo China
To Baltic SeaTo Baltic Sea
ExistingFuture alternatives
Selection by early 2006
MakhachkalaMakhachkala

Highlights
Production Trend
Capital Investment
Projects
New Opportunities
30
31
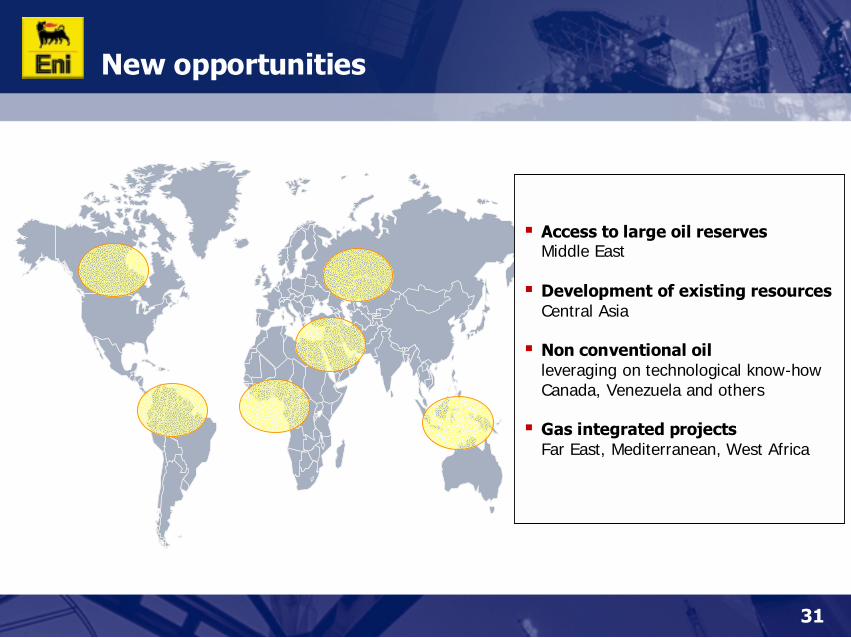
New opportunities
� Access to large oil reservesMiddle East
� Development of existing resourcesCentral Asia
� Non conventional oilleveraging on technological know-howCanada, Venezuela and others
� Gas integrated projectsFar East, Mediterranean, West Africa
32
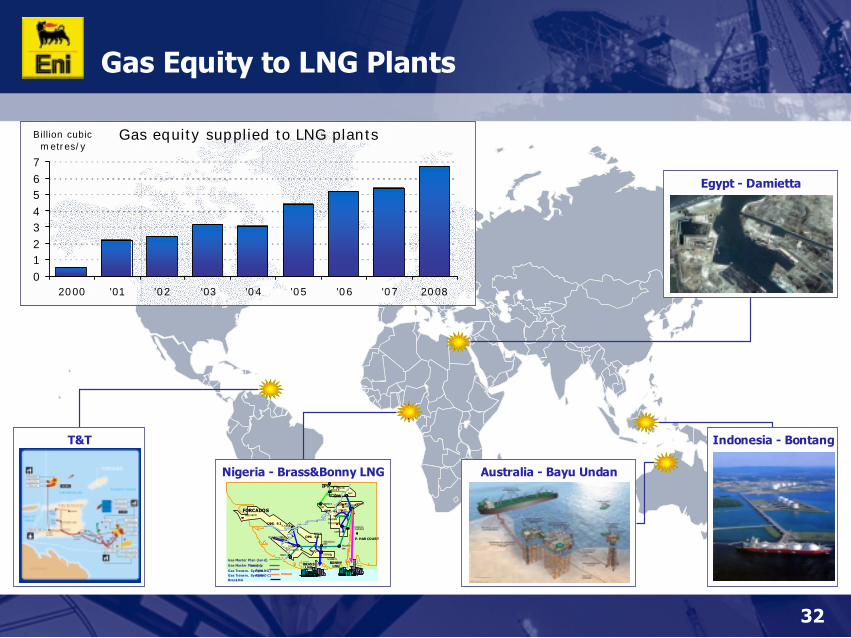
Gas Equity to LNG Plants
Gas equity supplied to LNG plants
01234567
2000 '01 '02 '03 '04 '05 '06 '07 2008
Billion cubic metres/y
Nigeria - Brass&Bonny LNG
TEBIDABA OBAMA
OKPAI
OML 61
MBEDE
EBEGORO
IDUSAMABRI
KWALE
CLOUGH CREEK
OML 6 2
OML 6 3
TUOMO W
ISOKO S. UMUORU
TAYLOR CR.
BENIKU
OGBOGENE
OMOKU W
TUOMO
PIRIGBENE
NIMBE S
AZUZUAMA
ASHAKA
OBIAFU
SAMABRI E.
EBOCHA
OML 6 0
OBRIKOMIRRI
OGBAINBIRI
BENIBOYE
OSHI
EMETTE
EKEDEI
ASEMOKE
AJAKETON
MANUSO
BRAS SBRAS SLNGLNG
FORCADOSFORCADOS
AKRI
OGODAmanifold
YENAGOAtie-in
ENWHEtie-in
BONNYBONNYLNGLNG
IPPIPP
Gas Master Plan (lan d)
Gas Master Plan (swamp)
Gas Transm. System 1 (N-LNG)Gas Transm. System 4 (NAO C)BrassLNG
P. HAR COURT
T&T Indonesia - Bontang
Australia - Bayu Undan
Egypt - Damietta
33
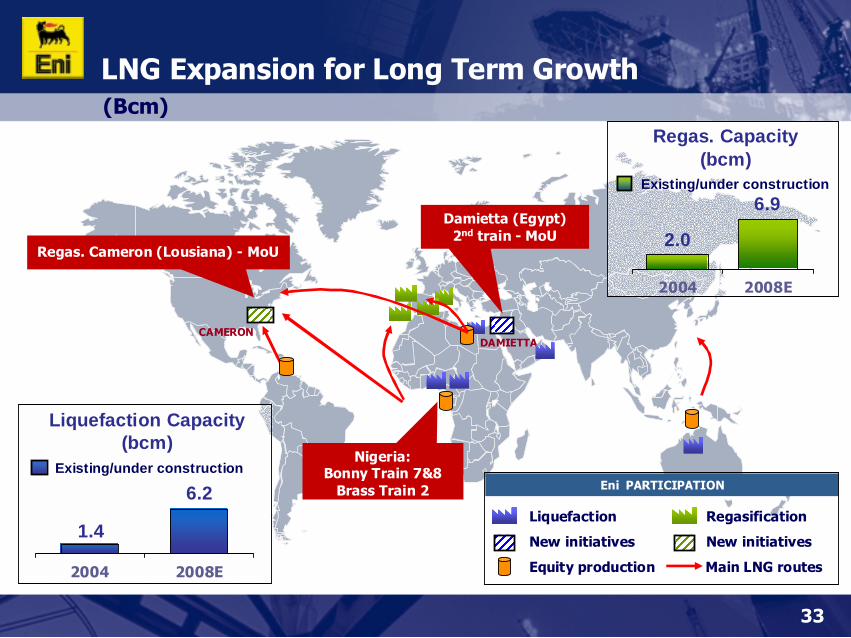
(Bcm)
LNG Expansion for Long Term Growth
DAMIETTA
Regas. Cameron (Lousiana) - MoU
CAMERON
2004 2008E
Liquefaction Capacity(bcm)
1.4
6.2Existing/under construction
Eni PARTICIPATION
Liquefaction Regasification
New initiatives New initiatives
Equity production Main LNG routes
Damietta (Egypt) 2nd train - MoU
Nigeria:Bonny Train 7&8
Brass Train 2
2.0
6.9
Regas. Capacity(bcm)
Existing/under construction
2004 2008E
34
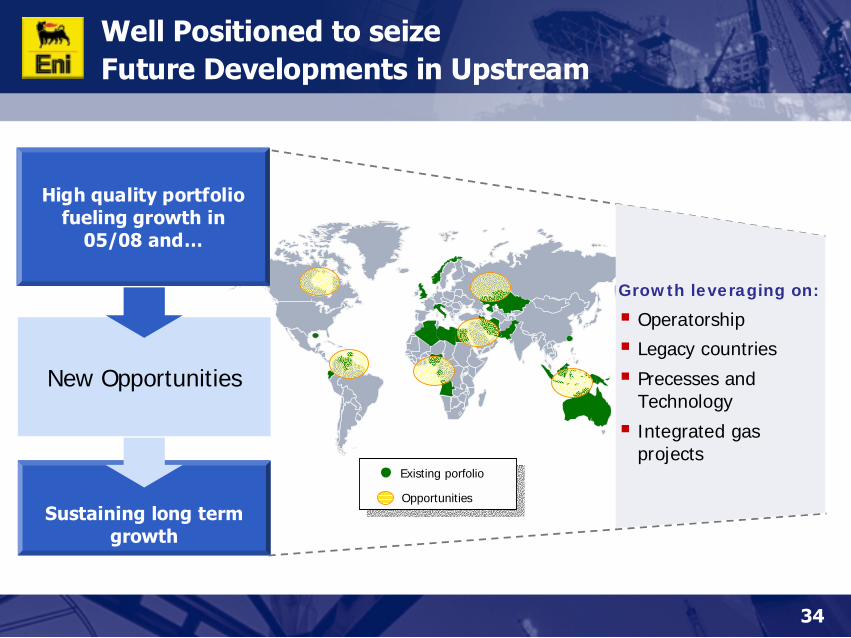
Well Positioned to seizeFuture Developments in Upstream
Sustaining long term growth
New Opportunities
Existing porfolio
Opportunities
High quality portfolio fueling growth in
05/08 and…
Growth leveraging on:
� Operatorship
� Legacy countries
� Precesses and Technology
� Integrated gas projects

E&P Business TrendCSFB Oil & Gas Conference
London, June 8th, 2005
A. BelottiSenior Vice PresidentE&P Business Planning


![CSFB OG Industry Primer[1]](https://img.pdfslide.us/doc/110x75/577ccf8d1a28ab9e789003f4/csfb-og-industry-primer1.jpg)