Embed Size (px)
Citation preview
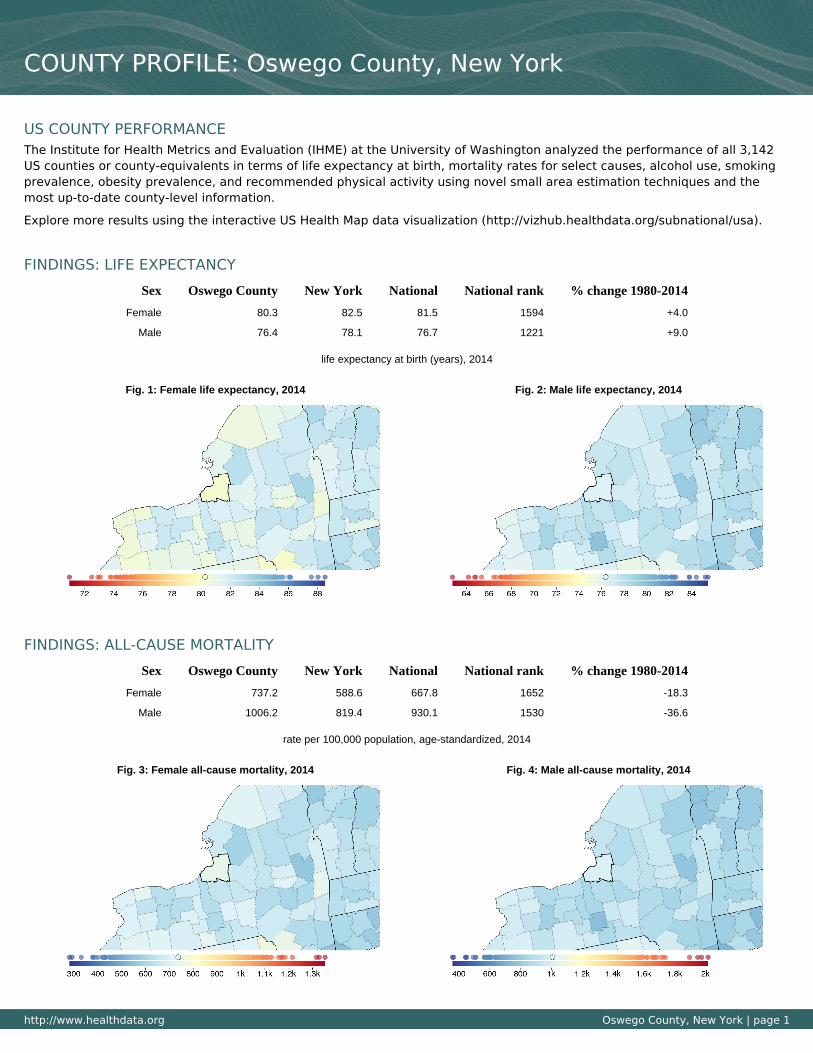
COUNTY PROFILE: Oswego County, New York
http://www.healthdata.org Oswego County, New York | page 1
US COUNTY PERFORMANCEThe Institute for Health Metrics and Evaluation (IHME) at the University of Washington analyzed the performance of all 3,142US counties or county-equivalents in terms of life expectancy at birth, mortality rates for select causes, alcohol use, smokingprevalence, obesity prevalence, and recommended physical activity using novel small area estimation techniques and themost up-to-date county-level information.
Explore more results using the interactive US Health Map data visualization (http://vizhub.healthdata.org/subnational/usa).
FINDINGS: LIFE EXPECTANCY
Sex Oswego County New York National National rank % change 1980-2014
Female 80.3 82.5 81.5 1594 +4.0
Male 76.4 78.1 76.7 1221 +9.0
life expectancy at birth (years), 2014
Fig. 1: Female life expectancy, 2014 Fig. 2: Male life expectancy, 2014
FINDINGS: ALL-CAUSE MORTALITY
Sex Oswego County New York National National rank % change 1980-2014
Female 737.2 588.6 667.8 1652 -18.3
Male 1006.2 819.4 930.1 1530 -36.6
rate per 100,000 population, age-standardized, 2014
Fig. 3: Female all-cause mortality, 2014 Fig. 4: Male all-cause mortality, 2014
http://www.healthdata.org Oswego County, New York | page 2
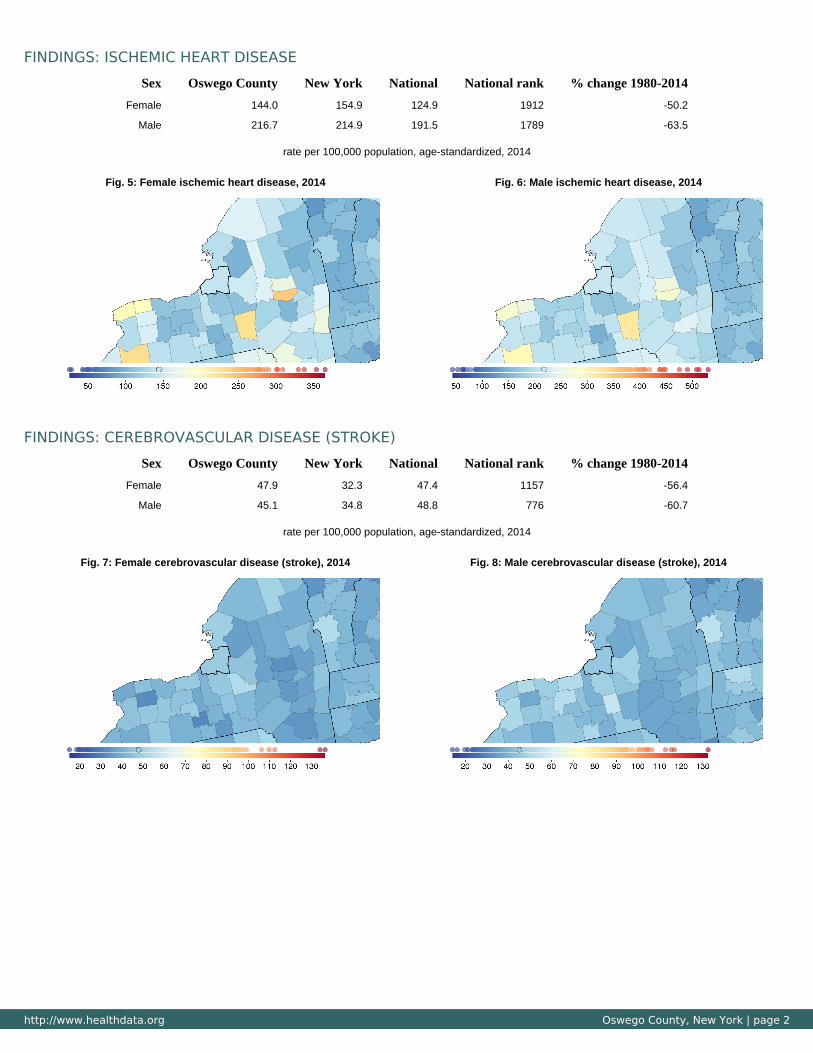
FINDINGS: ISCHEMIC HEART DISEASE
Sex Oswego County New York National National rank % change 1980-2014
Female 144.0 154.9 124.9 1912 -50.2
Male 216.7 214.9 191.5 1789 -63.5
rate per 100,000 population, age-standardized, 2014
Fig. 5: Female ischemic heart disease, 2014 Fig. 6: Male ischemic heart disease, 2014
FINDINGS: CEREBROVASCULAR DISEASE (STROKE)
Sex Oswego County New York National National rank % change 1980-2014
Female 47.9 32.3 47.4 1157 -56.4
Male 45.1 34.8 48.8 776 -60.7
rate per 100,000 population, age-standardized, 2014
Fig. 7: Female cerebrovascular disease (stroke), 2014 Fig. 8: Male cerebrovascular disease (stroke), 2014
http://www.healthdata.org Oswego County, New York | page 3
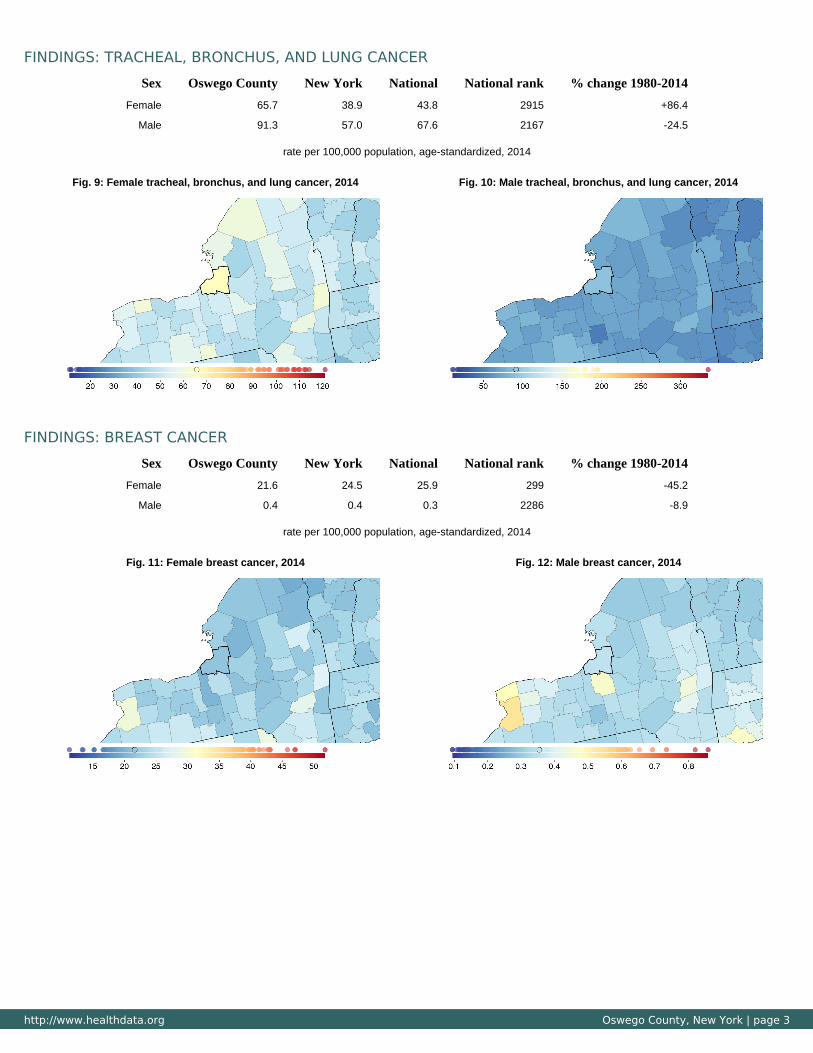
FINDINGS: TRACHEAL, BRONCHUS, AND LUNG CANCER
Sex Oswego County New York National National rank % change 1980-2014
Female 65.7 38.9 43.8 2915 +86.4
Male 91.3 57.0 67.6 2167 -24.5
rate per 100,000 population, age-standardized, 2014
Fig. 9: Female tracheal, bronchus, and lung cancer, 2014 Fig. 10: Male tracheal, bronchus, and lung cancer, 2014
FINDINGS: BREAST CANCER
Sex Oswego County New York National National rank % change 1980-2014
Female 21.6 24.5 25.9 299 -45.2
Male 0.4 0.4 0.3 2286 -8.9
rate per 100,000 population, age-standardized, 2014
Fig. 11: Female breast cancer, 2014 Fig. 12: Male breast cancer, 2014
http://www.healthdata.org Oswego County, New York | page 4
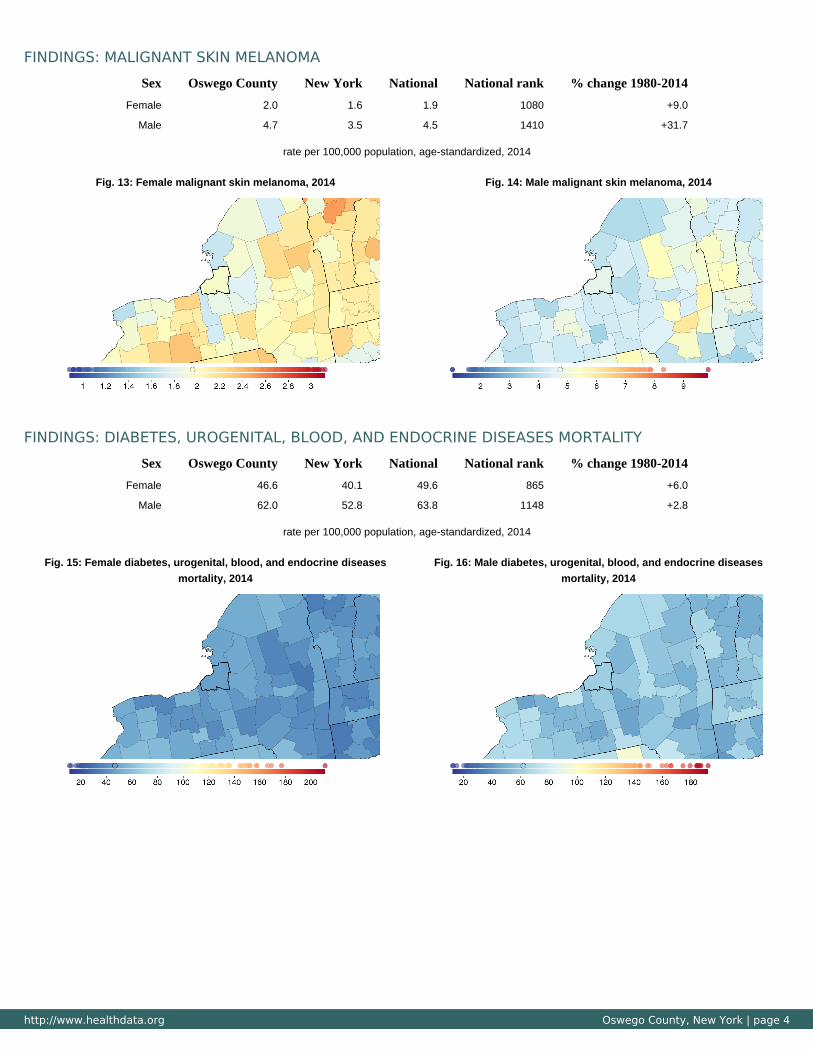
FINDINGS: MALIGNANT SKIN MELANOMA
Sex Oswego County New York National National rank % change 1980-2014
Female 2.0 1.6 1.9 1080 +9.0
Male 4.7 3.5 4.5 1410 +31.7
rate per 100,000 population, age-standardized, 2014
Fig. 13: Female malignant skin melanoma, 2014 Fig. 14: Male malignant skin melanoma, 2014
FINDINGS: DIABETES, UROGENITAL, BLOOD, AND ENDOCRINE DISEASES MORTALITY
Sex Oswego County New York National National rank % change 1980-2014
Female 46.6 40.1 49.6 865 +6.0
Male 62.0 52.8 63.8 1148 +2.8
rate per 100,000 population, age-standardized, 2014
Fig. 15: Female diabetes, urogenital, blood, and endocrine diseases
mortality, 2014
Fig. 16: Male diabetes, urogenital, blood, and endocrine diseases
mortality, 2014
http://www.healthdata.org Oswego County, New York | page 5
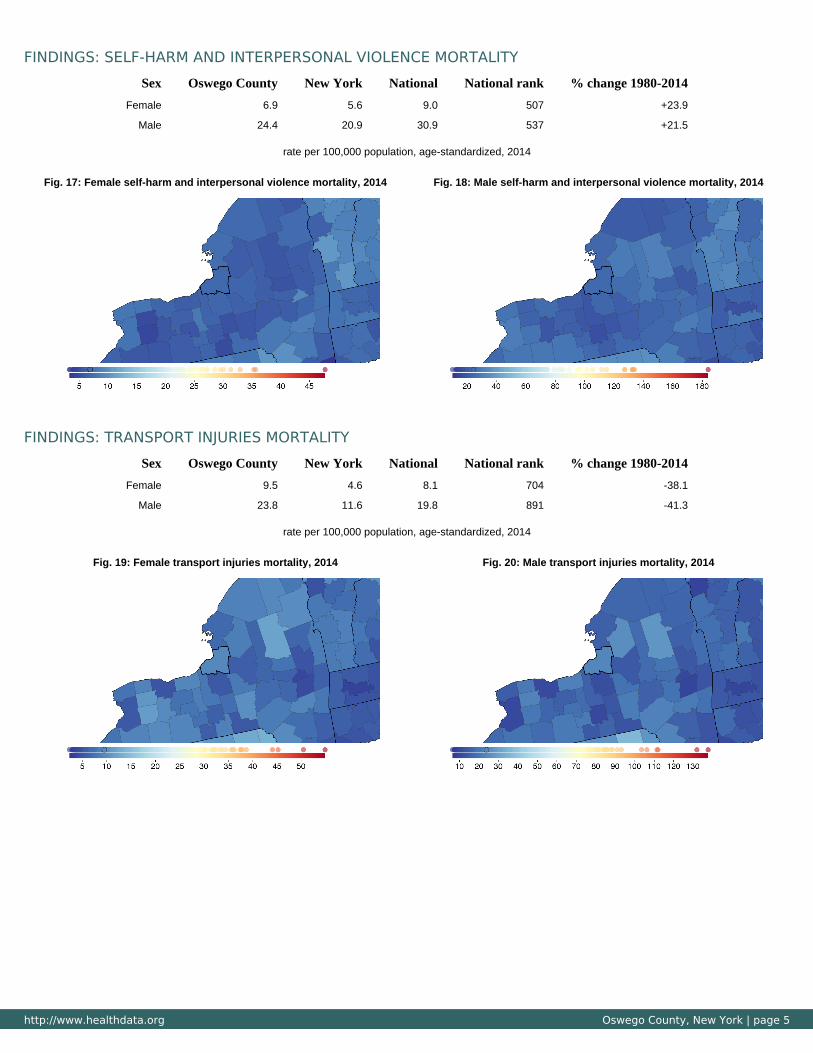
FINDINGS: SELF-HARM AND INTERPERSONAL VIOLENCE MORTALITY
Sex Oswego County New York National National rank % change 1980-2014
Female 6.9 5.6 9.0 507 +23.9
Male 24.4 20.9 30.9 537 +21.5
rate per 100,000 population, age-standardized, 2014
Fig. 17: Female self-harm and interpersonal violence mortality, 2014 Fig. 18: Male self-harm and interpersonal violence mortality, 2014
FINDINGS: TRANSPORT INJURIES MORTALITY
Sex Oswego County New York National National rank % change 1980-2014
Female 9.5 4.6 8.1 704 -38.1
Male 23.8 11.6 19.8 891 -41.3
rate per 100,000 population, age-standardized, 2014
Fig. 19: Female transport injuries mortality, 2014 Fig. 20: Male transport injuries mortality, 2014
http://www.healthdata.org Oswego County, New York | page 6
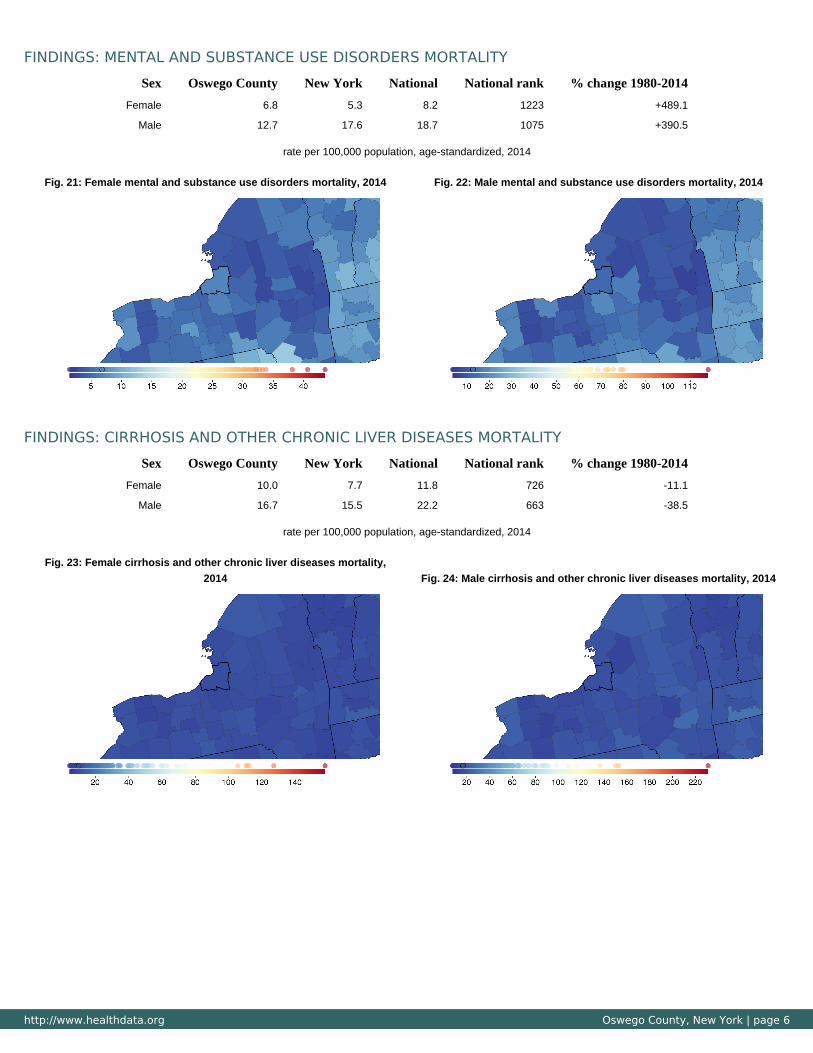
FINDINGS: MENTAL AND SUBSTANCE USE DISORDERS MORTALITY
Sex Oswego County New York National National rank % change 1980-2014
Female 6.8 5.3 8.2 1223 +489.1
Male 12.7 17.6 18.7 1075 +390.5
rate per 100,000 population, age-standardized, 2014
Fig. 21: Female mental and substance use disorders mortality, 2014 Fig. 22: Male mental and substance use disorders mortality, 2014
FINDINGS: CIRRHOSIS AND OTHER CHRONIC LIVER DISEASES MORTALITY
Sex Oswego County New York National National rank % change 1980-2014
Female 10.0 7.7 11.8 726 -11.1
Male 16.7 15.5 22.2 663 -38.5
rate per 100,000 population, age-standardized, 2014
Fig. 23: Female cirrhosis and other chronic liver diseases mortality,
2014 Fig. 24: Male cirrhosis and other chronic liver diseases mortality, 2014
http://www.healthdata.org Oswego County, New York | page 7
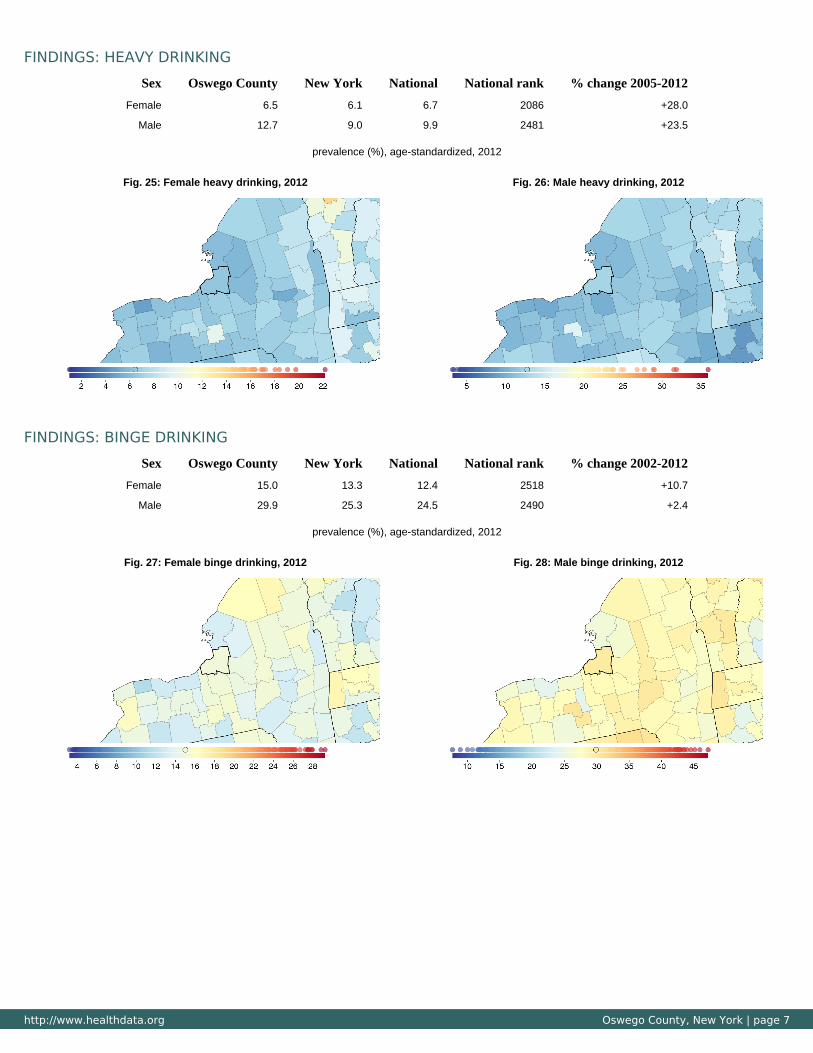
FINDINGS: HEAVY DRINKING
Sex Oswego County New York National National rank % change 2005-2012
Female 6.5 6.1 6.7 2086 +28.0
Male 12.7 9.0 9.9 2481 +23.5
prevalence (%), age-standardized, 2012
Fig. 25: Female heavy drinking, 2012 Fig. 26: Male heavy drinking, 2012
FINDINGS: BINGE DRINKING
Sex Oswego County New York National National rank % change 2002-2012
Female 15.0 13.3 12.4 2518 +10.7
Male 29.9 25.3 24.5 2490 +2.4
prevalence (%), age-standardized, 2012
Fig. 27: Female binge drinking, 2012 Fig. 28: Male binge drinking, 2012
http://www.healthdata.org Oswego County, New York | page 8
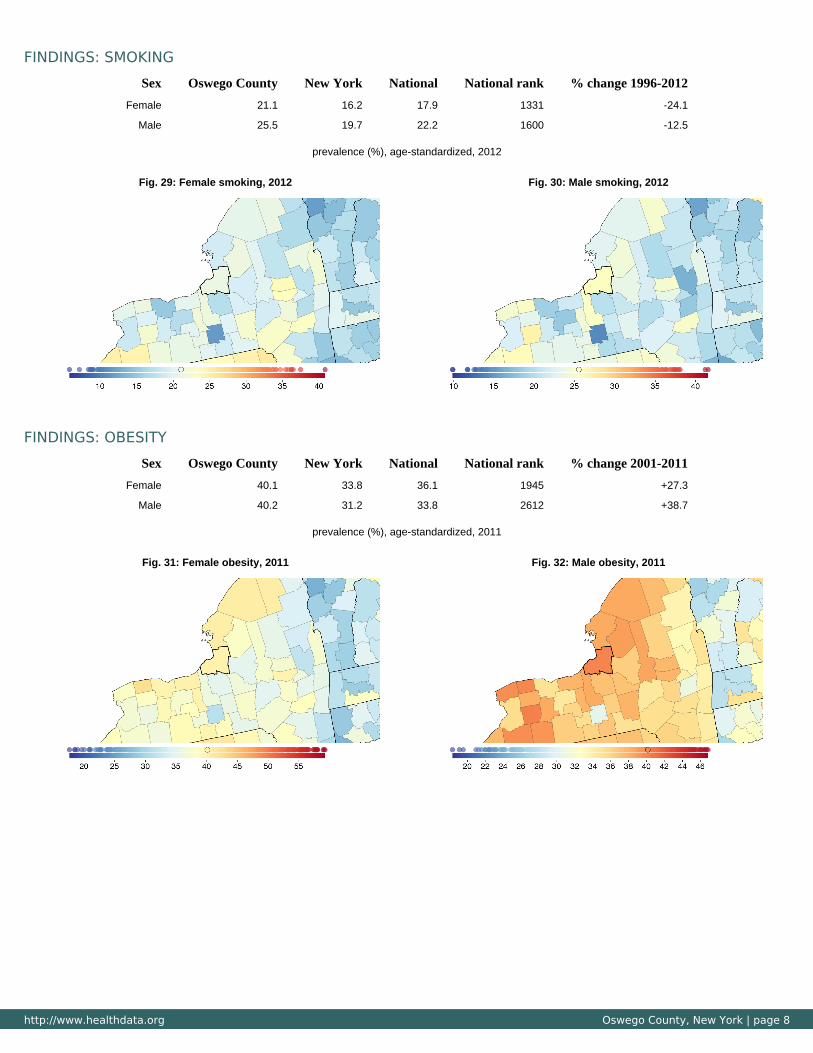
FINDINGS: SMOKING
Sex Oswego County New York National National rank % change 1996-2012
Female 21.1 16.2 17.9 1331 -24.1
Male 25.5 19.7 22.2 1600 -12.5
prevalence (%), age-standardized, 2012
Fig. 29: Female smoking, 2012 Fig. 30: Male smoking, 2012
FINDINGS: OBESITY
Sex Oswego County New York National National rank % change 2001-2011
Female 40.1 33.8 36.1 1945 +27.3
Male 40.2 31.2 33.8 2612 +38.7
prevalence (%), age-standardized, 2011
Fig. 31: Female obesity, 2011 Fig. 32: Male obesity, 2011
http://www.healthdata.org Oswego County, New York | page 9
Institute for Health Metrics and Evaluation2301 Fifth Ave., Suite 600Seattle, WA 98121 USA
Telephone: +1-206-897-2800E-mail: [email protected]
Institute for Health Metrics and Evaluation (IHME),US County Profile: Oswego County, New York.Seattle, WA: IHME, 2016.
CITATION:
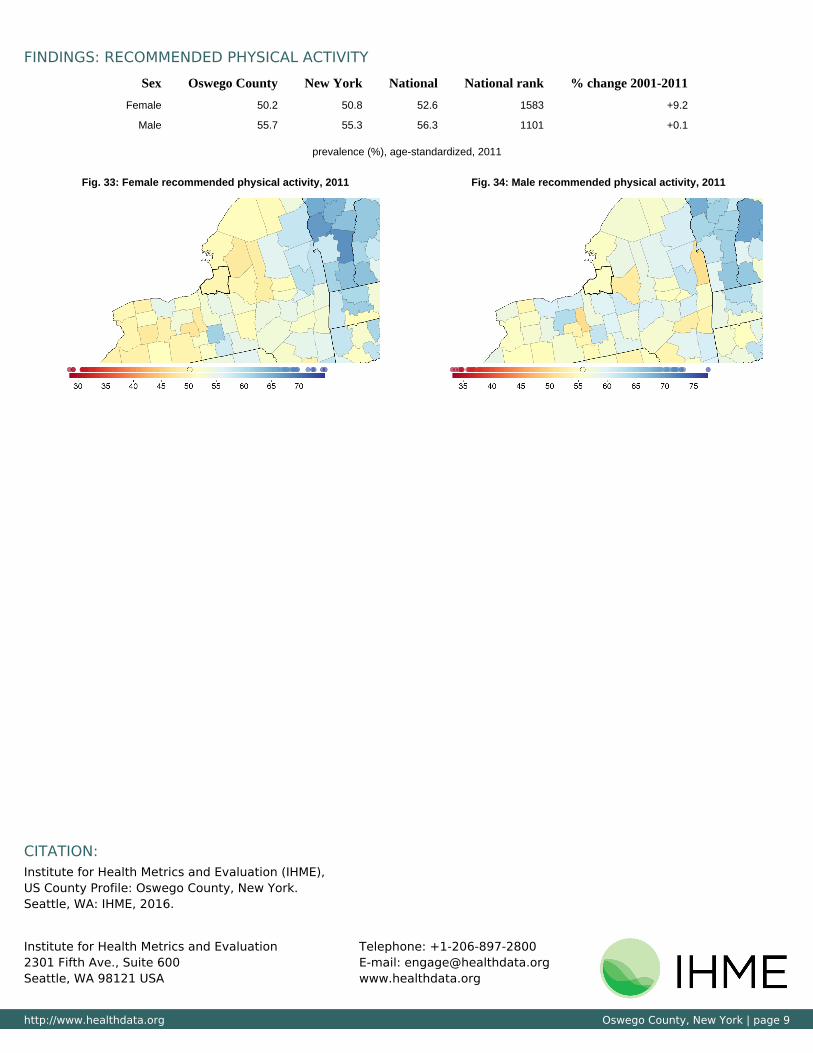
FINDINGS: RECOMMENDED PHYSICAL ACTIVITY
Sex Oswego County New York National National rank % change 2001-2011
Female 50.2 50.8 52.6 1583 +9.2
Male 55.7 55.3 56.3 1101 +0.1
prevalence (%), age-standardized, 2011
Fig. 33: Female recommended physical activity, 2011 Fig. 34: Male recommended physical activity, 2011