Embed Size (px)
Citation preview
Ketterings, Q.M., H. Krol, W.S. Reid and J. van der Heide (2004). Oswego County Soil Sample Survey 1995-2001. CSS Extension Bulletin E04-22. 37 pages.
1
Soil Sample Survey
Oswego Co.
Samples analyzed by CNAL in 1995-2001
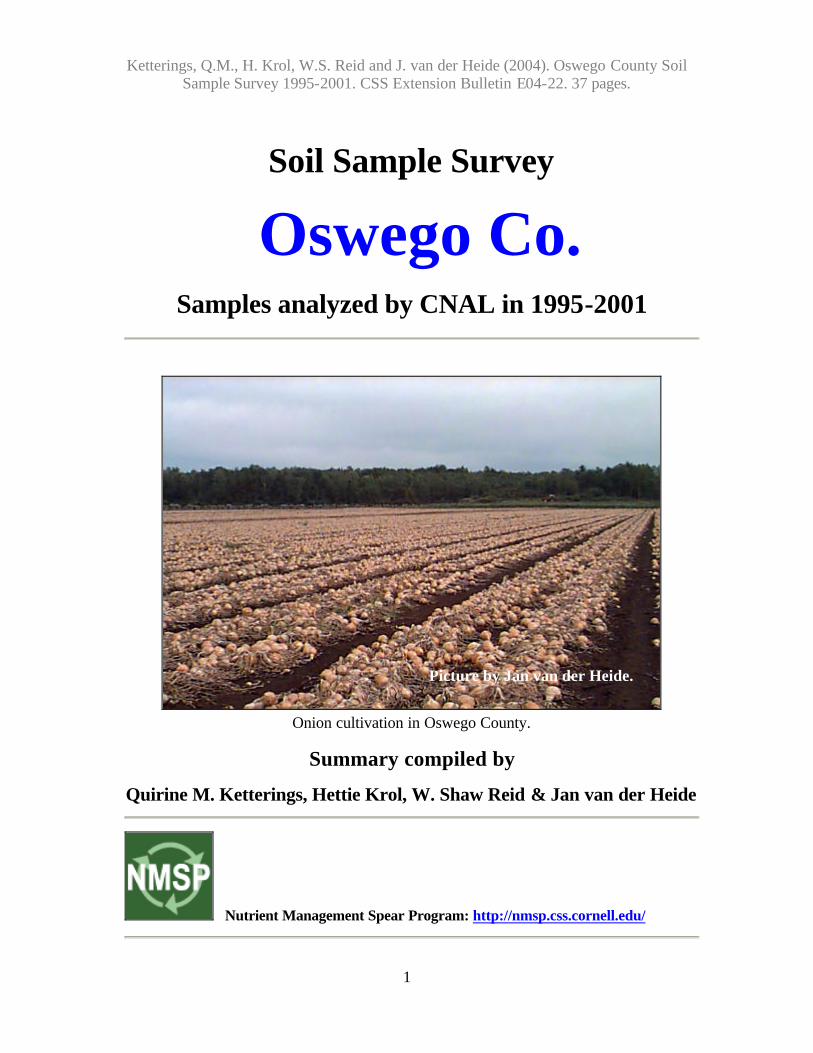
Onion cultivation in Oswego County.
Summary compiled by
Quirine M. Ketterings, Hettie Krol, W. Shaw Reid & Jan van der Heide
Nutrient Management Spear Program: http://nmsp.css.cornell.edu/
Picture by Jan van der Heide.
Ketterings, Q.M., H. Krol, W.S. Reid and J. van der Heide (2004). Oswego County Soil Sample Survey 1995-2001. CSS Extension Bulletin E04-22. 37 pages.
2
Soil Sample Survey
Oswego Co. Samples analyzed by CNAL in 1995-2001
Summary compiled by
Quirine Ketterings and Hettie Krol Nutrient Management Spear Program Department of Crop and Soil Sciences 817 Bradfield Hall, Cornell University
Ithaca NY 14853
W. Shaw Reid Professor Emeritus
Department of Crop and Soil Sciences
Jan van der Heide Horticultural Crops Educator
Cornell Cooperative Extension of Oswego County
May 25, 2004
Correct Citation:
Ketterings, Q.M., H. Krol, W.S. Reid, and J. van der Heide (2004). Soil samples survey of Oswego County. Samples analyzed by the Cornell Nutrient Analysis Laboratory in 1995-2001. CSS Extension Bulletin E04-22. 37 pages.
Ketterings, Q.M., H. Krol, W.S. Reid and J. van der Heide (2004). Oswego County Soil Sample Survey 1995-2001. CSS Extension Bulletin E04-22. 37 pages.
3
Table of Content
1. General Survey Summary................................................................................................4 2. Cropping Systems ............................................................................................................9
2.1 Samples for Home and Garden..................................................................................9 2.2 Samples for Commercial Production.......................................................................10
3. Soil Types ......................................................................................................................12 3.1 Samples for Home and Garden................................................................................12 3.2 Samples for Commercial Production.......................................................................13
4. Organic Matter ...............................................................................................................14 4.1 Samples for Home and Garden................................................................................14 4.2 Samples for Commercial Production.......................................................................15
5. pH ..................................................................................................................................16 5.1 Samples for Home and Garden................................................................................16 5.2 Samples for Commercial Production.......................................................................17
6. Phosphorus.....................................................................................................................18 6.1 Samples for Home and Garden................................................................................18 6.2 Samples for Commercial Production.......................................................................19
7. Potassium.......................................................................................................................20 7.1 Samples for Home and Garden................................................................................20 7.2 Samples for Commercial Production.......................................................................23
8. Magnesium ....................................................................................................................26 8.1 Samples for Home and Garden................................................................................26 8.2 Samples for Commercial Production.......................................................................27
9. Iron.................................................................................................................................28 9.1 Samples for Home and Garden................................................................................28 9.2 Samples for Commercial Production.......................................................................29
10. Manganese ...................................................................................................................30 10.1 Samples for Home and Garden..............................................................................30 10.2 Samples for Commercial Production.....................................................................31
11. Zinc ..............................................................................................................................32 11.1 Samples for Home and Garden..............................................................................32 11.2 Samples for Commercial Production.....................................................................33
Appendix: Cornell Crop Codes .........................................................................................34
4
1. General Survey Summary
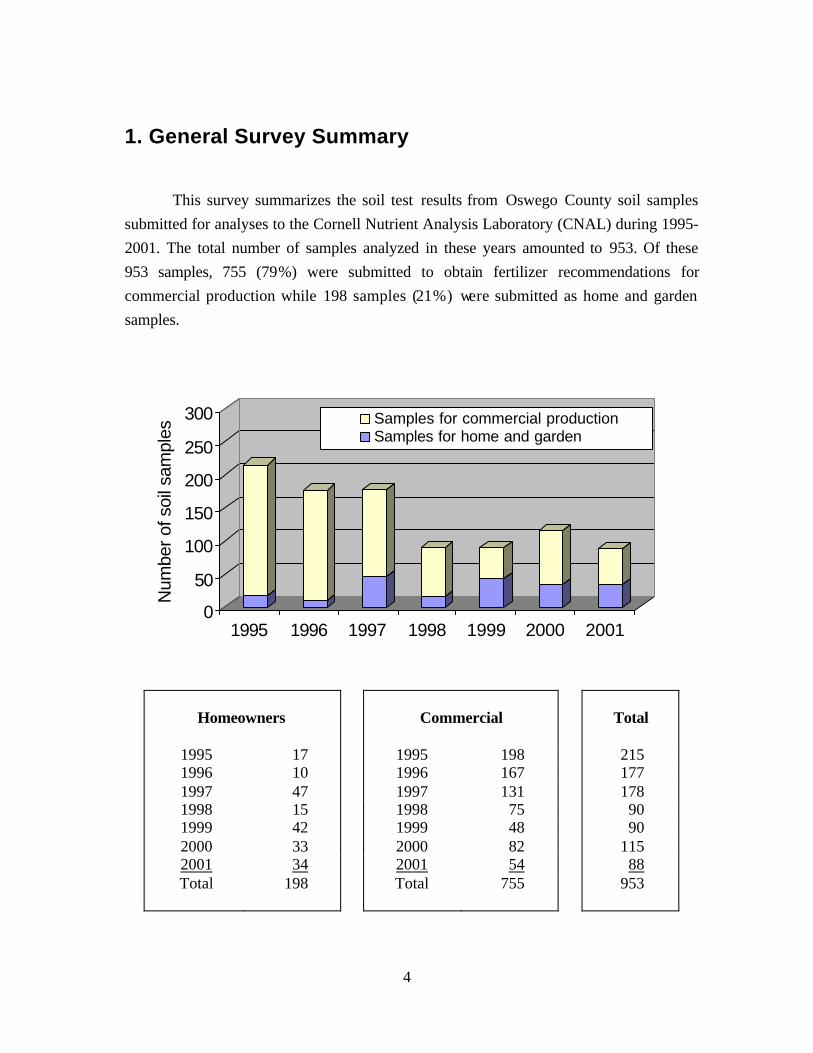
This survey summarizes the soil test results from Oswego County soil samples submitted for analyses to the Cornell Nutrient Analysis Laboratory (CNAL) during 1995-2001. The total number of samples analyzed in these years amounted to 953. Of these 953 samples, 755 (79%) were submitted to obtain fertilizer recommendations for commercial production while 198 samples (21%) were submitted as home and garden samples.
0
50
100
150
200
250
300
Num
ber o
f soi
l sam
ples
1995 1996 1997 1998 1999 2000 2001
Samples for commercial productionSamples for home and garden
Homeowners
Commercial
Total
1995 17 1995 198 215 1996 10 1996 167 177 1997 47 1997 131 178 1998 15 1998 75 90 1999 42 1999 48 90 2000 33 2000 82 115 2001 34 2001 54 88 Total
198 Total 755 953
Ketterings, Q.M., H. Krol, W.S. Reid and J. van der Heide (2004). Oswego County Soil Sample Survey 1995-2001. CSS Extension Bulletin E04-22. 37 pages.
5
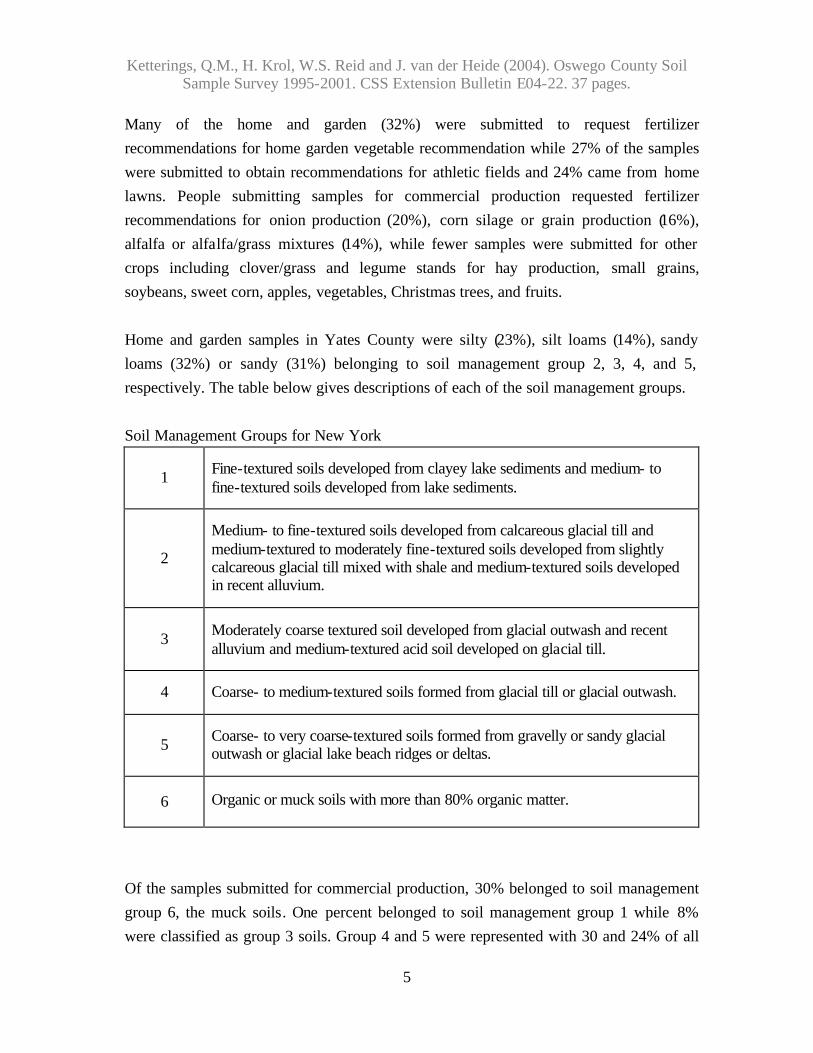
Many of the home and garden (32%) were submitted to request fertilizer recommendations for home garden vegetable recommendation while 27% of the samples were submitted to obtain recommendations for athletic fields and 24% came from home lawns. People submitting samples for commercial production requested fertilizer recommendations for onion production (20%), corn silage or grain production (16%), alfalfa or alfalfa/grass mixtures (14%), while fewer samples were submitted for other crops including clover/grass and legume stands for hay production, small grains, soybeans, sweet corn, apples, vegetables, Christmas trees, and fruits. Home and garden samples in Yates County were silty (23%), silt loams (14%), sandy loams (32%) or sandy (31%) belonging to soil management group 2, 3, 4, and 5, respectively. The table below gives descriptions of each of the soil management groups. Soil Management Groups for New York
1
Fine-textured soils developed from clayey lake sediments and medium- to fine-textured soils developed from lake sediments.
2
Medium- to fine-textured soils developed from calcareous glacial till and medium-textured to moderately fine-textured soils developed from slightly calcareous glacial till mixed with shale and medium-textured soils developed in recent alluvium.
3
Moderately coarse textured soil developed from glacial outwash and recent alluvium and medium-textured acid soil developed on glacial till.
4
Coarse- to medium-textured soils formed from glacial till or glacial outwash.
5
Coarse- to very coarse-textured soils formed from gravelly or sandy glacial outwash or glacial lake beach ridges or deltas.
6 Organic or muck soils with more than 80% organic matter.
Of the samples submitted for commercial production, 30% belonged to soil management group 6, the muck soils. One percent belonged to soil management group 1 while 8% were classified as group 3 soils. Group 4 and 5 were represented with 30 and 24% of all
Ketterings, Q.M., H. Krol, W.S. Reid and J. van der Heide (2004). Oswego County Soil Sample Survey 1995-2001. CSS Extension Bulletin E04-22. 37 pages.
6
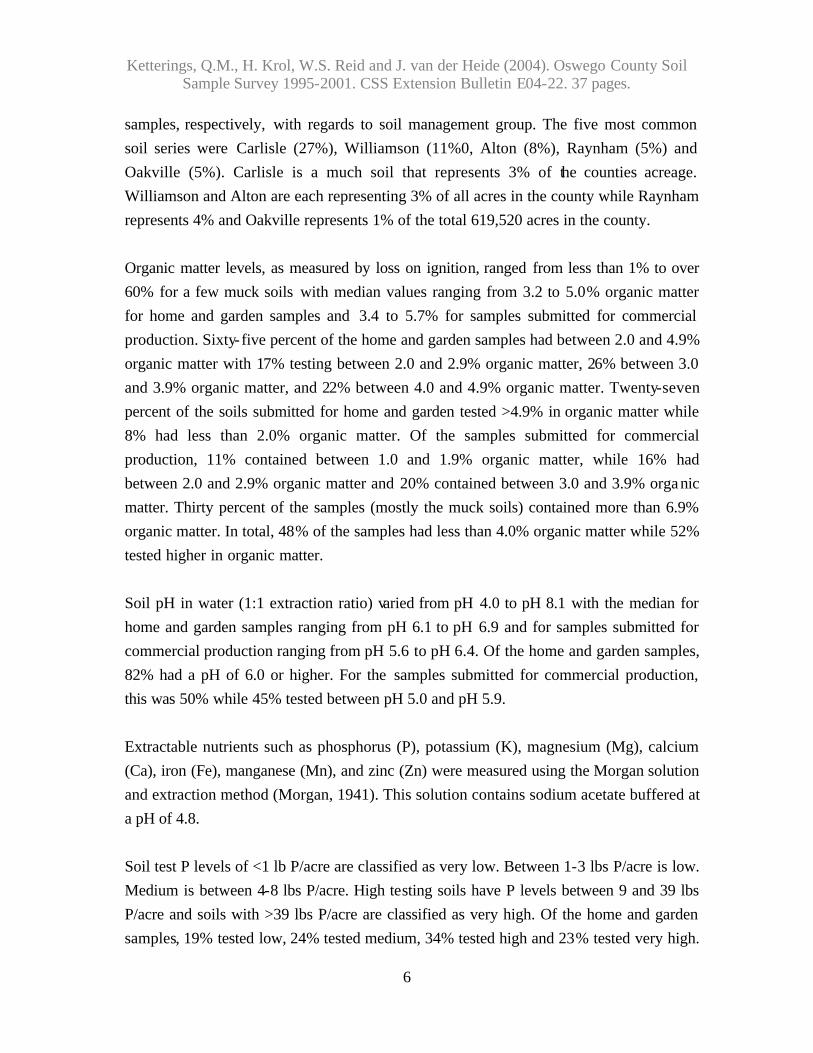
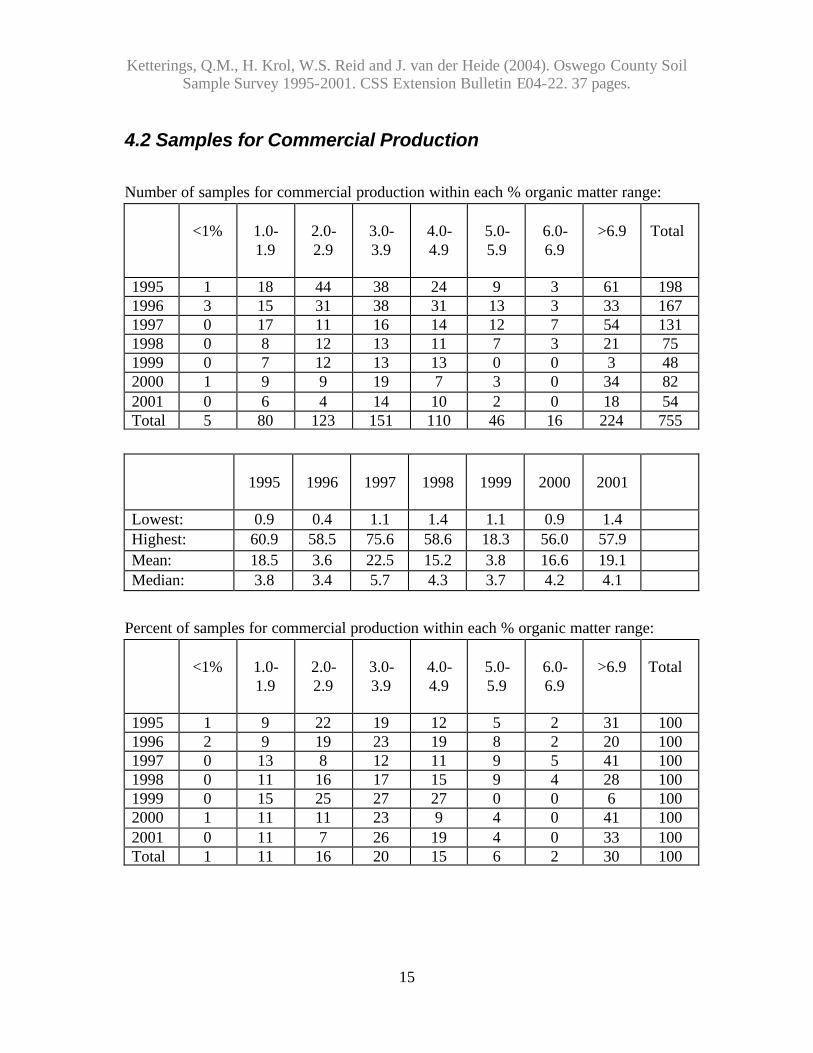
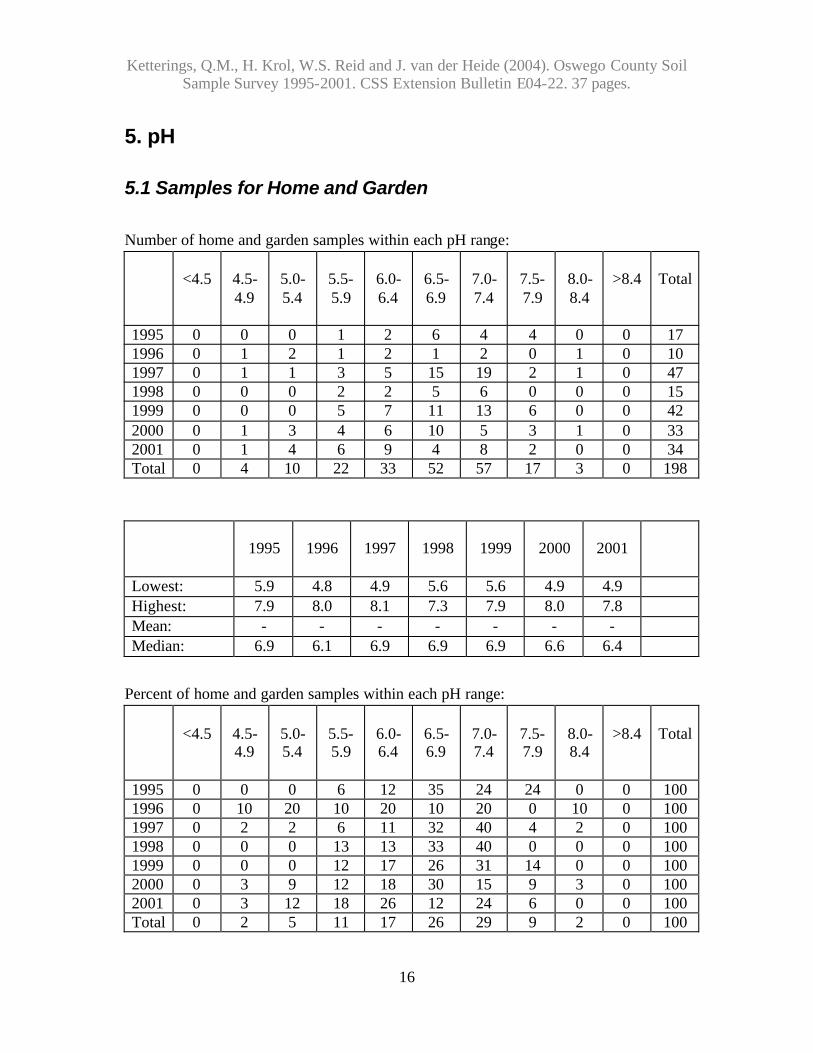
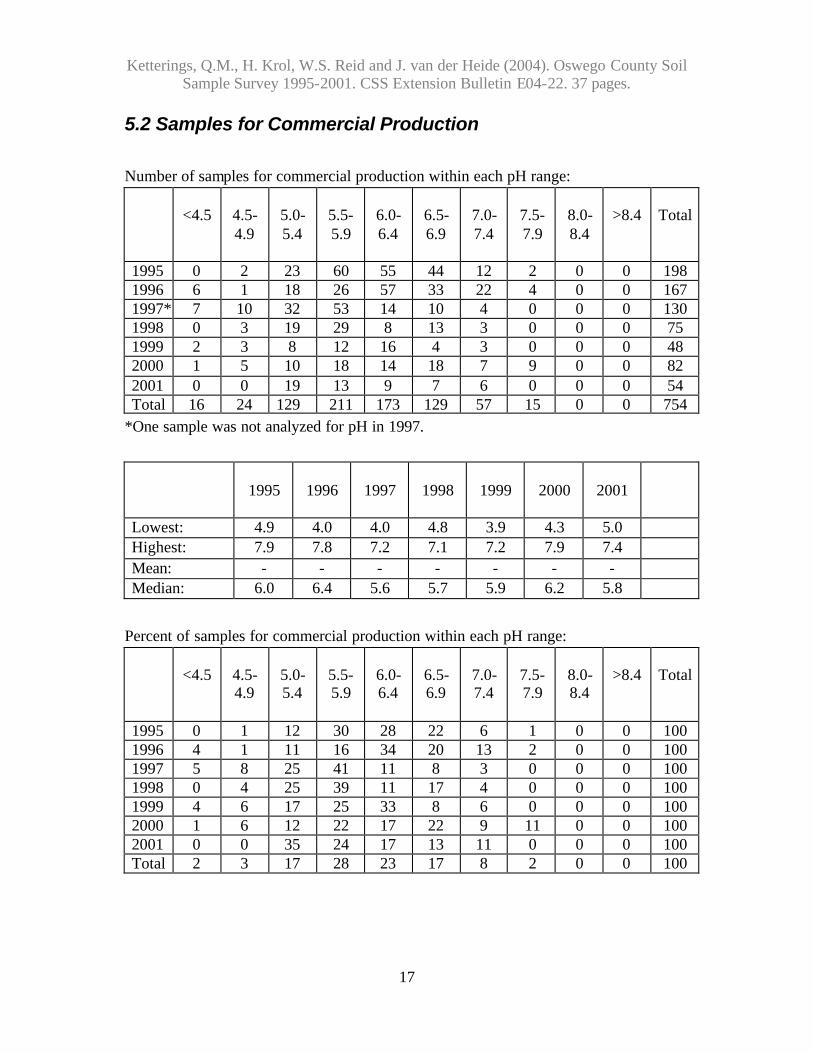
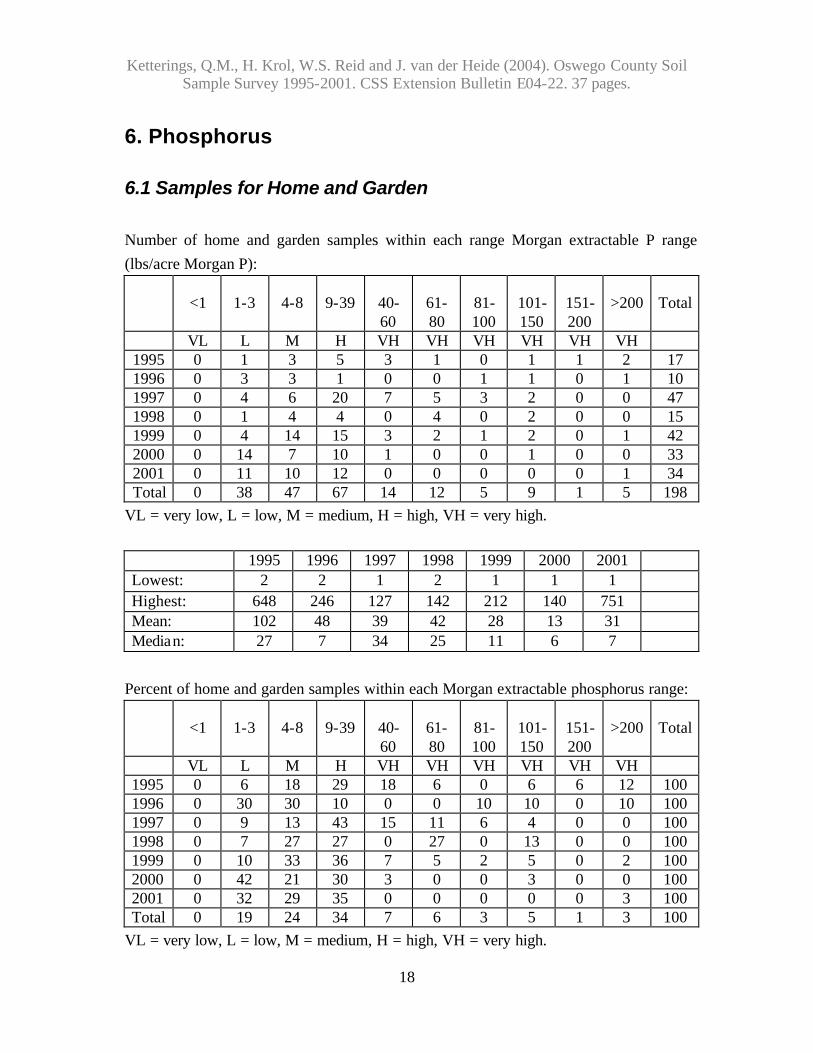
samples, respectively, with regards to soil management group. The five most common soil series were Carlisle (27%), Williamson (11%0, Alton (8%), Raynham (5%) and Oakville (5%). Carlisle is a much soil that represents 3% of the counties acreage. Williamson and Alton are each representing 3% of all acres in the county while Raynham represents 4% and Oakville represents 1% of the total 619,520 acres in the county. Organic matter levels, as measured by loss on ignition, ranged from less than 1% to over 60% for a few muck soils with median values ranging from 3.2 to 5.0% organic matter for home and garden samples and 3.4 to 5.7% for samples submitted for commercial production. Sixty-five percent of the home and garden samples had between 2.0 and 4.9% organic matter with 17% testing between 2.0 and 2.9% organic matter, 26% between 3.0 and 3.9% organic matter, and 22% between 4.0 and 4.9% organic matter. Twenty-seven percent of the soils submitted for home and garden tested >4.9% in organic matter while 8% had less than 2.0% organic matter. Of the samples submitted for commercial production, 11% contained between 1.0 and 1.9% organic matter, while 16% had between 2.0 and 2.9% organic matter and 20% contained between 3.0 and 3.9% organic matter. Thirty percent of the samples (mostly the muck soils) contained more than 6.9% organic matter. In total, 48% of the samples had less than 4.0% organic matter while 52% tested higher in organic matter. Soil pH in water (1:1 extraction ratio) varied from pH 4.0 to pH 8.1 with the median for home and garden samples ranging from pH 6.1 to pH 6.9 and for samples submitted for commercial production ranging from pH 5.6 to pH 6.4. Of the home and garden samples, 82% had a pH of 6.0 or higher. For the samples submitted for commercial production, this was 50% while 45% tested between pH 5.0 and pH 5.9. Extractable nutrients such as phosphorus (P), potassium (K), magnesium (Mg), calcium (Ca), iron (Fe), manganese (Mn), and zinc (Zn) were measured using the Morgan solution and extraction method (Morgan, 1941). This solution contains sodium acetate buffered at a pH of 4.8. Soil test P levels of <1 lb P/acre are classified as very low. Between 1-3 lbs P/acre is low. Medium is between 4-8 lbs P/acre. High testing soils have P levels between 9 and 39 lbs P/acre and soils with >39 lbs P/acre are classified as very high. Of the home and garden samples, 19% tested low, 24% tested medium, 34% tested high and 23% tested very high.
Ketterings, Q.M., H. Krol, W.S. Reid and J. van der Heide (2004). Oswego County Soil Sample Survey 1995-2001. CSS Extension Bulletin E04-22. 37 pages.
7
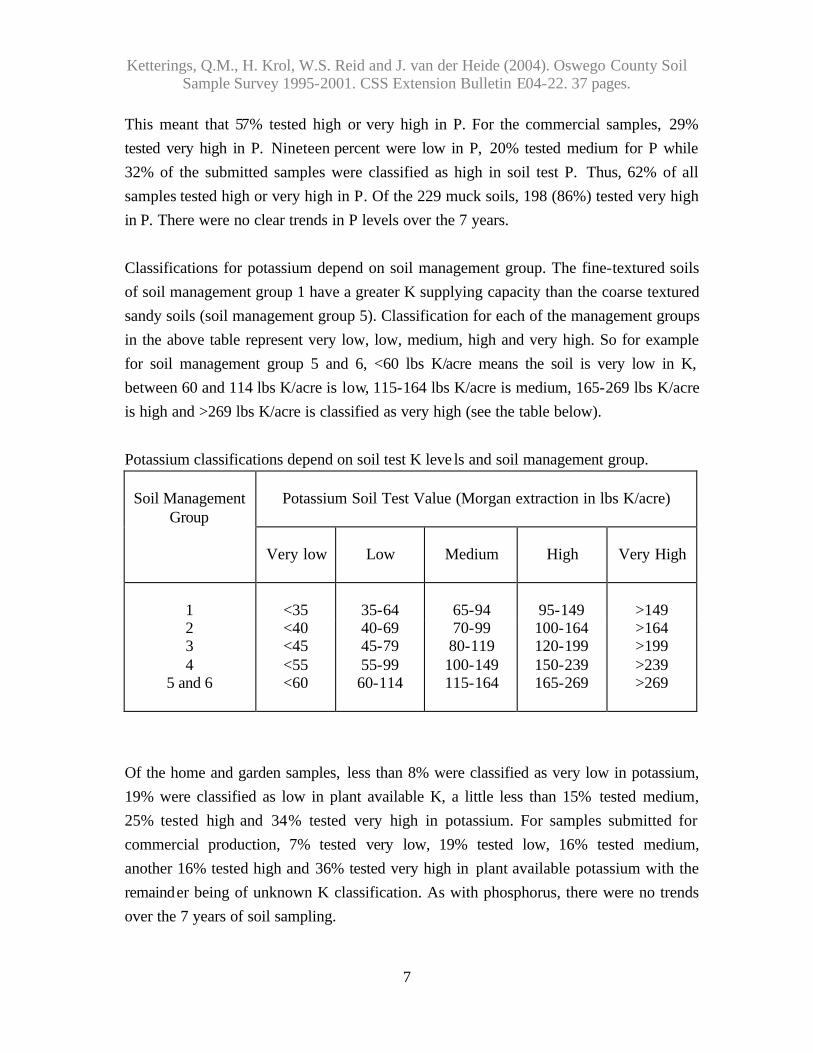
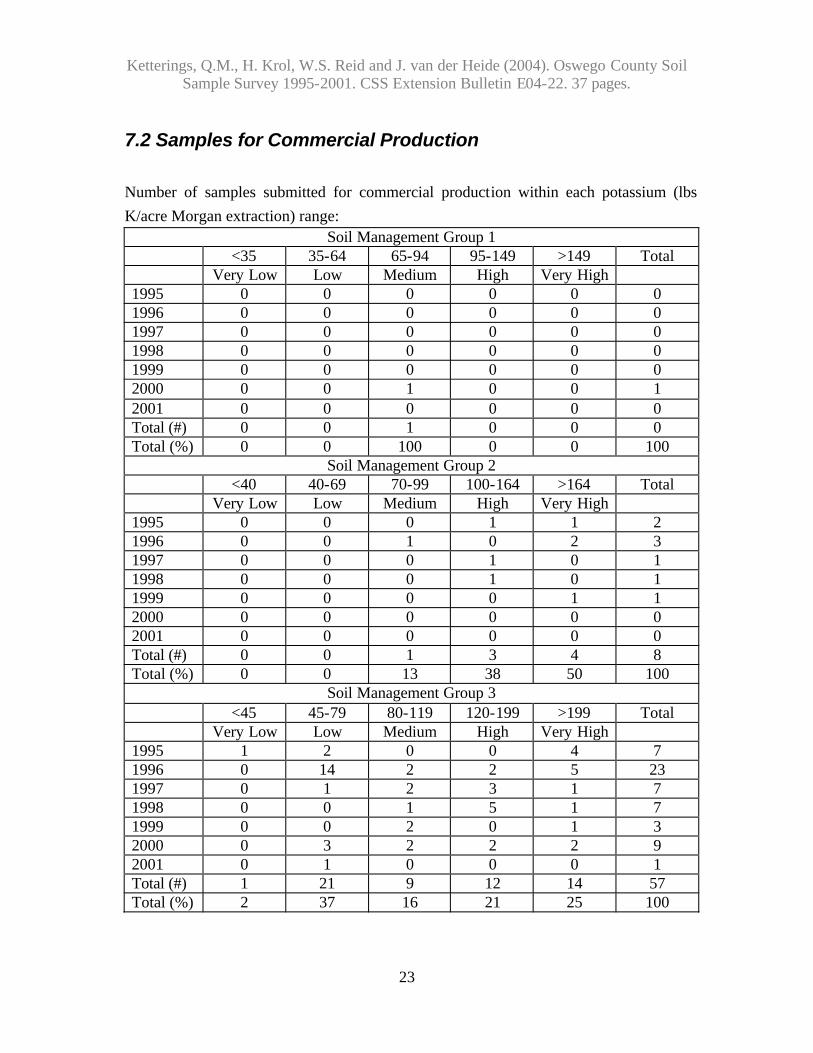
This meant that 57% tested high or very high in P. For the commercial samples, 29% tested very high in P. Nineteen percent were low in P, 20% tested medium for P while 32% of the submitted samples were classified as high in soil test P. Thus, 62% of all samples tested high or very high in P. Of the 229 muck soils, 198 (86%) tested very high in P. There were no clear trends in P levels over the 7 years. Classifications for potassium depend on soil management group. The fine-textured soils of soil management group 1 have a greater K supplying capacity than the coarse textured sandy soils (soil management group 5). Classification for each of the management groups in the above table represent very low, low, medium, high and very high. So for example for soil management group 5 and 6, <60 lbs K/acre means the soil is very low in K, between 60 and 114 lbs K/acre is low, 115-164 lbs K/acre is medium, 165-269 lbs K/acre is high and >269 lbs K/acre is classified as very high (see the table below). Potassium classifications depend on soil test K leve ls and soil management group.
Potassium Soil Test Value (Morgan extraction in lbs K/acre)
Soil Management
Group
Very low
Low
Medium
High
Very High
1
<35
35-64
65-94
95-149
>149
2 <40 40-69 70-99 100-164 >164 3 <45 45-79 80-119 120-199 >199 4 <55 55-99 100-149 150-239 >239
5 and 6 <60 60-114 115-164 165-269 >269
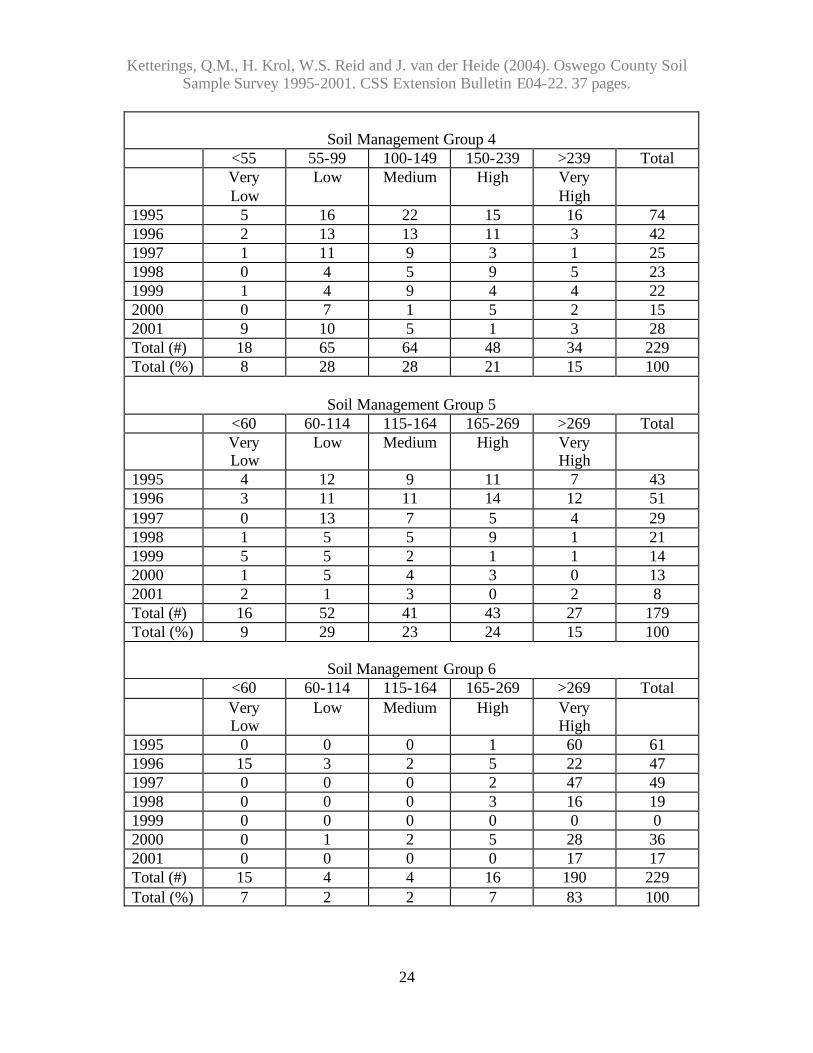
Of the home and garden samples, less than 8% were classified as very low in potassium, 19% were classified as low in plant available K, a little less than 15% tested medium, 25% tested high and 34% tested very high in potassium. For samples submitted for commercial production, 7% tested very low, 19% tested low, 16% tested medium, another 16% tested high and 36% tested very high in plant available potassium with the remainder being of unknown K classification. As with phosphorus, there were no trends over the 7 years of soil sampling.
Ketterings, Q.M., H. Krol, W.S. Reid and J. van der Heide (2004). Oswego County Soil Sample Survey 1995-2001. CSS Extension Bulletin E04-22. 37 pages.
8
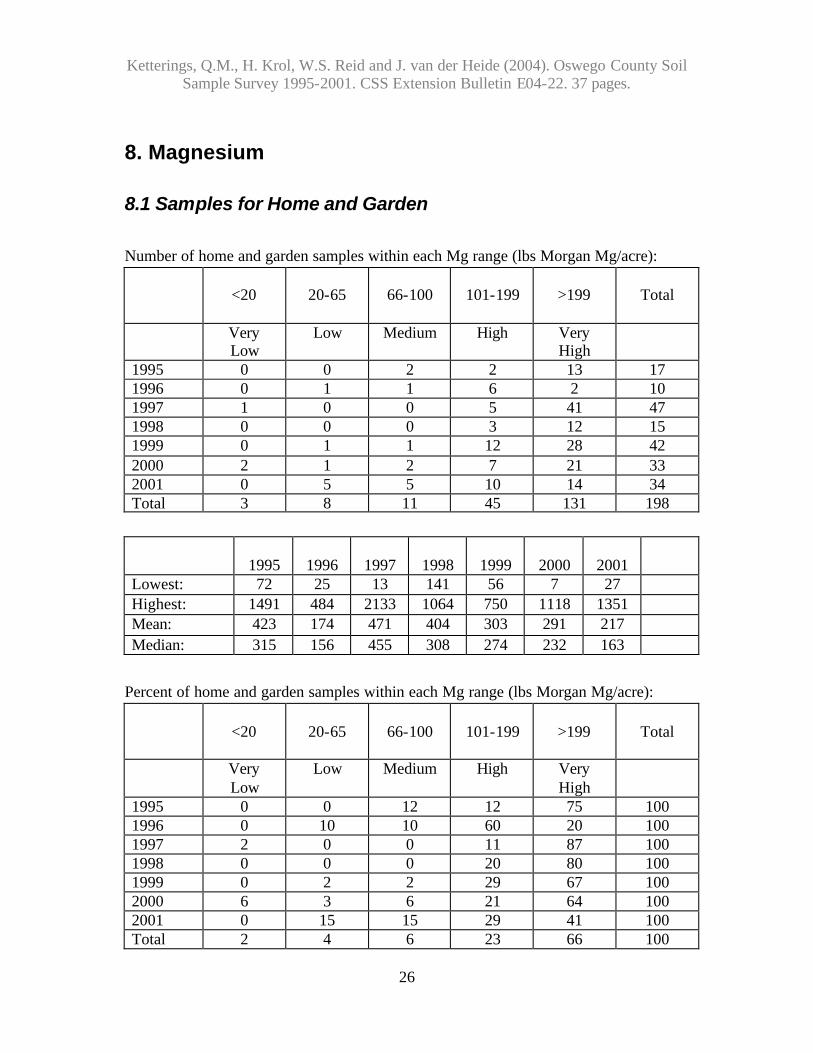
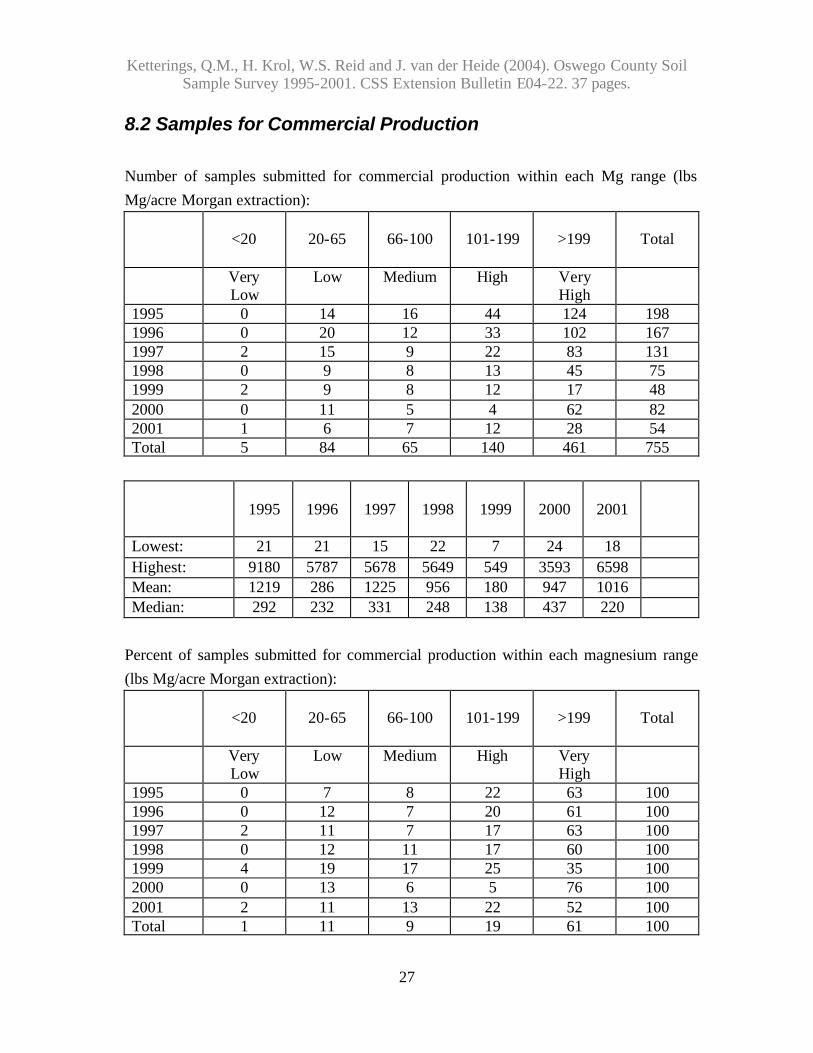
Soils test very low for magnesium if Morgan extractable Mg is less than 20 lbs Mg/acre. Low testing soils have 20-65 lbs Morgan Mg per acre. Soils with 66-100 lbs Mg/acre test medium for magnesium. High testing soils have 101-199 lbs Mg/acre while soils with more than 200 lbs Mg/acre in the Morgan extraction are classified as very high in Mg. Magnesium levels ranged from 7 to more than 9,000 lbs Mg/acre (Morgan extraction). There were only three home and garden samples and five commercial production samples that tested very low in Mg. Most soils tested high or very high for Mg (89% of the homeowner soils and 80% of the soils of the commercial growers). Ten percent of the home and garden samples and 20% of the commercial production samples tested low or medium in Mg. Thus, for 80-90% of the samples, magnesium deficiency is not likely to occur provided the soil pH is maintained in the desirable range. Soils with more than 50 lbs Morgan extractable Fe per acre test excessive for Fe. Anything lower than 50 lbs Fe/acre is considered normal. Iron levels fell for 94-95% in the normal range with 5% of the home and garden samples and 6% of the samples for commercial production testing excessive for Fe. Similarly, most soils (96% for both groups) tested normal for manganese. Soils with more than 100 lbs Morgan extractable Mn per acre are classified as excessive in Mn. Anything less than 100 lbs Mn per acre is classified as normal. Soils with less than 0.5 lb zinc per acre in the Morgan extraction are classified as low in Zn. Medium testing soils have between 0.5 and 1 lb of Morgan extractable Zn per acre. If more than 1 lb of Zn/acre is extracted with the Morgan solution, the soil tests high in Zn. For the home and garden samples, 77% tested high for zinc while 20% tested medium and 3% were low in zinc. Of the samples for commercial production, 3% tested low in zinc, 21% tested medium while 76% were high in zinc. In the following sections, the summary tables for each of the soil fertility indicators described above are given. The appendix contains the crop codes used in section 2.
Reference
• Morgan, M.F. 1941. Chemical soil diagnosis by the universal soil testing system.
Connecticut Agricultural Experimental Station. Bulletin 450.
Ketterings, Q.M., H. Krol, W.S. Reid and J. van der Heide (2004). Oswego County Soil Sample Survey 1995-2001. CSS Extension Bulletin E04-22. 37 pages.
9
2. Cropping Systems
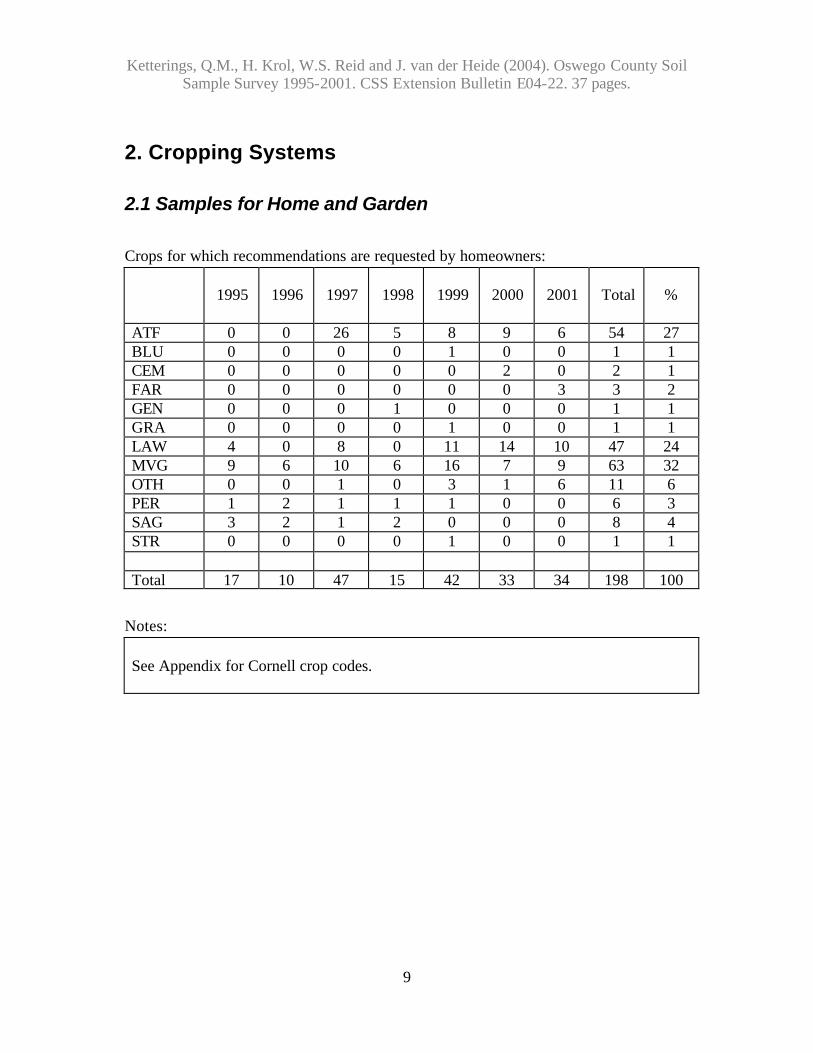
2.1 Samples for Home and Garden Crops for which recommendations are requested by homeowners:
1995
1996
1997
1998
1999
2000
2001
Total
%
ATF 0 0 26 5 8 9 6 54 27 BLU 0 0 0 0 1 0 0 1 1 CEM 0 0 0 0 0 2 0 2 1 FAR 0 0 0 0 0 0 3 3 2 GEN 0 0 0 1 0 0 0 1 1 GRA 0 0 0 0 1 0 0 1 1 LAW 4 0 8 0 11 14 10 47 24 MVG 9 6 10 6 16 7 9 63 32 OTH 0 0 1 0 3 1 6 11 6 PER 1 2 1 1 1 0 0 6 3 SAG 3 2 1 2 0 0 0 8 4 STR 0 0 0 0 1 0 0 1 1 Total 17 10 47 15 42 33 34 198 100
Notes: See Appendix for Cornell crop codes.
Ketterings, Q.M., H. Krol, W.S. Reid and J. van der Heide (2004). Oswego County Soil Sample Survey 1995-2001. CSS Extension Bulletin E04-22. 37 pages.
10
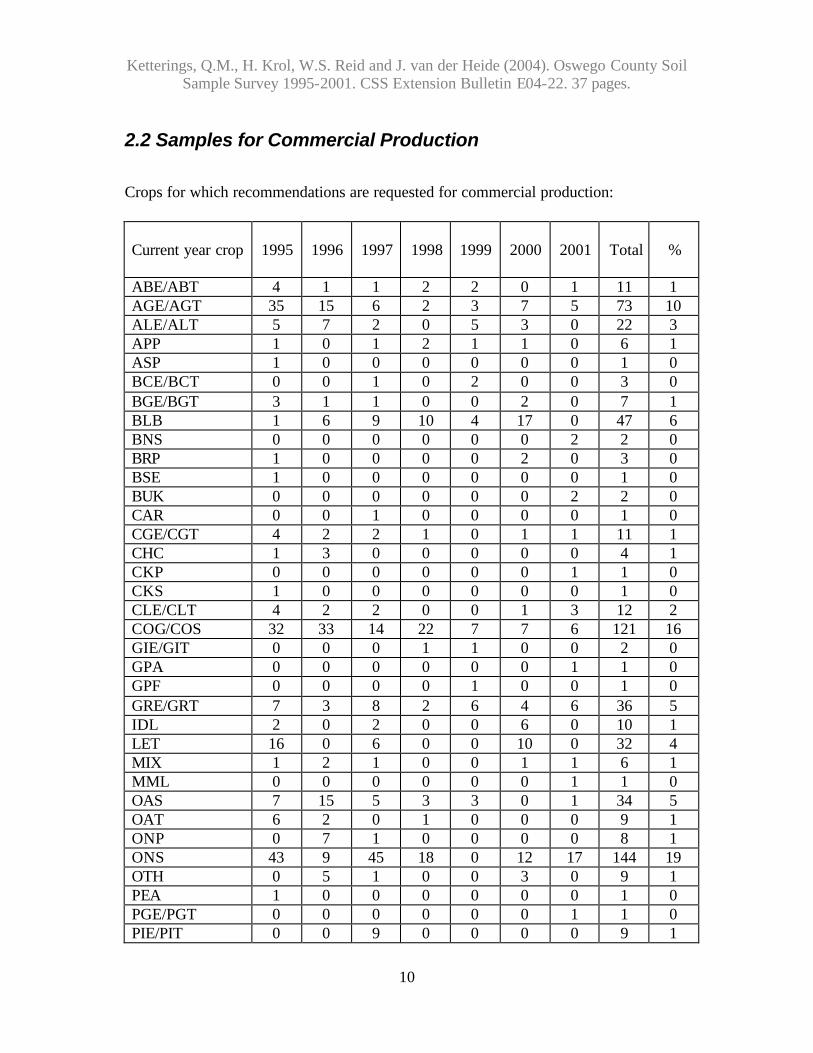
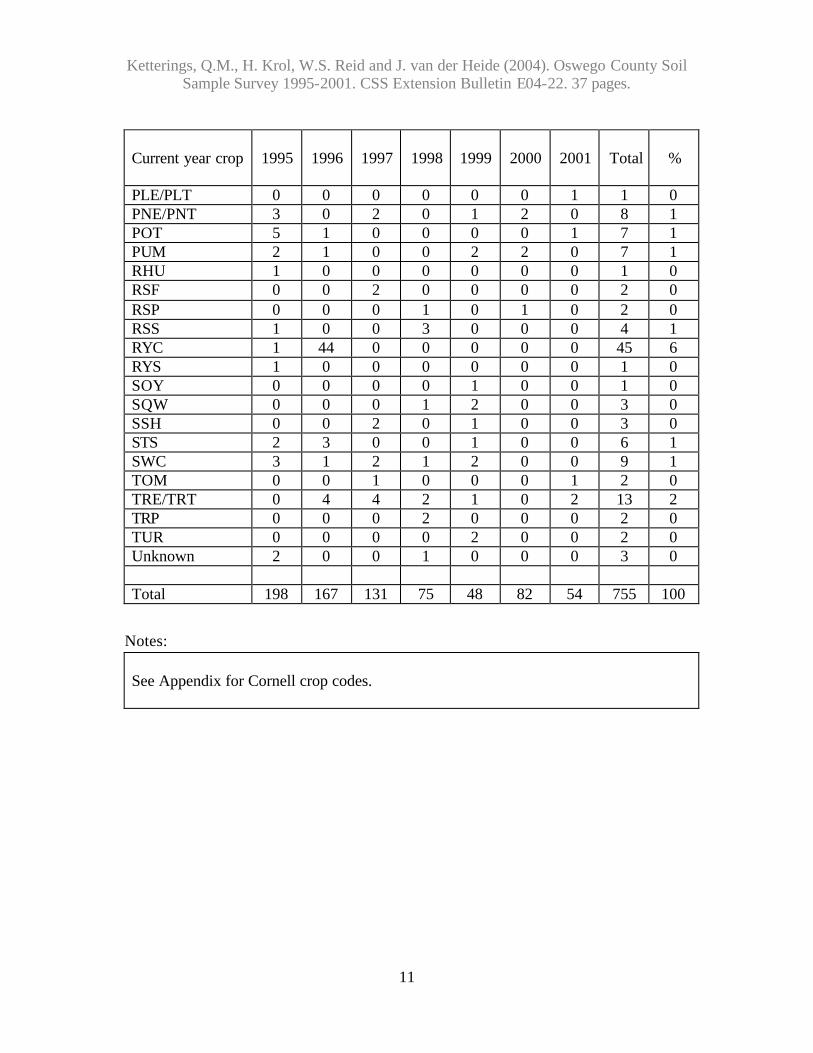
2.2 Samples for Commercial Production Crops for which recommendations are requested for commercial production: Current year crop
1995
1996
1997
1998
1999
2000
2001
Total
%
ABE/ABT 4 1 1 2 2 0 1 11 1 AGE/AGT 35 15 6 2 3 7 5 73 10 ALE/ALT 5 7 2 0 5 3 0 22 3 APP 1 0 1 2 1 1 0 6 1 ASP 1 0 0 0 0 0 0 1 0 BCE/BCT 0 0 1 0 2 0 0 3 0 BGE/BGT 3 1 1 0 0 2 0 7 1 BLB 1 6 9 10 4 17 0 47 6 BNS 0 0 0 0 0 0 2 2 0 BRP 1 0 0 0 0 2 0 3 0 BSE 1 0 0 0 0 0 0 1 0 BUK 0 0 0 0 0 0 2 2 0 CAR 0 0 1 0 0 0 0 1 0 CGE/CGT 4 2 2 1 0 1 1 11 1 CHC 1 3 0 0 0 0 0 4 1 CKP 0 0 0 0 0 0 1 1 0 CKS 1 0 0 0 0 0 0 1 0 CLE/CLT 4 2 2 0 0 1 3 12 2 COG/COS 32 33 14 22 7 7 6 121 16 GIE/GIT 0 0 0 1 1 0 0 2 0 GPA 0 0 0 0 0 0 1 1 0 GPF 0 0 0 0 1 0 0 1 0 GRE/GRT 7 3 8 2 6 4 6 36 5 IDL 2 0 2 0 0 6 0 10 1 LET 16 0 6 0 0 10 0 32 4 MIX 1 2 1 0 0 1 1 6 1 MML 0 0 0 0 0 0 1 1 0 OAS 7 15 5 3 3 0 1 34 5 OAT 6 2 0 1 0 0 0 9 1 ONP 0 7 1 0 0 0 0 8 1 ONS 43 9 45 18 0 12 17 144 19 OTH 0 5 1 0 0 3 0 9 1 PEA 1 0 0 0 0 0 0 1 0 PGE/PGT 0 0 0 0 0 0 1 1 0 PIE/PIT 0 0 9 0 0 0 0 9 1
Ketterings, Q.M., H. Krol, W.S. Reid and J. van der Heide (2004). Oswego County Soil Sample Survey 1995-2001. CSS Extension Bulletin E04-22. 37 pages.
11
Current year crop
1995
1996
1997
1998
1999
2000
2001
Total
%
PLE/PLT 0 0 0 0 0 0 1 1 0 PNE/PNT 3 0 2 0 1 2 0 8 1 POT 5 1 0 0 0 0 1 7 1 PUM 2 1 0 0 2 2 0 7 1 RHU 1 0 0 0 0 0 0 1 0 RSF 0 0 2 0 0 0 0 2 0 RSP 0 0 0 1 0 1 0 2 0 RSS 1 0 0 3 0 0 0 4 1 RYC 1 44 0 0 0 0 0 45 6 RYS 1 0 0 0 0 0 0 1 0 SOY 0 0 0 0 1 0 0 1 0 SQW 0 0 0 1 2 0 0 3 0 SSH 0 0 2 0 1 0 0 3 0 STS 2 3 0 0 1 0 0 6 1 SWC 3 1 2 1 2 0 0 9 1 TOM 0 0 1 0 0 0 1 2 0 TRE/TRT 0 4 4 2 1 0 2 13 2 TRP 0 0 0 2 0 0 0 2 0 TUR 0 0 0 0 2 0 0 2 0 Unknown 2 0 0 1 0 0 0 3 0 Total 198 167 131 75 48 82 54 755 100
Notes: See Appendix for Cornell crop codes.
Ketterings, Q.M., H. Krol, W.S. Reid and J. van der Heide (2004). Oswego County Soil Sample Survey 1995-2001. CSS Extension Bulletin E04-22. 37 pages.
12
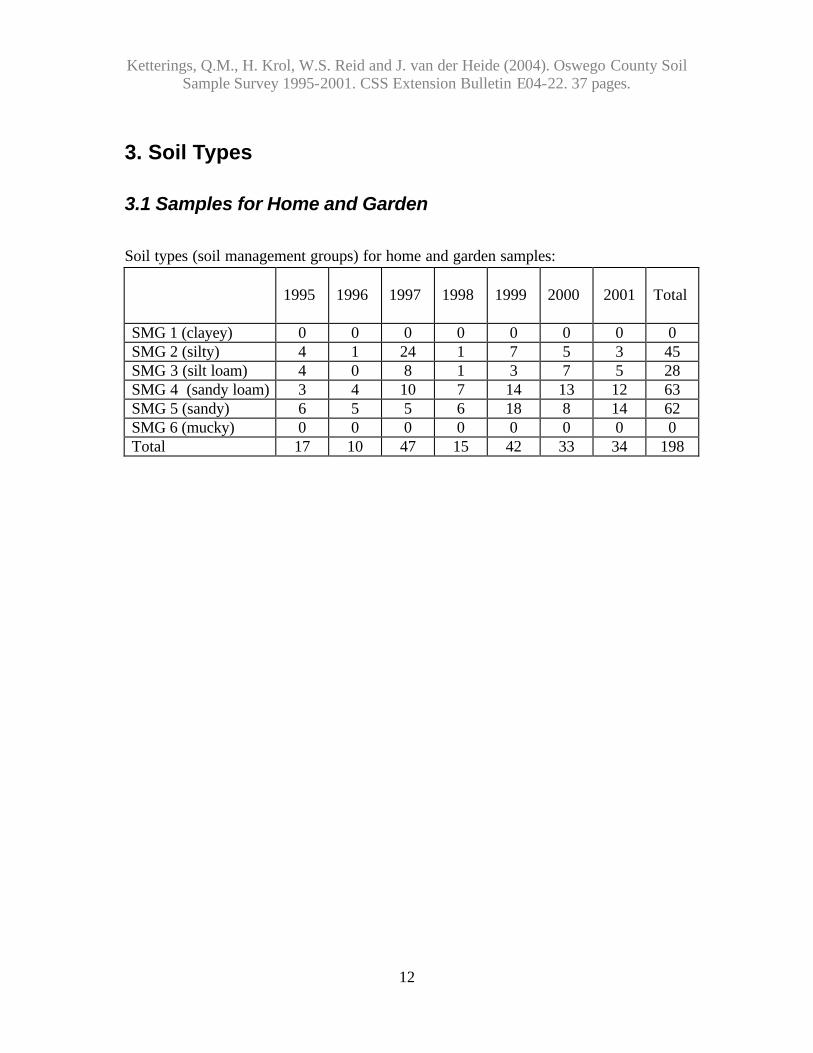
3. Soil Types
3.1 Samples for Home and Garden Soil types (soil management groups) for home and garden samples:
1995 1996
1997
1998
1999
2000
2001
Total
SMG 1 (clayey) 0 0 0 0 0 0 0 0 SMG 2 (silty) 4 1 24 1 7 5 3 45 SMG 3 (silt loam) 4 0 8 1 3 7 5 28 SMG 4 (sandy loam) 3 4 10 7 14 13 12 63 SMG 5 (sandy) 6 5 5 6 18 8 14 62 SMG 6 (mucky) 0 0 0 0 0 0 0 0 Total 17 10 47 15 42 33 34 198
Ketterings, Q.M., H. Krol, W.S. Reid and J. van der Heide (2004). Oswego County Soil Sample Survey 1995-2001. CSS Extension Bulletin E04-22. 37 pages.
13
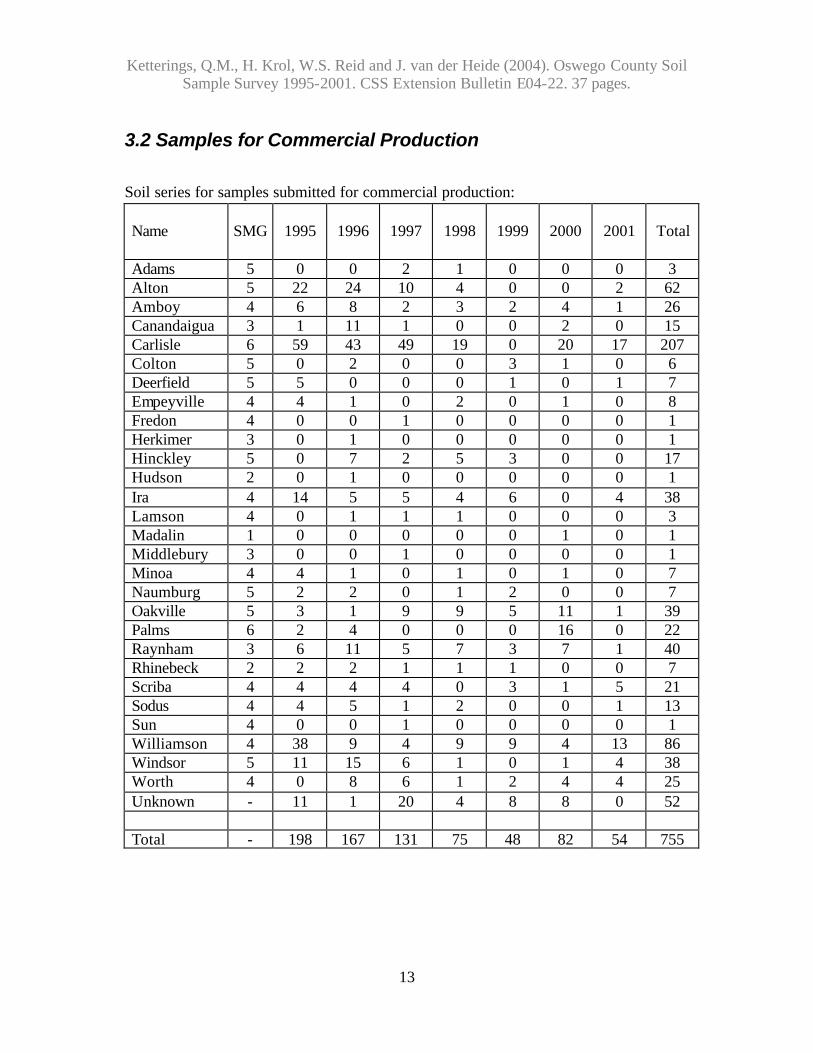
3.2 Samples for Commercial Production
Soil series for samples submitted for commercial production: Name
SMG
1995
1996
1997
1998
1999
2000
2001
Total
Adams 5 0 0 2 1 0 0 0 3 Alton 5 22 24 10 4 0 0 2 62 Amboy 4 6 8 2 3 2 4 1 26 Canandaigua 3 1 11 1 0 0 2 0 15 Carlisle 6 59 43 49 19 0 20 17 207 Colton 5 0 2 0 0 3 1 0 6 Deerfield 5 5 0 0 0 1 0 1 7 Empeyville 4 4 1 0 2 0 1 0 8 Fredon 4 0 0 1 0 0 0 0 1 Herkimer 3 0 1 0 0 0 0 0 1 Hinckley 5 0 7 2 5 3 0 0 17 Hudson 2 0 1 0 0 0 0 0 1 Ira 4 14 5 5 4 6 0 4 38 Lamson 4 0 1 1 1 0 0 0 3 Madalin 1 0 0 0 0 0 1 0 1 Middlebury 3 0 0 1 0 0 0 0 1 Minoa 4 4 1 0 1 0 1 0 7 Naumburg 5 2 2 0 1 2 0 0 7 Oakville 5 3 1 9 9 5 11 1 39 Palms 6 2 4 0 0 0 16 0 22 Raynham 3 6 11 5 7 3 7 1 40 Rhinebeck 2 2 2 1 1 1 0 0 7 Scriba 4 4 4 4 0 3 1 5 21 Sodus 4 4 5 1 2 0 0 1 13 Sun 4 0 0 1 0 0 0 0 1 Williamson 4 38 9 4 9 9 4 13 86 Windsor 5 11 15 6 1 0 1 4 38 Worth 4 0 8 6 1 2 4 4 25 Unknown - 11 1 20 4 8 8 0 52 Total - 198 167 131 75 48 82 54 755
Ketterings, Q.M., H. Krol, W.S. Reid and J. van der Heide (2004). Oswego County Soil Sample Survey 1995-2001. CSS Extension Bulletin E04-22. 37 pages.
14
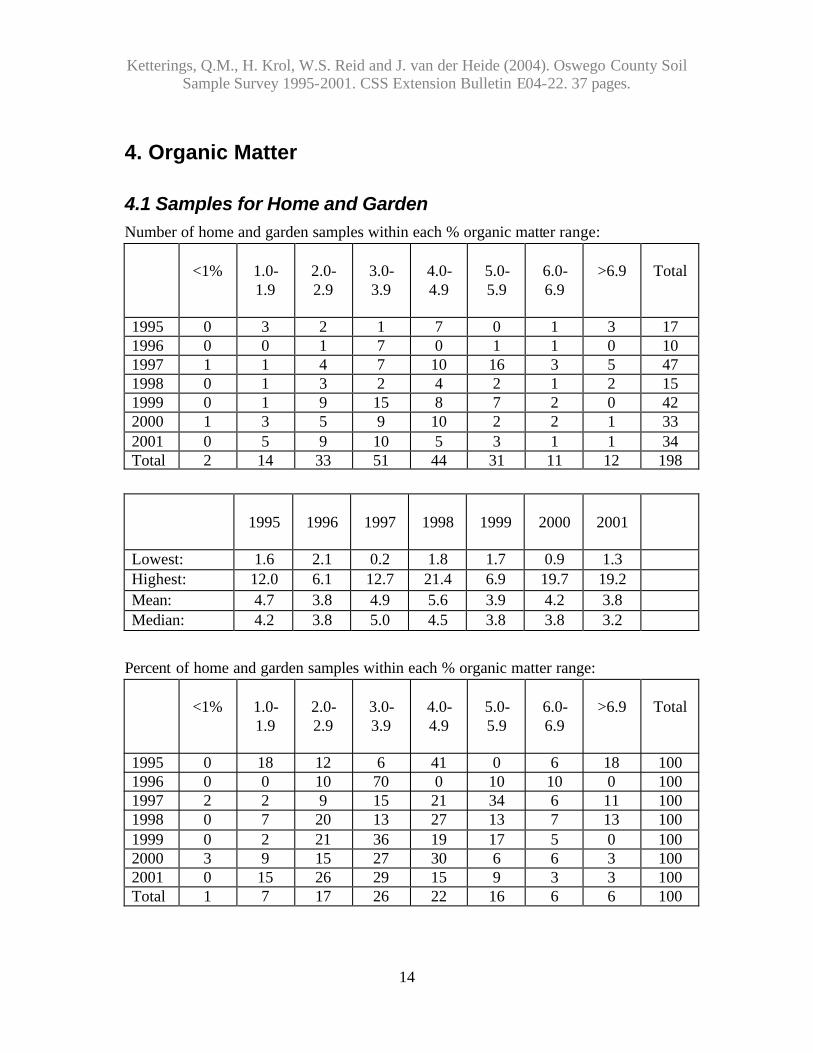
4. Organic Matter
4.1 Samples for Home and Garden Number of home and garden samples within each % organic matter range:
<1%
1.0-1.9
2.0-2.9
3.0-3.9
4.0-4.9
5.0-5.9
6.0-6.9
>6.9
Total
1995 0 3 2 1 7 0 1 3 17 1996 0 0 1 7 0 1 1 0 10 1997 1 1 4 7 10 16 3 5 47 1998 0 1 3 2 4 2 1 2 15 1999 0 1 9 15 8 7 2 0 42 2000 1 3 5 9 10 2 2 1 33 2001 0 5 9 10 5 3 1 1 34 Total 2 14 33 51 44 31 11 12 198
1995
1996
1997
1998
1999
2000
2001
Lowest: 1.6 2.1 0.2 1.8 1.7 0.9 1.3 Highest: 12.0 6.1 12.7 21.4 6.9 19.7 19.2 Mean: 4.7 3.8 4.9 5.6 3.9 4.2 3.8 Median: 4.2 3.8 5.0 4.5 3.8 3.8 3.2
Percent of home and garden samples within each % organic matter range:
<1%
1.0-1.9
2.0-2.9
3.0-3.9
4.0-4.9
5.0-5.9
6.0-6.9
>6.9
Total
1995 0 18 12 6 41 0 6 18 100 1996 0 0 10 70 0 10 10 0 100 1997 2 2 9 15 21 34 6 11 100 1998 0 7 20 13 27 13 7 13 100 1999 0 2 21 36 19 17 5 0 100 2000 3 9 15 27 30 6 6 3 100 2001 0 15 26 29 15 9 3 3 100 Total 1 7 17 26 22 16 6 6 100
Ketterings, Q.M., H. Krol, W.S. Reid and J. van der Heide (2004). Oswego County Soil Sample Survey 1995-2001. CSS Extension Bulletin E04-22. 37 pages.
15
4.2 Samples for Commercial Production Number of samples for commercial production within each % organic matter range:
<1%
1.0-1.9
2.0-2.9
3.0-3.9
4.0-4.9
5.0-5.9
6.0-6.9
>6.9
Total
1995 1 18 44 38 24 9 3 61 198 1996 3 15 31 38 31 13 3 33 167 1997 0 17 11 16 14 12 7 54 131 1998 0 8 12 13 11 7 3 21 75 1999 0 7 12 13 13 0 0 3 48 2000 1 9 9 19 7 3 0 34 82 2001 0 6 4 14 10 2 0 18 54 Total 5 80 123 151 110 46 16 224 755
1995
1996
1997
1998
1999
2000
2001
Lowest: 0.9 0.4 1.1 1.4 1.1 0.9 1.4 Highest: 60.9 58.5 75.6 58.6 18.3 56.0 57.9 Mean: 18.5 3.6 22.5 15.2 3.8 16.6 19.1 Median: 3.8 3.4 5.7 4.3 3.7 4.2 4.1
Percent of samples for commercial production within each % organic matter range:
<1%
1.0-1.9
2.0-2.9
3.0-3.9
4.0-4.9
5.0-5.9
6.0-6.9
>6.9
Total
1995 1 9 22 19 12 5 2 31 100 1996 2 9 19 23 19 8 2 20 100 1997 0 13 8 12 11 9 5 41 100 1998 0 11 16 17 15 9 4 28 100 1999 0 15 25 27 27 0 0 6 100 2000 1 11 11 23 9 4 0 41 100 2001 0 11 7 26 19 4 0 33 100 Total 1 11 16 20 15 6 2 30 100
Ketterings, Q.M., H. Krol, W.S. Reid and J. van der Heide (2004). Oswego County Soil Sample Survey 1995-2001. CSS Extension Bulletin E04-22. 37 pages.
16
5. pH
5.1 Samples for Home and Garden Number of home and garden samples within each pH range:
1995
1996
1997
1998
1999
2000
2001
Lowest: 5.9 4.8 4.9 5.6 5.6 4.9 4.9 Highest: 7.9 8.0 8.1 7.3 7.9 8.0 7.8 Mean: - - - - - - - Median: 6.9 6.1 6.9 6.9 6.9 6.6 6.4
Percent of home and garden samples within each pH range:
<4.5
4.5-4.9
5.0-5.4
5.5-5.9
6.0-6.4
6.5-6.9
7.0-7.4
7.5-7.9
8.0-8.4
>8.4
Total
1995 0 0 0 6 12 35 24 24 0 0 100 1996 0 10 20 10 20 10 20 0 10 0 100 1997 0 2 2 6 11 32 40 4 2 0 100 1998 0 0 0 13 13 33 40 0 0 0 100 1999 0 0 0 12 17 26 31 14 0 0 100 2000 0 3 9 12 18 30 15 9 3 0 100 2001 0 3 12 18 26 12 24 6 0 0 100 Total 0 2 5 11 17 26 29 9 2 0 100
<4.5
4.5-4.9
5.0-5.4
5.5-5.9
6.0-6.4
6.5-6.9
7.0-7.4
7.5-7.9
8.0-8.4
>8.4
Total
1995 0 0 0 1 2 6 4 4 0 0 17 1996 0 1 2 1 2 1 2 0 1 0 10 1997 0 1 1 3 5 15 19 2 1 0 47 1998 0 0 0 2 2 5 6 0 0 0 15 1999 0 0 0 5 7 11 13 6 0 0 42 2000 0 1 3 4 6 10 5 3 1 0 33 2001 0 1 4 6 9 4 8 2 0 0 34 Total 0 4 10 22 33 52 57 17 3 0 198
Ketterings, Q.M., H. Krol, W.S. Reid and J. van der Heide (2004). Oswego County Soil Sample Survey 1995-2001. CSS Extension Bulletin E04-22. 37 pages.
17
5.2 Samples for Commercial Production Number of samples for commercial production within each pH range:
<4.5
4.5-4.9
5.0-5.4
5.5-5.9
6.0-6.4
6.5-6.9
7.0-7.4
7.5-7.9
8.0-8.4
>8.4
Total
1995 0 2 23 60 55 44 12 2 0 0 198 1996 6 1 18 26 57 33 22 4 0 0 167 1997* 7 10 32 53 14 10 4 0 0 0 130 1998 0 3 19 29 8 13 3 0 0 0 75 1999 2 3 8 12 16 4 3 0 0 0 48 2000 1 5 10 18 14 18 7 9 0 0 82 2001 0 0 19 13 9 7 6 0 0 0 54 Total 16 24 129 211 173 129 57 15 0 0 754
*One sample was not analyzed for pH in 1997.
1995
1996
1997
1998
1999
2000
2001
Lowest: 4.9 4.0 4.0 4.8 3.9 4.3 5.0 Highest: 7.9 7.8 7.2 7.1 7.2 7.9 7.4 Mean: - - - - - - - Median: 6.0 6.4 5.6 5.7 5.9 6.2 5.8
Percent of samples for commercial production within each pH range:
<4.5
4.5-4.9
5.0-5.4
5.5-5.9
6.0-6.4
6.5-6.9
7.0-7.4
7.5-7.9
8.0-8.4
>8.4
Total
1995 0 1 12 30 28 22 6 1 0 0 100 1996 4 1 11 16 34 20 13 2 0 0 100 1997 5 8 25 41 11 8 3 0 0 0 100 1998 0 4 25 39 11 17 4 0 0 0 100 1999 4 6 17 25 33 8 6 0 0 0 100 2000 1 6 12 22 17 22 9 11 0 0 100 2001 0 0 35 24 17 13 11 0 0 0 100 Total 2 3 17 28 23 17 8 2 0 0 100
Ketterings, Q.M., H. Krol, W.S. Reid and J. van der Heide (2004). Oswego County Soil Sample Survey 1995-2001. CSS Extension Bulletin E04-22. 37 pages.
18
6. Phosphorus
6.1 Samples for Home and Garden Number of home and garden samples within each range Morgan extractable P range (lbs/acre Morgan P):
<1
1-3
4-8
9-39
40-60
61-80
81-100
101-150
151-200
>200
Total
VL L M H VH VH VH VH VH VH 1995 0 1 3 5 3 1 0 1 1 2 17 1996 0 3 3 1 0 0 1 1 0 1 10 1997 0 4 6 20 7 5 3 2 0 0 47 1998 0 1 4 4 0 4 0 2 0 0 15 1999 0 4 14 15 3 2 1 2 0 1 42 2000 0 14 7 10 1 0 0 1 0 0 33 2001 0 11 10 12 0 0 0 0 0 1 34 Total 0 38 47 67 14 12 5 9 1 5 198
VL = very low, L = low, M = medium, H = high, VH = very high.
1995 1996 1997 1998 1999 2000 2001 Lowest: 2 2 1 2 1 1 1 Highest: 648 246 127 142 212 140 751 Mean: 102 48 39 42 28 13 31 Median: 27 7 34 25 11 6 7
Percent of home and garden samples within each Morgan extractable phosphorus range:
<1
1-3
4-8
9-39
40-60
61-80
81-100
101-150
151-200
>200
Total
VL L M H VH VH VH VH VH VH 1995 0 6 18 29 18 6 0 6 6 12 100 1996 0 30 30 10 0 0 10 10 0 10 100 1997 0 9 13 43 15 11 6 4 0 0 100 1998 0 7 27 27 0 27 0 13 0 0 100 1999 0 10 33 36 7 5 2 5 0 2 100 2000 0 42 21 30 3 0 0 3 0 0 100 2001 0 32 29 35 0 0 0 0 0 3 100 Total 0 19 24 34 7 6 3 5 1 3 100
VL = very low, L = low, M = medium, H = high, VH = very high.
Ketterings, Q.M., H. Krol, W.S. Reid and J. van der Heide (2004). Oswego County Soil Sample Survey 1995-2001. CSS Extension Bulletin E04-22. 37 pages.
19
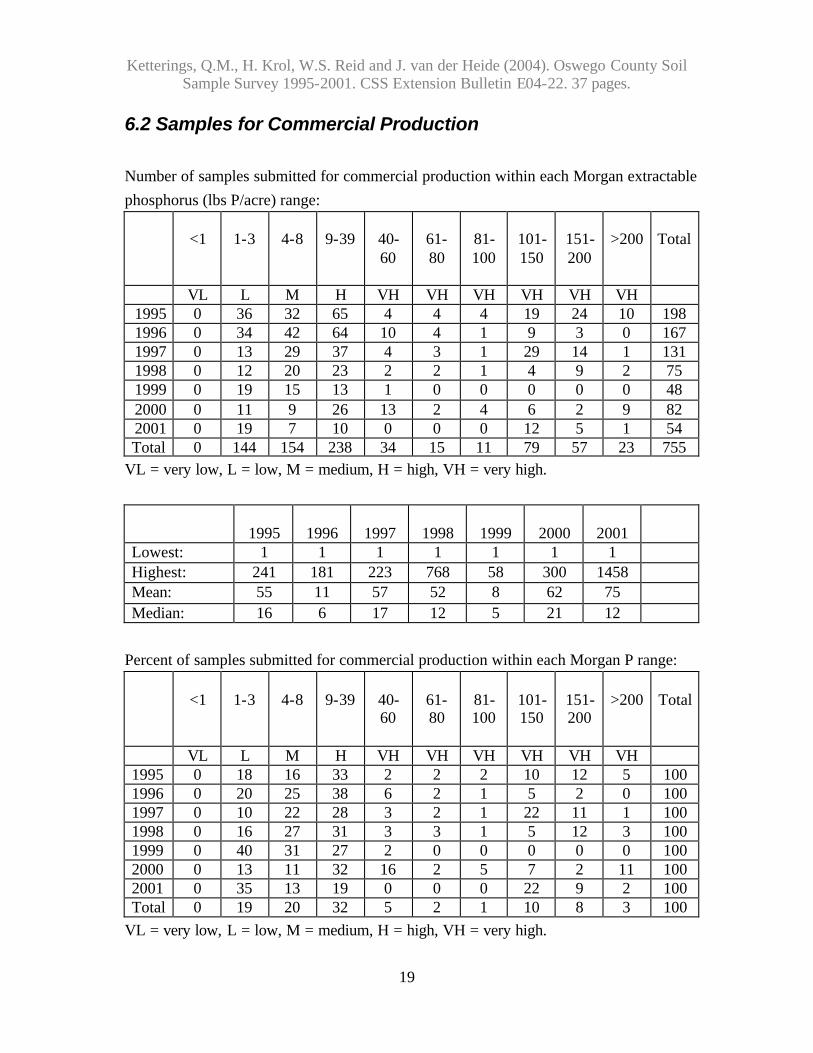
6.2 Samples for Commercial Production Number of samples submitted for commercial production within each Morgan extractable phosphorus (lbs P/acre) range:
<1
1-3
4-8
9-39
40-60
61-80
81-100
101-150
151-200
>200
Total
VL L M H VH VH VH VH VH VH 1995 0 36 32 65 4 4 4 19 24 10 198 1996 0 34 42 64 10 4 1 9 3 0 167 1997 0 13 29 37 4 3 1 29 14 1 131 1998 0 12 20 23 2 2 1 4 9 2 75 1999 0 19 15 13 1 0 0 0 0 0 48 2000 0 11 9 26 13 2 4 6 2 9 82 2001 0 19 7 10 0 0 0 12 5 1 54 Total 0 144 154 238 34 15 11 79 57 23 755
VL = very low, L = low, M = medium, H = high, VH = very high.
1995
1996
1997
1998
1999
2000
2001
Lowest: 1 1 1 1 1 1 1 Highest: 241 181 223 768 58 300 1458 Mean: 55 11 57 52 8 62 75 Median: 16 6 17 12 5 21 12
Percent of samples submitted for commercial production within each Morgan P range:
<1
1-3
4-8
9-39
40-60
61-80
81-100
101-150
151-200
>200
Total
VL L M H VH VH VH VH VH VH 1995 0 18 16 33 2 2 2 10 12 5 100 1996 0 20 25 38 6 2 1 5 2 0 100 1997 0 10 22 28 3 2 1 22 11 1 100 1998 0 16 27 31 3 3 1 5 12 3 100 1999 0 40 31 27 2 0 0 0 0 0 100 2000 0 13 11 32 16 2 5 7 2 11 100 2001 0 35 13 19 0 0 0 22 9 2 100 Total 0 19 20 32 5 2 1 10 8 3 100
VL = very low, L = low, M = medium, H = high, VH = very high.
Ketterings, Q.M., H. Krol, W.S. Reid and J. van der Heide (2004). Oswego County Soil Sample Survey 1995-2001. CSS Extension Bulletin E04-22. 37 pages.
20
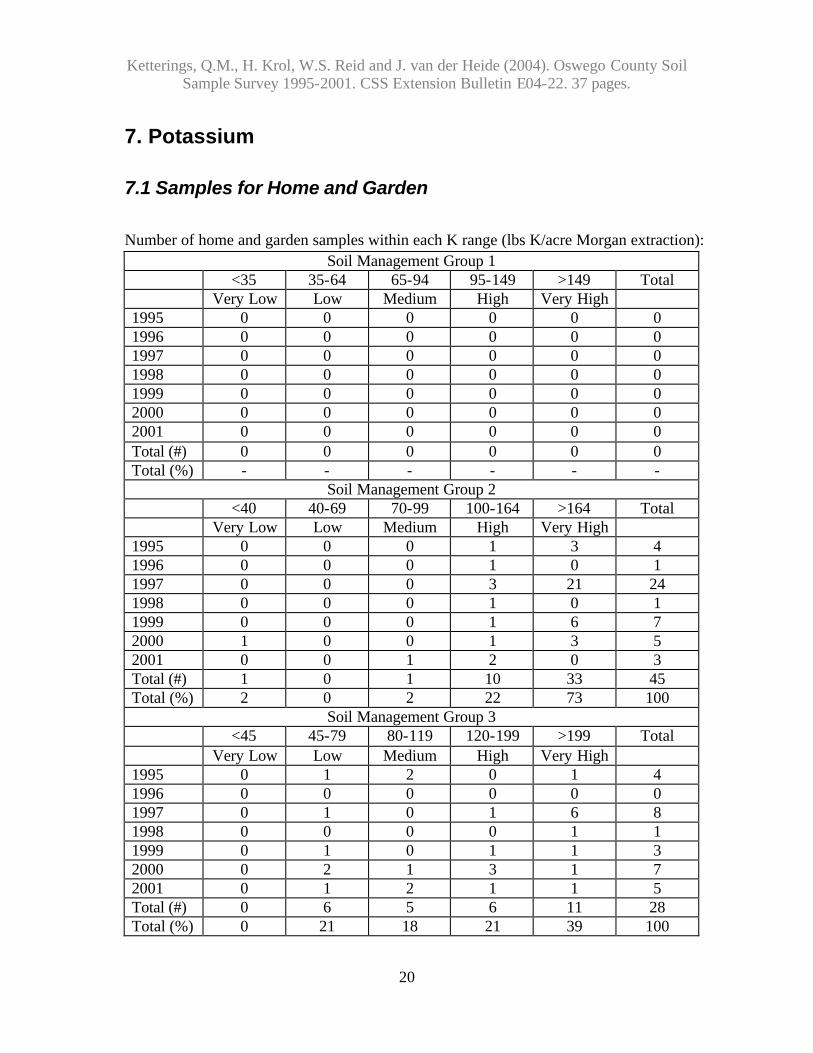
7. Potassium
7.1 Samples for Home and Garden Number of home and garden samples within each K range (lbs K/acre Morgan extraction):
Soil Management Group 1 <35 35-64 65-94 95-149 >149 Total Very Low Low Medium High Very High 1995 0 0 0 0 0 0 1996 0 0 0 0 0 0 1997 0 0 0 0 0 0 1998 0 0 0 0 0 0 1999 0 0 0 0 0 0 2000 0 0 0 0 0 0 2001 0 0 0 0 0 0 Total (#) 0 0 0 0 0 0 Total (%) - - - - - -
Soil Management Group 2 <40 40-69 70-99 100-164 >164 Total Very Low Low Medium High Very High 1995 0 0 0 1 3 4 1996 0 0 0 1 0 1 1997 0 0 0 3 21 24 1998 0 0 0 1 0 1 1999 0 0 0 1 6 7 2000 1 0 0 1 3 5 2001 0 0 1 2 0 3 Total (#) 1 0 1 10 33 45 Total (%) 2 0 2 22 73 100
Soil Management Group 3 <45 45-79 80-119 120-199 >199 Total Very Low Low Medium High Very High 1995 0 1 2 0 1 4 1996 0 0 0 0 0 0 1997 0 1 0 1 6 8 1998 0 0 0 0 1 1 1999 0 1 0 1 1 3 2000 0 2 1 3 1 7 2001 0 1 2 1 1 5 Total (#) 0 6 5 6 11 28 Total (%) 0 21 18 21 39 100
Ketterings, Q.M., H. Krol, W.S. Reid and J. van der Heide (2004). Oswego County Soil Sample Survey 1995-2001. CSS Extension Bulletin E04-22. 37 pages.
21
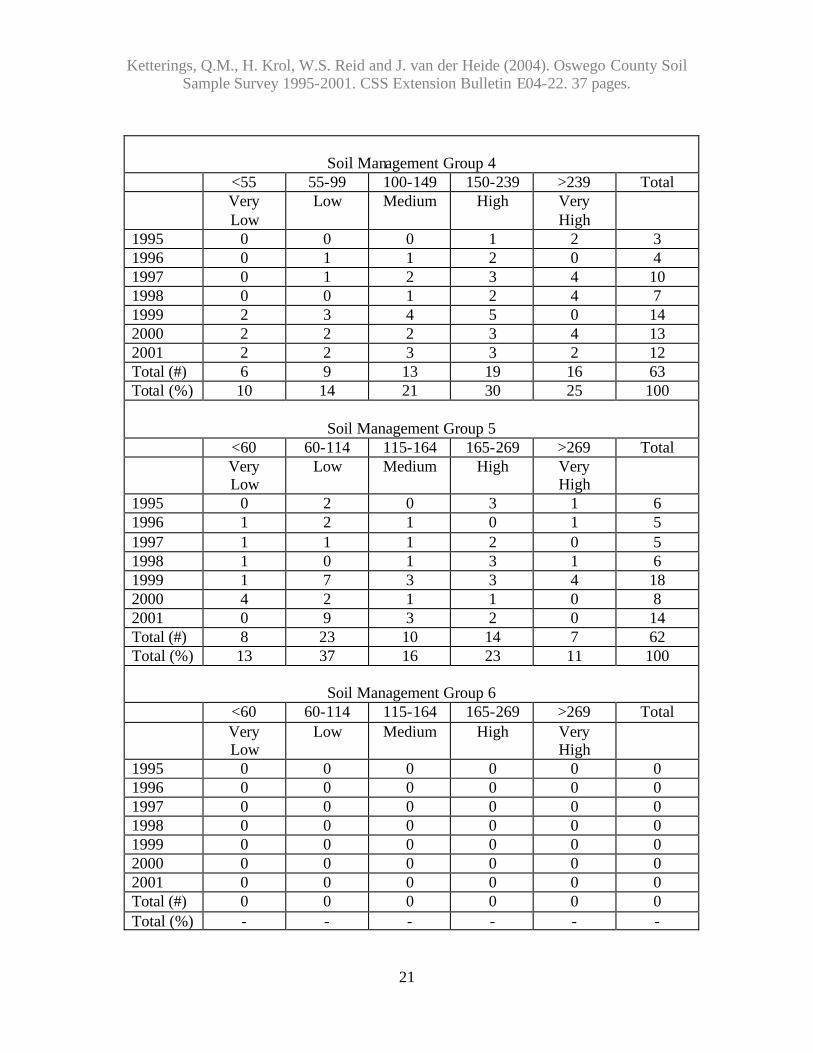
Soil Management Group 4 <55 55-99 100-149 150-239 >239 Total Very
Low Low Medium High Very
High
1995 0 0 0 1 2 3 1996 0 1 1 2 0 4 1997 0 1 2 3 4 10 1998 0 0 1 2 4 7 1999 2 3 4 5 0 14 2000 2 2 2 3 4 13 2001 2 2 3 3 2 12 Total (#) 6 9 13 19 16 63 Total (%) 10 14 21 30 25 100
Soil Management Group 5
<60 60-114 115-164 165-269 >269 Total Very
Low Low Medium High Very
High
1995 0 2 0 3 1 6 1996 1 2 1 0 1 5 1997 1 1 1 2 0 5 1998 1 0 1 3 1 6 1999 1 7 3 3 4 18 2000 4 2 1 1 0 8 2001 0 9 3 2 0 14 Total (#) 8 23 10 14 7 62 Total (%) 13 37 16 23 11 100
Soil Management Group 6
<60 60-114 115-164 165-269 >269 Total Very
Low Low Medium High Very
High
1995 0 0 0 0 0 0 1996 0 0 0 0 0 0 1997 0 0 0 0 0 0 1998 0 0 0 0 0 0 1999 0 0 0 0 0 0 2000 0 0 0 0 0 0 2001 0 0 0 0 0 0 Total (#) 0 0 0 0 0 0 Total (%) - - - - - -
Ketterings, Q.M., H. Krol, W.S. Reid and J. van der Heide (2004). Oswego County Soil Sample Survey 1995-2001. CSS Extension Bulletin E04-22. 37 pages.
22
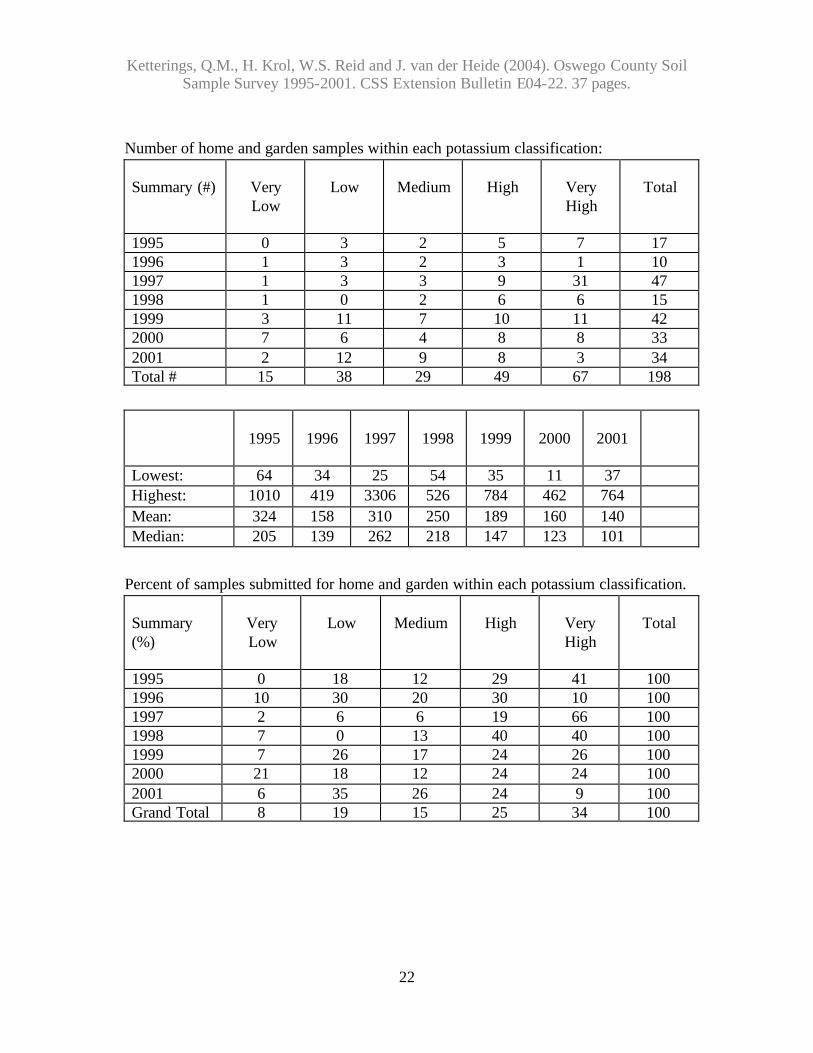
Number of home and garden samples within each potassium classification: Summary (#)
Very Low
Low
Medium
High
Very High
Total
1995 0 3 2 5 7 17 1996 1 3 2 3 1 10 1997 1 3 3 9 31 47 1998 1 0 2 6 6 15 1999 3 11 7 10 11 42 2000 7 6 4 8 8 33 2001 2 12 9 8 3 34 Total # 15 38 29 49 67 198
1995
1996
1997
1998
1999
2000
2001
Lowest: 64 34 25 54 35 11 37 Highest: 1010 419 3306 526 784 462 764 Mean: 324 158 310 250 189 160 140 Median: 205 139 262 218 147 123 101
Percent of samples submitted for home and garden within each potassium classification. Summary (%)
Very Low
Low
Medium
High
Very High
Total
1995 0 18 12 29 41 100 1996 10 30 20 30 10 100 1997 2 6 6 19 66 100 1998 7 0 13 40 40 100 1999 7 26 17 24 26 100 2000 21 18 12 24 24 100 2001 6 35 26 24 9 100 Grand Total 8 19 15 25 34 100
Ketterings, Q.M., H. Krol, W.S. Reid and J. van der Heide (2004). Oswego County Soil Sample Survey 1995-2001. CSS Extension Bulletin E04-22. 37 pages.
23
7.2 Samples for Commercial Production Number of samples submitted for commercial production within each potassium (lbs K/acre Morgan extraction) range:
Soil Management Group 1 <35 35-64 65-94 95-149 >149 Total Very Low Low Medium High Very High 1995 0 0 0 0 0 0 1996 0 0 0 0 0 0 1997 0 0 0 0 0 0 1998 0 0 0 0 0 0 1999 0 0 0 0 0 0 2000 0 0 1 0 0 1 2001 0 0 0 0 0 0 Total (#) 0 0 1 0 0 0 Total (%) 0 0 100 0 0 100
Soil Management Group 2 <40 40-69 70-99 100-164 >164 Total Very Low Low Medium High Very High 1995 0 0 0 1 1 2 1996 0 0 1 0 2 3 1997 0 0 0 1 0 1 1998 0 0 0 1 0 1 1999 0 0 0 0 1 1 2000 0 0 0 0 0 0 2001 0 0 0 0 0 0 Total (#) 0 0 1 3 4 8 Total (%) 0 0 13 38 50 100
Soil Management Group 3 <45 45-79 80-119 120-199 >199 Total Very Low Low Medium High Very High 1995 1 2 0 0 4 7 1996 0 14 2 2 5 23 1997 0 1 2 3 1 7 1998 0 0 1 5 1 7 1999 0 0 2 0 1 3 2000 0 3 2 2 2 9 2001 0 1 0 0 0 1 Total (#) 1 21 9 12 14 57 Total (%) 2 37 16 21 25 100
Ketterings, Q.M., H. Krol, W.S. Reid and J. van der Heide (2004). Oswego County Soil Sample Survey 1995-2001. CSS Extension Bulletin E04-22. 37 pages.
24
Soil Management Group 4
<55 55-99 100-149 150-239 >239 Total Very
Low Low Medium High Very
High
1995 5 16 22 15 16 74 1996 2 13 13 11 3 42 1997 1 11 9 3 1 25 1998 0 4 5 9 5 23 1999 1 4 9 4 4 22 2000 0 7 1 5 2 15 2001 9 10 5 1 3 28 Total (#) 18 65 64 48 34 229 Total (%) 8 28 28 21 15 100
Soil Management Group 5
<60 60-114 115-164 165-269 >269 Total Very
Low Low Medium High Very
High
1995 4 12 9 11 7 43 1996 3 11 11 14 12 51 1997 0 13 7 5 4 29 1998 1 5 5 9 1 21 1999 5 5 2 1 1 14 2000 1 5 4 3 0 13 2001 2 1 3 0 2 8 Total (#) 16 52 41 43 27 179 Total (%) 9 29 23 24 15 100
Soil Management Group 6
<60 60-114 115-164 165-269 >269 Total Very
Low Low Medium High Very
High
1995 0 0 0 1 60 61 1996 15 3 2 5 22 47 1997 0 0 0 2 47 49 1998 0 0 0 3 16 19 1999 0 0 0 0 0 0 2000 0 1 2 5 28 36 2001 0 0 0 0 17 17 Total (#) 15 4 4 16 190 229 Total (%) 7 2 2 7 83 100

Ketterings, Q.M., H. Krol, W.S. Reid and J. van der Heide (2004). Oswego County Soil Sample Survey 1995-2001. CSS Extension Bulletin E04-22. 37 pages.
25
Number of samples submitted for commercial production within each potassium classification. Summary (#)
Very Low
Low
Medium
High
Very High
Un-
known
Total
1995 10 30 31 28 88 11 198 1996 20 41 29 32 44 1 167 1997 1 25 18 14 53 20 131 1998 1 9 11 27 23 4 75 1999 6 9 13 5 7 8 48 2000 1 16 10 15 32 8 82 2001 11 12 8 1 22 0 54 Grand Total 50 142 120 122 269 52 755
1995
1996
1997
1998
1999
2000
2001
Lowest: 32 28 43 35 17 7 34 Highest: 1487 1351 1570 3902 502 1350 21070 Mean: 383 164 310 355 149 312 718 Median: 223 120 188 187 134 187 127
Percent of samples submitted for commercial production within each potassium classification.
% summary
Very Low
Low
Medium
High
Very High
Un-
known
Total
1995 5 15 16 14 44 6 100 1996 12 25 17 19 26 1 100 1997 1 19 14 11 40 15 100 1998 1 12 15 36 31 5 100 1999 13 19 27 10 15 17 100 2000 1 22 12 18 39 10 100 2001 20 22 15 2 41 0 100 Grand Total 7 19 16 16 36 7 100
Ketterings, Q.M., H. Krol, W.S. Reid and J. van der Heide (2004). Oswego County Soil Sample Survey 1995-2001. CSS Extension Bulletin E04-22. 37 pages.
26
8. Magnesium
8.1 Samples for Home and Garden
Number of home and garden samples within each Mg range (lbs Morgan Mg/acre):
<20
20-65
66-100
101-199
>199
Total
Very Low
Low Medium High Very High
1995 0 0 2 2 13 17 1996 0 1 1 6 2 10 1997 1 0 0 5 41 47 1998 0 0 0 3 12 15 1999 0 1 1 12 28 42 2000 2 1 2 7 21 33 2001 0 5 5 10 14 34 Total 3 8 11 45 131 198
1995
1996
1997
1998
1999
2000
2001
Lowest: 72 25 13 141 56 7 27 Highest: 1491 484 2133 1064 750 1118 1351 Mean: 423 174 471 404 303 291 217 Median: 315 156 455 308 274 232 163
Percent of home and garden samples within each Mg range (lbs Morgan Mg/acre):
<20
20-65
66-100
101-199
>199
Total
Very Low
Low Medium High Very High
1995 0 0 12 12 75 100 1996 0 10 10 60 20 100 1997 2 0 0 11 87 100 1998 0 0 0 20 80 100 1999 0 2 2 29 67 100 2000 6 3 6 21 64 100 2001 0 15 15 29 41 100 Total 2 4 6 23 66 100
Ketterings, Q.M., H. Krol, W.S. Reid and J. van der Heide (2004). Oswego County Soil Sample Survey 1995-2001. CSS Extension Bulletin E04-22. 37 pages.
27
8.2 Samples for Commercial Production Number of samples submitted for commercial production within each Mg range (lbs Mg/acre Morgan extraction):
<20
20-65
66-100
101-199
>199
Total
Very Low
Low Medium High Very High
1995 0 14 16 44 124 198 1996 0 20 12 33 102 167 1997 2 15 9 22 83 131 1998 0 9 8 13 45 75 1999 2 9 8 12 17 48 2000 0 11 5 4 62 82 2001 1 6 7 12 28 54 Total 5 84 65 140 461 755
1995
1996
1997
1998
1999
2000
2001
Lowest: 21 21 15 22 7 24 18 Highest: 9180 5787 5678 5649 549 3593 6598 Mean: 1219 286 1225 956 180 947 1016 Median: 292 232 331 248 138 437 220
Percent of samples submitted for commercial production within each magnesium range (lbs Mg/acre Morgan extraction):
<20
20-65
66-100
101-199
>199
Total
Very Low
Low Medium High Very High
1995 0 7 8 22 63 100 1996 0 12 7 20 61 100 1997 2 11 7 17 63 100 1998 0 12 11 17 60 100 1999 4 19 17 25 35 100 2000 0 13 6 5 76 100 2001 2 11 13 22 52 100 Total 1 11 9 19 61 100
Ketterings, Q.M., H. Krol, W.S. Reid and J. van der Heide (2004). Oswego County Soil Sample Survey 1995-2001. CSS Extension Bulletin E04-22. 37 pages.
28
9. Iron
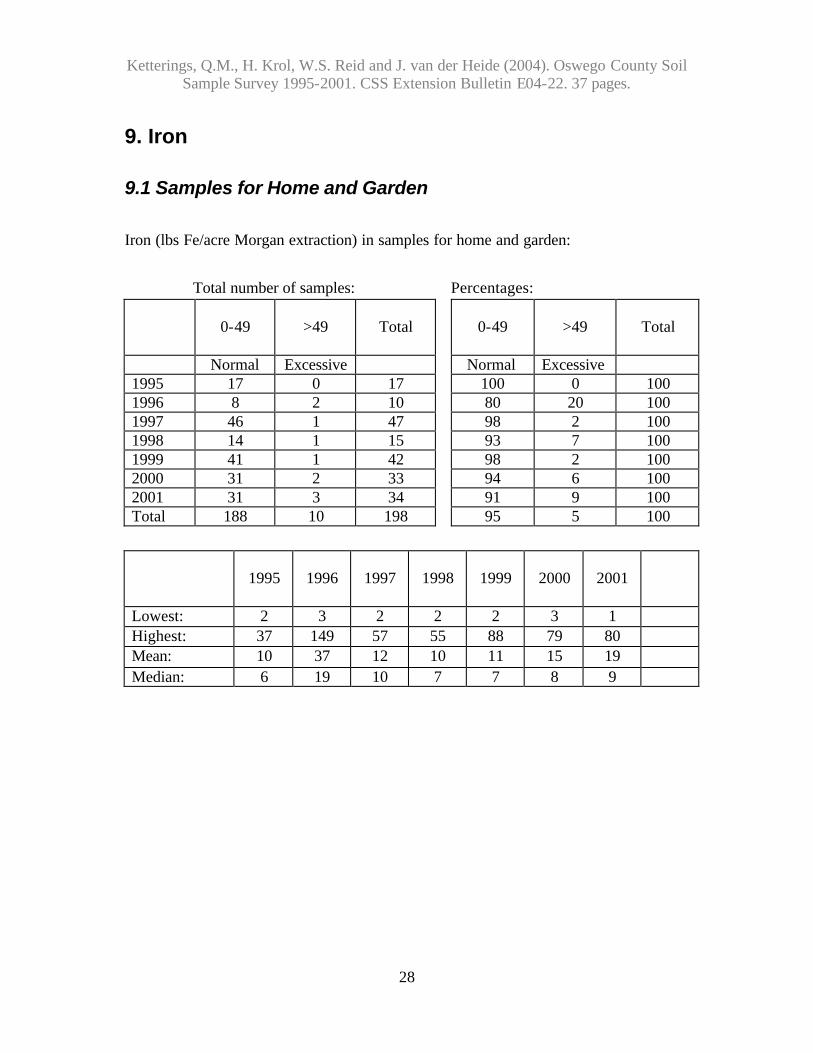
9.1 Samples for Home and Garden Iron (lbs Fe/acre Morgan extraction) in samples for home and garden: Total number of samples: Percentages:
0-49
>49
Total
0-49
>49
Total
Normal Excessive Normal Excessive 1995 17 0 17 100 0 100 1996 8 2 10 80 20 100 1997 46 1 47 98 2 100 1998 14 1 15 93 7 100 1999 41 1 42 98 2 100 2000 31 2 33 94 6 100 2001 31 3 34 91 9 100 Total 188 10 198 95 5 100
1995
1996
1997
1998
1999
2000
2001
Lowest: 2 3 2 2 2 3 1 Highest: 37 149 57 55 88 79 80 Mean: 10 37 12 10 11 15 19 Median: 6 19 10 7 7 8 9
Ketterings, Q.M., H. Krol, W.S. Reid and J. van der Heide (2004). Oswego County Soil Sample Survey 1995-2001. CSS Extension Bulletin E04-22. 37 pages.
29
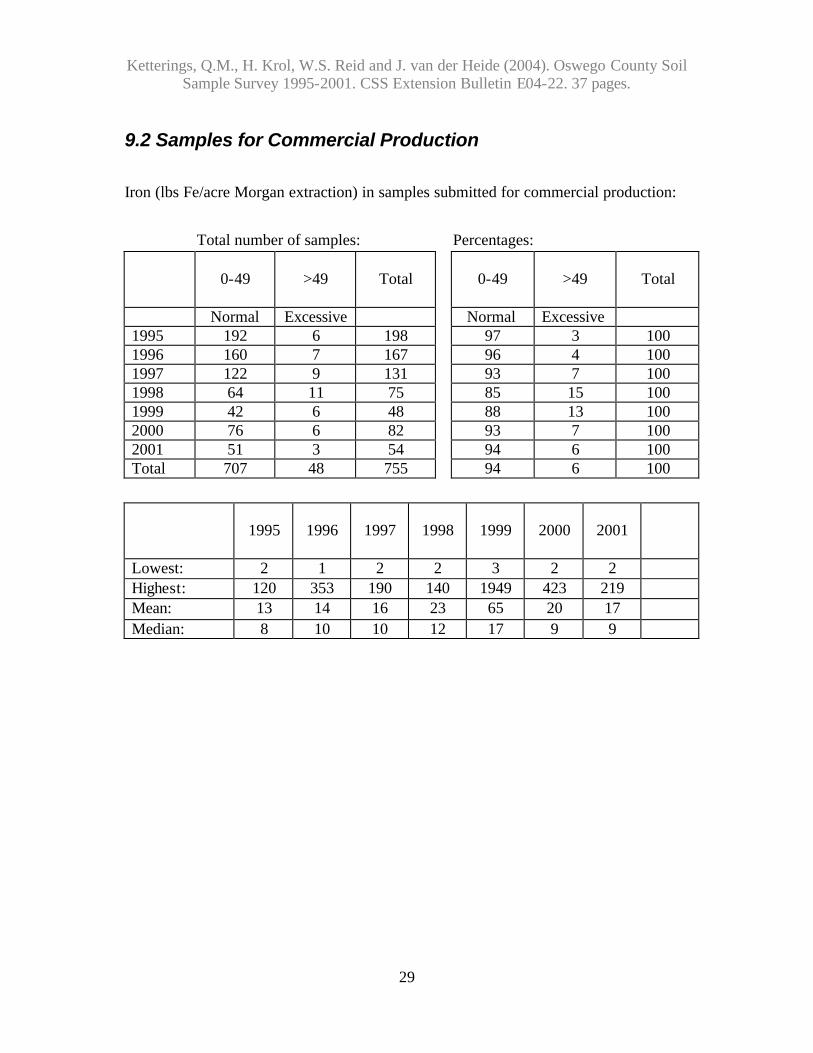
9.2 Samples for Commercial Production Iron (lbs Fe/acre Morgan extraction) in samples submitted for commercial production: Total number of samples: Percentages:
0-49
>49
Total
0-49
>49
Total
Normal Excessive Normal Excessive 1995 192 6 198 97 3 100 1996 160 7 167 96 4 100 1997 122 9 131 93 7 100 1998 64 11 75 85 15 100 1999 42 6 48 88 13 100 2000 76 6 82 93 7 100 2001 51 3 54 94 6 100 Total 707 48 755 94 6 100
1995
1996
1997
1998
1999
2000
2001
Lowest: 2 1 2 2 3 2 2 Highest: 120 353 190 140 1949 423 219 Mean: 13 14 16 23 65 20 17 Median: 8 10 10 12 17 9 9
Ketterings, Q.M., H. Krol, W.S. Reid and J. van der Heide (2004). Oswego County Soil Sample Survey 1995-2001. CSS Extension Bulletin E04-22. 37 pages.
30
10. Manganese
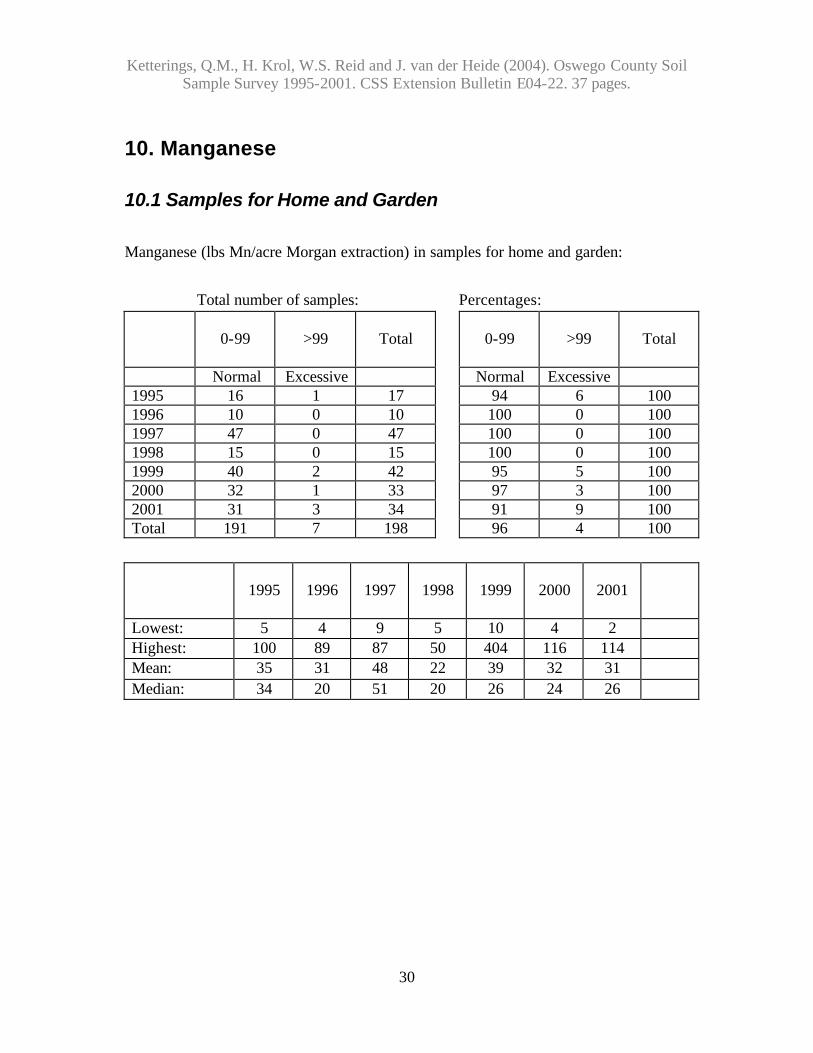
10.1 Samples for Home and Garden Manganese (lbs Mn/acre Morgan extraction) in samples for home and garden: Total number of samples: Percentages:
0-99
>99
Total
0-99
>99
Total
Normal Excessive Normal Excessive 1995 16 1 17 94 6 100 1996 10 0 10 100 0 100 1997 47 0 47 100 0 100 1998 15 0 15 100 0 100 1999 40 2 42 95 5 100 2000 32 1 33 97 3 100 2001 31 3 34 91 9 100 Total 191 7 198 96 4 100
1995
1996
1997
1998
1999
2000
2001
Lowest: 5 4 9 5 10 4 2 Highest: 100 89 87 50 404 116 114 Mean: 35 31 48 22 39 32 31 Median: 34 20 51 20 26 24 26

Ketterings, Q.M., H. Krol, W.S. Reid and J. van der Heide (2004). Oswego County Soil Sample Survey 1995-2001. CSS Extension Bulletin E04-22. 37 pages.
31
10.2 Samples for Commercial Production Manganese (lbs Mn/acre Morgan extraction) in samples for commercial production: Total number of samples: Percentages:
0-99
>99
Total
0-99
>99
Total
Normal Excessive Normal Excessive 1995 187 11 198 94 6 100 1996 161 6 167 96 4 100 1997 123 8 131 94 6 100 1998 70 5 75 93 7 100 1999 48 0 48 100 0 100 2000 81 1 82 99 1 100 2001 54 0 54 100 0 100 Total 724 31 755 96 4 100
1995
1996
1997
1998
1999
2000
2001
Lowest: 4 4 5 4 3 4 6 Highest: 290 194 143 515 95 205 76 Mean: 35 30 45 47 31 27 31 Median: 23 25 38 26 28 22 26
Ketterings, Q.M., H. Krol, W.S. Reid and J. van der Heide (2004). Oswego County Soil Sample Survey 1995-2001. CSS Extension Bulletin E04-22. 37 pages.
32
11. Zinc
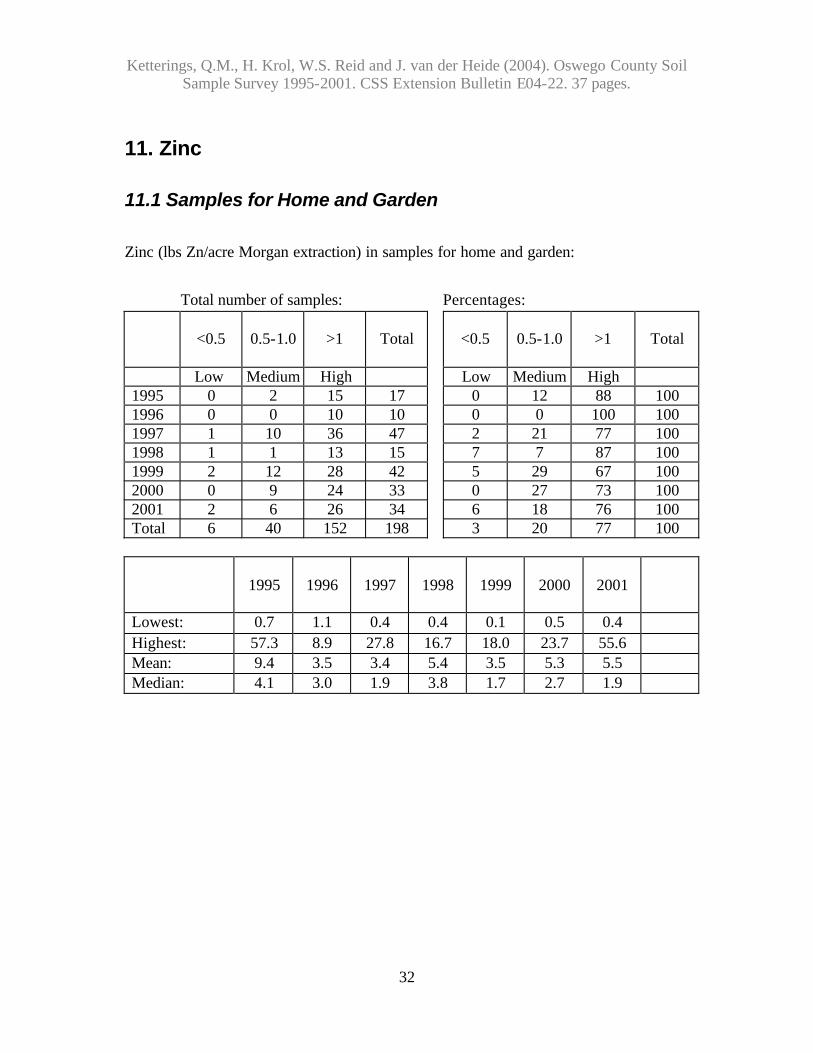
11.1 Samples for Home and Garden Zinc (lbs Zn/acre Morgan extraction) in samples for home and garden: Total number of samples: Percentages:
1995
1996
1997
1998
1999
2000
2001
Lowest: 0.7 1.1 0.4 0.4 0.1 0.5 0.4 Highest: 57.3 8.9 27.8 16.7 18.0 23.7 55.6 Mean: 9.4 3.5 3.4 5.4 3.5 5.3 5.5 Median: 4.1 3.0 1.9 3.8 1.7 2.7 1.9
<0.5
0.5-1.0
>1
Total
<0.5
0.5-1.0
>1
Total
Low Medium High Low Medium High 1995 0 2 15 17 0 12 88 100 1996 0 0 10 10 0 0 100 100 1997 1 10 36 47 2 21 77 100 1998 1 1 13 15 7 7 87 100 1999 2 12 28 42 5 29 67 100 2000 0 9 24 33 0 27 73 100 2001 2 6 26 34 6 18 76 100 Total 6 40 152 198 3 20 77 100
Ketterings, Q.M., H. Krol, W.S. Reid and J. van der Heide (2004). Oswego County Soil Sample Survey 1995-2001. CSS Extension Bulletin E04-22. 37 pages.
33
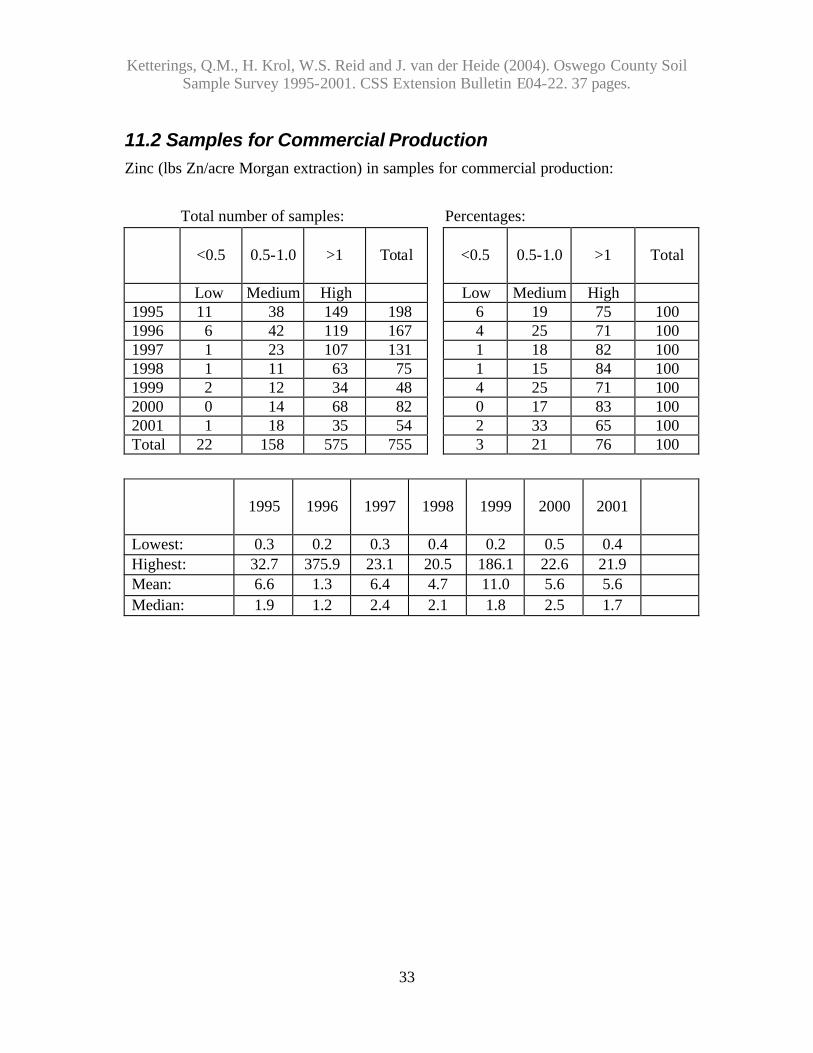
11.2 Samples for Commercial Production Zinc (lbs Zn/acre Morgan extraction) in samples for commercial production: Total number of samples: Percentages:
<0.5
0.5-1.0
>1
Total
<0.5
0.5-1.0
>1
Total
Low Medium High Low Medium High 1995 11 38 149 198 6 19 75 100 1996 6 42 119 167 4 25 71 100 1997 1 23 107 131 1 18 82 100 1998 1 11 63 75 1 15 84 100 1999 2 12 34 48 4 25 71 100 2000 0 14 68 82 0 17 83 100 2001 1 18 35 54 2 33 65 100 Total 22 158 575 755 3 21 76 100
1995
1996
1997
1998
1999
2000
2001
Lowest: 0.3 0.2 0.3 0.4 0.2 0.5 0.4 Highest: 32.7 375.9 23.1 20.5 186.1 22.6 21.9 Mean: 6.6 1.3 6.4 4.7 11.0 5.6 5.6 Median: 1.9 1.2 2.4 2.1 1.8 2.5 1.7
Ketterings, Q.M., H. Krol, W.S. Reid and J. van der Heide (2004). Oswego County Soil Sample Survey 1995-2001. CSS Extension Bulletin E04-22. 37 pages.
34
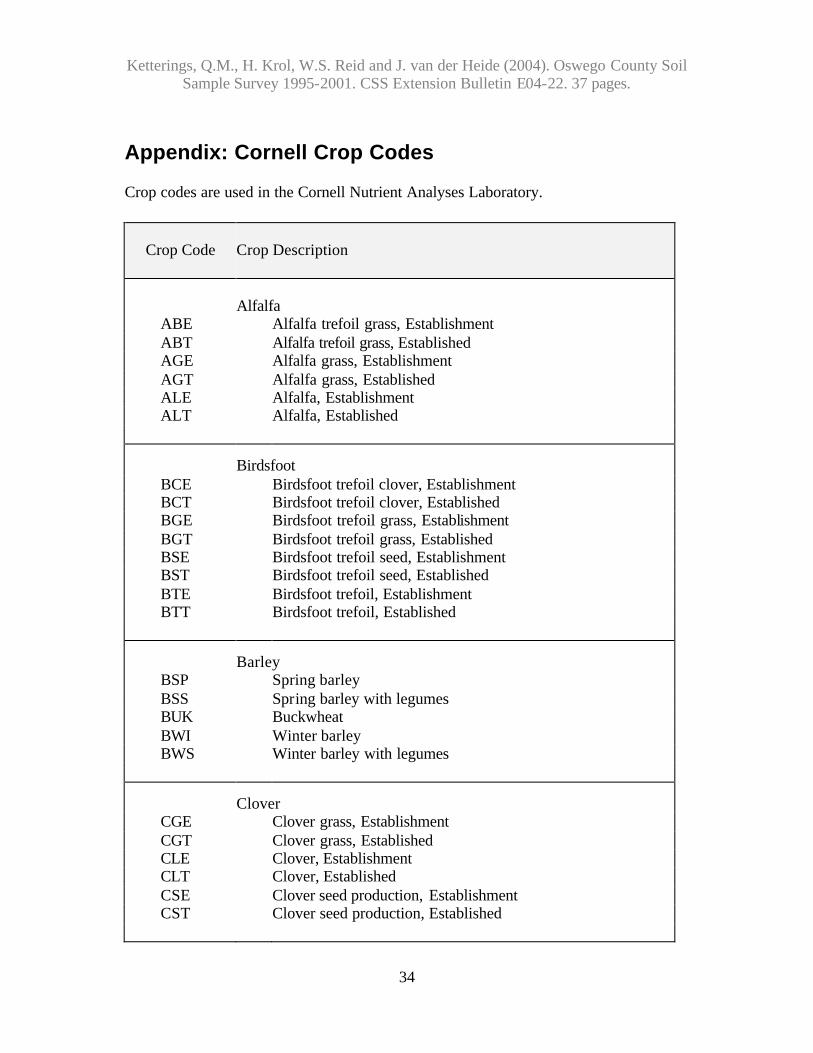
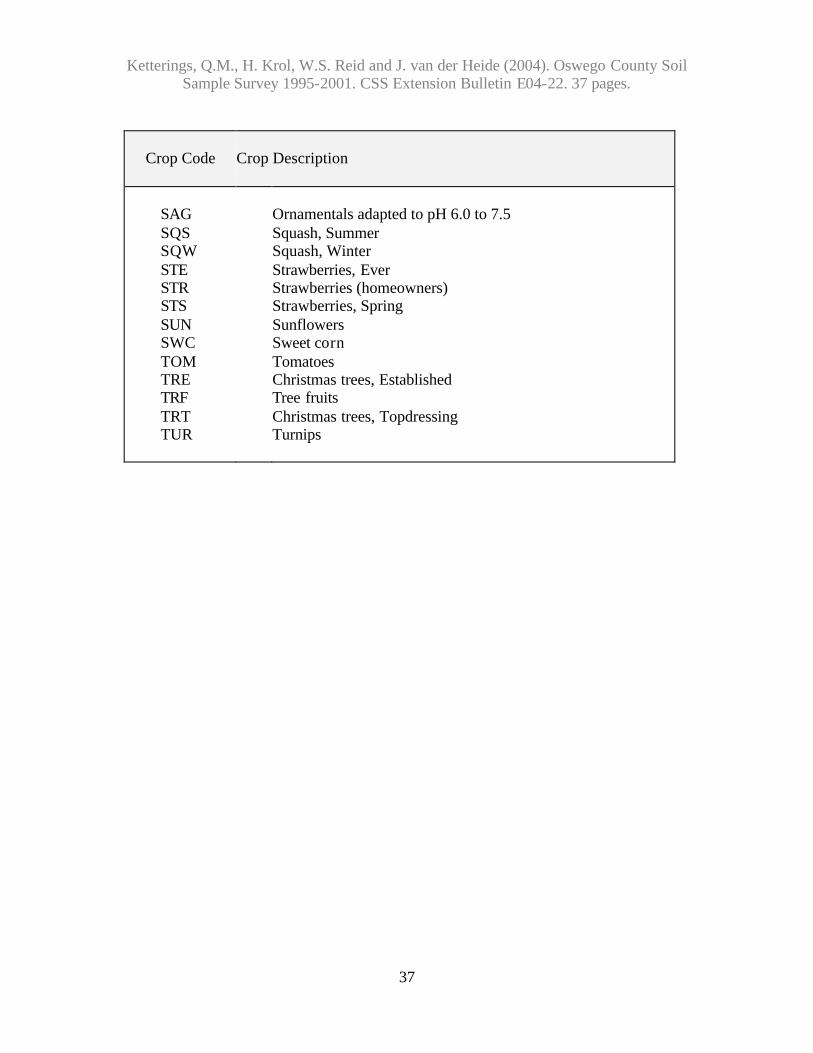
Appendix: Cornell Crop Codes
Crop codes are used in the Cornell Nutrient Analyses Laboratory.
Crop Code
Crop Description
Alfalfa
ABE Alfalfa trefoil grass, Establishment ABT Alfalfa trefoil grass, Established AGE Alfalfa grass, Establishment AGT Alfalfa grass, Established ALE Alfalfa, Establishment ALT Alfalfa, Established
Birdsfoot BCE Birdsfoot trefoil clover, Establishment BCT Birdsfoot trefoil clover, Established BGE Birdsfoot trefoil grass, Establishment BGT Birdsfoot trefoil grass, Established BSE Birdsfoot trefoil seed, Establishment BST Birdsfoot trefoil seed, Established BTE Birdsfoot trefoil, Establishment BTT Birdsfoot trefoil, Established
Barley
BSP Spring barley BSS Spring barley with legumes BUK Buckwheat BWI Winter barley BWS Winter barley with legumes
Clover CGE Clover grass, Establishment CGT Clover grass, Established CLE Clover, Establishment CLT Clover, Established CSE Clover seed production, Establishment CST Clover seed production, Established
Ketterings, Q.M., H. Krol, W.S. Reid and J. van der Heide (2004). Oswego County Soil Sample Survey 1995-2001. CSS Extension Bulletin E04-22. 37 pages.
35
Crop Code
Crop Description
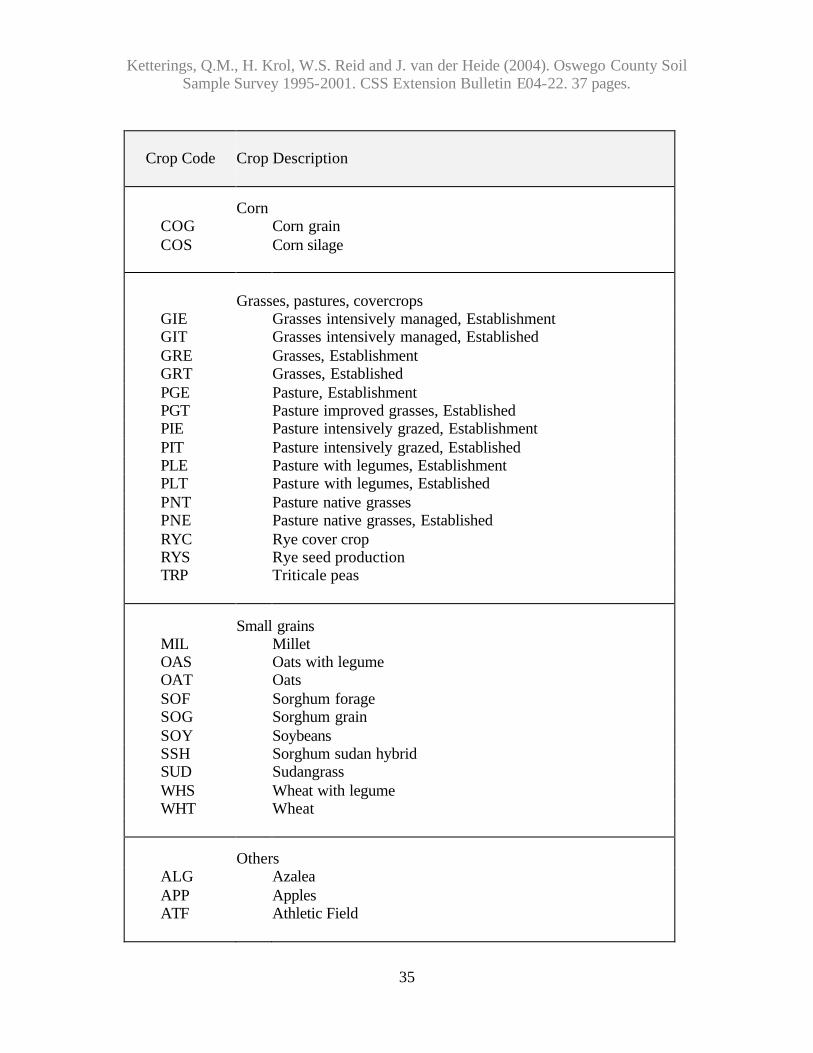
Corn COG Corn grain COS Corn silage
Grasses, pastures, covercrops
GIE Grasses intensively managed, Establishment GIT Grasses intensively managed, Established GRE Grasses, Establishment GRT Grasses, Established PGE Pasture, Establishment PGT Pasture improved grasses, Established PIE Pasture intensively grazed, Establishment PIT Pasture intensively grazed, Established PLE Pasture with legumes, Establishment PLT Pasture with legumes, Established PNT Pasture native grasses PNE Pasture native grasses, Established RYC Rye cover crop RYS Rye seed production TRP Triticale peas
Small grains MIL Millet OAS Oats with legume OAT Oats SOF Sorghum forage SOG Sorghum grain SOY Soybeans SSH Sorghum sudan hybrid SUD Sudangrass WHS Wheat with legume WHT Wheat
Others ALG APP ATF
Azalea Apples Athletic Field
Ketterings, Q.M., H. Krol, W.S. Reid and J. van der Heide (2004). Oswego County Soil Sample Survey 1995-2001. CSS Extension Bulletin E04-22. 37 pages.
36
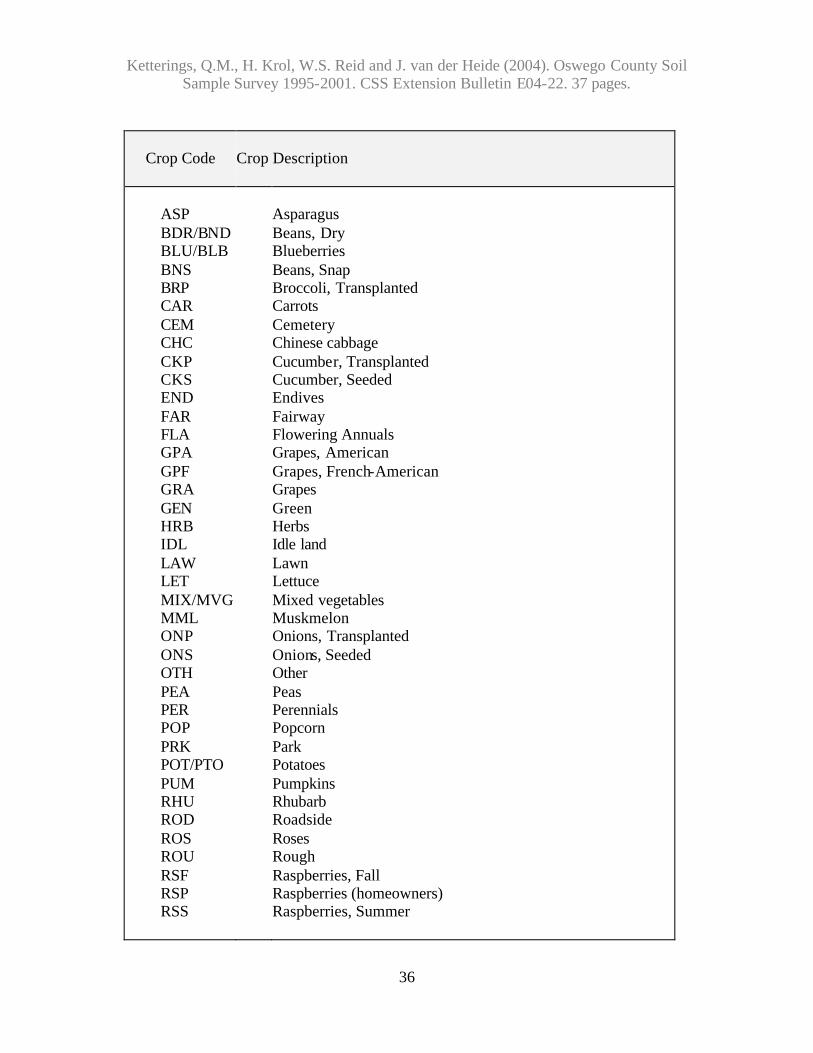
Crop Code
Crop Description
ASP BDR/BND BLU/BLB BNS BRP CAR CEM CHC CKP CKS END FAR FLA GPA GPF GRA GEN HRB IDL LAW LET MIX/MVG MML ONP ONS OTH PEA PER POP PRK POT/PTO PUM RHU ROD ROS ROU RSF RSP RSS
Asparagus Beans, Dry Blueberries Beans, Snap Broccoli, Transplanted Carrots Cemetery Chinese cabbage Cucumber, Transplanted Cucumber, Seeded Endives Fairway Flowering Annuals Grapes, American Grapes, French-American Grapes Green Herbs Idle land Lawn Lettuce Mixed vegetables Muskmelon Onions, Transplanted Onions, Seeded Other Peas Perennials Popcorn Park Potatoes Pumpkins Rhubarb Roadside Roses Rough Raspberries, Fall Raspberries (homeowners) Raspberries, Summer
Ketterings, Q.M., H. Krol, W.S. Reid and J. van der Heide (2004). Oswego County Soil Sample Survey 1995-2001. CSS Extension Bulletin E04-22. 37 pages.
37
Crop Code
Crop Description
SAG SQS SQW STE STR STS SUN SWC TOM TRE TRF TRT TUR
Ornamentals adapted to pH 6.0 to 7.5 Squash, Summer Squash, Winter Strawberries, Ever Strawberries (homeowners) Strawberries, Spring Sunflowers Sweet corn Tomatoes Christmas trees, Established Tree fruits Christmas trees, Topdressing Turnips