Embed Size (px)
Citation preview
COST BENEFIT ANALYSIS OF POTENTIAL ENERGY
CONSERVATION PROGRAM AT OKLAHOMA
STATE UNIVERSITY
By
DEJAN SKORIC
Bachelor of Science
University of J.J. Strossmayer
Osijek, Croatia
2000
Submitted to the Faculty of the Graduate College of the
Oklahoma State University in partial fulfillment of
the requirements for the degree of
MASTER OF SCIENCE July 2004
ii
COST BENEFIT ANALYSIS OF POTENTIAL ENERGY
CONSERVATION PROGRAM AT OKLAHOMA
STATE UNIVERSITY
Thesis Approved:
Dr. Arthur Stoecker Thesis Adviser
Dr. Sarah Kimball
Dr. Will Focht
Dr. Al Carlozzi Dean of Graduate College
iii
ACKNOWLEDGMENTS
I would like to express my sincere appreciation to my major advisor, Dr. Art Stoecker
for his support, patience and kindness. His invaluable knowledge and guidance have
been essential for the completion of this project. I would also like to extend my
appreciation to my other committee members Dr. Sarah Kimball and Dr. Will Focht for
their constructive criticism and support.
I am forever thankful to Jeff Stewart, Ted Maxwell and Dan Ferguson from Oklahoma
State University’s Physical Plant for their technical assistance and guidance throughout
the course of this research project. Also, my gratitude extends to Tom Downing, Energy
Manager for Yale University for his support and friendship that I will always cherish.
I would also like to thank my wife, Aleksandra Radjenovic for giving me love,
encouragement and support when I needed it the most.
iv
TABLE OF CONTENTS
Chapter Page
I. INTRODUCTION ……………………………………………………... 1
II. ENERGY MANAGEMENT AND ENERGY CONSERVATION …… 4 Introduction …………………………………………………………….. 4 Energy Conservation in Practice ……………………………………….. 9 Benefits of Green Buildings ………………………………………….. 14
III. COST-BENEFIT ANALYSIS …………………………………………. 16 Introduction …………………………………………………………… 16 Characteristics and Principles of Cost-benefit Analysis …………….… 17 Analyzing Benefits …………………………………………………….. 20 Key Technical Considerations …………………………………………. 21 Measuring the Externalities in Energy Production .…………………… 26
IV METHODOLOGY …………………………………………………….. 30
V FINDINGS ……………………………………………………………... 34 Energy Management Practices at Oklahoma State University ………… 34 Economic Analysis of Potential Energy Management Program .……… 43
VI ENERGY MANAGEMENT PROGRAM: A PROPOSAL …………… 72 Administrative Support ………………………………………………… 73 Energy Policy …………………………………………………………... 74 Energy Manager ………………………………………………………... 75 Energy Conservation Committee ……………………………………… 76 Energy Conservation Action Group …………………………………… 77 Energy Audit ...…………………………………………………………. 78
v
Energy Education and Outreach .……………………………………… 79 Investments and Savings ……………………………………………….. 80
VII CONCLUSIONS ………………………………………………………. 83 Limitations of the Study ……………………………………………….. 88 Recommendations for the Future Study ……………………………….. 89 BIBLIOGRAPHY …………….………………………………………... 90 APPENDIXES …………………………………………………………. 95 Appendix A – University Policies on Energy Management …………… 95 Appendix B - Examples of Low to Medium Cost Projects .…………… 104 Appendix C – Calculations of Cost of Energy Management Program .... 106 Appendix D – Calculations of NPV for Lighting Retrofit .……………. 108 Appendix E – Vending Miser ………………………………………….. 112 Appendix F – Computer Use …………………………………………... 115 Appendix G – Occupancy Sensors in Restrooms ……………………… 117
vi
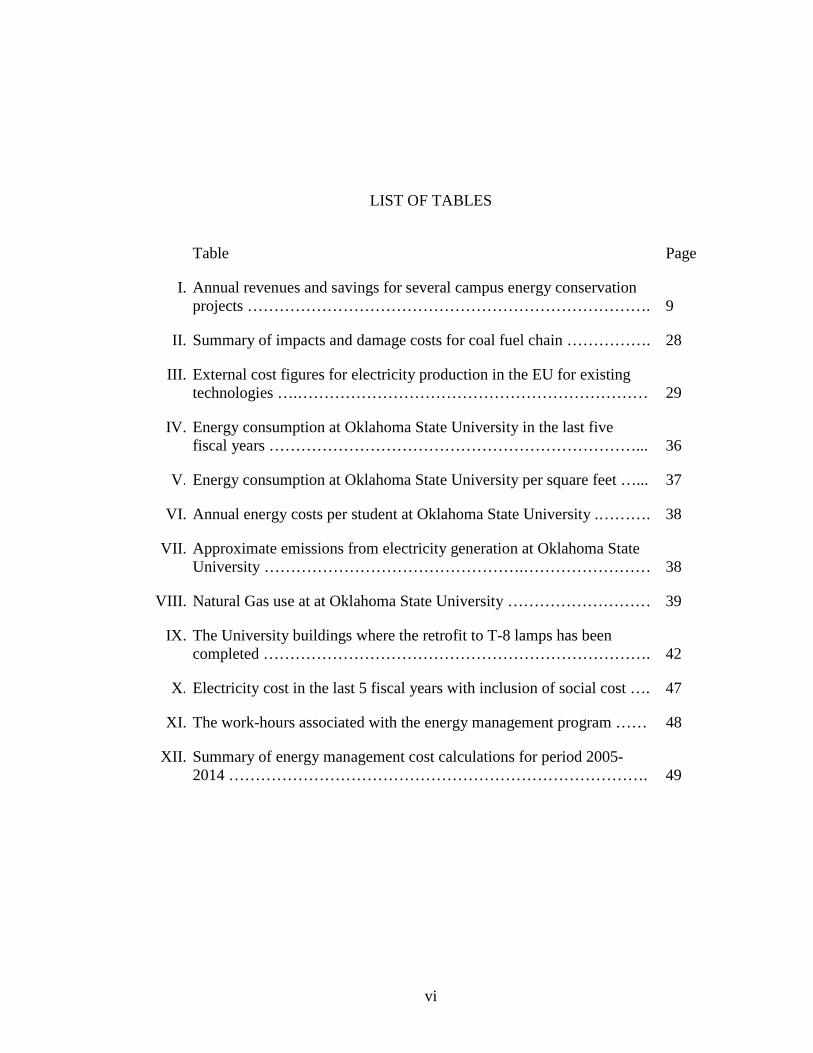
LIST OF TABLES
Table Page
I. Annual revenues and savings for several campus energy conservation projects ………………………………………………………………….
9
II. Summary of impacts and damage costs for coal fuel chain ……………. 28
III. External cost figures for electricity production in the EU for existing technologies ….…………………………………………………………
29
IV. Energy consumption at Oklahoma State University in the last five fiscal years ……………………………………………………………...
36
V. Energy consumption at Oklahoma State University per square feet …... 37
VI. Annual energy costs per student at Oklahoma State University .………. 38
VII. Approximate emissions from electricity generation at Oklahoma State University ………………………………………….……………………
38
VIII. Natural Gas use at at Oklahoma State University ……………………… 39
IX. The University buildings where the retrofit to T-8 lamps has been completed ……………………………………………………………….
42
X. Electricity cost in the last 5 fiscal years with inclusion of social cost …. 47
XI. The work-hours associated with the energy management program …… 48
XII. Summary of energy management cost calculations for period 2005-2014 …………………………………………………………………….
49
vii
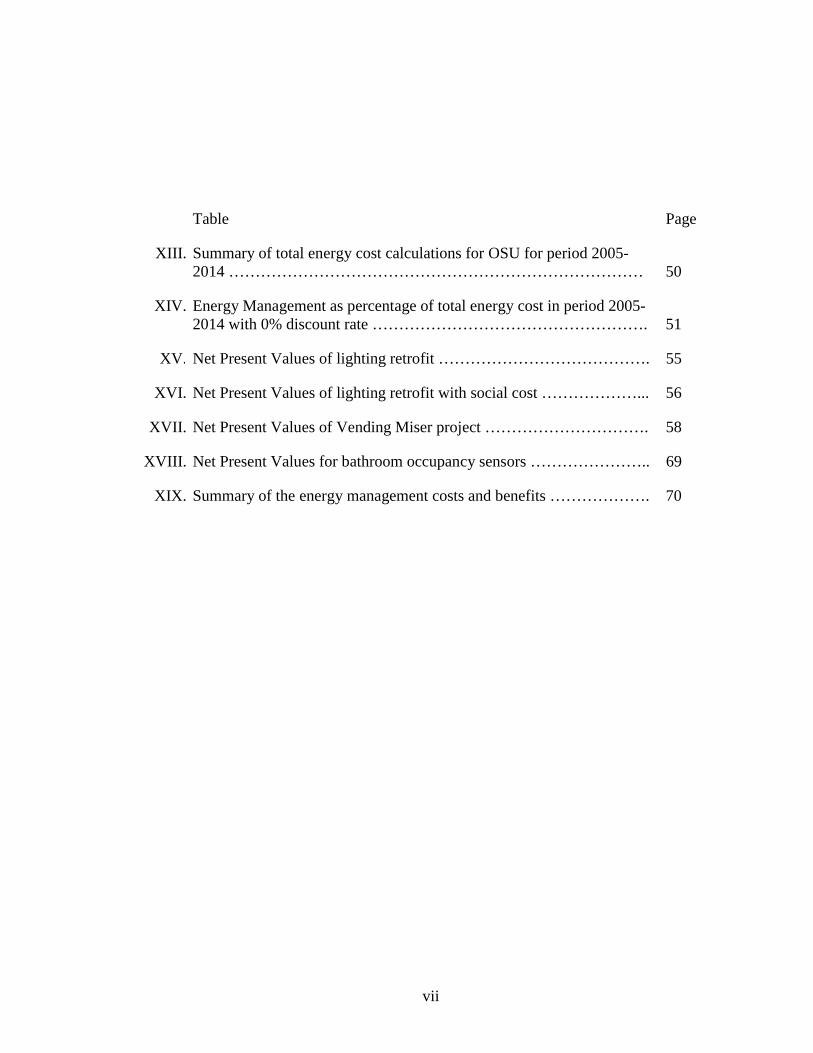
Table Page
XIII. Summary of total energy cost calculations for OSU for period 2005-2014 ……………………………………………………………………
50
XIV. Energy Management as percentage of total energy cost in period 2005-2014 with 0% discount rate …………………………………………….
51
XV. Net Present Values of lighting retrofit …………………………………. 55
XVI. Net Present Values of lighting retrofit with social cost ………………... 56
XVII. Net Present Values of Vending Miser project …………………………. 58
XVIII. Net Present Values for bathroom occupancy sensors ………………….. 69
XIX. Summary of the energy management costs and benefits ………………. 70
viii
LIST OF FIGURES
Figure Page
1. Continuous improvement model ………………………………………. 72
ix
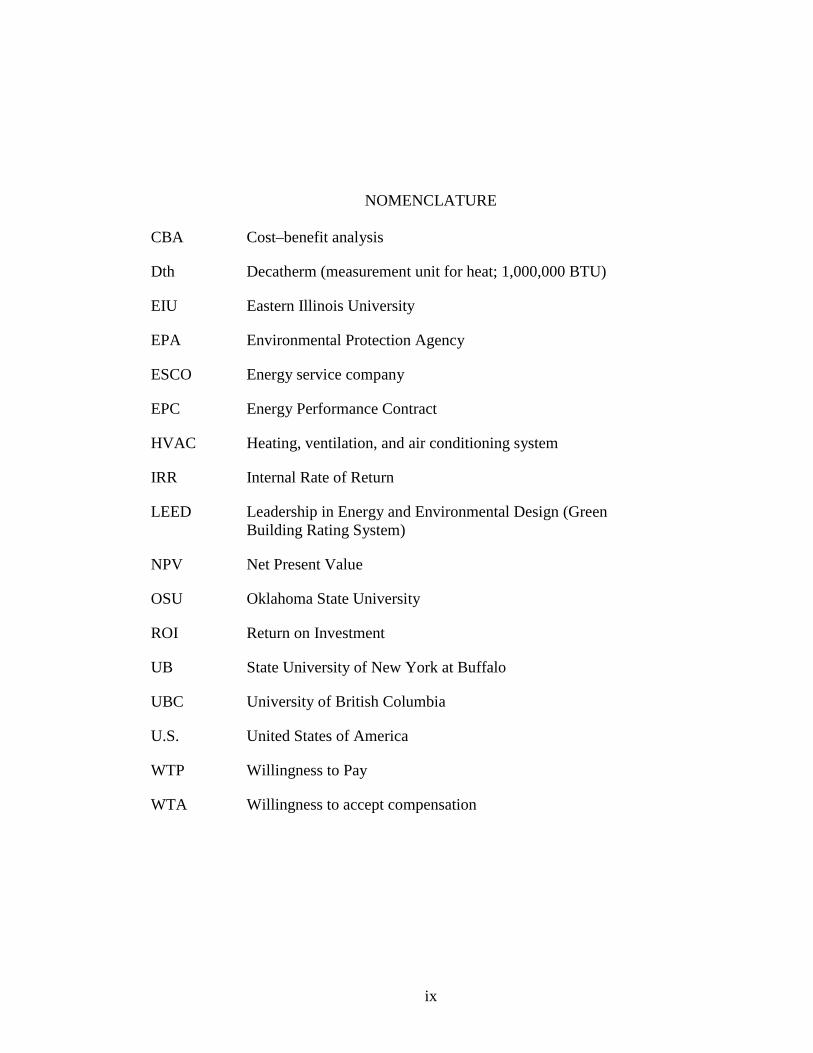
NOMENCLATURE
CBA Cost–benefit analysis
Dth Decatherm (measurement unit for heat; 1,000,000 BTU)
EIU Eastern Illinois University
EPA Environmental Protection Agency
ESCO Energy service company
EPC Energy Performance Contract
HVAC Heating, ventilation, and air conditioning system
IRR Internal Rate of Return
LEED Leadership in Energy and Environmental Design (Green Building Rating System)
NPV Net Present Value
OSU Oklahoma State University
ROI Return on Investment
UB State University of New York at Buffalo
UBC University of British Columbia
U.S. United States of America
WTP Willingness to Pay
WTA Willingness to accept compensation
1
CHAPTER I
INTRODUCTION
Oil boycotts in 1970s and resulting shocks for economy and everyday life put the energy
conservation firmly in the minds of millions of Americans, or so it seemed. In the last
three decades significant progress has been made in discovering the ways to effectively
conserve energy and still enjoy the same comfort levels as before. However, after the
energy crises ended and days of cheap energy returned, energy conservation slipped from
a mind of general public and officials. Only in the 1990s we have witnessed the slow
resurgence of it, this time because of environmental problems connected with extraction,
and production of electricity.
Universities have followed a similar path. Most of the Universities began thinking and
investing in energy conservation in 1970s, only to return to ‘sloppy habits’ in the 1980s
(Fickes, M., 2002). While there are many examples of Universities that were successful
in keeping their energy conservation programs active (and that now count their annual
savings in millions), there are also many universities where with passing of 1970s energy
crises, their interest in energy management and conservation passed also. By doing so
they have missed an opportunity to improve energy efficiency and thus improve the
environment while enjoying significant financial benefits.
2
Financial benefits are only a part of the overall benefits that such Universities are
missing. Byproducts of energy generation (air pollution, global warming, water pollution,
land disturbance, etc) are the cause of numerous environmental and human health
problems.
Universities as centers of education and research should try to move away from a narrow,
short-term point of view and embrace the concept of sustainability that requires that our
actions should not only be economically, but also environmentally and socially sound.
Such a view also has a significant education role by serving as a model to the students.
Energy conservation programs are one such action, not only do they help reduce
environmental and social problems associated with energy production and consumption,
but they also make perfect business sense.
Concentrating on a case study of Oklahoma State University, this study will show that by
committing to a comprehensive energy conservation program, Universities can improve
their financial and environmental performance at the same time.
In the last couple of years OSU has experienced a financial crisis: on one hand costs are
increasing (and utility costs are part of it), while on the other the state support is
dwindling. The administration has reacted with multiple tuition and fees increases on one
hand and by cutting costs on another. I believe that the financial crisis would be even
greater if not for the efforts this University in general, but especially Physical Plant have
been making in order to conserve energy. Measures varied from posting signs reminding
people to turn the lights off to campus-wide lightning retrofit and modernization and
expansion of building control management systems. All those measures have resulted in
significant energy savings and while in the last 5 years a couple of new buildings were
3
added to the campus, overall energy consumption has stayed almost flat. Most of those
measures have made the university a safer and more comfortable place to work and learn.
There is also much more that can be done to enable this university to conserve energy,
while at the same time keeping or even increasing the comfort levels.
Without strong support of senior administration, the Physical Plant personal cannot
utilize the full extent of cost-savings opportunities. The University officials may not be
fully aware of potential benefits of developing such systems, and consequently, given the
tight budgets are very reluctant to commit to something that might prove to be very
costly.
A benefit-cost analysis of an energy management system may help to dispel such
reservations. Such analysis can present the full potential of such system, and show if an
energy conservation project can benefit the triple bottom line: economic, social and
environmental.
This thesis will be effort to conduct and present a model for such economic analysis.
4
CHAPTER II
ENERGY MANAGEMENT AND ENERGY CONSERVATION
2.1 Introduction
Energy conservation programs, that burst forcefully on the scene with the oil crises of
1970s, only to be significantly scaled down after 1985 collapse of oil prices, are again
enjoying a renaissance. The renaissance is driven partly by environmental concerns, but
also because new energy efficiency technologies developed in the 1990s have enabled the
significant cost savings (Haugland, T., 1996).
Even though they were not always supported, the conservation and efficiency programs
have been very successful. As result of such programs total primary energy use per capita
in the United States in 2000 was almost identical to that of 1973. Over the same 27-year
period, gross domestic product per capita increased 74%. In 2000, consumers and
businesses spent over $600 billion for total energy use in the United States. Had the
nation not dramatically reduced its energy intensity over the previous 27 years, they
would have spent at least $430 billion more on energy purchases in 2000 (Nadel, S. and
Geller, H., 2001).
Turner and Capehart (2001) conclude that energy managers have proven time and time
again, that energy management is cost effective. Furthermore, energy management is
vital to national security, environmental welfare, and economic productivity.
5
However, even though the United States is much more energy-efficient today than it was
25 years ago, there is still enormous potential for additional cost-effective energy savings
(Nadel, S. and Geller, H., 2001). Energy conservation measures have been promoted as a
win-win option, meaning that appropriate conservation measures will both benefit the
environment and provide energy consumers and society with a net economic gain. The
win-win proposition draws its scientific basis from a large number of engineering studies
showing that energy consumption can profitably be reduced by 20% or more (Haugland,
T., 1996). The U.S. Department of Energy estimates that increasing energy efficiency
throughout the economy could cut national energy use by 10% or more in 2010 and
approximately 20% in 2020, with net economic benefits for consumers and businesses
(Nadel, S. and Geller, H., 2001).
Everybody, on all levels starting from government or society as whole down to a single
individual can benefit from conserving energy. Somewhere in the middle of this pyramid
of users we find the user of interest for this thesis: “Universities that represent
microcosms of society, and as such consume vast amounts of resources” (UBC Campus
Sustainability Office, 2004).
The reason for this particular interest is that Universities, as research and education
centers of the world, are responsible for countless achievements. They’ve saved millions
of lives through medical advances, raised living standards, and nurtured healthy
communities. But universities must take some responsibility for the more disturbing
aspects of their achievements. To a certain degree, they contribute to and support
attitudes that have built a foundation for the western world’s consumptive lifestyle—a
lifestyle that is responsible for majority of environmental problems we are faced with
6
today. So, universities need to set positive social, environmental, and economic examples
for their societies to follow (UBC Campus Sustainability Office, 2003b).
The case for energy management and conservation is especially strong in recent years for
public universities. State and federal budgets are running at a deficit and so the state
universities are faced with choice either to increase the tuitions and fees or make cuts and
eventually lower the quality of service. While struggling to make more out of less the
question is, will the universities rely mainly on multiple tuition increases or will they
look for creative ways to provide the same or better services at lower cost? Energy
management is one such area that produces dramatic savings without decreasing user
comfort (Zeloznicki, S., 2000).
Energy conservation on campus saves state tax dollars and mitigates the numerous
adverse environmental and social impacts associated with energy production and
consumption. These impacts include air pollution, acid rain and global warming, oil spills
and water pollution, loss of wilderness areas, construction of new power plants, foreign
energy dependence and the risk of international conflict over energy supplies. (UB Green,
2002)
In addition to energy savings, other benefits of more energy-efficient campuses include
increased productivity, positive cash flow, healthier indoor air quality, improved lighting,
more comfortable working and learning conditions, and a contribution to a cleaner
environment (Dickerman, R. N., 2002).
A common excuse for universities not committing to greening activities in general, or
more narrowly to energy conservation are financial constraints. While universities are,
indeed faced with many financial constraints, Allen A. S. (1999) argues that other
7
barriers are more important in constraining the universities to fully utilize the energy
conservation opportunities. Such barriers are:
• Institutional/organizational – lack of communication, lack of advocacy and the
lack of a leader / fixer.
• Financial – lack of allocation of resources, not simply “financial”.
• Cultural – amounts to a lack of education. and
• Educational – lack of a modus for education.
Another, more detailed and operational list of the main barriers before the energy
management differentiates between managerial and technical barriers (BEE, 2003):
Managerial:
• Energy management is side-lined as a technical specialty.
• There is insufficient interest and driving force from above.
• There is little incentive for departmental managers and general staff to save
energy.
• Lack of senior management commitment.
• Senior management unaware of potential savings.
• Higher priority given to "more important" issues.
• It is seen as an overhead cost.
• Energy is consumed by a large number of users.
• Users are unaware of energy use and costs.
Technical:
• Getting accurate data on time is a key problem.
• Monitoring and targeting is not integrated with financial accounting.
8
• Output is not reported to either users or senior managers in a form they can
readily understand and use.
• Users have no information on how to make saving.
Even though each university is unique, and energy conservation programs have to be
tailored to University’s specific needs, Allen A. S. (1999) lists the following
characteristics as shared by most of successful energy conservation initiatives at
Universities: an institutionalized leader, involving faculty and students (in research and
implementation), advocacy, educating the campus community, the need for seed monies
to start projects (and paying for the projects with savings, or appropriate allocation or
resources), community involvement (competitions and building conservation contacts)
and changing of both large (infrastructure) and small (building scheduling) processes. To
this I will add the support of the senior administration at Universities. It is essential,
especially for new initiatives to have full support from administration starting with policy
developing, then by ensuring enough resources are devoted to conservation programs,
and, equally important, by setting the tone by actually following the recommended policy
in everyday work, in other words serve as example for the staff, faculty and students.
One of the goals for this study is to devise such system of energy management at
Universities that will overcome above-mentioned barriers and allow full utilization of the
benefits of energy conservation
9
2.2 Energy Conservation in Practice
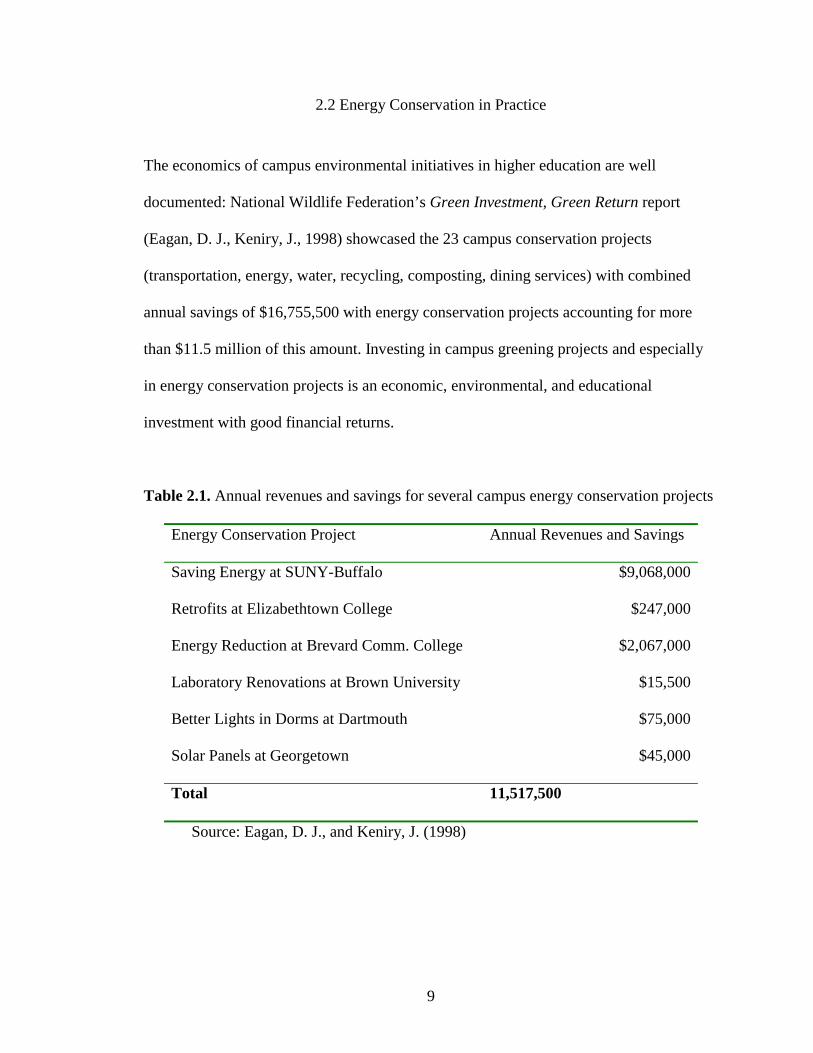
The economics of campus environmental initiatives in higher education are well
documented: National Wildlife Federation’s Green Investment, Green Return report
(Eagan, D. J., Keniry, J., 1998) showcased the 23 campus conservation projects
(transportation, energy, water, recycling, composting, dining services) with combined
annual savings of $16,755,500 with energy conservation projects accounting for more
than $11.5 million of this amount. Investing in campus greening projects and especially
in energy conservation projects is an economic, environmental, and educational
investment with good financial returns.
Table 2.1. Annual revenues and savings for several campus energy conservation projects
Energy Conservation Project Annual Revenues and Savings
Saving Energy at SUNY-Buffalo $9,068,000
Retrofits at Elizabethtown College $247,000
Energy Reduction at Brevard Comm. College $2,067,000
Laboratory Renovations at Brown University $15,500
Better Lights in Dorms at Dartmouth $75,000
Solar Panels at Georgetown $45,000
Total 11,517,500
Source: Eagan, D. J., and Keniry, J. (1998)
10
2.2.1 University of Arizona
The University of Arizona (PERC, 1995) is a small ‘city’ of 50,000 with a utility bill of
over $15 million a year. One million dollars have been saved annually since the school
adopted conservation projects three years ago, despite an increase in electricity use by
15.8 percent and campus growth by 17.7 percent over the past five years. The campus’s
computerized energy management system shuts down many air handlers on weekends
and holidays. Many rooms are also installed with movement-sensitive light switches that
automatically shut off after fifteen minutes of no movement. The University of Arizona’s
Student Union and Residence Life also encourage energy conservation through separate
metering. A contest held by Residence Life rewarded the most energy-conserving hall a
television set and thus created an added incentive for residence halls to reduce energy
use.
2.2.2 State University of New York at Buffalo
Annual Energy Consumption in 2001-2002 (UB Green, 2003):
• Electricity -- 204,000,000 kWh.
• Natural Gas -- 480,000 mcf.
• Coal -- 1,700 tons.
This amount of energy is equivalent to an annual consumption for nearly 50,000
households. Campus energy consumption is responsible for the following estimated
annual energy-related air pollution emissions:
• 500 tons of acid rain-producing sulfur dioxide.
11
• 700 tons of acid rain and smog-producing nitrogen oxides.
• 200,000 tons of global warming enhancing carbon dioxide.
It would take 40 square miles of trees (the same area as the City of Buffalo) to "fix" or
remove the carbon in 200,000 tons of carbon dioxide out of the atmosphere.
These numbers might be 40 to 50 percent higher if not for campus energy conservation
efforts. Since the late 1970, UB has implemented hundreds of energy conservation
measures and projects, which have produced annual energy savings of over $9 million in
avoided energy costs and cumulative savings in excess of $60 million.
These projects have included (UB Green, 2003):
• Lighting retrofits.
• Building shell insulation and window improvements.
• Heating and cooling system upgrades.
• Energy efficient motors and variable speed drives for fans and pumps.
• Enhanced computer controls to regulate heating, ventilating, and air conditioning
equipment.
• Heat recovery.
• Conversion of electric space and water heating to natural gas.
• Reduced operating hours of all energy-consuming equipment.
In 1998 UB won the Association of Energy Engineers "Energy Project of the Year"
Award for a 1994-1997 $17 million comprehensive demand side management project,
which has reduced UB North Campus energy consumption by $3 million annually and
produced many other campus benefits.
12
2.2.3 Eastern Illinois University
Eastern Illinois University (Fickes, M., 2002) estimates that it has avoided several million
dollars in utility costs through the past six to 10 years. More importantly, EIU hopes to
improve its utility cost performance substantially through the next 10 years and to begin
pumping at least a portion of those cost savings into EIU budgets serving the school’s
core educational missions.
EIU structured their early efforts around a series of no-cost initiatives (such as education
programs about importance of saving energy aimed at students, faculty and staff, and
review of maintenance practices) and low-cost initiatives (such as replacing incandescent
bulbs in all desk lamps with screw-in fluorescent lamps; installing sensors on 115 soda
machines that turn the machines off when no one is around; installing showerheads that
reduced water flow from 5 gallons per minute to 2.5 gallons per minute). Low cost
programs had total investment costs of around $55,000 and have resulted in savings of
over $270,000.
Through performance contract, EIU also enlisted the help of one energy service company
(ESCO). The ESCO recommended a series of energy efficiency upgrades, which were
carried out using the $3.4 million in bond funding. The upgrades included the installation
of T-8 fluorescent lamps with electronic ballasts, compact fluorescent lighting, variable
air volume controls, variable speed fan drives, and building automation systems related to
HVAC. The ESCO guaranteed that this work would save a minimum of $553,000
annually, enough to pay off the bonds as well as the debt service. EIU found that the
actual savings have exceeded the performance guarantee in each of the contract years.
13
2.2.4 University of British Columbia
Since 1999 UBC has established the necessary institutional framework for energy
conservation and other greening programs at the University by developing sustainability
policies, strategic plans and forming a Sustainability office to implement them. With a
population of more than 50,000 students, residents, staff, and faculty living and working
on the campus, UBC annually consumes (UBC Campus Sustainability Office, 2002):
• 146 million kWh of electricity. and
• 836 million pounds of steam.
In 2002, UBC spent $18.2 million for electricity, gas, steam, water and sewer.
UBC has also established 2010 Energy Conservation Target of 30 percent reduction in
energy use intensity (measured as energy use per square meter in GJ/m²). This goal will
be partly achieved by implementation of ELECTrek and ECOTrek projects, and partly by
building new institutional buildings to the LEED Silver benchmark (a 50 percent
reduction over existing energy intensity) (UBC Campus Sustainability Office, 2004)
The ELECTrek Project was completed last year. It involved a lighting upgrade in 41
major campus buildings. It is estimated that this upgrade will result in an 11 million kWh
of electricity savings annually. Capital costs are in the order of $4 million of Canadian
dollars, and will be paid back from the resulting energy savings.
The ECOTrek Project represents the largest energy conservation project at a Canadian
University. This three year project (will be completed by the end of this year) was
financed through an Energy Performance Contract (EPC). An EPC is a unique business
arrangement where an Energy Service Company guarantees that the energy savings will
pay off the capital costs over the term of the contract. UBC feels the EPC is the best
14
vehicle to lower energy usage while minimizing financial risk (UBC Campus
Sustainability Office, 2002).
The ECOTrek Project will involve work in 80 large buildings, and numerous smaller
buildings, totaling over 6.7 million square feet over a three-year period.
Total project costs will range from $35 million to $40 million Canadian dollars, with a
10-year simple payback (UBC Campus Sustainability Office, 2003a). Through physical
upgrades and retrofits, the project is committed to annually:
• Generate savings of up to $3 million.
• Improve comfort for building occupants.
• Reduce energy use in core buildings on campus by 30 percent.
• Reduce CO2 emissions by 30,000 tons.
• Reduce water-use in core facilities by 45 percent.
2.3 Benefits of Green Buildings
As we have seen in the last example, the University of British Columbia expects to
achieve its 30 percent energy reduction target. UBC will achieve this partly from
committing to green building design. UBC has realized that an inefficiently designed new
building is either a great retrofit candidate or an energy headache for the next 50 or 100
years. Although retrofitting buildings to improve efficiency makes sense, the retrofit is
costly and time consuming. New buildings should be, instead, designed right and energy
efficient in the first place so that the need for retrofitting can be minimized (Simpson W.,
2003).
15
The state of California established the Sustainable Building Task Force, which
commissioned a report to assess the costs and financial benefits of constructing green
buildings in California. Based on a review of the construction costs of 33 green buildings
in the United States, the report (published in October 2003) found that a minimal upfront
investment of about 2 percent of construction costs typically yields life cycle savings of
over 10 times the initial investment. For example, an initial upfront investment of up to
$100,000 to incorporate green building features into a $5 million project would result in a
savings of at least $1 million over the life of the building, assumed conservatively to be
20 years (Kats, G., et. al., 2003).
In addition to the significant financial and environmental benefits of lower energy and
water use, there are compelling additional benefits, including:
Significantly reduced operating costs — operating costs for green buildings can be less
than half those in conventionally designed buildings.
Improved indoor air and light quality saves money and benefits the health, morale, and
productivity of employees (UBC Campus Sustainability Office, 2002).
These benefits, such as energy savings, should be looked at through a life cycle cost
methodology, not just evaluated in terms of upfront costs. From a life cycle savings
standpoint, savings resulting from investment in sustainable design and construction
dramatically exceed any additional upfront costs (Kats, G., et. al., 2003).
16
CHAPTER III
COST-BENEFIT ANALYSIS
3.1 Introduction
Cost–benefit analysis (CBA) is the applied tool of welfare economics that has started out
as an attempt to more systematically incorporate economic information in public
investment decisions involving water resources. CBA is used for project evaluation and
regulatory review (Navrud, S., and Pruckner, G. J., 1997). The idea of this economic
accounting originated in 1848 with Jules Dupuit, a French engineer. But the practical
development of CBA came as a result of the requirement provided by the Federal
Navigation Act of 1936. This act required that the U.S. Corps of Engineers carry out
projects for the improvement of the waterway system when the total benefits of a project
to whomsoever they accrue exceed the costs of that project. Thus, the Corps of Engineers
had created systematic methods for measuring such benefits and costs. It wasn't until
about twenty years later in the 1950's that economists tried to provide a rigorous,
consistent set of methods for measuring benefits and costs and deciding whether a project
is worthwhile. Some technical issues of CBA, like choice of discount rate, have not been
wholly resolved even now but the fundamentals are well established (Watkins, T., 2002).
Cost-benefit analysis may be viewed at three levels (Gilpin, A. 1999):
17
1. A financial statement of the costs and benefits of a private investment, the
findings indicating the expected returns on capital invested.
2. An assessment that takes into account external costs and benefits that may be
ignored by the private investor but be of high importance to local community.
3. A broad assessment of the implications for the economy as a whole.
Cost-benefit analysis imposes an accounting framework that prescribes classes of benefits
and costs to consider, means to measure them, and approaches for aggregating them. It
measures the economic efficiency of the proposed policy or project. When all else is
equal more efficient projects should be chosen over less efficient ones (Bjornstad, D.,
2003)
3.2 Characteristics and Principles of Cost-benefit Analysis
Strengths of Cost-Benefit Analysis (Kopp, R.J., et. al., 1997):
• Transparency: The results of a well-executed CBA can be clearly linked to the
assumptions, theory, methods, and procedures used in it.
• Ignorance Revelation: CBA requires information regarding the effects that a
policy can have on social welfare and provides the analyst with a template for
collecting and organizing that information. The template character of CBA permits
the decision-maker to determine the adequacy of the information collected and see
important information is missing.
• Comparability: CBA attempts to capture in a single index all the features of a
policy decision that affect the well-being of society. The single-metric approach
permits the comparison of policies that affect different attributes of well-being
18
differently, that is, it permits the decision-maker to compare "apples" and "oranges"
on the basis of a single attribute (the index of social welfare) common to both.
Critics of CBA usually raise questions about the assumption that individual well-being
can be characterized in terms of preference satisfaction, the assumption that aggregate
social well-being can be expressed as an aggregation (usually just a simple summation)
of individual social welfare, and the empirical problems encountered in quantifying
economic value (especially of environmental benefits) and aggregating measures of
individual welfare.
Principles of Cost Benefit Analysis (Watkins, T., 2002):
• There must be a common unit of measurement.
• CBA valuations should represent consumers or producers valuations as revealed
by their actual behavior.
• Benefits are usually measured by market choices.
• Gross benefit of an increase in consumption is an area under the demand curve.
• Some measurements of benefits require the valuation of human life.
• The analysis of a project should involve a with versus without comparison.
• Cost-benefit analysis involves a particular study area.
• Double counting of benefits or costs must be avoided.
A properly constructed cost-benefit analysis will attempt to measure the change in
economic welfare associated with all costs and all benefits uniquely generated by a
project. Bjornstad, D., (2003) has categorized the benefits into one of the following three
categories:
19
1. Marketed Benefits and Costs
Marketed benefits, also referred to as private benefits, are measured as the sum of
willingness to pay by consumers for the new quantity of product produced by the project
being evaluated. The private costs associated with the project, unlike the benefits, are
typically measured at market prices.
2. Non-Marketed Direct Benefits and Costs
A large number of natural and environmental resources are consumed directly, but are not
purchased in markets. Examples include fishing in a mountain stream, enjoying a
panoramic view, living in a community or neighborhood with clean (or dirty) air, or
working in an occupation that provides opportunities to enjoy increased (or decreased)
health. A statistical tool called hedonic analysis can be used to estimate these wage
differentials. In other cases, a travel cost approach is used to infer willingness to pay for
an environmental amenity
3. Non-Marketed Indirect Benefits and Costs
Non-marketed indirect benefits and costs arise not because of direct use of a resource, but
rather because individuals place value on the "existence" of the resources. For example,
many people have never seen the redwood forests, but have willingness to pay to see
them preserved. The most commonly applied approach is contingent valuation analysis
wherein a hypothetical, or "contingent," choice is made that is designed to reveal an
individual's willingness to pay.
20
3.3 Analyzing Benefits
At its roots, benefits analysis develops monetary values to inform the policy making
process. These values are important because they allow decision makers to directly
compare costs and benefits using the same measure (i.e., dollars).
Economists define benefits by focusing on measures of individual satisfaction or well-
being, referred to as measures of welfare or utility. Economic theory assumes that
individuals can maintain the same level of utility while trading-off different "bundles" of
goods, services, and money. The tradeoffs individuals make reveal information about the
value they place on these goods and services.
The willingness to trade off compensation for goods or services can be measured either as
willingness to pay (WTP) or as willingness to accept compensation (WTA). Economists
generally express WTP and WTA in monetary terms (EPA, 2000).
3.3.1 Energy Conservation Paradigm vs. Economics Paradigm
Different methodologies are used in economics paradigm and energy conservation
paradigm for measuring the benefits of energy conservation programs at social level.
In energy conservation paradigm costs and benefits are measured in terms of saving
energy, using technology cost data. The benefits of energy conservation programs are
defined as energy costs saved. The dollar value of energy saved is calculated as the
present value of the reduction in energy costs (Sutherland, R. J., 2000).
21
On the other hand as it was explained earlier, in standard cost benefit framework benefits
from projects are defined as the value that consumers would place on a project, and they
are measured as the sum of willingness to pay by consumers for energy saving programs.
Energy costs saved is the measure of benefits of energy conservation programs; this
benefit is estimated as the present value of future reductions in energy costs. The
willingness to pay for an improved market outcome, such as environmental quality, is the
standard economics measure of benefits (Sutherland, R. J., 2000).
3.4 Key Technical Considerations:
3.4.1 Cost-Benefit Analysis and Discounting
Any project that is considered for implementation, be it private investment or new public
policy will generate costs and benefits over period of time, with often costs occurring
right at the beginning of the project and benefits following later, sometimes even years
later. This represents a problem for cost-benefit analysis since value of today’s dollar is
not the same as value of one dollar ten years from now. Cost-benefit analysis deals with
this problem by discounting costs and benefits in each future time period and summing
them to arrive at a present value (Bjornstad, D., 2003).
Time discounting is accomplished by multiplying the future values of a policy's effects
by discount factors that reflect both the amount of time between the present and the point
at which these events occur and the degree to which current consumption is more highly
valued than future consumption (EPA, 2000).
22
While the concept of discounting is fairly simple, the choice of the discount rate is one of
the most contentious and controversial aspects of cost-benefit analysis (Bjornstad, D.,
2003). Discounting can substantially affect the present value of net benefits estimates for
public policies when there is a significant difference in the timing of costs and benefits.
For example, if the costs of a policy are incurred today, they are not discounted at all. But
if the benefits will occur 30 years from now, the present value of the benefits, and, hence,
the net present value of the policy's effects depends critically on the discount rate used
(EPA, 2000). In any case, higher interest rates will lead to fewer projects having positive
net present values than lower ones (Bjornstad, D., 2003).
The question of discount rate choice is still open so that in the final analysis the choice of
a rate is fairly arbitrary (EPA, 2000) representing the analyst’s beliefs and assumptions.
Analysts performing cost-benefit analysis of public policy in the U.S. have to follow the
White House’s Office of Management and Budget guidance on discounting that currently
recommends discounting using a rate of seven percent, an estimate of the average real
pre-tax rate of return generated by private sector investments (and performing sensitivity
analysis with discount rate of 5 and 9 percent), while based on historical rates of return
on relatively risk-free investments, adjusted for taxes and inflation, a consumption rate of
interest is measured at two to three percent (EPA, 2000).
3.4.2 Dealing with Uncertainty
There is uncertainty in every variable estimated, including the most important categories
of costs and benefits. For these reasons, it is important that a cost-benefit analysis does
not present a single number as the sole estimate of net present values. Rather sensitivity
23
analysis should be conducted to illustrate how the results change with different analytical
choices and with variation in the uncertain levels of key costs and benefits (Bjornstad, D.,
2003).
Sensitivity analysis is a method for analyzing uncertainty by changing input variables and
observing the sensitivity of the result. For example, if a positive present value is
calculated for a range of discount rates, the analyst can conclude that uncertainty over
which discount rate to use does not factor heavily in the analysis (Bjornstad, D., 2003).
3.4.3 Methods of Valuation of the Project
Once estimates of benefits and costs associated with a project have been identified and
estimated, they must be analyzed to determine the value of the project. This value is
derived from the net benefits, expressed usually in monetary terms, the project is
expected to generate in the future. The goal of the evaluation process is to ensure that,
from a number of alternative choices, the project or set of projects chosen generates the
greatest economic value to society (Bjornstad, D., 2003).
Any chosen method should meet the following criteria (Bjornstad, D., 2003):
• Incorporate the value of time.
• Reflect all future cost-benefit flows.
• Incorporate risk into the calculation of the value.
The Simple and Discounted Payback method simply calculates how many periods into
the future it takes for a project to repay the initial investment. Since the costs and benefits
continue to occur even after the investment is repaid this method fails to account for all
cost and benefit flows. Further, the simple payback method does not take into
24
consideration the time value of money. Finally, risk of investment is not considered
(Bjornstad, D., 2003).
The Internal Rate of Return (IRR) is a method for determining value that does not
depend on the determination of a discount rate and that expresses value in terms of a
percentage. Essentially, the method requires the calculation of a discount rate such that
the present value of costs minus the present value of benefits equals zero.
To calculate the IRR it is necessary to find the discount rate that would equate the initial
investment with the future cost-benefit flows. To determine whether or not project C is a
winner, the calculated IRR must be compared to a minimum acceptable rate of return that
should reflect the time value of money, risk, etc. (for example at Penn State, an
approximately 7 percent rate of return is expected on long-term investments) (Pearce, J.
M., and Uhl, C. F., 2003).
The problem with IRR is that any project that has relatively large positive cost-benefit
flows early in its life will generate a relatively large IRR. This means that the ranking of
projects will depend as much on their relative size and the timing of their cost-benefit
flows as it will on the actual cost-benefit flows, while the ranking of projects should only
depend on actual flows (Bjornstad, D., 2003).
The Net Present Value method accounts for the time value of money through
discounting. It also considers all of the expected future cost-benefit flows. Further, the
discount rate can be adjusted on a project-by-project basis to reflect the inherent risk of
each. It yields one value that is easily interpreted. If the value is positive, the project
yields benefits that exceed its costs. If the value is negative, costs exceed benefits
(Sometimes benefits and costs are discounted separately and placed in ratio form. In this
25
case, a benefit-cost ratio greater than one implies that the net present value is positive)
(Bjornstad, D., 2003).
From economic perspective the way to improve the probability of implementation of
large-scale conservation measures is to shift from simple payback method, which is
commonly used for project evaluation, to life cycle evaluation.
Even though the project might be unlikely to be implemented if it has a longer payback,
life cycle analysis may show that it still makes excellent financial sense —given its
projected savings over the life of the equipment being installed as well as its quantifiable
maintenance savings, capital improvement, and other benefits (Simpson W., 2001).
While not as easy to calculate as the payback method, NPV is computationally easier
than the IRR. Finally, NPV provides a simple basis upon which to accept or reject
projects and to compare across projects (Bjornstad, D., 2003). Because of its advantages
Net Present Value is used in cost-benefit analysis to measure project’s cost and benefits.
In formal terms, the net present value of a projected current and future benefits and costs
is found by multiplying the benefits and costs in each year by a time dependent weight,
dt, and adding all of the weighted values as follows (EPA, 2000):
NPV = NB0 + d1NB1 + d2NB2 + ... + dnNBn
NBt is the net difference between benefits and costs (Bt-Ct) that accrue at the end of
period, t, and the discounting weights are given by:
dt = l/(l+r)t
where r is the discount rate and n is the final period in the future in which the policy's
effects are felt.
26
To account for inflation, either real or nominal values may be used, as long as they are
used consistently. In other words, nominal costs and benefits require nominal discount
rates, and real costs and benefits require real discount rates. Moreover, same discount rate
has to be used for both benefits and costs (EPA, 2000).
3.5 Measuring the Externalities in Energy Production
Producing energy and at universities the major part of this is in the form of electricity,
places costs on society. Some of costs are reflected in price that is charged to consumers,
but some costs, especially those resulting from the undesirable effects on the environment
and human health, are considered ‘externalities’. Even though they cause economic loses
(like health problems), there are not usually reflected in the market price. External costs
(or benefits) result from unintended byproduct of an economic activity that accrue to
someone other than the parties involved in the activity. Most of these externalities result
from combustion of fossil fuels, which accounts for nearly 70 percent of the total
electricity generated in the United States (EIA, 1995).
Externalities attributable to electric power generation have been classified by EIA (1995)
in the following categories:
• Air pollutants including sulfur dioxide, nitrogen oxides, particulates, and heavy
metals with impacts on human health, flora and fauna, building materials, and on
other social assets like recreation and visibility;
• Greenhouse gases including carbon dioxide, methane, and chlorofluorocarbons
suspected of contributing to global climate change and thus to potential impacts
on agriculture and human health;
27
• Water use and water quality affected by electricity production, principally
through thermal pollution or hydroelectric projects that affect aquatic populations;
• Land use values affected by power plant sitings and by waste disposal
including solid, liquid, and nuclear wastes.
Upstream externalities for coal include costs of acid mine drainage and from unreclaimed
surface mine. Oil and natural gas externalities involve issues associated with drilling,
pipelines, and spills. Downstream externalities are associated with landfills/ ash disposal,
climate change (or global warming potential), acid rain, transmission lines
(electromagnetic fields), and siting of power plant.
According to neo-classical welfare economics, external costs have to be internalized, i.e.
added to the price of electricity, to achieve a full picture of the consumption of scarce
resources (Voss, A., 2001). In the last decade, especially, there have been a number of
studies trying to fully measure the external costs of energy production. The effects of
energy occur at all stages of the fuel cycle: production, refining/processing,
transformation and conversion, transportation and distribution and consumer
usage/disposal. The impact is dependent on the source of energy and its respective usage.
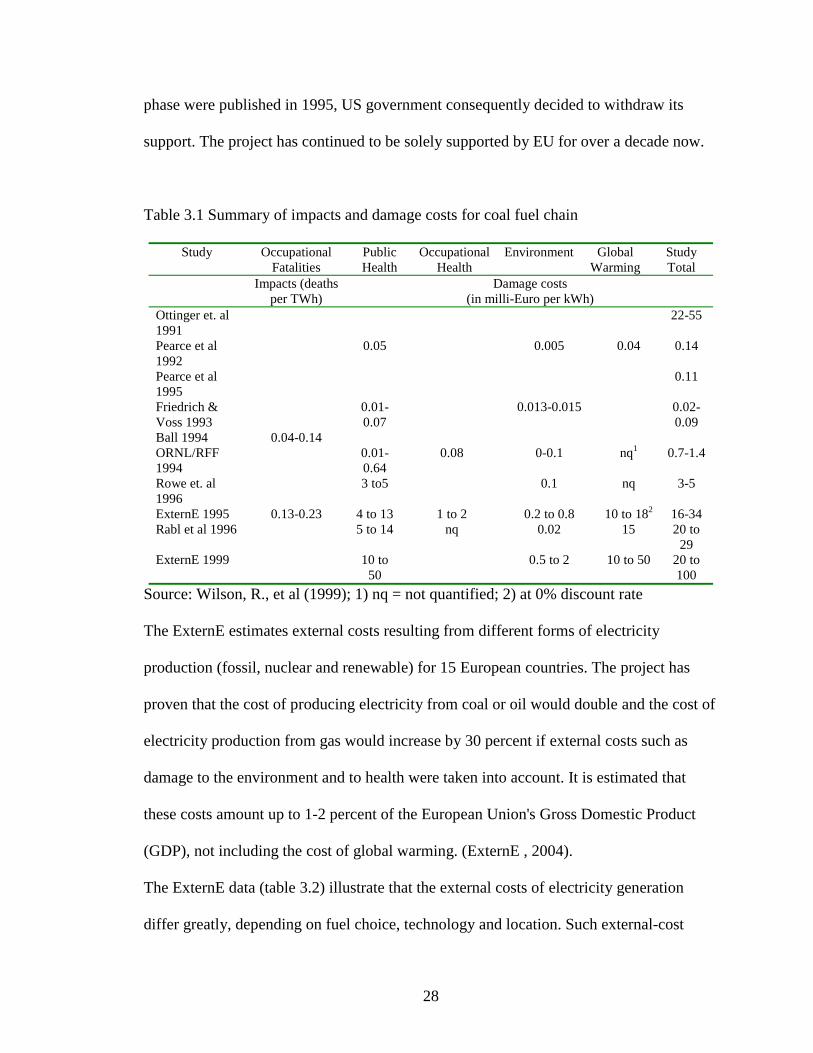
Since the studies have used different methodologies and assumptions their results vary
greatly (see Table 3.1. for examples of studies measuring externalities caused by coal fuel
chain)
The most extensive study on determining the monetary value of energy production
external costs are conducted in the European Union under a project titled ExternE.
ExternE started in early 1990’s as joint EU-USA program, but after the results of the first
28
phase were published in 1995, US government consequently decided to withdraw its
support. The project has continued to be solely supported by EU for over a decade now.
Table 3.1 Summary of impacts and damage costs for coal fuel chain
Study Occupational Fatalities
Public Health
Occupational Health
Environment Global Warming
Study Total
Impacts (deaths per TWh)
Damage costs (in milli-Euro per kWh)
Ottinger et. al 1991
22-55
Pearce et al 1992
0.05 0.005 0.04 0.14
Pearce et al 1995
0.11
Friedrich & Voss 1993
0.01-0.07
0.013-0.015 0.02-0.09
Ball 1994 0.04-0.14 ORNL/RFF 1994
0.01-0.64
0.08 0-0.1 nq1 0.7-1.4
Rowe et. al 1996
3 to5 0.1 nq 3-5
ExternE 1995 0.13-0.23 4 to 13 1 to 2 0.2 to 0.8 10 to 182 16-34 Rabl et al 1996 5 to 14 nq 0.02 15 20 to
29 ExternE 1999 10 to
50 0.5 to 2 10 to 50 20 to
100 Source: Wilson, R., et al (1999); 1) nq = not quantified; 2) at 0% discount rate
The ExternE estimates external costs resulting from different forms of electricity
production (fossil, nuclear and renewable) for 15 European countries. The project has
proven that the cost of producing electricity from coal or oil would double and the cost of
electricity production from gas would increase by 30 percent if external costs such as
damage to the environment and to health were taken into account. It is estimated that
these costs amount up to 1-2 percent of the European Union's Gross Domestic Product
(GDP), not including the cost of global warming. (ExternE , 2004).
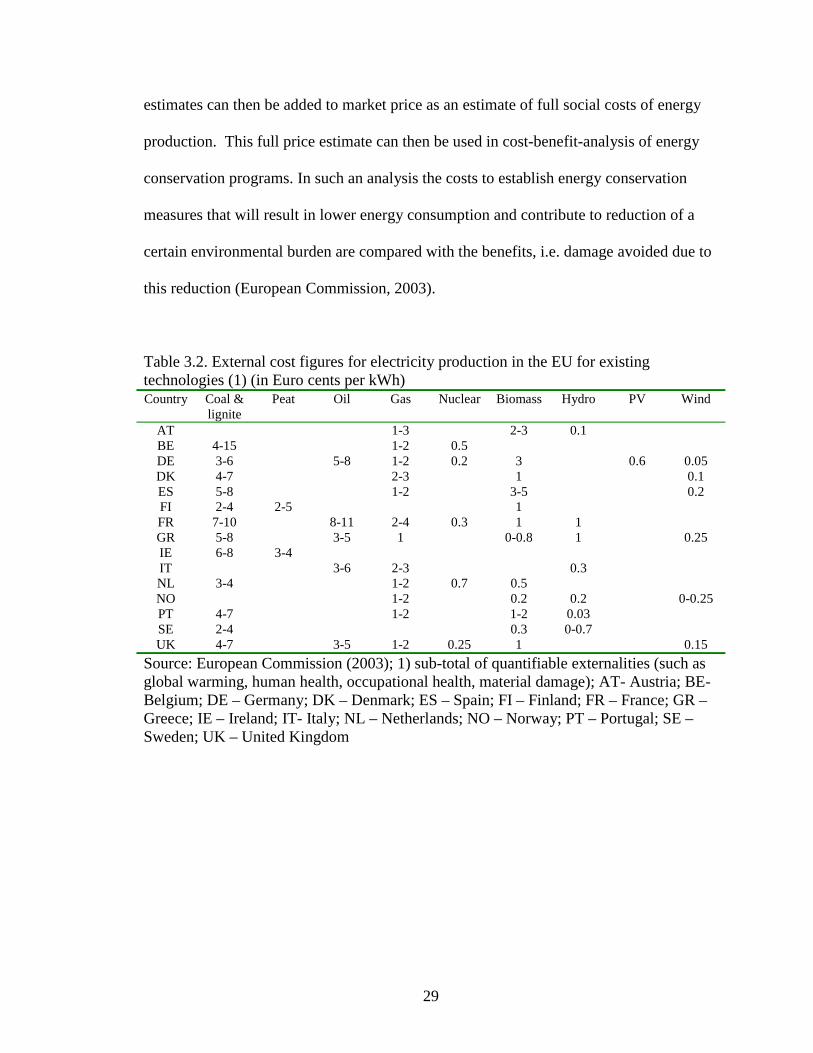
The ExternE data (table 3.2) illustrate that the external costs of electricity generation
differ greatly, depending on fuel choice, technology and location. Such external-cost
29
estimates can then be added to market price as an estimate of full social costs of energy
production. This full price estimate can then be used in cost-benefit-analysis of energy
conservation programs. In such an analysis the costs to establish energy conservation
measures that will result in lower energy consumption and contribute to reduction of a
certain environmental burden are compared with the benefits, i.e. damage avoided due to
this reduction (European Commission, 2003).
Table 3.2. External cost figures for electricity production in the EU for existing technologies (1) (in Euro cents per kWh)
Country Coal & lignite
Peat Oil Gas Nuclear Biomass Hydro PV Wind
AT 1-3 2-3 0.1 BE 4-15 1-2 0.5 DE 3-6 5-8 1-2 0.2 3 0.6 0.05 DK 4-7 2-3 1 0.1 ES 5-8 1-2 3-5 0.2 FI 2-4 2-5 1 FR 7-10 8-11 2-4 0.3 1 1 GR 5-8 3-5 1 0-0.8 1 0.25 IE 6-8 3-4 IT 3-6 2-3 0.3 NL 3-4 1-2 0.7 0.5 NO 1-2 0.2 0.2 0-0.25 PT 4-7 1-2 1-2 0.03 SE 2-4 0.3 0-0.7 UK 4-7 3-5 1-2 0.25 1 0.15
Source: European Commission (2003); 1) sub-total of quantifiable externalities (such as global warming, human health, occupational health, material damage); AT- Austria; BE- Belgium; DE – Germany; DK – Denmark; ES – Spain; FI – Finland; FR – France; GR – Greece; IE – Ireland; IT- Italy; NL – Netherlands; NO – Norway; PT – Portugal; SE – Sweden; UK – United Kingdom
30
CHAPTER IV
METHODOLOGY
Before a proposed energy management program is accepted it has to overcome, what
usually turns out to be a major challenge, preconceived skepticism of decision makers
toward such programs. The barriers decision-makers are most likely to rise, which makes
it hard to, or even impossible to implement energy management programs can be
summarized as (ENERGY STAR, 2002):
1. Lack of money.
2. Lack of time or personnel to design and plan the projects because of other, higher
priorities.
3. Lack of internal expertise to implement the projects.
While the other two concerns are very important and can stall the energy management
program if they are lacking, if first concern about the lack of money is successfully
addressed, then priorities can be rearranged and existing staff can be trained if needed, or
an energy manager can be hired to lead the program.
Regarding the concern decision-makers might have about lack of money, some of the
questions and challenges they commonly raise are (ENERGY STAR, 2002):
• If it is not in this year’s budget, it simply has to wait.
• Equipment improvements must be paid from the capital budget.
31
• Paying lower interest (by floating bonds) or no interest (by delaying the project
and planning it into future budgets) saves more money and, therefore, is in the
best interest of our organization.
• Taxes or fees will have to be increased to pay for these improvements.
• Performance contracting with an energy service provider (ESP) is expensive and
unreliable.
• Tax-exempt lease-purchase agreements don’t lend themselves to energy projects
and are expensive alternative funding solutions.
The best way to address such concerns is to present the benefits (and costs) of energy
management programs in a clear and consistent way. Cost-benefit analysis is one such
method that can accomplish this.
Before performing the cost-benefit analysis of a potential energy management program
for OSU, the attempt will be made to first establish the baseline by researching and then
evaluating the present practices and accomplishments in the field of energy management
at Oklahoma State University.
The next step would be to develop the potential energy management program. Such a
proposal should be as detailed as possible, given the constraint that every university is a
unique case. What functions great in one university, might not be very useful for another.
In developing such program, experiences and lessons learned at other universities will be
combined with an evaluation of the present practices at OSU. The result, hopefully, will
be an outline of the energy management program that will be acceptable to decision-
makers at the University.
32
The main part of this thesis, the analysis of such potential program will follow. The cost-
benefit analysis will be conducted for period 2005-2015. I have chosen this period
because it allows enough time for energy management program to be established and to
start achieving cost savings, but is not too long to be seen as too distant in the future.
One of the major steps in cost-benefit analysis will be to identify all the costs and benefits
of such program, and then to evaluate and quantify them.
The issue with cost and benefits of any project is that direct costs and benefits that are
valued at market can, by their very nature, be quantified, whereas the social and
environmental costs and benefits are generally seen as external costs. Since OSU is a
public educational and research institution, and as such should have broader perspective
than private enterprise, my intention is to include, as much as possible, the social and
environmental costs- and benefits into my analysis. In order to do so, such costs will be
quantified using data from a EU project, ExterneE, which researched external costs of
electricity production and consumption for a wide range of technologies.
Summary of the steps discussed:
1. Establish the baseline – through interviews with responsible personnel from
Physical Plant and through the data available
2. Investigate the needed changes – especially with regard to support of the
administration and university policies
3. Develop a potential energy management program for OSU for next 10 years.
4. Perform an initial cost-benefit analysis. One analysis will estimate actual dollar
expenditures for OSU and a second will be for society, which will include
benefits and costs external to the OSU budget.
33
Following above steps I will test the following working hypotheses:
1. That campus wide energy conservation projects and broader energy management
systems represent an untapped area for savings at Oklahoma State University.
2. Such programs are valuable and are economically, environmentally, and socially
sound to implement and support.
3. The net present value of energy management projects is positive to both OSU and
to society. That is the benefits of proposed energy conservation program and
energy managements system are higher then the costs of running such programs.
34
CHAPTER V
FINDINGS
5.1 Energy Management Practices at Oklahoma State University
5.1.1 Oklahoma State University: An Overview
Oklahoma State University is a comprehensive, land-grant research university that
comprises OSU-Stillwater, OSU-Tulsa, OSU-Oklahoma City, OSU-Okmulgee, and the
OSU Center for Health Sciences in Tulsa. Total student population is more that 30,500
students. The largest campus and the focus of this study is in Stillwater where 21,604
students enrolled in Fall 2003. The Stillwater campus encompasses 840 acres and more
than 200 permanent buildings.
The Physical Plant is responsible for energy management at Oklahoma State University’s
Stillwater campus. In the Physical Plant’s new Strategic Plan (OSU, 2003), energy
conservation is considered one of the objectives in the effort to promote effective
utilization of facilities and financial assets. It is to be established through:
• Lower utility consumption through energy management.
• Continued vigorous pursuing of on-going lighting fixture upgrades.
• Increased use of state-of-the-art building control technologies and metering.
• Seeking better energy savings cooperation from campus community through
enhanced communications.
35
5.1.2 State of Energy Management Practice at Oklahoma State University1
The University does not have an Energy Manager or Energy Management Office. Energy
management is part of responsibilities of different departments, mainly Engineering &
Utilities Services and Maintenance & Operations departments in the Physical Plant.
The University Policy on Energy Management accepted in February 1983 is outdated,
and after reviewing the current state of energy management practice at OSU it is safe to
conclude that most of its requirements are not followed in the practice.
The University wide policy stating the minimum acceptable payback or return on
investment is not published, thus decisions on attractiveness of energy conservation
projects might not be consistent over time.
An energy audit has not been conducted in recent years. The latest audit performed in
early 1990s covered only lighting, so the benchmark situation is hard to establish.
OSU gets majority of its electricity from Oklahoma Gas and Electric Company (OG&E),
and this amount ranges 9 – 13.5 million kW/h per month. OG&E energy comes from a
mixture of coal and natural gas power plants (60 percent coal, and 40 percent natural
gas). Since Fall 2003, the University has been purchasing 139,900 kWh per month of
energy produced by wind turbines from OGE (about 1.3 percent of OSU total electricity
use). The price is 2 cents above the base rate, but there is no fuel cost adjustment, so the
final price is little more than 1 cent over the price of electricity produced by coal or
natural gas.
1 The information in this chapter is based on internal data from Physical Plant obtained through personal communication with Jeff Stewart, director of Engineering and Utilities, Ted Maxwell, Electrical foreman and Daniel Ferguson, Building Systems Group foreman
36
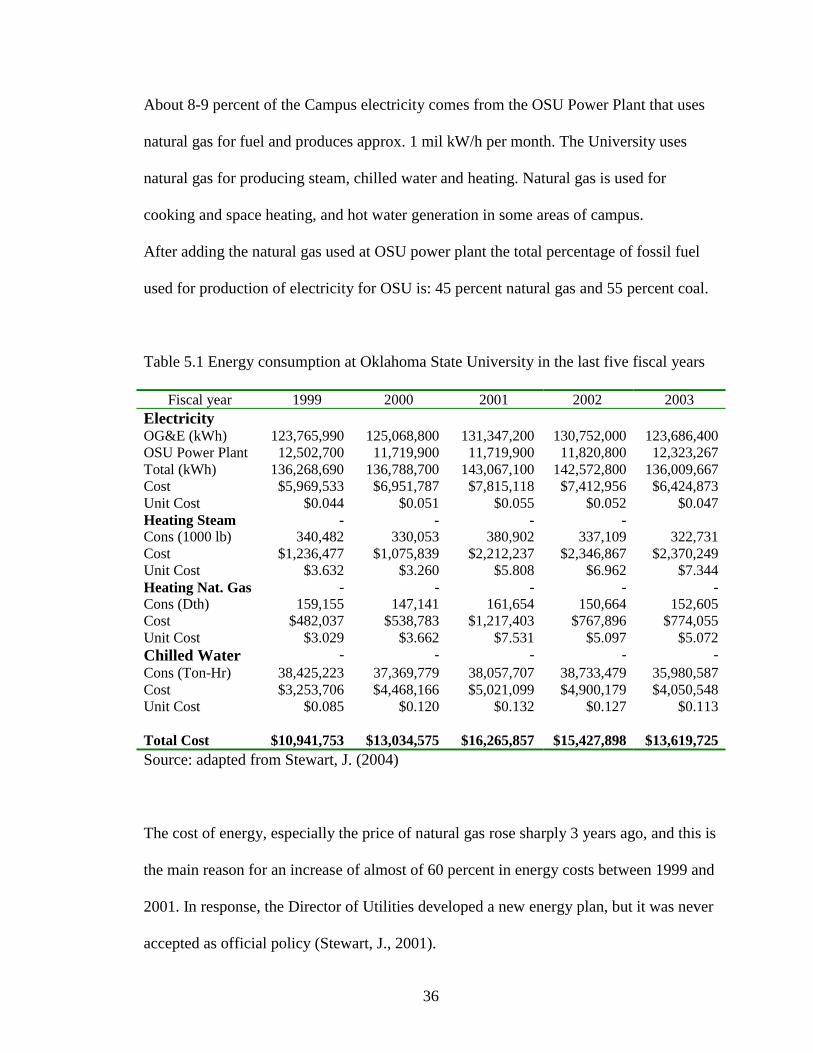
About 8-9 percent of the Campus electricity comes from the OSU Power Plant that uses
natural gas for fuel and produces approx. 1 mil kW/h per month. The University uses
natural gas for producing steam, chilled water and heating. Natural gas is used for
cooking and space heating, and hot water generation in some areas of campus.
After adding the natural gas used at OSU power plant the total percentage of fossil fuel
used for production of electricity for OSU is: 45 percent natural gas and 55 percent coal.
Table 5.1 Energy consumption at Oklahoma State University in the last five fiscal years
Fiscal year 1999 2000 2001 2002 2003 Electricity OG&E (kWh) 123,765,990 125,068,800 131,347,200 130,752,000 123,686,400 OSU Power Plant 12,502,700 11,719,900 11,719,900 11,820,800 12,323,267 Total (kWh) 136,268,690 136,788,700 143,067,100 142,572,800 136,009,667 Cost $5,969,533 $6,951,787 $7,815,118 $7,412,956 $6,424,873 Unit Cost $0.044 $0.051 $0.055 $0.052 $0.047 Heating Steam - - - - Cons (1000 lb) 340,482 330,053 380,902 337,109 322,731 Cost $1,236,477 $1,075,839 $2,212,237 $2,346,867 $2,370,249 Unit Cost $3.632 $3.260 $5.808 $6.962 $7.344 Heating Nat. Gas - - - - -Cons (Dth) 159,155 147,141 161,654 150,664 152,605 Cost $482,037 $538,783 $1,217,403 $767,896 $774,055 Unit Cost $3.029 $3.662 $7.531 $5.097 $5.072 Chilled Water - - - - -Cons (Ton-Hr) 38,425,223 37,369,779 38,057,707 38,733,479 35,980,587 Cost $3,253,706 $4,468,166 $5,021,099 $4,900,179 $4,050,548 Unit Cost $0.085 $0.120 $0.132 $0.127 $0.113 Total Cost $10,941,753 $13,034,575 $16,265,857 $15,427,898 $13,619,725 Source: adapted from Stewart, J. (2004)
The cost of energy, especially the price of natural gas rose sharply 3 years ago, and this is
the main reason for an increase of almost of 60 percent in energy costs between 1999 and
2001. In response, the Director of Utilities developed a new energy plan, but it was never
accepted as official policy (Stewart, J., 2001).
37
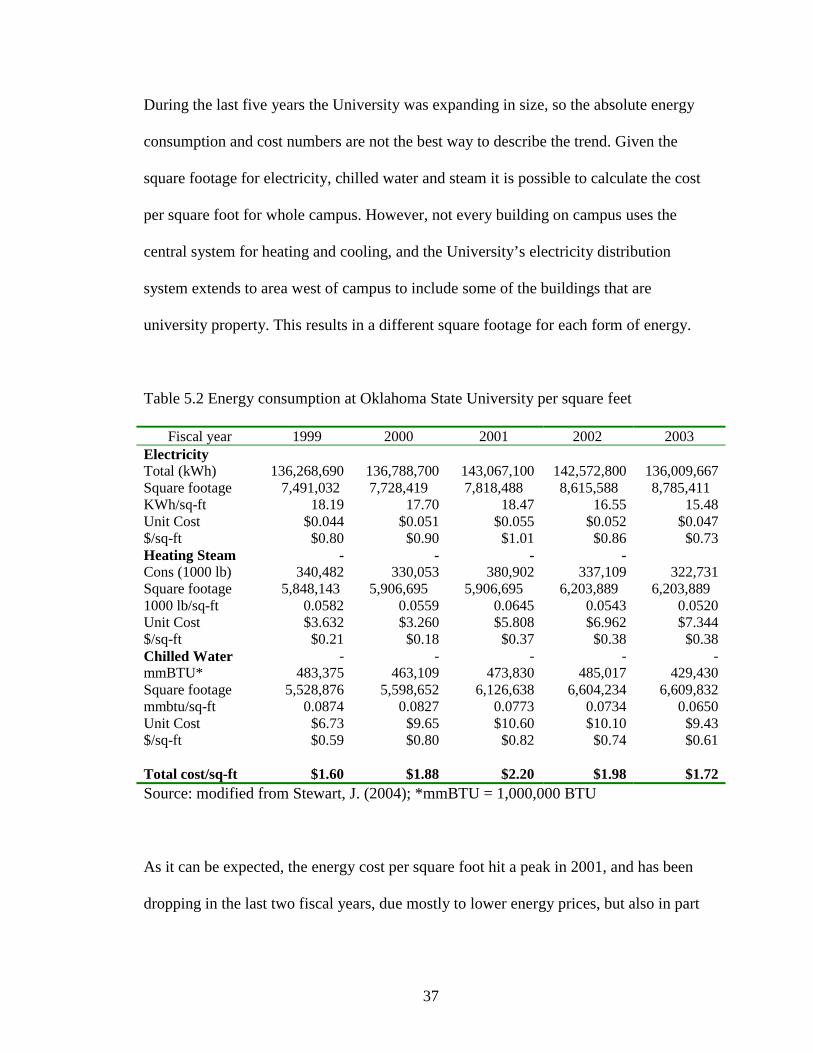
During the last five years the University was expanding in size, so the absolute energy
consumption and cost numbers are not the best way to describe the trend. Given the
square footage for electricity, chilled water and steam it is possible to calculate the cost
per square foot for whole campus. However, not every building on campus uses the
central system for heating and cooling, and the University’s electricity distribution
system extends to area west of campus to include some of the buildings that are
university property. This results in a different square footage for each form of energy.
Table 5.2 Energy consumption at Oklahoma State University per square feet
Fiscal year 1999 2000 2001 2002 2003 Electricity Total (kWh) 136,268,690 136,788,700 143,067,100 142,572,800 136,009,667 Square footage 7,491,032 7,728,419 7,818,488 8,615,588 8,785,411 KWh/sq-ft 18.19 17.70 18.47 16.55 15.48 Unit Cost $0.044 $0.051 $0.055 $0.052 $0.047 $/sq-ft $0.80 $0.90 $1.01 $0.86 $0.73 Heating Steam - - - - Cons (1000 lb) 340,482 330,053 380,902 337,109 322,731 Square footage 5,848,143 5,906,695 5,906,695 6,203,889 6,203,889 1000 lb/sq-ft 0.0582 0.0559 0.0645 0.0543 0.0520 Unit Cost $3.632 $3.260 $5.808 $6.962 $7.344 $/sq-ft $0.21 $0.18 $0.37 $0.38 $0.38 Chilled Water - - - - -mmBTU* 483,375 463,109 473,830 485,017 429,430 Square footage 5,528,876 5,598,652 6,126,638 6,604,234 6,609,832 mmbtu/sq-ft 0.0874 0.0827 0.0773 0.0734 0.0650 Unit Cost $6.73 $9.65 $10.60 $10.10 $9.43 $/sq-ft $0.59 $0.80 $0.82 $0.74 $0.61 Total cost/sq-ft $1.60 $1.88 $2.20 $1.98 $1.72 Source: modified from Stewart, J. (2004); *mmBTU = 1,000,000 BTU
As it can be expected, the energy cost per square foot hit a peak in 2001, and has been
dropping in the last two fiscal years, due mostly to lower energy prices, but also in part
38
because of the energy efficiency programs being implemented at physical plant in the last
couple of years. Those projects are going to be discussed in following pages.
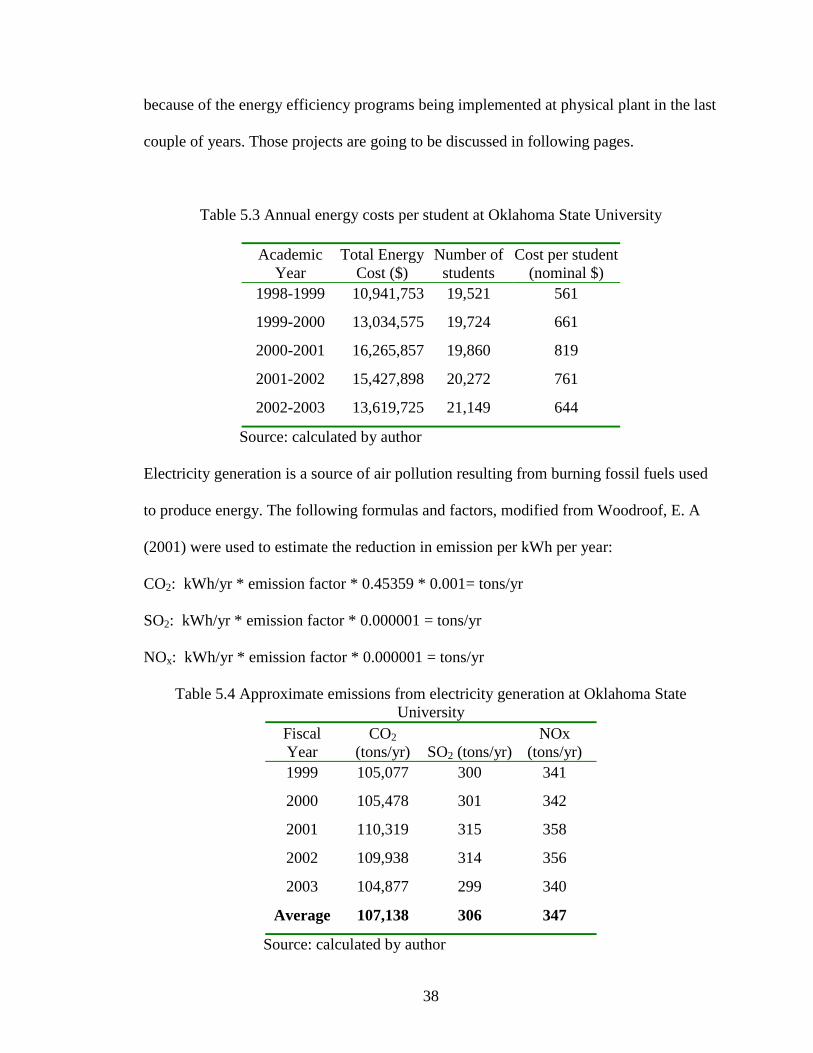
Table 5.3 Annual energy costs per student at Oklahoma State University
Academic Year
Total Energy Cost ($)
Number of students
Cost per student (nominal $)
1998-1999 10,941,753 19,521 561
1999-2000 13,034,575 19,724 661
2000-2001 16,265,857 19,860 819
2001-2002 15,427,898 20,272 761
2002-2003 13,619,725 21,149 644
Source: calculated by author
Electricity generation is a source of air pollution resulting from burning fossil fuels used
to produce energy. The following formulas and factors, modified from Woodroof, E. A
(2001) were used to estimate the reduction in emission per kWh per year:
CO2: kWh/yr * emission factor * 0.45359 * 0.001= tons/yr
SO2: kWh/yr * emission factor * 0.000001 = tons/yr
NOx: kWh/yr * emission factor * 0.000001 = tons/yr
Table 5.4 Approximate emissions from electricity generation at Oklahoma State University
Fiscal Year
CO2 (tons/yr) SO2 (tons/yr)
NOx (tons/yr)
1999 105,077 300 341
2000 105,478 301 342
2001 110,319 315 358
2002 109,938 314 356
2003 104,877 299 340
Average 107,138 306 347
Source: calculated by author
39
As shown in table 5.4, OSU is responsible for average annual emissions of 107,138 tons
of CO2, 306 tons of SO2, and 347 tons of NOx (not including emissions from natural gas
burned at campus for steam, chilled water or heating). To calculate these emissions,
aggregate data for EPA region 6 were used. Because of this, the results are only
approximations and serve as an illustration.
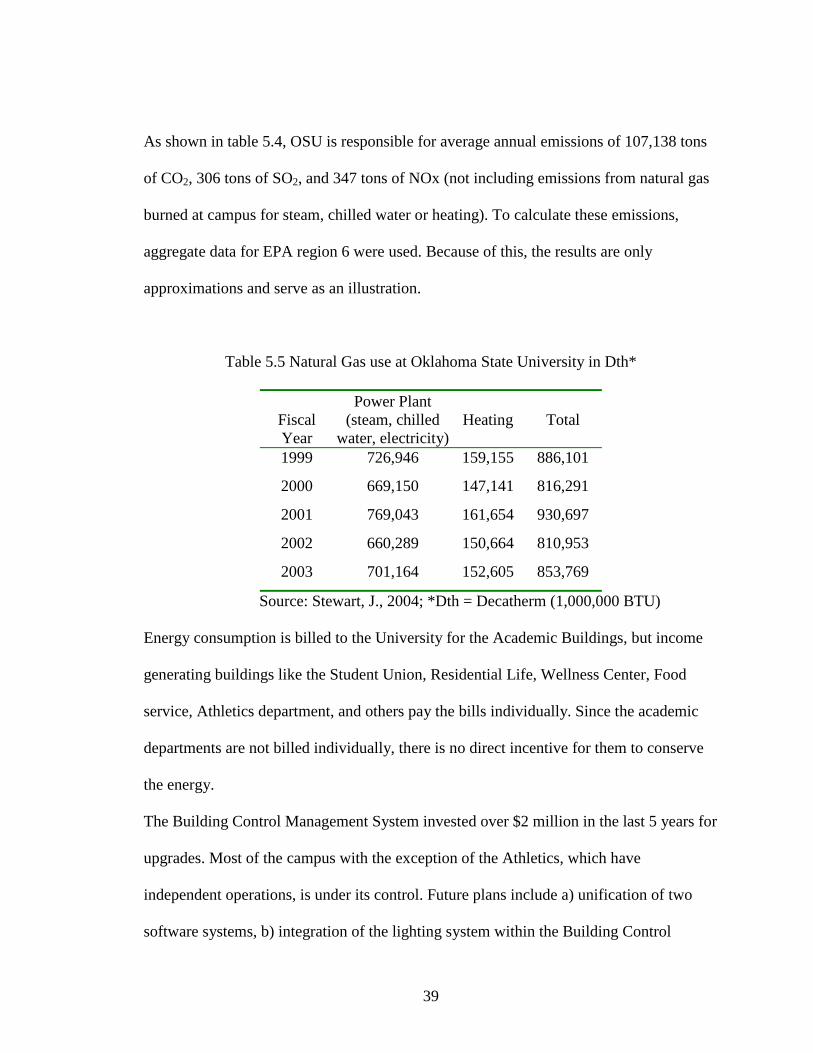
Table 5.5 Natural Gas use at Oklahoma State University in Dth*
Fiscal Year
Power Plant (steam, chilled
water, electricity)Heating Total
1999 726,946 159,155 886,101
2000 669,150 147,141 816,291
2001 769,043 161,654 930,697
2002 660,289 150,664 810,953
2003 701,164 152,605 853,769
Source: Stewart, J., 2004; *Dth = Decatherm (1,000,000 BTU)
Energy consumption is billed to the University for the Academic Buildings, but income
generating buildings like the Student Union, Residential Life, Wellness Center, Food
service, Athletics department, and others pay the bills individually. Since the academic
departments are not billed individually, there is no direct incentive for them to conserve
the energy.
The Building Control Management System invested over $2 million in the last 5 years for
upgrades. Most of the campus with the exception of the Athletics, which have
independent operations, is under its control. Future plans include a) unification of two
software systems, b) integration of the lighting system within the Building Control
40
System, c) further increase in the safety and comfort of building users, and d) more
efficient use of buildings.
The University Policy on Energy Management requires the heating season temperature in
buildings to be 68° F and the cooling season temperature 78° F, but in practice because of
comfort, the heating season temperature is usually set to 70°-72° F and the cooling season
temperatures are usually set 72°-73° F.
Normally, air-conditioning is turned on after May first and is turned off after October
first each year. Heating is provided from November through March each year. The exact
day on which air-conditioning/heating will be started and stopped is dependent upon need
and weather conditions.
The problem with the old heating, ventilation, and air conditioning (HVAC) systems is
usually one large unit covers an entire floor of a building, and is regulated from one
place. This means the whole floor needs to be cooled or heated to accommodate one or
two persons (high per occupant costs, late at night and during weekends). New buildings
and major renovations include state-of-the-art HVAC systems which are more energy
efficient.
The old chiller plant has capacity of 12,000 tons. In 2000, a new, more efficient chiller
plant was finished. The West Chilled Water Plant provides 4,000 additional tons of
cooling capacity to handle campus loads. The facility will eventually have 16,000 tons of
capacity. A cost-benefit analysis was not used to justify the project.
This year the Physical Plant will start with an upgrade on steam boiler controls (steam is
used to heat campus, drive the power plant turbines and one chiller). This will enable
41
more efficient use and a precise control, resulting in less gas will be used to produce the
same amount of steam, and thus emissions and costs will be lower.
Lighting represents the major part of electricity usage. The Physical Plant started
retrofitting T-12 fluorescent lamps with T-8 fluorescent lamps (T-8 fluorescent lamps are
smaller, more energy efficient, have a longer life, and require less maintenance). Also T-
8 lamps use electronic ballast so there is no heating from magnetic ballasts as was the
case for the T-12 lamps. The retrofit project started three years ago, but there are over
600,000 lights2 on this campus. If the University continues to finance this project at the
rate of $200,000-$300,000 per year, the retrofit will not be completed before 2014. Up to
April this year more than 16 percent of general university buildings have been retrofitted.
The total cost of project is estimated to be around $3.5 million.
Measurements at OSU (Maxwell, T., 2004) have shown that T-8 lamps require 25 to 30
percent less electricity than the T-12 lamps. This estimate assumes 12 hours of use per
day, and 5 days per week. Savings will increase if the lights are used longer that assumed.
This is especially case with bathrooms and hallways, where lights are rarely turned off. In
addition the electronic ballasts used with T-8 lamps have much smaller heat output
compared with magnetic ballast used with T-12 lamps. Consequently, the buildings
retrofitted with T-8 lamps use less energy for cooling. Even though, the T-8 lamps are
more expensive than T-12 lamps, the payback is slightly over 3 years at OSU. One of the
major advantages of T-8 lamps is that they have considerable longer life and better light
output. The T-12 lamp loses 40 percent of light output after 3 years, but T-8 lamp loses
only about 5 percent of light output after 5 years. Since the T-12’s average life is 2.5
2 this is an estimate based on estimated 8 mil sq-ft floor area, which multiplied with standard of 3 watt per square foot and divided by 40 watts per bulb gives above number (Maxwell, T, 2004)
42
years, and the T-8’s average life is 5 years, maintenance and relamping costs are cut in
half. The cost of labor to replace each lamp varies from $1.00 (when entire building is
relamped at one time) to $5.00 (when only one lamp is changed). Changing all 600,000
lights on campus from T-12 to T-8 lamps will save between $1.2 and $6 million in
maintenance costs over the 10-year period.
The Physical Plant is finishing a retrofit of EXIT signs from 14 W fluorescent lights to
2.2 W light-emitting diode (LED). LED lamps use about 80 percent less energy, have a
life of 25-30 years, so maintenance and energy costs are minimal. The University
apartments are retrofitted from incandescent to compact fluorescent on regular
maintenance intervals when occupants leave the apartments.
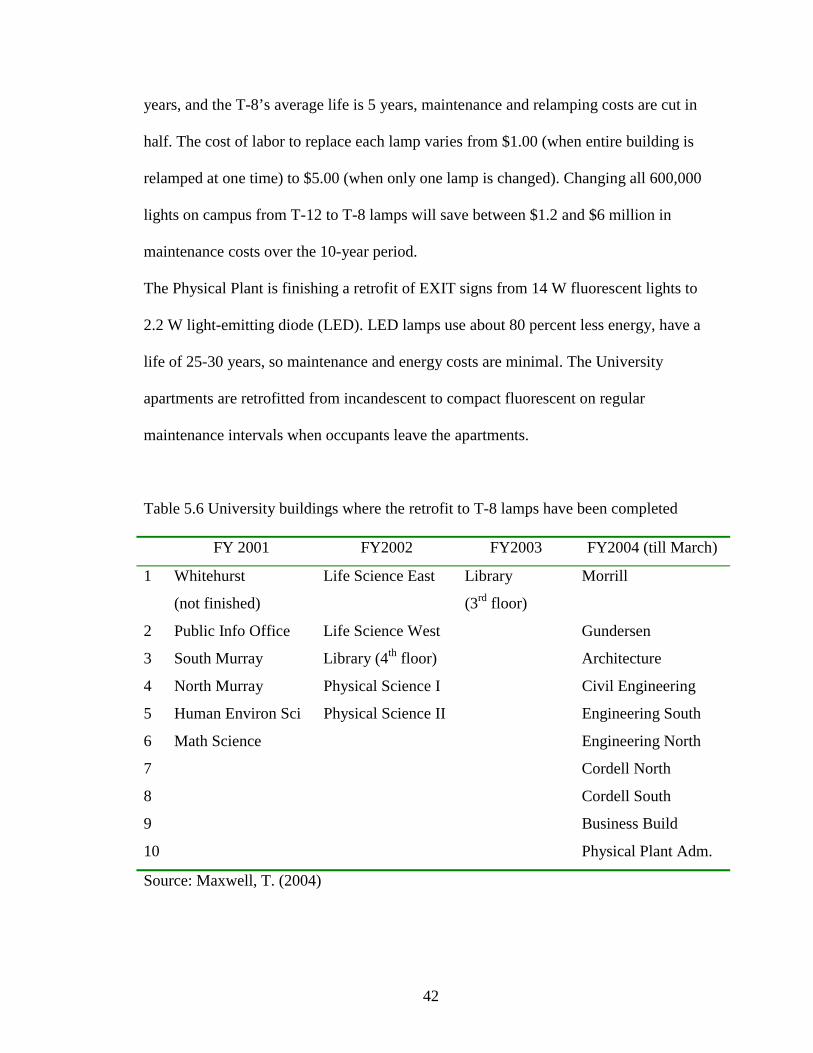
Table 5.6 University buildings where the retrofit to T-8 lamps have been completed
FY 2001 FY2002 FY2003 FY2004 (till March)
1 Whitehurst
(not finished)
Life Science East Library
(3rd floor)
Morrill
2 Public Info Office Life Science West Gundersen
3 South Murray Library (4th floor) Architecture
4 North Murray Physical Science I Civil Engineering
5 Human Environ Sci Physical Science II Engineering South
6 Math Science Engineering North
7 Cordell North
8 Cordell South
9 Business Build
10 Physical Plant Adm.
Source: Maxwell, T. (2004)
43
For a couple of years now, at the beginning of each semester 1 full-time employee and 2
part-time students go around campus and turn off the lights. At the beginning of the
program, the University had $100,000 per year in savings.
The Physical Plant does not install halogen lamps, but they are allowed for personal use.
However, the halogen lamps use a lot of energy (200-300 W) and present a fire hazard,
but this has not yet been officially recognized at OSU.
The average computer systems use a lot of energy, first directly as electrical power
(average of 150 W/h) and indirectly because of waste heat produced, additional energy is
needed for cooling of computer labs. While most computers have activated energy
savings option for monitors, there is no policy for turning off computers in offices and in
computer labs over night or when not in use.
5.2 Economic Analysis of Potential Energy Management Program
5.2.1 Introduction
The Energy Management Programs have direct costs that are easy to calculate, but for the
benefits the situation is slightly different. Net benefits of the energy management
programs can only be assessed through evaluating a string of projects and activities
performed or initiated by the energy manager. Each of those projects have their direct and
indirect costs and benefits, and by performing analysis on each of them and then adding
the net present values of the projects it is possible to indirectly assess the net contribution
of the energy manager and the energy management program and thus answer the concern
about lucrativeness of such program. Direct benefits will be calculated as a cost savings,
44
while other benefits such as improved comfort, and productivity will be noted but not
monetary expressed.
Examples of benefits of the energy management program are:
• The savings of energy costs over the ones that would have been incurred in a ‘do
nothing’ situation
• Increased occupant comfort and productivity - improved indoor air and light
quality benefits the health, morale, and productivity of faculty and students.
• Improved productivity with more efficient use of labor and skills.
• Environmental improvements (reduced greenhouse gases and other emissions,
reduced use of nonrenewable natural resources) and other social benefits of
cleaner air
• Through awareness and education programs, change of students’ attitudes towards
energy conservation. Hopefully, the important result would be that a portion of
students will implement them in their personal life after graduation
• Benefits for nation in conservation of limited resources and increased energy
security.
• Benefits for the Earth in reduction of greenhouse gases and as a contribution to
sustainable development
Evaluate Energy management programs for the period of the next ten years (2004-2014).
This particular period was chosen to give enough time for energy management program
to mature and establish itself as major contributor to cost savings with numerous
initiatives and projects, but not too long to be considered irrelevant by today’s decision-
makers.
45
It would be impossible to realistically recognize and evaluate all the projects and
initiatives the energy manager might implement during this period. In the following
pages I will attempt to evaluate only a handful of projects that will serve as an illustration
and a template for future analysis.
As always when dealing with the future, uncertainty is inherent. The analysis will be
based on a combination of past data, experience from other case studies and a number of
assumptions. To account for such uncertainty a sensitivity analysis will be performed.
A number of discount rates will be used to account for uncertainty: 3, 5, 7, and 9 percent.
The five percent discount rate is the medium one and will be used as major rate.
5.2.2 External Costs of Energy Consumption
The reasoning behind including the social costs in cost of electricity is two-fold: the
University is an educational institution, and as such it should educate the students about
the consequences of the energy production and consumption and the real costs that
society bears as a result. The second reason is that this University is a state institution and
as such is ultimately responsible for its action, to the taxpayers and the wider community.
The reduced consumption of electricity produced by the burning of fossil fuels and
increased consumption of ‘renewable’ energy results significant reduction of social costs
of energy production and consumption. Benefits of cleaner air can be felt across the
society due to lower rate of illnesses, higher productivity, better quality of life, healthier
environment, healthier food, and so on. The ultimate beneficiaries are the taxpayers and
their families that the University is accountable to.
46
However, the current state of practice is such that not all social and environmental costs
of energy consumption are included into the price of electricity. So, an attempt has been
made to include estimation of external costs of electricity production and use, by using
the ExternE data (see pages 28-29).
In order to simplify the calculations it has been assumed that for the next ten years the
Euro will be on average exactly equal to the US dollar. External costs added to the
electricity rate were conservatively chosen by taking the lower end data from table 3.2:
$0.01 per kWh for natural gas and $0.03 for coal. Since OSU gets 45 percent of its
electricity from a natural gas and 55 percent from coal, the total external costs added to
the electricity rate are $0.021/kWh. In the period of 1999-2003 the average electricity
rate (including the fuel adjustment cost and OSU power plant production) has been
$0.050 per kWh, which with the addition of external costs totals $0.071/kWh. With
inclusion of the environmental cost of using energy from fossil fuels, the rate equals the
rate for the renewable wind energy. The wind energy when compared with energy
derived from fossil fuel has negligible environmental and social costs (see table 3.2), so
one of the goals in the next ten-year period should be to increase the percent of electricity
from wind energy in order to lower the external social and environmental costs.
However, in the analysis, both rates (with and without external costs) will be used in
order to analyze the attractiveness of projects by conventional standards.
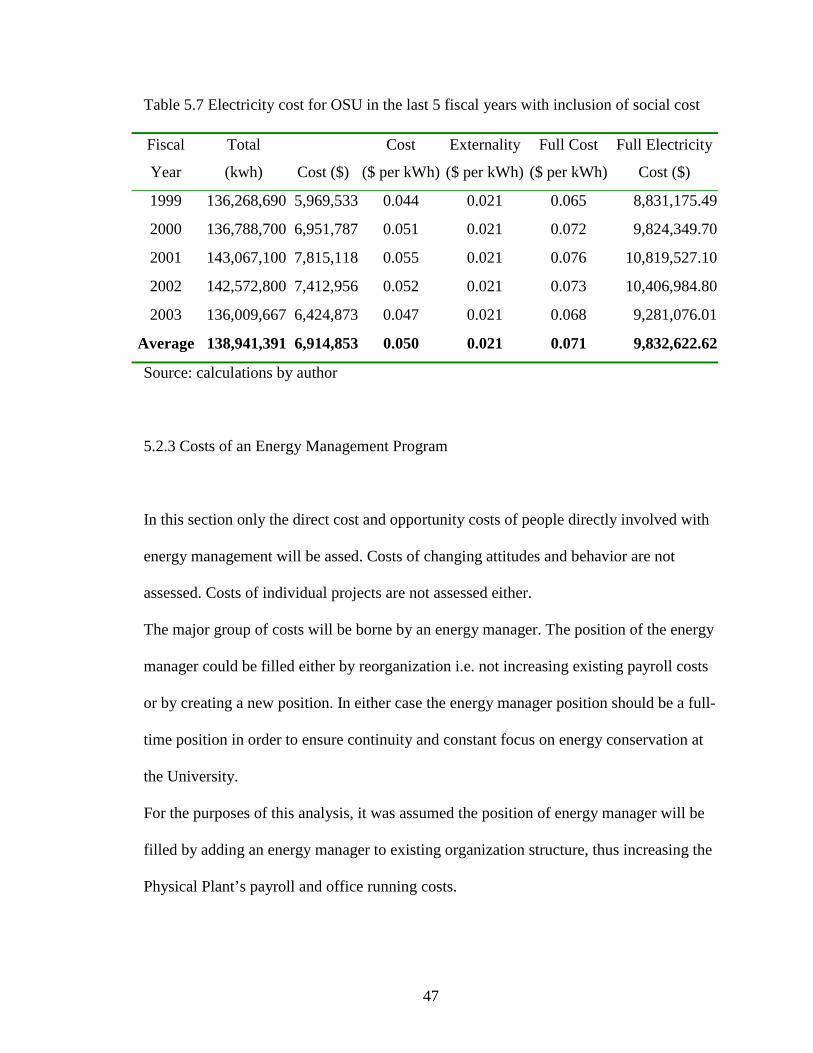
47
Table 5.7 Electricity cost for OSU in the last 5 fiscal years with inclusion of social cost
Fiscal
Year
Total
(kwh) Cost ($)
Cost
($ per kWh)
Externality
($ per kWh)
Full Cost
($ per kWh)
Full Electricity
Cost ($)
1999 136,268,690 5,969,533 0.044 0.021 0.065 8,831,175.49
2000 136,788,700 6,951,787 0.051 0.021 0.072 9,824,349.70
2001 143,067,100 7,815,118 0.055 0.021 0.076 10,819,527.10
2002 142,572,800 7,412,956 0.052 0.021 0.073 10,406,984.80
2003 136,009,667 6,424,873 0.047 0.021 0.068 9,281,076.01
Average 138,941,391 6,914,853 0.050 0.021 0.071 9,832,622.62
Source: calculations by author
5.2.3 Costs of an Energy Management Program
In this section only the direct cost and opportunity costs of people directly involved with
energy management will be assed. Costs of changing attitudes and behavior are not
assessed. Costs of individual projects are not assessed either.
The major group of costs will be borne by an energy manager. The position of the energy
manager could be filled either by reorganization i.e. not increasing existing payroll costs
or by creating a new position. In either case the energy manager position should be a full-
time position in order to ensure continuity and constant focus on energy conservation at
the University.
For the purposes of this analysis, it was assumed the position of energy manager will be
filled by adding an energy manager to existing organization structure, thus increasing the
Physical Plant’s payroll and office running costs.
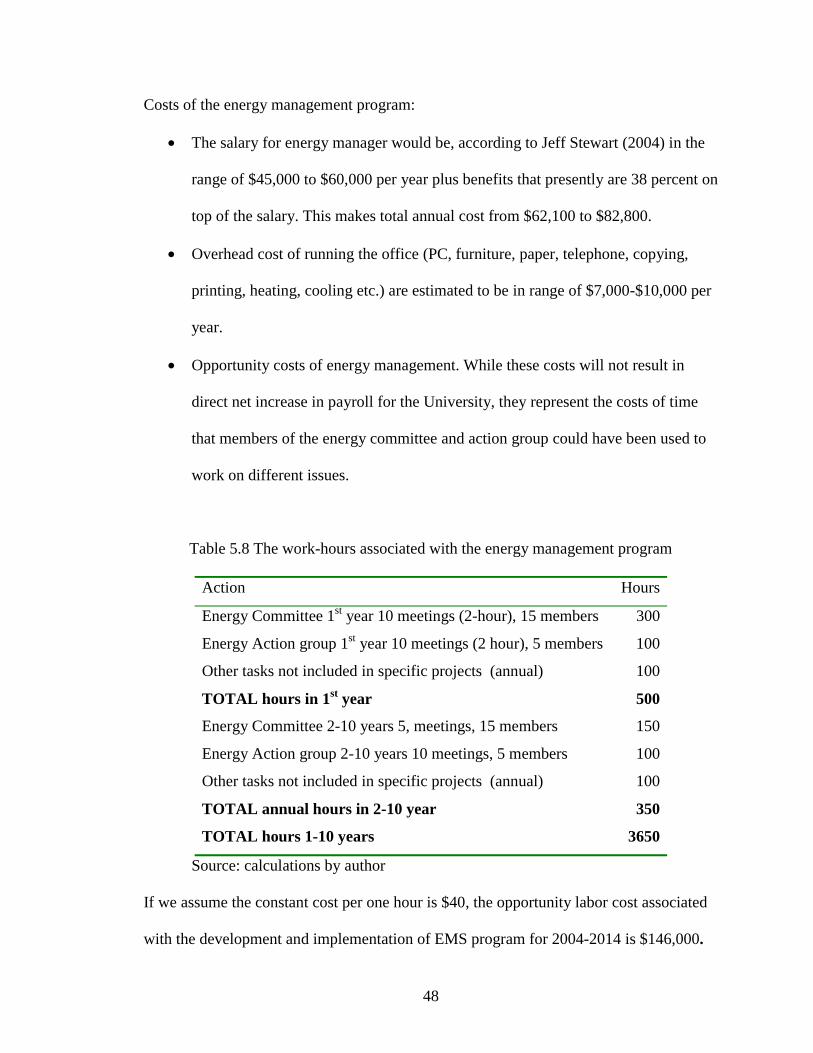
48
Costs of the energy management program:
• The salary for energy manager would be, according to Jeff Stewart (2004) in the
range of $45,000 to $60,000 per year plus benefits that presently are 38 percent on
top of the salary. This makes total annual cost from $62,100 to $82,800.
• Overhead cost of running the office (PC, furniture, paper, telephone, copying,
printing, heating, cooling etc.) are estimated to be in range of $7,000-$10,000 per
year.
• Opportunity costs of energy management. While these costs will not result in
direct net increase in payroll for the University, they represent the costs of time
that members of the energy committee and action group could have been used to
work on different issues.
Table 5.8 The work-hours associated with the energy management program
Action Hours
Energy Committee 1st year 10 meetings (2-hour), 15 members 300
Energy Action group 1st year 10 meetings (2 hour), 5 members 100
Other tasks not included in specific projects (annual) 100
TOTAL hours in 1st year 500
Energy Committee 2-10 years 5, meetings, 15 members 150
Energy Action group 2-10 years 10 meetings, 5 members 100
Other tasks not included in specific projects (annual) 100
TOTAL annual hours in 2-10 year 350
TOTAL hours 1-10 years 3650
Source: calculations by author
If we assume the constant cost per one hour is $40, the opportunity labor cost associated
with the development and implementation of EMS program for 2004-2014 is $146,000.
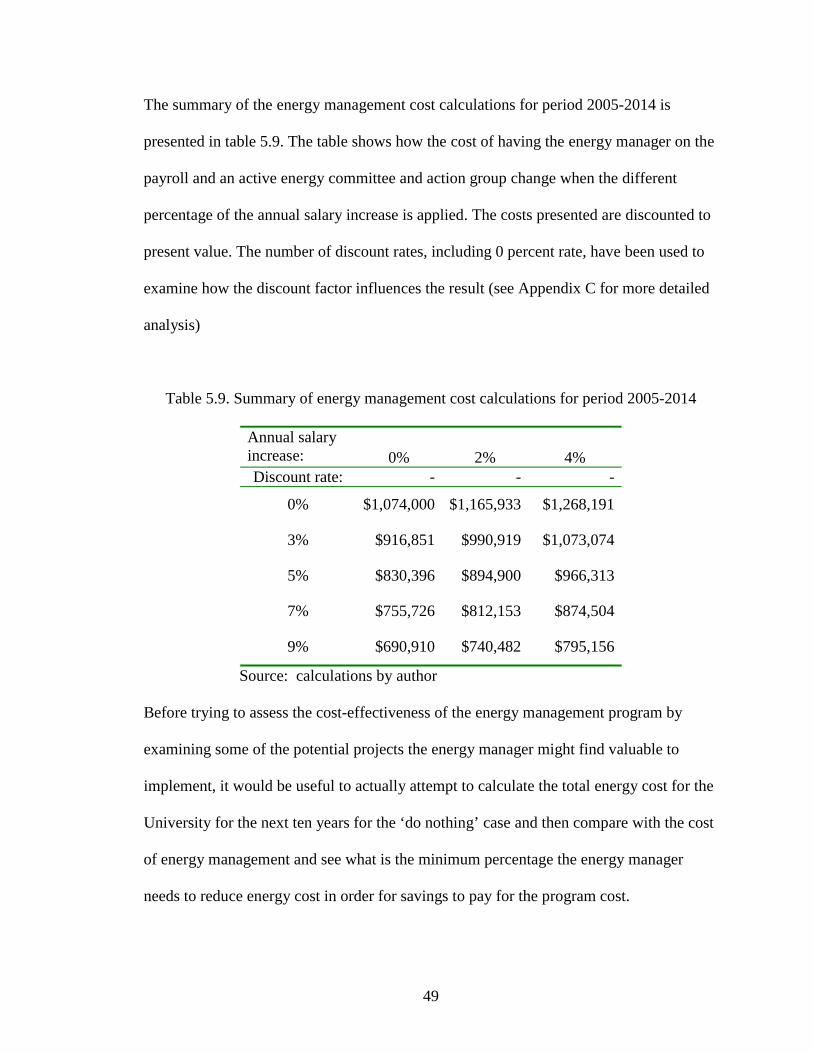
49
The summary of the energy management cost calculations for period 2005-2014 is
presented in table 5.9. The table shows how the cost of having the energy manager on the
payroll and an active energy committee and action group change when the different
percentage of the annual salary increase is applied. The costs presented are discounted to
present value. The number of discount rates, including 0 percent rate, have been used to
examine how the discount factor influences the result (see Appendix C for more detailed
analysis)
Table 5.9. Summary of energy management cost calculations for period 2005-2014
Annual salary increase: 0% 2% 4% Discount rate: - - -
0% $1,074,000 $1,165,933 $1,268,191
3% $916,851 $990,919 $1,073,074
5% $830,396 $894,900 $966,313
7% $755,726 $812,153 $874,504
9% $690,910 $740,482 $795,156
Source: calculations by author
Before trying to assess the cost-effectiveness of the energy management program by
examining some of the potential projects the energy manager might find valuable to
implement, it would be useful to actually attempt to calculate the total energy cost for the
University for the next ten years for the ‘do nothing’ case and then compare with the cost
of energy management and see what is the minimum percentage the energy manager
needs to reduce energy cost in order for savings to pay for the program cost.
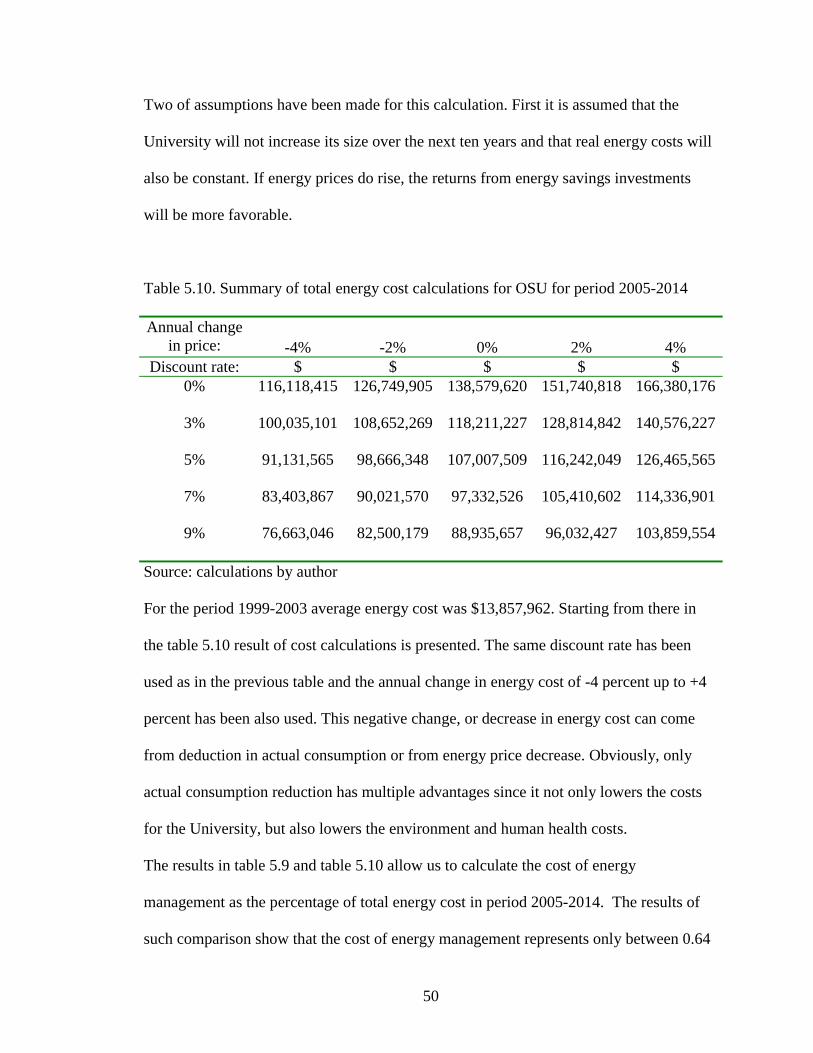
50
Two of assumptions have been made for this calculation. First it is assumed that the
University will not increase its size over the next ten years and that real energy costs will
also be constant. If energy prices do rise, the returns from energy savings investments
will be more favorable.
Table 5.10. Summary of total energy cost calculations for OSU for period 2005-2014
Annual change in price: -4% -2% 0% 2% 4%
Discount rate: $ $ $ $ $ 0% 116,118,415 126,749,905 138,579,620 151,740,818 166,380,176
3% 100,035,101 108,652,269 118,211,227 128,814,842 140,576,227
5% 91,131,565 98,666,348 107,007,509 116,242,049 126,465,565
7% 83,403,867 90,021,570 97,332,526 105,410,602 114,336,901
9% 76,663,046 82,500,179 88,935,657 96,032,427 103,859,554
Source: calculations by author
For the period 1999-2003 average energy cost was $13,857,962. Starting from there in
the table 5.10 result of cost calculations is presented. The same discount rate has been
used as in the previous table and the annual change in energy cost of -4 percent up to +4
percent has been also used. This negative change, or decrease in energy cost can come
from deduction in actual consumption or from energy price decrease. Obviously, only
actual consumption reduction has multiple advantages since it not only lowers the costs
for the University, but also lowers the environment and human health costs.
The results in table 5.9 and table 5.10 allow us to calculate the cost of energy
management as the percentage of total energy cost in period 2005-2014. The results of
such comparison show that the cost of energy management represents only between 0.64
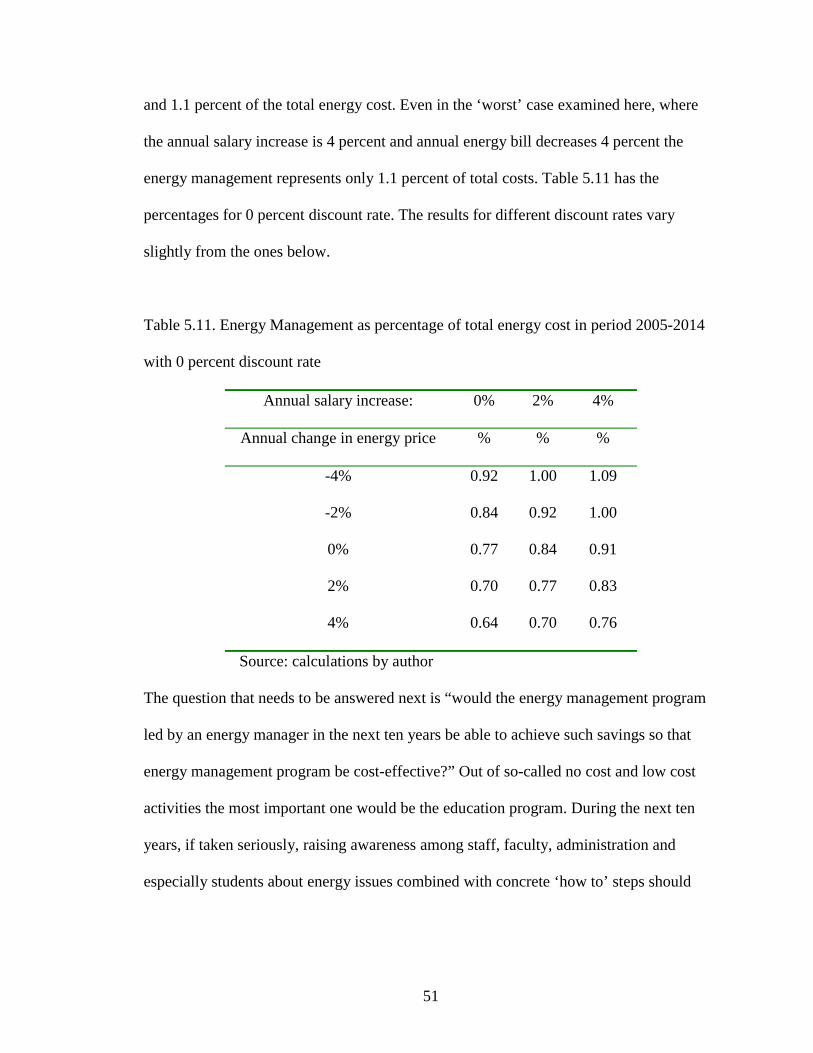
51
and 1.1 percent of the total energy cost. Even in the ‘worst’ case examined here, where
the annual salary increase is 4 percent and annual energy bill decreases 4 percent the
energy management represents only 1.1 percent of total costs. Table 5.11 has the
percentages for 0 percent discount rate. The results for different discount rates vary
slightly from the ones below.
Table 5.11. Energy Management as percentage of total energy cost in period 2005-2014
with 0 percent discount rate
Annual salary increase: 0% 2% 4%
Annual change in energy price % % %
-4% 0.92 1.00 1.09
-2% 0.84 0.92 1.00
0% 0.77 0.84 0.91
2% 0.70 0.77 0.83
4% 0.64 0.70 0.76
Source: calculations by author
The question that needs to be answered next is “would the energy management program
led by an energy manager in the next ten years be able to achieve such savings so that
energy management program be cost-effective?” Out of so-called no cost and low cost
activities the most important one would be the education program. During the next ten
years, if taken seriously, raising awareness among staff, faculty, administration and
especially students about energy issues combined with concrete ‘how to’ steps should
52
result in behavior changes that can save at least one percent out of total energy cost,
above the costs of such programs.
According to numerous examples, some of which were presented earlier (see chapter
2.2.), efficient energy management program is responsible for much higher percentage of
energy savings. According to Turner and Capehart (2001) the typical savings through
energy management are:
• Low Cost activities first year or two: 5 to 15 percent.
• Moderate cost, significant effort, three to five years: 15 to 30 percent.
• Long-term potential, higher cost, more engineering: 30 to 50 percent.
Those numbers show other energy management programs have been cost-effective even
when not counting the environmental and health benefits of more efficient energy use.
5.2.4 Lighting Retrofit
From 2001 on, the Physical Plant’s Electrical shop has been retrofitting the T-12
fluorescent lamps that use magnetic ballasts with more efficient T-8 lamps and electronic
ballasts. If the University continues to finance the project with the $200,000 to $300,000
per year, the retrofit is planned to continue until 2014.
As part of the analysis of the present and planned projects, the energy manager should
perform economic analysis of lightning retrofit in order to determine if the present
practice is indeed the most cost-saving course of action that could be taken.
In the buildings where the retrofit is finished the achieved savings in lighting energy were
in the range of 25 to 30 percent. Because of lower heat output of the electronic ballasts,
53
compared with old magnetic ones, the lighting retrofit should lower the cooling
requirements during the summer, but also slightly increase heating requirements during
the winter. However, due to a deficiency in usable data for cooling and heating loads, the
analysis will be conducted only for lighting savings. Additional benefits not taken into
account include the significant savings in maintenance and relamping costs due to longer
life of T-8 lamps and the fact that because of better light output it is possible to replace
four T-12 lamps with three T-8 lamps without reducing the light level.
Lighting on average makes about 20 percent of electricity use in the United States
(MnTAP, 2004), but universities like OSU where air conditioning is done through use of
steam and chilled water generated by burning natural gas, lightning likely has a higher
share of total electricity use. For the purposes of analysis the following numbers have
been used: 27.5 percent lighting savings; lighting 30 percent of total electricity
consumption and as result total electricity savings due to retrofit are estimated at 8.25
percent. Average electricity cost, without ‘external’ costs, for period 1999-2003 was
$6,914,853.40 so the maximum savings from retrofit are $570,475.41.
The goal of analysis was to first find the Net Present Value (NPV) of retrofit if it is
continued as planned, and then to compare it with the NPV of possibility that the
University takes the loan or issues the bond in FY 2005 for $2,500,000 to pay for retrofit.
The bonds are to be paid over 7 or 10 years with interest rate conservatively determined
at 5 percent. Also, the calculation have been made for the case that the University decides
to wait for better discount rate and raises bonds in FY 2008 with 3 percent interest rate.
Besides the Net Present Value, the Internal Rate of Return on investment was calculated
in order to get the discount rate that would have the value of the NPV to be equal to zero.
54
While retrofit has started in 2001 and has already generated the savings for the purpose of
this analysis it is regarded as a separate project and is not considered. Several
assumptions have been made in order to calculate the electricity savings. Average
electricity cost for the last five years is taken to be average annual consumption for the
next ten years. Resulting maximum savings of $570,475.41 or 8.25 percent of total
electricity cost can be achieved only after the project has been finished. For the budget
option the retrofit is estimated to be finished in 2014, so that would be the first year when
the maximum savings will be achieved. Since the annual budget is estimated to be the
same every year the savings from retrofit are also estimated to rise by 10 percent of the
maximum savings in the next 10 years. For the bond issue of $2,500,000 the project is
estimated to be implemented over two years so that in the first year 50 percent of the
maximum savings is achieved and starting with the second year maximum savings are
regularly achieved.
Bond payments are calculated using the MS Excel PMT function that calculates the
payment for a loan based on constant payments and a constant NPV function that returns
the present value of investment based on discount rate and a series of future payments
and income.
The summary of results is presented in table 5.12 (Appendix D has more detailed
analysis). As can be seen from the table the Net Present Value for OSU of all project
alternatives, given the above-mentioned assumptions, is positive, but significant
variations exist between the amounts of NPV for each alternative.
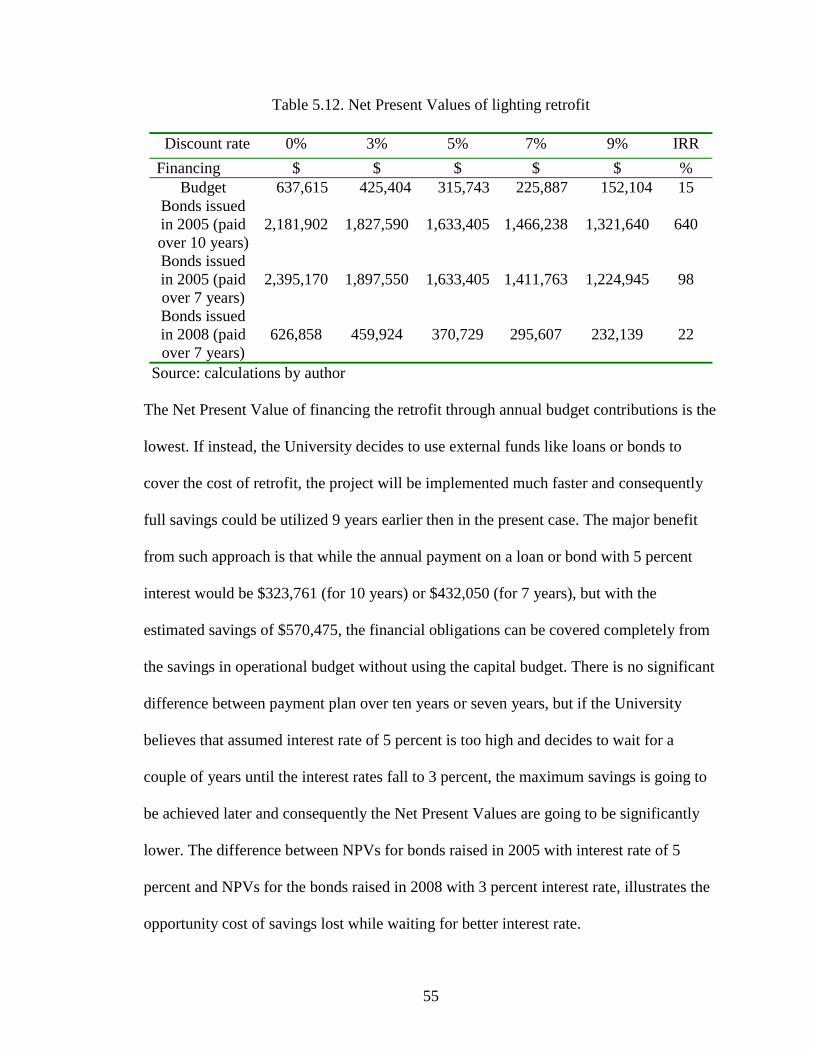
55
Table 5.12. Net Present Values of lighting retrofit
Discount rate 0% 3% 5% 7% 9% IRR Financing $ $ $ $ $ %
Budget 637,615 425,404 315,743 225,887 152,104 15 Bonds issued in 2005 (paid over 10 years)
2,181,902 1,827,590 1,633,405 1,466,238 1,321,640 640
Bonds issued in 2005 (paid over 7 years)
2,395,170 1,897,550 1,633,405 1,411,763 1,224,945 98
Bonds issued in 2008 (paid over 7 years)
626,858 459,924 370,729 295,607 232,139 22
Source: calculations by author
The Net Present Value of financing the retrofit through annual budget contributions is the
lowest. If instead, the University decides to use external funds like loans or bonds to
cover the cost of retrofit, the project will be implemented much faster and consequently
full savings could be utilized 9 years earlier then in the present case. The major benefit
from such approach is that while the annual payment on a loan or bond with 5 percent
interest would be $323,761 (for 10 years) or $432,050 (for 7 years), but with the
estimated savings of $570,475, the financial obligations can be covered completely from
the savings in operational budget without using the capital budget. There is no significant
difference between payment plan over ten years or seven years, but if the University
believes that assumed interest rate of 5 percent is too high and decides to wait for a
couple of years until the interest rates fall to 3 percent, the maximum savings is going to
be achieved later and consequently the Net Present Values are going to be significantly
lower. The difference between NPVs for bonds raised in 2005 with interest rate of 5
percent and NPVs for the bonds raised in 2008 with 3 percent interest rate, illustrates the
opportunity cost of savings lost while waiting for better interest rate.
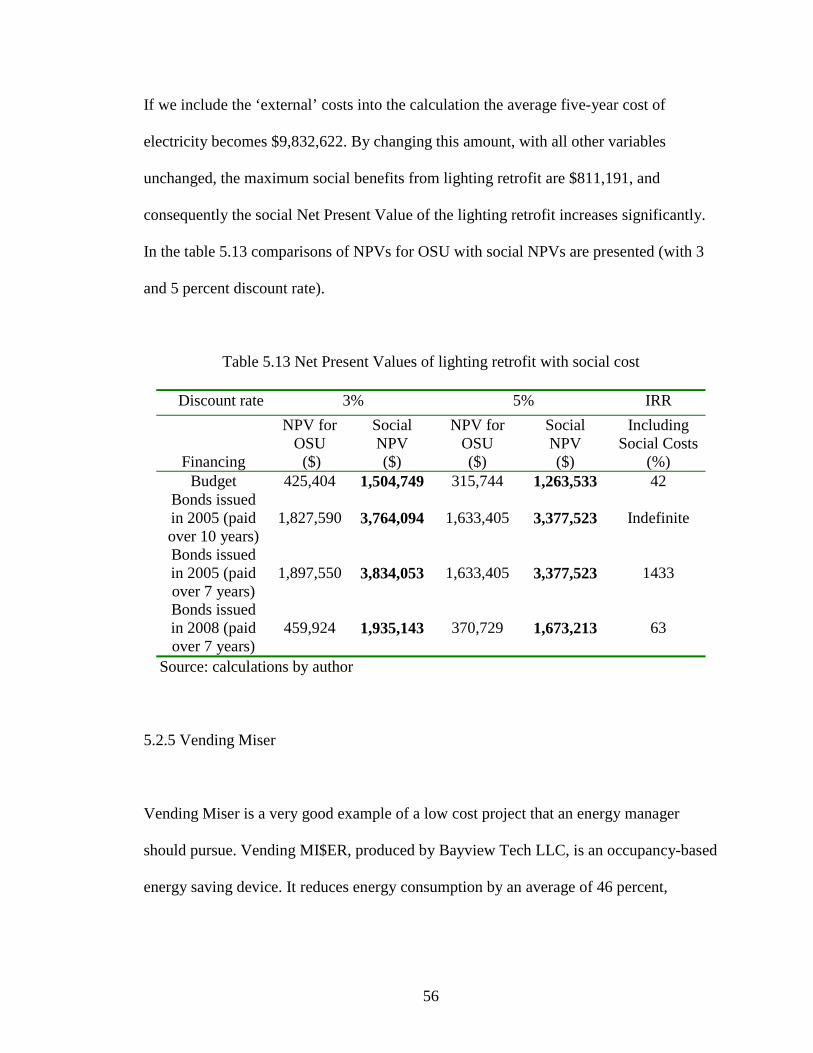
56
If we include the ‘external’ costs into the calculation the average five-year cost of
electricity becomes $9,832,622. By changing this amount, with all other variables
unchanged, the maximum social benefits from lighting retrofit are $811,191, and
consequently the social Net Present Value of the lighting retrofit increases significantly.
In the table 5.13 comparisons of NPVs for OSU with social NPVs are presented (with 3
and 5 percent discount rate).
Table 5.13 Net Present Values of lighting retrofit with social cost
Discount rate 3% 5% IRR
Financing
NPV for OSU ($)
Social NPV ($)
NPV for OSU ($)
Social NPV ($)
Including Social Costs
(%) Budget 425,404 1,504,749 315,744 1,263,533 42
Bonds issued in 2005 (paid over 10 years)
1,827,590 3,764,094 1,633,405 3,377,523 Indefinite
Bonds issued in 2005 (paid over 7 years)
1,897,550 3,834,053 1,633,405 3,377,523 1433
Bonds issued in 2008 (paid over 7 years)
459,924 1,935,143 370,729 1,673,213 63
Source: calculations by author
5.2.5 Vending Miser
Vending Miser is a very good example of a low cost project that an energy manager
should pursue. Vending MI$ER, produced by Bayview Tech LLC, is an occupancy-based
energy saving device. It reduces energy consumption by an average of 46 percent,
57
translating into savings of $150 or more per year per machine, while maintaining the
temperature of the vended product so the sales don’t go down (Bayview, 2003).
Vending Miser achieves this by using infrared motion sensor so that it powers down a
vending machine when the area surrounding it is unoccupied and automatically powers
up the vending machine when the area is reoccupied. Additionally, it monitors the
ambient temperature while the vending machine is powered down. Using this
information, it also automatically powers up the vending machine at appropriate
intervals, independent of occupancy, to ensure that the vended product stays cold.
Vending Miser reduces the maintenance costs and extends the life of the vending
machine by significantly reducing the number of compressor cycles that are run
(Bayview, 2003).
The Vending Miser has a five-year warranty. For this analysis, the assumption is made
that after five years, the misers are completely replaced. From personal experience of the
author, it is possible to install on average 6 vending misers per hour (including travel
time). Analysis is performed for 150 vending machines. All other data needed for this
analysis were taken from a model develop by Bayview Tech (see Appendix E for detailed
analysis).
Total project cost is $27,100, and it would generate 54 percent savings in electricity
consumption for vending machines and that would translate to annual savings of $14,040
(with rate of $0.05/kWh). The project has simple payback period of 23 months and the
internal rate of return on investment of 101 percent for the next ten years. A summary of
Net Present Values for OSU and social NPVs is presented in table 5.14
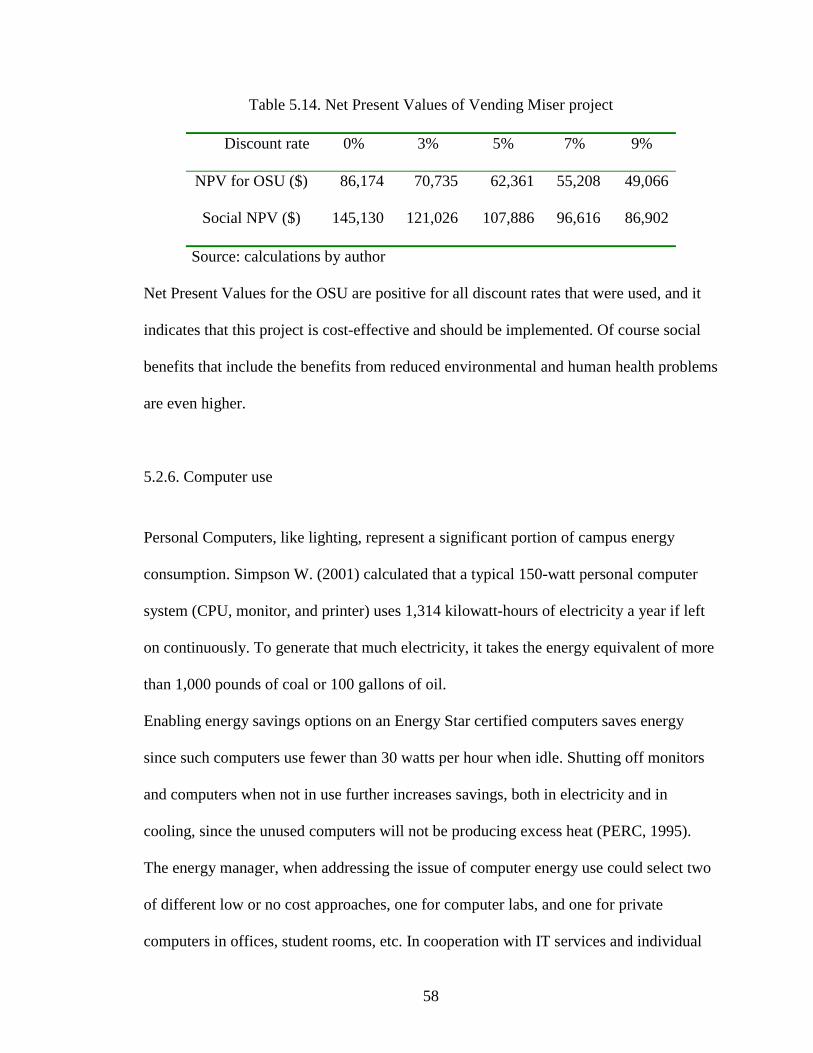
58
Table 5.14. Net Present Values of Vending Miser project
Discount rate 0% 3% 5% 7% 9%
NPV for OSU ($) 86,174 70,735 62,361 55,208 49,066
Social NPV ($) 145,130 121,026 107,886 96,616 86,902
Source: calculations by author
Net Present Values for the OSU are positive for all discount rates that were used, and it
indicates that this project is cost-effective and should be implemented. Of course social
benefits that include the benefits from reduced environmental and human health problems
are even higher.
5.2.6. Computer use
Personal Computers, like lighting, represent a significant portion of campus energy
consumption. Simpson W. (2001) calculated that a typical 150-watt personal computer
system (CPU, monitor, and printer) uses 1,314 kilowatt-hours of electricity a year if left
on continuously. To generate that much electricity, it takes the energy equivalent of more
than 1,000 pounds of coal or 100 gallons of oil.
Enabling energy savings options on an Energy Star certified computers saves energy
since such computers use fewer than 30 watts per hour when idle. Shutting off monitors
and computers when not in use further increases savings, both in electricity and in
cooling, since the unused computers will not be producing excess heat (PERC, 1995).
The energy manager, when addressing the issue of computer energy use could select two
of different low or no cost approaches, one for computer labs, and one for private
computers in offices, student rooms, etc. In cooperation with IT services and individual
59
departments, the best policy for most labs could be that before the end of lab’s operating
time to request that students turn off the computers and lab assistants to turn off the
computers nobody was using. In the labs open 24 hours a day it might still be appropriate
to turn off all unused computers during the night and to put stickers on each computer
asking students to turn them off when finished with their work. The energy manager
could address the private computers energy use through awareness raising programs, by
asking each student to install or enable energy management options on computers,
cooperate with each department IT person so to make sure the energy management
options are enabled and in use in computers in offices, and finally to remind people
through flyers, stickers, etc. to turn off computers at the end of the workday or during the
night.
In order to attempt to calculate the potential energy and costs savings that could be
achieved through better practice we need to first estimate the total number of computers
and separate them in different categories of use. However, Sheldon, M. (2004) from IT
division at Oklahoma State University, said that since each department has their own
inventory records and student personal computers are not recorded it would be almost
impossible to know exactly the total number of computers on campus. However, the
number can be estimated to be approximately 13,000 since that is the number of
connected devices on the OSU network. For the purposes of calculating the potential
savings it is estimated that there is 3,000 public computers in the computer labs and
10,000 private computers.
The detailed calculations for potential savings in electricity (reduced cooling costs are not
considered) can be found in appendix F. In performing the calculations it was assumed
60
that a standard computer runs at 150 watts when in use, and 30W when idle, given that
the energy savings option is enabled. The electricity rate is 5 cents/kWh. If all 13,000
computers are left on 24 hours without enabling the energy savings options on computers
it would result in annual electricity costs of $855,000. If we contrast this worst-case
scenario with best-case scenario where energy savings option is enabled and average
private computer is assumed to be on only for 8 hours a day in a seven day week, but
used only for 4 hours and public computers are assumed to be on 16 hours a day and not
used for 8 of those hours the cost for electricity drop to only $210,000 per year, a drop of
$643,000!
However, since most public computers and at least some private computers have the
energy savings option enabled, actual electricity costs are lower. The more realistic
scenario representing the current state of practice would be to assume public computers
are on for 24 hours, but idle for 12 hours on average, and private computers on for 24
hours and used for 8 hours, idle for 16 hours. In this case the electricity cost is much
lower at $425,000. However, the costs could be still lowered significantly by 50 percent
by strictly adhering to this more realistic-scenario. Savings of $214,620 dollars per year
or over 20 million dollars in next ten years (given constant electricity rate of $0.05 per
kWh and no discount rate) is not something that should be overlooked. Even if the best-
case policies are not strictly followed, the savings should be substantial enough to justify
the implementations of such measures.
When calculating the total social cost of electricity use, the potential savings from the
more realistic scenario are around $300,000 per year! Of course, since the turned off
computers do not produce waste heat, savings would be greater if we counted the net
61
savings left after we contrast savings from reduced cooling costs during the cooling
season with increased heating costs during the winter. Because the cooling season is
longer than heating, savings from reduced need for cooling are assumed to be higher then
increased costs from additional heating (Woodroof, E.A, 2001).
5.2.7 Costs and Benefits of Billing Each Building
The current state of practice is that buildings that generate a profit like the Student Union,
Athletics, Residential Life, and others are billed individually for their energy use. For
those buildings energy use is metered and billed accordingly. For the so-called general
university buildings (academic part of the University), the energy cost is provided
through the general University fund. Not all buildings have individual meters or they may
have meters for electricity and chilled water, but not for steam, and vice versa.
The difficulty of measuring actual building consumption presents an obstacle for energy
management. Accurate measurements help the energy manager and Physical Plant to
identify problem areas and large energy users. The energy manager and other Physical
Plant managers could devise detailed conservation strategies for the main energy users
for each building category since those buildings have potential for greatest energy
savings. Accurate measurements also enable the energy manager to measure the success
of the energy conservation projects, by monitoring the changes in energy use for each
building.
The data can be used, also, to further motivate the building users by publicly recognizing
and awarding them for their efforts in energy conservation. Such measurements of the
62
buildings energy consumption enable the energy manager to establish annual energy
conservation competition among dormitories. Such competitions, that include the prizes
and public recognition for the winners, are very good promotional tool for the energy
manager to use to get cooperation from student population for the energy conservation
measures. The actual savings from such competitions should not be expected to be great,
especially in the first year, but nevertheless it could mark the beginning of the change in
attitudes. For example, the Yale University had the most recent competition among
dormitories. The competition that lasted for four weeks during the months of March and
April 2004 resulted in less than 2.5 percent of savings in electricity use (Downing, T.,
2004). Obviously, the savings are not big, but if we consider that it was the first such
competition and that it was during the time when students are traditionally preoccupied
with term projects and finals the results are not surprising. Probably the best time for such
competitions would be in the middle of the fall semester. The added advantage is that the
freshmen student population is then right from the very beginning of their college life
exposed and educated about the energy conservation measures.
Another reason for metering the energy use for each building is that since colleges and
departments are not directly billed for their energy use, there is no direct incentive for
saving energy. It is human nature that if not charged directly for energy consumption we
tend to factor the energy cost to be zero. This means that from users point of view there is
no real difference between ‘saving’ and ‘wasting’ energy. The main question would be,
“why should departments and individuals put all the effort”, a very real cost from users
point of view, in saving energy since their effort will not be recognized and all the
63
benefits will go to somebody else, in this case the University in general (very indirect
benefit).
One way to address this would be to charge each building individually for the energy it
consumes. Benefits of such a system would be that each college and department would be
responsible for its energy use. If they see it is possible to save money on energy and then
use the part of savings for things like better equipment, offices, visiting scholars,
additional faculty members, and others that will help improve the quality of education
and research, they will be much more willing to put an effort and mind toward energy
conservation. In other words, direct billing should help the energy manager in changing
attitudes towards energy conservation and getting wider support for projects. However, a
part of the savings achieved in departments by implementing the energy management
projects initiated by the energy manager and Physical Plant, should be designated for
further energy conservation programs, so that it can develop and explore all savings
opportunities.
However, the metering and direct billing each building has its costs also: metering the
energy consumption of each building has the initial implementation costs but also
increased maintenance costs due to the need for meter calibration and part replacement,
and higher administration costs due to increased complexity of system. Metering should
then be seen firstly as an enabling infrastructure, more than a cost saving measure
(Downing, T, 2004) If the overall goal is to be energy efficient and not waste energy then
metering, while by itself will not save money enables Physical plant to measure how
much energy is saved and where and how to improve the savings levels.
64
5.2.8 Costs and Benefits of Changing the Temperature Settings
Because of the difference between the 1983 energy management policy that required
summer temperatures to be as high as 78° F and winter temperatures as low as 68° F, and
the current practice where the temperature is held around the 71°-73° F in the winter and
72°-73° F during the summer, there should be a review and a possible adjustment of
temperature set points in cooling and heating seasons. Since in residential homes 3
percent of the energy can be saved during winter by lowering thermostat 1° F, and during
summer 5 percent of the energy used by air conditioner can be saved by raising the
thermostat by 1° F (Phillips Petroleum 1990), the energy manager with the Building
Control group should study possibility of changing the temperature settings without
lowering the comfort of building users, given that the users are dressed in accordance to
the season and outside temperature.
If we assume that the above percentage savings for residential homes are applicable to the
University, the savings that can be achieved are clear. However, the personal costs of the
temperature being too low or too high are also very real, but harder to measure. A
temperature that is set to high or to low for the season will result in increased discomfort
and reduced productivity of building users, which defeats the purpose of energy
management. The purpose of energy management is, as stated earlier, to explore and
exploit the energy conservation opportunities without reducing the comfort of the
occupants. It is clear that there is a limited window of opportunity for energy savings
regarding temperature settings.
65
On the other hand, the concerns with overcooling or overheating the buildings are valid.
If the users do not feel there is direct connection between how they use energy and the
costs of energy use, there is possibility that they would require the temperature settings
that result in increased comfort, even if it for example, means they can wear only T-shirts
during the winter. However, if the departments and colleges are charged directly for the
energy they use the question becomes: would the users be more willing to accept
temperatures to be set a little higher for the summer and lower for the winter, if they see
the direct link between saving energy and benefits they receive? The answer to this
question requires careful research outside the scope of this study, and the question for the
time being will have to stay unresolved.
5.2.9 Occupancy Sensors in Restrooms
Occupancy sensors have a potential to significantly reduce the electricity use by shutting
off lights when area is unoccupied for a designated period of time. It should be noted that
with reduced lightning usage, the light fixtures produce less heat (Kaya, D., 2003).
However, in calculations presented here only the energy saved from lighting use
reduction has been calculated, due to lack of data about the air-conditioning loads.
Maniccia, D. et al. (2000) conducted an occupancy monitoring study, using buildings in
24 states owned and occupied by active participants in the EPA’s Green Lights Program.
The study participants included profit, not-for profit, service and manufacturing
companies, healthcare organizations, primary and secondary education institutions, and
local, state, and federal government entities. The study evaluated energy use before and
66
after occupancy sensors were installed with time-delays of 5-, 10-, 15-, or 20- minutes in
restrooms, break rooms, classrooms, conference rooms, and private offices.
The average percentage of time restrooms were occupied was 20 percent, but lights were
on for 24 hours per day. The study showed that restrooms have the highest overall
potential for energy savings (between 47 and 60 percent). However, those percentages do
not consider maintenance costs. When occupancy sensors are added, the lamp life
decreases because lamp-switching frequency increases and therefore relamping costs
increase too. The study showed that using occupancy sensors will slightly increase
relamping costs, but despite the increase, the occupancy sensors can significantly reduce
annual energy costs. When these two parameters are combined, the overall annual cost
savings for restrooms were from 45 to 40 percent depending on time delay. So, the study
clearly showed that despite increased relamping costs and decreased lamp life due to
frequent switching, installing occupancy sensors saves lighting energy and reduces
overall costs (Maniccia, D. et al., 2000).
Since the Maniccia, D. et al. (2000) showed that highest savings can be achieved in
restrooms, the analysis of costs and benefits of installing the occupancy sensors in
restrooms at OSU will be made.
The following assumptions were used:
• Lights in restrooms are on 24 hours a day, but are occupied for only 20 percent of
that time.
• OSU has 200 buildings and each building has on average 5 restrooms: total is
1000 restrooms at the University.
67
• Valid concerns can be raised about lights turning off while people are still using
the restrooms. Such concerns can be addressed by properly adjusting the time
delay (the time between when sensor has detected the last motion and when the
lights actually go off). Time delay of 15 minutes should provide enough assurance
to users.
• 50 percent average cost savings (only lighting) with time delay of 15 minutes. For
the same time delay with inclusion of increased maintenance costs the savings
decline to 42 percent (Maniccia, D. et al., 2000). An alternative would be to
duplicate the study for OSU and then use the real data.
• The cost of an occupancy sensor is $120 (Maxwell, T., 2004) with one year
warranty.
• Labor cost $21 per hour (Maxwell, T., 2004).
• Implementation time: 3 hours per sensor (sensor installation, conduit and by-pass
installation so if the sensor fails light can still be turned on).
• 3 light fixtures per restroom on average with 144 W per fixture.
• Electricity rate is constant at $0.05 per kilowatt hour.
• 1 occupancy sensor per restroom.
• Average life of sensor 4 years.
To calculate the simple payback for investment the calculations from Woodroof, (2001)
were adapted for this particular situation:
1. Total KWh consumption before the occupancy sensors are installed.
KWh =
68
= (# restrooms)(#fixtures/restroom)(input watts/fixture)(1 kW/1000 W)(Total annual
operating hours)
= (1000 restrooms)(3 fixtures/restroom)(144 watts/fixture)(1 kW/1000 W)(8760
hours/year)
= 3,784,320 kWh/year
2. Total Annual Dollar costs prior to installation of occupancy sensors ($/year)
= (kWh/year) (kWh cost)
= (3,784,320 kWh/year)($0.05/kWh)
= $189,216/ year
3. Total Annual Dollar savings if occupancy sensors are installed ($/year)
= (total $/year )(% cost savings)
= ($189,216/ year)(0.50)
= $94,608 / year
4. Implementation Cost
= (# Occupancy sensors needed)[(cost of occupancy sensor)+(installation
time/room)(labor cost)]
= (1000)[($120)+(3 hour/sensor)($21/hour)]
= $183,000
6. Simple Payback
= (Implementation cost)/(Total Annual Dollar Savings)
= ($183,000)/($94,608 / year)
= 1.94 years
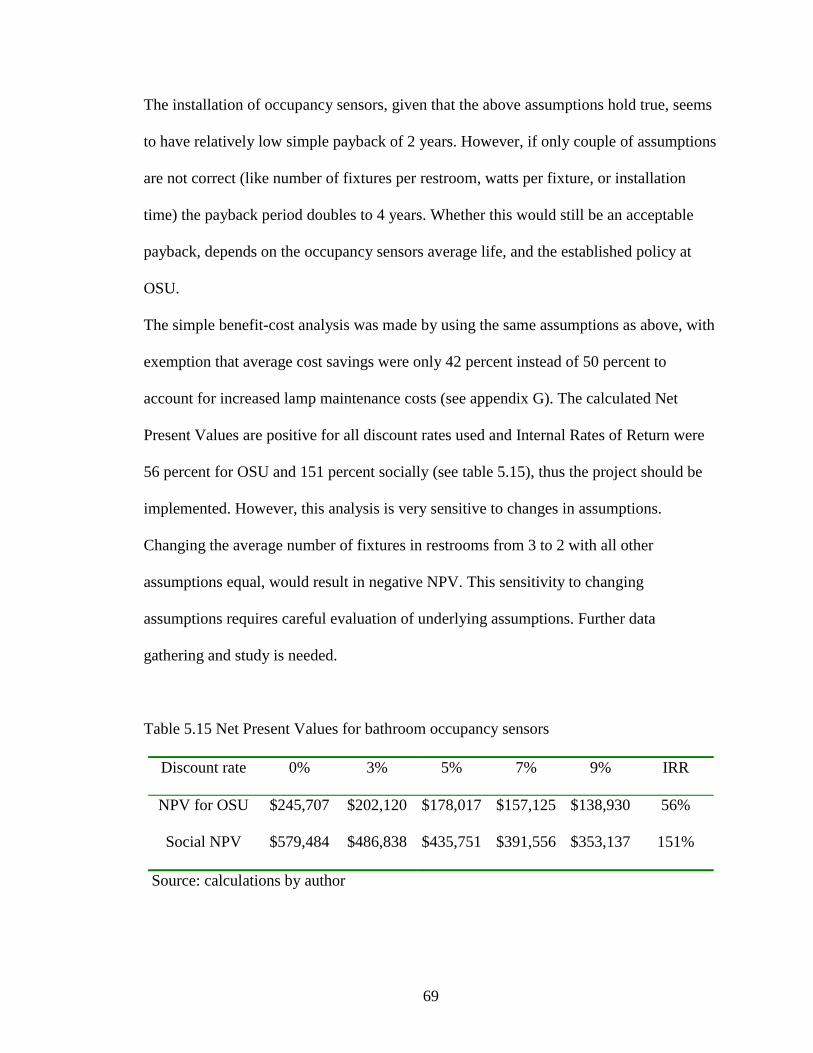
69
The installation of occupancy sensors, given that the above assumptions hold true, seems
to have relatively low simple payback of 2 years. However, if only couple of assumptions
are not correct (like number of fixtures per restroom, watts per fixture, or installation
time) the payback period doubles to 4 years. Whether this would still be an acceptable
payback, depends on the occupancy sensors average life, and the established policy at
OSU.
The simple benefit-cost analysis was made by using the same assumptions as above, with
exemption that average cost savings were only 42 percent instead of 50 percent to
account for increased lamp maintenance costs (see appendix G). The calculated Net
Present Values are positive for all discount rates used and Internal Rates of Return were
56 percent for OSU and 151 percent socially (see table 5.15), thus the project should be
implemented. However, this analysis is very sensitive to changes in assumptions.
Changing the average number of fixtures in restrooms from 3 to 2 with all other
assumptions equal, would result in negative NPV. This sensitivity to changing
assumptions requires careful evaluation of underlying assumptions. Further data
gathering and study is needed.
Table 5.15 Net Present Values for bathroom occupancy sensors
Discount rate 0% 3% 5% 7% 9% IRR
NPV for OSU $245,707 $202,120 $178,017 $157,125 $138,930 56%
Social NPV $579,484 $486,838 $435,751 $391,556 $353,137 151%
Source: calculations by author
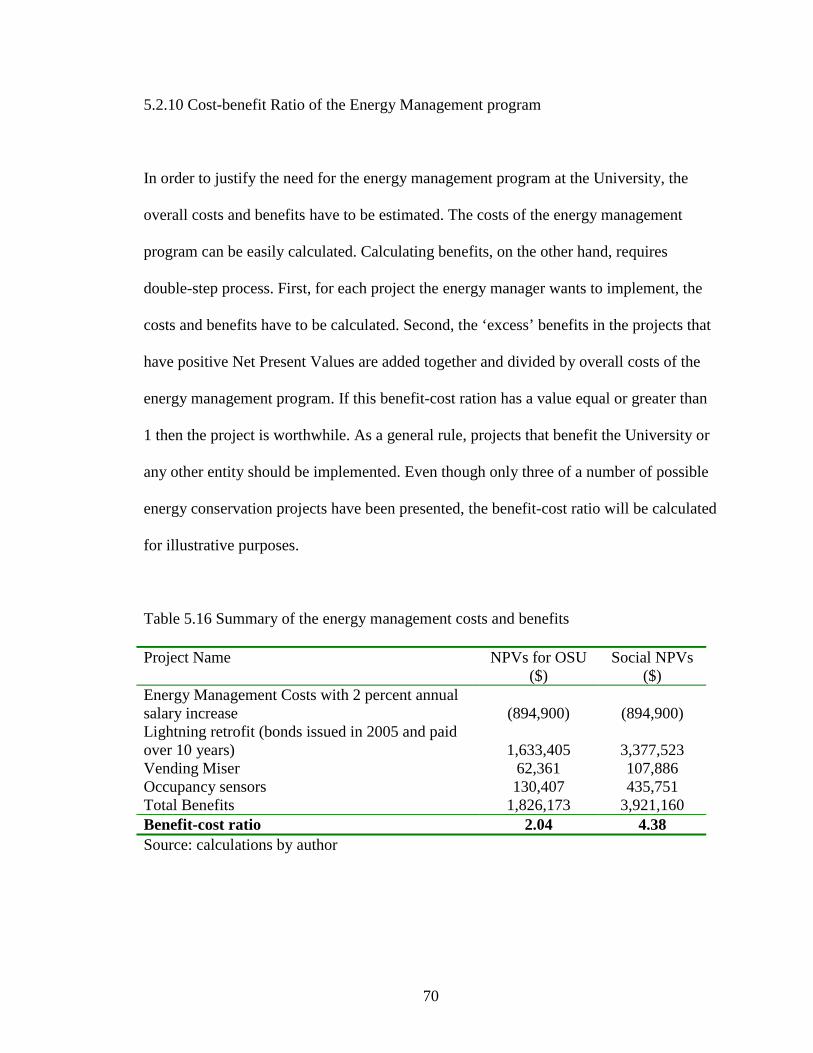
70
5.2.10 Cost-benefit Ratio of the Energy Management program
In order to justify the need for the energy management program at the University, the
overall costs and benefits have to be estimated. The costs of the energy management
program can be easily calculated. Calculating benefits, on the other hand, requires
double-step process. First, for each project the energy manager wants to implement, the
costs and benefits have to be calculated. Second, the ‘excess’ benefits in the projects that
have positive Net Present Values are added together and divided by overall costs of the
energy management program. If this benefit-cost ration has a value equal or greater than
1 then the project is worthwhile. As a general rule, projects that benefit the University or
any other entity should be implemented. Even though only three of a number of possible
energy conservation projects have been presented, the benefit-cost ratio will be calculated
for illustrative purposes.
Table 5.16 Summary of the energy management costs and benefits
Project Name NPVs for OSU ($)
Social NPVs ($)
Energy Management Costs with 2 percent annual salary increase
(894,900)
(894,900)
Lightning retrofit (bonds issued in 2005 and paid over 10 years)
1,633,405
3,377,523
Vending Miser 62,361 107,886 Occupancy sensors 130,407 435,751 Total Benefits 1,826,173 3,921,160 Benefit-cost ratio 2.04 4.38 Source: calculations by author
71
In such calculations the costs and benefits have to be calculated using the same discount
rate. Results will be calculated using the discount rate of 5 percent, the mid-range rate
used in previous calculations. Given that all the assumptions made during the calculation
of costs and benefits hold, the results presented in the table 5.16 clearly indicate that the
energy management program has positive benefit-costs ratio, even after considering only
three potential projects.
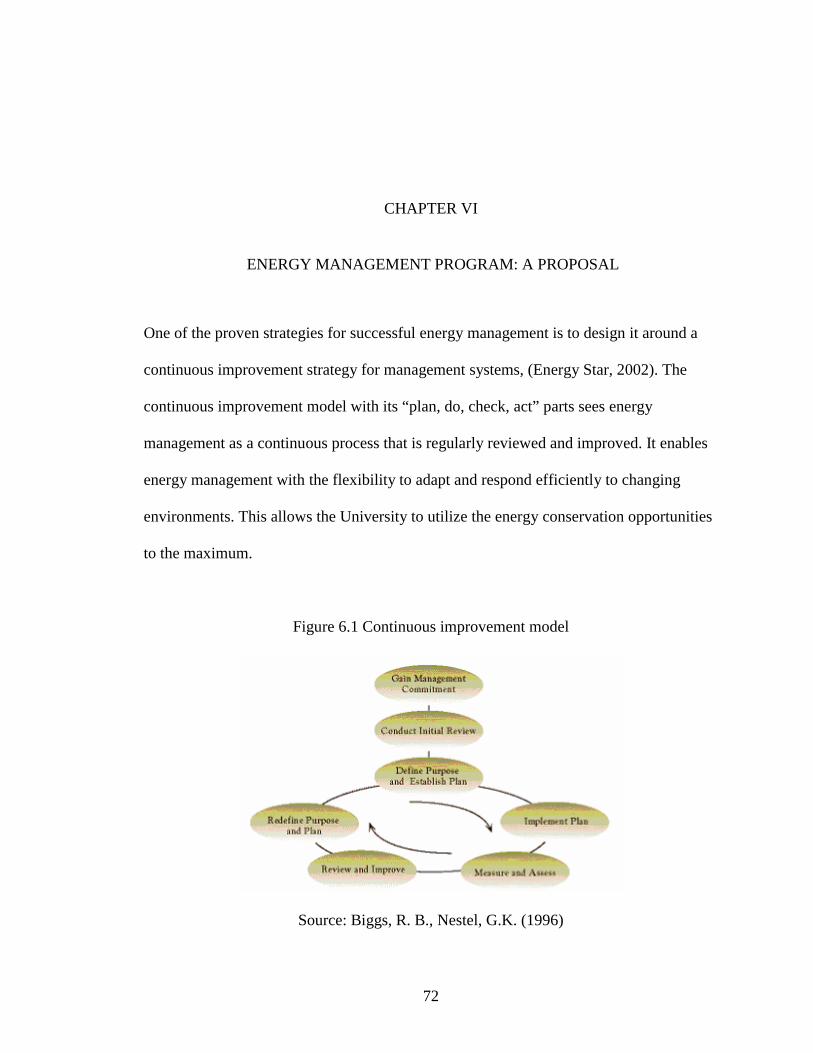
72
CHAPTER VI
ENERGY MANAGEMENT PROGRAM: A PROPOSAL
One of the proven strategies for successful energy management is to design it around a
continuous improvement strategy for management systems, (Energy Star, 2002). The
continuous improvement model with its “plan, do, check, act” parts sees energy
management as a continuous process that is regularly reviewed and improved. It enables
energy management with the flexibility to adapt and respond efficiently to changing
environments. This allows the University to utilize the energy conservation opportunities
to the maximum.
Figure 6.1 Continuous improvement model
Source: Biggs, R. B., Nestel, G.K. (1996)
73
According to the continuous improvement model, BEE, (2003), and Mashburn W. H,
(2001) the vital components of successful energy management are:
• Senior administration support.
• Energy policy, and strategy and implementation plan.
• Technical expertise for analyzing and implementing energy savings options.
• Effective monitoring system.
• Reporting and program reviews.
6.1 Administrative Support
If an energy management program is to reach its full potential and be taken seriously at
all levels in the University, the support and active involvement of a university president
and/or vice-presidents is a necessity (Simpson W., 2001).
One of the first steps senior administrators should do to show their support is to publish
an energy policy. Another is to empower those given responsibility for implementing the
energy management program (BEE, 2003). The evidence of administrative commitment
will be seen in the level of support given to the committee and the manager. Having
senior administration representative(s) participate in energy committee meetings or in
other energy related activities could do this. Also, when valuing the energy conservations
projects, OSU should apply exactly the same criteria as it applies for other investments.
Of course real evidence of Administration’s support is in the resources, such as
manpower, and budget designated for energy management.
74
6.2 Energy Policy
Energy policy acts both as (BEE, 2003):
• A public expression of university’s commitment to energy conservation and
environmental protection, and
• A working document to guide and provide continuity to energy management
practices.
OSU’s Energy Management policy has been unchanged for 21 years. Since most of its
requirements are not followed any more, it is possible to conclude that such policy on
energy management actually represents a barrier to energy conservation.
One of the first steps in energy management at OSU should be to completely rewrite it
and publish a new Energy Management Policy, either as part of Environmental
Management Policy or as an independent policy. In any case the energy policy should
include concrete, measurable goals. For example by 2015 OSU will consume 30 percent
less energy per square foot than it did in 2004, and at least 10 percent of the energy used
will come from renewable sources. Increasing the percent of renewable or ‘green’ energy
will lower the environmental and human health cost (by-products of fossil fuel
consumption) the University is responsible for. Furthermore, wind energy and especially
geothermal energy (used for heating and cooling the buildings) are already competitive
with more conventional sources of energy. Even though such goals may be ambitious,
75
they are not unreasonable or unachievable. The additional cost of wind energy is less
than the estimated externality cost of energy from coal and natural gas.
Green building practices besides benefiting the environment have been demonstrated to
be very cost-effective (see Kats, G., et. al., 2003), so the Energy Policy should commit
the University to incorporate green building practices in design of all new buildings and
major renovations, possibly even seeking LEED green building ratings (see appendix I
for proposed policies dealing with energy at OSU).
6.3 Energy Manager
In the initial stages of establishing an energy management system, the only thing more
important than strong support from senior administration is the selection of the energy
manager. Mashburn W. H (2001) states “every successful program has had this one thing
in common – one person who is a shaker and mover that makes things happen. The
program is then built around this person. Such person can then win over an initially
skeptic administration.”
Walter Simpson (2003), energy officer at SUNY Buffalo, recommends that the energy
officer be a free agent who develops both large and small energy conservation projects,
spearheads awareness efforts, and provides overall leadership to the energy program. The
energy officer should be technically trained and competent. But he or she should also be
an able manager, organizer, educator, and catalyst.
This is because while technical skills are a prerequisite in improving the energy
efficiency, energy management is only partly technical and involves a combination of
76
both managerial and technical skills. Managerial skills include bringing about awareness
and motivating people at all levels, changing the structure and procedure, monitoring the
energy consumption, and setting targets or norms. Both organizational and people
changes are required (BEE, 2003).
For the energy management program to be successful, the energy manager has to involve
everyone at the Physical Plant and in the whole university. Developing a working
organizational structure may be the most important thing an energy manager can do
(Mashburn W. H, 2001).
6.4 Energy Conservation Committee
An Energy committee is the core of the energy management program. It serves not only
to supplement the skills of the energy manager (Mashburn W. H, 2001), but also as main
body for communication and sharing of ideas throughout the University. The way to
achieve this is to have representatives from the Physical plant, senior administration, key
departments, faculty, staff and students, thus combining all the major constituencies of
the University. The main criteria for the membership should be an interest in energy
conservation. Other key ingredients listed by Walter Simpson (2001) include regular
meetings, some form of institutional memory, and a subcommittee organization. To be
effective, the committee will need to look wherever it wants in its quest to identify both
problems and solutions. No area should be “off-limits.” For this the key is strong
administrative support.
77
The Energy committee should set both long-term goals and annual goals. It should also
prepare a plan of activities and a system for documenting and following the progress in
achieving those goals.
The total skills needed for the committee, including the energy manager may be defined
as follows (Mashburn W. H, 2001):
• Have enough technical knowledge within the group to either understand the
technology used by the organization, or be trainable in that technology.
• Have knowledge of potential new technology that may be applicable to the
program.
• Have planning skills that will help establish the organizational structure, plan
energy surveys, determine educational needs, and develop a strategic energy
management plan.
• Understand the economic evaluation system used by the organization, particularly
payback and life cycle cost analysis.
• Have good communication and motivational skills since energy management
involves everyone within the organization.
6.5 Energy Conservation Action Group
While the Energy Committee is dealing with strategies, education, and outreach, the
Energy Action Group enables the Physical Plant staff to efficiently coordinate everyday
tasks related to energy management programs. An Action group will translate the goals
and objectives into an energy management action plan. Such a plan should hold answers
78
to questions like: What needs to be done? Who will do it? When it will be carried out and
completed? What resources are required? What financial resources are to be budgeted?
(BEE, 2003)
6.6 Energy Audit
The Energy audit is one of the first tasks to be performed after the decision has been
made to establish an effective energy management program. A campus wide energy audit
is a detailed analysis of the current state of energy use & management. More importantly,
the audit identifies possible areas for improvement and recommends the future steps for
energy management. It is easy to see that an energy audit represents the key for decision-
making and planning and a more efficient way of managing energy (BEE, 2003 and
Capehart, B.L, Spiller, MB, 2001).
According to Capehart and Spiller (2001) the typical audit process would start by
collecting and analyzing the University’s past record of energy consumption and costs.
An analysis should determine how the University uses and possibly wastes energy.
Energy Conservation Opportunities (ECO) are then identified and assessed in term of
their costs and benefits, and then they are ranked according to their cost-effectiveness. An
final part of the energy audit is an Action plan that details the implementation plan for
ECO’s so that the actual process of saving energy and money can start.
The University could use graduate and undergraduate students from industrial
engineering and management, civil and environmental engineering, and environmental
science departments to perform an energy audit under supervision of the energy manager
and the energy committee. The advantages of such an approach are multiple: students can
79
perform audit for no or small compensation, and the training and experience fit the
University’s core function as an education institution. The audit represents very valuable
practical experience for students, and can be performed as part of special course so
students receive a grade. The energy audit should be performed every 3-4 years to
establish new reference point. A comparison with results from previous audits can
compare what was planned and what was actually achieved, and thus identify problem
areas and needed improvements.
6.7 Energy Education and Outreach
A major part of the energy manager’s job will be energy education and outreach to the
whole university population. Mashburn W. H (2001) concludes that raising the energy
education level throughout the organization can have big dividends. The program will
operate more effectively if management understands the complexities of energy, and
particularly the potential for economic benefit. The energy committee members will be
more effective if they are able to prioritize energy conservation measures, and be aware
of the latest technology. The quality and quantity of staff suggestions will improve
significantly with training.
It is important the program raise the awareness among students of the importance of
energy conservation and efficient use. It is also important to offer the opportunity for
students to take an active role in energy management as part of energy committee or as
energy audit team members.
80
One of the best ways to promote an energy conservation program is to publicize it. Some
of the ways to do it are (BEE, 2003):
• Signs and posters raising awareness of the importance of energy efficiency cost
control, and environmental conservation be displayed in the classrooms and
offices.
• Progress charts showing targets and achievements.
• Energy conservation stickers on light switches and thermostats.
• Information on bulletin boards (at each building publish the energy cost for that
building).
• Articles in the O’Colly and other OSU publications.
• Publish achievements in energy management outside the organization, for
example taking part in EPA’s Energy Star program or in National Wildlife
Federation’s Campus ecology program.
• Recognize the extraordinary individuals, and departments for their effort to
conserve energy.
• Institute energy conservation competition among dormitories. Have awards for
the winning dorm and for the best coordinator.
• Publicize current trends in energy use per student.
6.8 Investments and savings
In the first couple of years while the energy management program is still a novelty at the
University, it would be good to concentrate on highly visible projects that attract attention
81
to the issue, but have low cost to medium cost, and do not require a lot of new expertise
and technical knowledge that OSU does not already have.
Important exceptions to this concentration on low and no cost activities should be made
for existing projects. When the cost of delaying an energy conservation project
substantially reduces its benefits, measures should be taken to speed its implementation.
The cost of delaying a project should always be taken into account because delaying the
project implementation also delays the point at which energy savings can begin
(ENERGY STAR, 2002).
An example of an existing project that should definitely be implemented more rapidly
than the planned 10 years is the lighting retrofit. If the University decides to issue bonds
to finance the project so it can be finished in one or two years instead of ten, savings from
this program will be so high that they can pay for bond payments without using the
capital investment funds. This makes for a great advantage of energy efficiency
equipment from other capital equipment. Because the dollars saved by installing energy
efficient equipment can be used to pay for its financing, this equipment can be installed
without having to increase operating costs or use precious capital budget dollars
(ENERGY STAR, 2002).
In the first years of the program, University could assign a proportion of energy savings
back to energy management budget to be used for paying for additional conservation
projects. The reasoning behind this request is that after usually after implementation of
low to medium energy savings projects, the University is going to make considerable
savings at little cost, except for the funding needed for energy manager (BEE, 2003). If
part of these easily achieved savings are not returned to energy manager’s budget, then
82
his/her access to self-generated investment funds to support future activities will be lost.
And later in the program, it is likely to be much harder for the energy manager to make
savings without significant investment. So the main benefit is on the independence and
longevity of the energy management program (BEE, 2003).
One way to avoid hitting the wall after the program has matured and exploited the easier,
less costly savings opportunities, is for the University to consider going into long term, 5-
10 year performance contract with Energy Service Companies (ESCO).
According to Turner, and Capehart (2001) ESCOs provide the auditing, energy and
economic analysis, capital and monitoring to help other organizations reduce their energy
consumption and reduce their expenditures for energy services. By guaranteeing and
sharing the savings from improved energy efficiency and improved productivity, both
groups benefit and prosper.
Under a performance contract, the ESCO insures that the actual energy savings will
match the projected savings, and the contract identifies the procedures by which these
savings will be measured and verified. In a Guaranteed Savings Agreement the ESCO or
an insurance company, who agrees to reimburse the sponsoring organization for any
shortfalls, guarantees performance of the equipment (ENERGY STAR, 2002). By doing
this, performance contracting through an ESCO transfers the technology and
management risks away from the end-user to the ESCO. Additional benefit is that
universities get the energy conservation programs in place by paying for it out of
guaranteed savings, not from capital expenditures. Performance contracts are treated as
an operating expense, not capital.
83
CHAPTER VII
CONCLUSIONS
Energy conservation first entered the minds of people during the oil crisis in the 1970s is
once again becoming important issue in debate concerning the energy policy. On the
national level main benefits of energy conservation are the reduced reliance on imports of
fossil fuel, and a healthier environment. On the local level universities are also finding
that they can do the ‘right’ thing, i.e. conserve energy for betterment of community, while
enjoying significant savings without sacrificing comfort and productivity of students and
faculty members.
By using the Oklahoma State University’s main campus as case study, the steps that
should be made in order to establish a successful energy management program were
explored. The economic analysis of costs and benefits of such potential program was then
performed. The analysis showed that energy management costs over the next ten years
would be less than 1 percent of total energy cost in the same period. The experiences of
institutions described in Green Investment, Green Report by the National Wildlife
Federation and throughout this study, that have energy management programs in place
have shown that the significant energy costs savings can be achieved during the ten-year
period. While each situation is different, those experiences suggest that energy
management programs are highly beneficial for the universities.
84
An attempt has been made to include the social and environmental costs of energy
production, distribution and consumption. Those costs only partly cover the costs of
electrical generation on the environment and health of the end users. The approximation
of full ‘external’ costs is added directly to the unit price of electricity. It has resulted in
increase in the energy costs, and consequently the increase of benefits of energy
conservation. However, an accounting for full environmental costs is not mandated by
law or regulation. Ignoring the ‘external’ costs might seem more reasonable, but the
University, which, by its very nature of educating students and performing research
concerned about betterment of the future, should apply the long term, sustainability
driven approach in all its operations. Such an approach would require the University,
which is also public institution to be concerned about the present and future state of
community and its individual members.
There are numerous ways for this University to incorporate the sustainability and social
responsibility into its policies and actions. Incorporating the ‘external’, ‘social’ or
‘environmental’ costs of energy consumptions into economic analysis and supporting
even the conservation projects that are profitable only when full costs are considered, is a
way the University would make a first major step on the road towards sustainability.
Calculations for the energy management project showed that direct costs of salary of
energy manager and work-hours of committee members directly involved in energy
management program could be easily calculated. The benefits of energy management
program are not as easily calculated, but it was shown that savings from adoption of only
three minor projects would more than cover the costs.
85
In order to justify the establishment of proposed energy management program and
creation of position of energy manager as program leader, the benefits and costs analysis
of each energy management project have to be performed. The sum of discounted
benefits of all individual projects is then to be divided by the discounted sum of energy
management costs in order to get a benefit cost ratio. The estimated benefit-cost ratio is
above 2.0, thus it would be safe to conclude that the energy management program would
be successful and beneficial for the University.
If taken individually, projects listed in Appendix B and presented throughout this study
can be more or less easy implemented through existing management structure without
creating new management position. However, exploiting all possible projects in order to
achieve maximum savings would, most definitely, require the constant attention,
vigilance and enthusiasm that cannot be achieved by adding yet another responsibility to
existing Physical Plant personnel. Constant focus and effort on finding new and exploring
existing energy conservation opportunities can be achieved only through the full-time
position of an energy manager and energy management program that has public support
of Senior Administration. The main points of such potential Energy management
Program headed with Energy Manager are as follows:
1. Development of new university policies as basis of Energy Management:
a. Energy Management Policy – completely updated and expanded with concrete
goals and objectives (example: in 2015, 30 percent less energy consumption per
square foot, 10 percent energy to come from renewable sources (wind, geothermal
and solar).
86
b. Green Building Policy – University’s commitment for designing all new buildings
and major renovations by following LEED green building rating requirements.
2. Establishment of Energy Manager Position to coordinate and lead all energy
management activities.
3. Revitalization of the Energy Conservation Committee to steer the program and
provide access and input from all part of the University. The Committee should
include representatives from Physical Plant, Administration, faculty, staff, and
students.
4. Formation of an Energy Conservation Action Group as an inter-Physical Plant group
that coordinates all everyday activities related to energy management.
5. The Energy Manager should document and regularly publicize achievements.
6. Perform an energy audit every 2 to 3 years to get a detailed analysis of current state of
energy use and management, and to specifically identify possible areas available for
improvement and recommend the future steps. Graduate and undergraduate students
should conduct it as part of special practicum or capstone course.
7. Set annual, easy to track quantifiable goals. Prepare detailed plan of activities, and
system for documenting and following the program.
8. An important part of the program is raising the awareness of energy issues among
students, but also to offer an opportunity for students to learn by taking an active role
in energy management as end users and as members of energy committee or as
energy audit team members.
9. Educate administration, faculty, and staff about the conservation opportunities.
87
10. For the first 3-4 years, the Energy Management Program should concentrate on low-
cost to medium-cost investments, and high cost investments with high returns that
have paybacks (or ROI) in short/medium range and that do not require a lot of new
outside expertise and technical knowledge.
11. Senior Administration and OSU Regents should accept that part of the savings made
as result of energy conservation activities are reinvested in additional energy
conservation programs in order to enable energy manager to develop projects that are
still lucrative, but have longer paybacks. Without reinvesting part of savings back into
conservation projects the energy management program would be, after certain point,
limited in its success and the University would loose an opportunity to maximize the
savings.
12. After the program has matured and exploited all low cost conservation opportunities,
the University should consider partnering with Energy Service Company (ESCO) into
7 to 10 year long performance contract. Benefit of such contracts is that universities
get the energy conservation projects in place without out-of pocket money (through
bonds or tax-exempt lease purchases), but pay the rates through savings achieved for
duration of contract, after the contract have been fulfilled university keeps whole
savings. (ESCO usually guarantee the minimum level of annual savings).
7.1 Limitations of the Study
An important limiting factor in this study has been the lack of established baseline data.
In order to develop and calculate the examples, number of assumptions had to be made.
88
The results of such calculations are, therefore, sensitive to the validity of assumptions and
their changing nature.
Due to lack of data, the cost and benefit calculations did not include the savings in
cooling and heating that are by-products of presented energy conservation projects. Most
of the calculations did not include the savings from lower operation and maintenance
costs achieved through implementation of conservation programs. If those savings were
included the Net Present Value of the project would be even higher. This is likely to be
solved only when full energy audit is performed.
The size of the University campus was assumed to be fixed. However the University will
probably expand significantly in both size and number of buildings in the next ten years
in order to accommodate the expected increase in number of students.
Most calculations use a fixed price for electricity or energy. However these values are
subject to change over time. The estimates of external costs of electricity production were
taken from the European Union’s project ExternE, since no comparable study in US was
found. The only attempt to account for possible differences in effects, regulations and
technologies used was to use low value of the ExternE cost for calculations in this study.
While the social costs of using electricity were estimated, the social costs of producing
steam and chilled water by burning natural gas were not estimated due to lack of data. Of
course, the underlying limitation was the extent of creative capabilities and expertise of
study author.
89
7.2 Recommendations for the Future Study
There is a pressing need to calculate costs of changing the attitudes and behaviors of
energy users at Oklahoma State University, in order to get a complete list of all the costs
and benefits of the energy management program. Since the energy management program
will only be successful if the students, faculty, and staff accept the changes, the study is
needed in order to identify the changes that are acceptable to users, the ones that are not,
and the reasoning behind the both. This data can be used then to help the energy manager
design an effective energy management program. Such a program can only be developed
after the baseline has been established though the energy audit. At Oklahoma State
University, an energy audit has not been conducted for at least 15 years, so there is a
great need for one. The costs and benefits have to be calculated for a number of other
energy management projects, some of which are listed in appendix B, in order to get the
total costs and benefits of the proposed energy management system. The costs and
benefits should, also, be calculated on per student basis where appropriate. The results of
these calculations and all other accomplishments should be promoted in the University
and also through professional organizations like the National Wildlife Federation’s
Campus Ecology Program.
The further study is needed to calculate the costs and benefits of developing a
comprehensive environmental management system for Oklahoma State University. Such
a comprehensive management system would encompass, not only the energy
management, but also solid waste management, hazardous waste management, water
management, recycling, purchasing policies, landscaping, and other greening initiatives.
90
BIBLIOGRAPHY
Allen, A. S. (1999) “Institutional Environmental Change at Tulane University.” B.Sc. Thesis, Tulane Environmental Studies Program, 1999 http://www.tulane.edu/~greenclb/thesis/
BEE (2003) “General Aspects of Energy Management and Energy Audit” Bureau of Energy Efficiency, Ministry of Power, Government of India New Delhi India 2003
Bayview (2003) Vending Mi$er, Bayview Technologies Inc. 2003, www.bayviewtech.com
Biggs, R. B., Nestel, G.K. (1996) “ISO 14000: A Building Block for Redefining Environmental Protection and Moving Toward Sustainable Development”, Roy F. Weston, Inc. http://www.westonsolutions.com/publications/SDArchive/ISO/iso.htm
Bjornstad, D. (2003) “Cost-Benefit Analysis” On-line Tutorial, National Center for Environmental Decision Making Research, University of Tennessee, Knoxville. http://www.ncedr.org/tools/othertools/costbenefit/lead.htm
Capehart, B.L, Spiller, M.B.(2001) “Energy Auditing” p. 21-36 in Wayne C. Turner (ed): Energy Management Handbook, The Fairmont Press, Lilburn, GA, 2001
Dickerman, R. N. (2002) “A New Curriculum: Energy Outsourcing Brings Cost and Energy Benefits.” College Planning & Management, January 2002
Downing, T. (2004) Personal Communication on April 21, 2004, Energy Manager, Yale University, Plant Engineering Department
Eagan, D. J., Keniry, J. (1998) “Green Investment, Green Return: Ho Practical Conservation Projects Save Millions on America’s Campuses.” National Wildlife Federation, 1998, Washington DC.
91
EIA (1995) “Electricity Generation and Environmental Externalities: Case Studies.” Energy Information Administration, U.S. Department of Energy, Washington, DC. September 1995. http://www.eia.doe.gov/cneaf/electricity/external/external.pdf
ENERGY STAR (2002) “Finding Money For Your Energy Efficiency Projects: A Primer for Public Sector Energy, Facility, and Financial Managers.” ENERGY STAR Program, U.S. Environmental Protection Agency, January 2002, http://www.energystar.gov/ia/business/COO-CFO_Paper_final.pdf
EPA (2000) “Guidelines for Performing Economic Analyses.” U.S. Environmental Protection Agency, Washington, DC, September 2000 http://yosemite.epa.gov/ee/epa/eermfile.nsf/vwAN/EE-0228C-07.pdf/$File/EE-0228C-07.pdf
European Commission (2003) “External Costs: Research results on socio-environmental damages due to electricity and transport”, Directorate-General for Research, European Commission, Luxembourg, 2003. http://www.nei.org/documents/EC_External_Costs_Study.pdf
ExternE (2004) “Externalities of Energy. A Research Project of European Commission”, Introduction, March 25, 2004 http://www.externe.info/
Ferguson, D. (2004) Personal Communication on February – April, 2004, Physical Plant, Oklahoma State University,
Fickes, M. (2002) “Battling Utility Costs.” College Planning & Management, October 2002
Gilpin, A. (1999) “ Environmental Economics: a critical overview.” John Wiley & Sons Ltd. Chichester, England
Harvey, C. M. (1992) “A Slow Discounting model for Energy Conservation.” Interfaces v. 22 no. 6, November-December 1992, p. 47-60, The Institute of Management Sciences
Haugland, T. (1996) “Social Benefits of Financial Investment Support in Energy Conservation Policy.” Energy Journal, 1996, Vol. 17 Issue 2, p. 79-103
Kats, G., Alevantis, L., Berman, A., Evan Mills, and Perlman, J. (2003) “The Costs and Financial Benefits of Green Buildings.” California's Sustainable Building Task Force.” October 2003 http://www.ciwmb.ca.gov/greenbuilding/Design/CostBenefit/Report.pdf
92
Kaya, D. (2003) Energy Conservation Opportunities in Lightning Systems, Energy Engineering, vol. 100, No. 4 2003, p. 37-57
Kopp, R.J., Krupnick, A. J., and Toman, M. (1997) “Cost-Benefit Analysis and Regulatory Reform: An Assessment of the Science and the Art.” Resources for the Future¸ January 1997. http://www.rff.org/Documents/RFF-DP-97-19.pdf
Maniccia, D. et al. (2000) The effects of changing occupancy sensor timeout setting on energy savings, lamp cycling, and maintenance costs, Rensselaer Polytechnic Institute, 8/16/2000, www.lrc.rpi.edu/resources/pdf/dorene2.pdf
Mashburn W. H (2001) “Effective Energy Management” p. 7-20 in Wayne C. Turner (ed): Energy Management Handbook, The Fairmont Press, Lilburn, GA, 2001
Maxwell, T. (2004) Personal Communication on February – April, 2004, Physical Plant, Oklahoma State University
MnTAP (2004) Energy Conservation – Lighting, University of Minnesota, Minnesota Technical Assistance Program, 2004, http://mntap.umn.edu/energy/lighting.htm
Nadel, S. and Geller, H. (2001) “Smart Energy Policies: Saving Money And Reducing Pollutant Emissions Through Greater Energy Efficiency.” American Council for an Energy-Efficient Economy, September 2001, http://www.aceee.org/pubs/e012full.pdf
Navrud, S., and Pruckner, G. J. (1997) “Environmental Valuation – To Use or Not to Use? A Comparative Study of the United States and Europe” Environmental and Resource Economics 10/1997: p. 1–26, Kluwer Academic Publishers, Netherlands.
Pearce, J. M., and Uhl, C. F. (2003) “Getting It Done: Effective Sustainable Policy Implementation at the University Level” Planning for Higher Education. 31(3) March-May 2003, p. 53-61, http://www.bio.psu.edu/greendestiny/publications/gdc-pfhe-31-3.pdf
Penn Environmental Group (1996) “Campus Environmental Audit.” The University of Pennsylvania, May 1, 1996 http://dolphin.upenn.edu/~pennenv/audit/
PERC (1995) “Environmental Audit of Princeton University”, Princeton Environmental Reform Committee (PERC), Princeton University http://web.princeton.edu/sites/PEI/percaudit.htm
93
Phillips Petroleum (1990) “30 Simple Things You can Do to Save Energy” 1990 Phillips Petroleum Company
OSU (1983) “Energy Management”, General University, Oklahoma State University Policy and Procedures, February 1983, http://home.okstate.edu/policy.nsf/8dcae8236e8e12b5862562c200782b3d/49851c5318abee3a862562d80077aa82!OpenDocument&Highlight=0,energy
OSU (2003) “Physical Plant Services Strategic Plan”, Physical Plant Department, Oklahoma State University, 2003, http://www.pp.okstate.edu/document/pps%20strategic%20plan.pdf
Sheldon, M. (2004), Personal Communication on April 2, 2004, Oklahoma State University, Information Technology Division
Simpson W. (2001) “Environmental Stewardship and the Green Campus: the Special Role of Facilities Managers.” UB Green Office, SUNY at Buffalo http://wings.buffalo.edu/ubgreen/documents/resources/envstewardship.pdf
Simpson W. (2003) “Energy Sustainability and the Green Campus.” Planning for Higher Education. March–May 2003, p. 150-158
Stewart, J. (2001) “Energy Management Plan for Oklahoma State University”, Physical Plant, Stillwater, Oklahoma July, 2001
Stewart, J (2004) Personal Communication on February – April, 2004, Oklahoma State University, Physical Plant
Sutherland, R. J. (2000) “No Cost' Efforts to Reduce Carbon Emissions in the U.S.: An Economic Perspective.” Energy Journal, 2000, Vol. 21, Issue 3, p89-113
Turner, W. C., Capehart, B. L. (2001) “Introduction” p.1-6 in Wayne C. Turner (ed): Energy Management Handbook, The Fairmont Press, Lilburn, GA, 2001
UB Green (2002) “Guide to Campus Energy Policies, UB Green Office, SUNY Buffalo, http://wings.buffalo.edu/ubgreen/documents/programs/energyconservation/guide_campusenergy.doc
UB Green (2003) Energy Conservation, State University of New York at Buffalo - UB GREEN http://wings.buffalo.edu/ubgreen/content/programs/energyconservation/main.html
94
UBC Campus Sustainability Office (2002) “Energy and Water Targets and Action Plan: Moving Sustainable Development at UBC from Policy to Practice.” The University of British Columbia, January 2002, http://www.sustain.ubc.ca/pdfs/plan.PDF
UBC Campus Sustainability Office (2003a) “Annual Report Progress Towards A Sustainable Campus.” The University of British Columbia, May 2003, http://www.sustain.ubc.ca/pdfs/annual2003cb.PDF
UBC Campus Sustainability Office (2003b) Energy & Water Management Program, The University of British Columbia, http://www.ecotrek.ubc.ca/index.htm
UBC Campus Sustainability Office (2004) Sustainable Energy Management Program, The University of British Columbia, http://www.sustain.ubc.ca/energy.html
Voss, A. (2001) “LCA and External Costs in Comparative Assessment of Electricity Chains. Decision Support for Sustainable Electricity Provision?” in Externalities and Energy Policy: The Life Cycle Analysis Approach, Workshop Proceedings Paris, France 15-16 November 2001, Nuclear Energy Agency, OECD, pp. 163-182. http://www.nea.fr/html/ndd/reports/2002/nea3676-externalities.pdf
Watkins, T. (2002) “Introduction to Cost Benefit Analysis.” San José State University Economics Department, http://www2.sjsu.edu/faculty/watkins/cba.htm
Wilson, R., Holland, M., Rabl, A., and Dreicer M. (1999) “Comparative Risk Assessments of Energy Options: The Meaning of Results” IAEA Bulletin, 4, January 1999. p. 14-18, http://www.iaea.org/Publications/Magazines/Bulletin/Bull411/article4.pdf
Woodroof, E. A (2001) “Lightning” p. 349-392 in Wayne C. Turner (ed): Energy Management Handbook, The Fairmont Press, Lilburn, GA, 2001
Zeloznicki, S. (2000) “Do You Need an Energy Master Plan?” College Planning & Management, July 2000
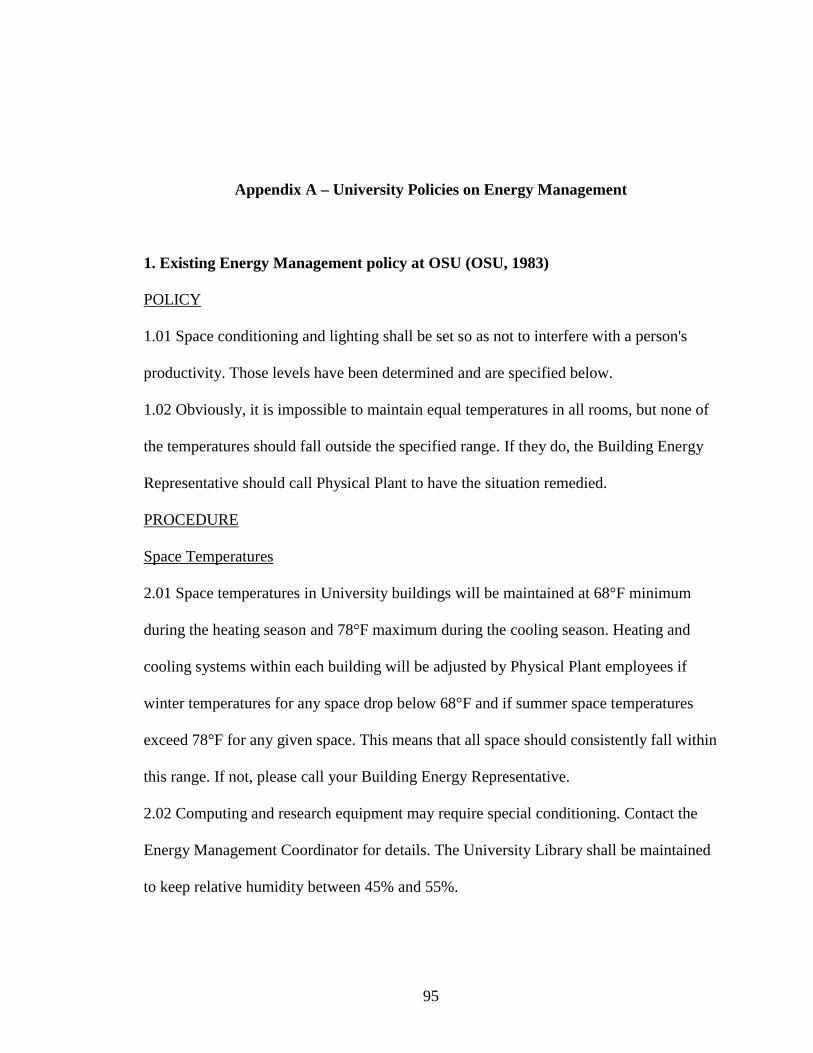
95
Appendix A – University Policies on Energy Management
1. Existing Energy Management policy at OSU (OSU, 1983)
POLICY
1.01 Space conditioning and lighting shall be set so as not to interfere with a person's
productivity. Those levels have been determined and are specified below.
1.02 Obviously, it is impossible to maintain equal temperatures in all rooms, but none of
the temperatures should fall outside the specified range. If they do, the Building Energy
Representative should call Physical Plant to have the situation remedied.
PROCEDURE
Space Temperatures
2.01 Space temperatures in University buildings will be maintained at 68°F minimum
during the heating season and 78°F maximum during the cooling season. Heating and
cooling systems within each building will be adjusted by Physical Plant employees if
winter temperatures for any space drop below 68°F and if summer space temperatures
exceed 78°F for any given space. This means that all space should consistently fall within
this range. If not, please call your Building Energy Representative.
2.02 Computing and research equipment may require special conditioning. Contact the
Energy Management Coordinator for details. The University Library shall be maintained
to keep relative humidity between 45% and 55%.
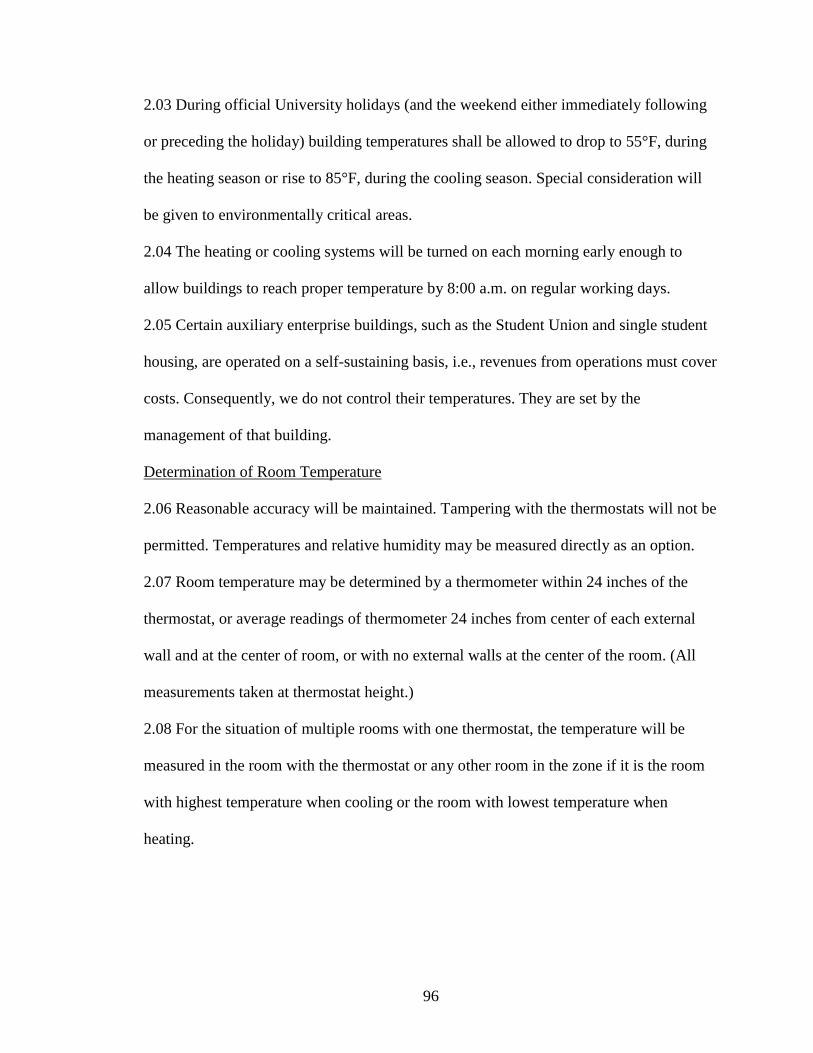
96
2.03 During official University holidays (and the weekend either immediately following
or preceding the holiday) building temperatures shall be allowed to drop to 55°F, during
the heating season or rise to 85°F, during the cooling season. Special consideration will
be given to environmentally critical areas.
2.04 The heating or cooling systems will be turned on each morning early enough to
allow buildings to reach proper temperature by 8:00 a.m. on regular working days.
2.05 Certain auxiliary enterprise buildings, such as the Student Union and single student
housing, are operated on a self-sustaining basis, i.e., revenues from operations must cover
costs. Consequently, we do not control their temperatures. They are set by the
management of that building.
Determination of Room Temperature
2.06 Reasonable accuracy will be maintained. Tampering with the thermostats will not be
permitted. Temperatures and relative humidity may be measured directly as an option.
2.07 Room temperature may be determined by a thermometer within 24 inches of the
thermostat, or average readings of thermometer 24 inches from center of each external
wall and at the center of room, or with no external walls at the center of the room. (All
measurements taken at thermostat height.)
2.08 For the situation of multiple rooms with one thermostat, the temperature will be
measured in the room with the thermostat or any other room in the zone if it is the room
with highest temperature when cooling or the room with lowest temperature when
heating.
97
Portable Electric Heaters
2.09 Portable electric heaters or any other energy consuming warming devices are not to
be used without approval from the Energy Conservation Committee or the Energy
Management Coordinator. Approval may be obtained for reasons similar to the following
examples:
(a) A person required to work overtime during a period when the
building's heat is to be set back (holidays, weekends, etc.) may use
auxiliary heat.
(b) Documented medical needs (see paragraph 2.18).
2.10 Unauthorized heating devices may be confiscated. Fuel burning devices are not to be
used. These devices are prohibited by local and state fire codes.
2.11 Window Air Conditioners - Additional window air conditioners will not be installed
in University buildings. Existing window air conditioners will be phased out as soon as
possible. Exceptions to this policy must be approved in advance by the Energy
Management Coordinator or Energy Conservation Committee.
2.12 Ventilation - Windows should not be open when buildings are being heated or
cooled.
2.13 Blinds/Shades - Close blinds and shades on sunlit windows during the cooling
season (east windows during morning hours and west windows during the afternoon).
Close east blinds at night to reduce morning heat gain. During the heating season, close
blinds and shades at night to reduce heat loss.
2.14 Lighting - Lights should be turned off in any unoccupied space.
98
2.15 Domestic Hot Water - No hot water will be supplied to lavatories in public
restrooms. Hot water supplied to laboratory sinks, custodial sinks, etc., will be heated no
higher than 105`F. Higher temperatures will be allowed for special requirements such as
dish and glass washers, sterilizers, etc.
2.16 Auxiliary Fans - Ventilating or free standing fans may be used at any time to
increase comfort levels within a space.
2.17 Classroom Scheduling - Scheduling of space shall first utilize all available areas
normally conditioned as a part of a larger area. After all such areas have been filled, new
zones may be opened and conditioned for use as required. Special needs requiring
specific facilities will be accommodated.
2.18 Medical Exemptions - The use of low wattage, thermostatically controlled, electric
heated floor mats for persons with documented medical needs will be allowed.
Authorization for use must be obtained from the Energy Conservation Committee or the
Energy Management Coordinator.
Approved by Energy Conservation Committee: January 1983
Approved by Executive Group: February 7, 1983
99
2. Proposed polices3 Oklahoma State University Energy Policy
Oklahoma State University is committed to continually improving its performance in
energy management in all areas of operation. Oklahoma State University is pursuing
increased energy conservation, which will result in both cost savings and decrease in
environmental impacts associated with energy production and consumption.
The University will:
Create and maintain Energy Management program to enable on-going progress in the
energy efficient operation of our campuses.
Adhere to principles of green building design for all new construction and major
renovations.
Purchase only energy efficient equipment, consistent with performance and durability.
Maintain or establish energy conservation and efficiency as priorities in facilities
maintenance and operation.
Consistently implement University heating and air conditioning policies.
Identify and implement in-house energy conservation projects paid for out of University
operations budgets.
Evaluate prospective energy conservation and efficiency capital improvement projects on
the basis of life cycle cost-benefit analysis.
3 Proposed policies presented here are based on policies of SUNY at Buffalo, Yale University, University of British Columbia, and OSU Energy Management Policy
100
Explore methods for redirecting some portion of energy conservation dollar savings to
fund additional conservation measures.
Utilize creative funding mechanisms and energy service companies to accelerate action
on larger energy conservation and efficiency projects, which can pay for themselves.
Continue efforts to raise energy awareness on campus.
Minimize SOX, NOX and CO2 emissions from campus fossil fuel burning equipment.
Explore and act on opportunities to purchase clean, renewable power.
Provide support for clean energy research on campus.
Provide support for community-based clean energy initiatives.
Our campus energy goals will be to:
1. Reduce campus energy consumption per square foot by an 30% by the year 2015
2. Use at least 10% of renewable energy by the year 2015.
Energy Management Program Implementation:
The Energy Management Program shall be administered through Physical Plant.
The Energy Manager reporting directly to the Associate Vice President for Physical
Plant, and working with all sectors in the University is responsible for carrying out the
Energy Management Program.
The Energy Manger will establish Energy Committee with representatives from
administration, faculty, students and staff. Energy Committee purpose is to help develop
strategic plans, advise the Energy Manager on the operation of the Energy Management
101
Program, provide assistance on specific tasks when needed, and act as a strong voice in
support of energy conservation measures.
The Energy Manger will establish Energy Task Group with relevant Physical Plant
personnel as members. The purpose of Energy Task Group is to coordinate the
implementation of energy management program among various Physical Plant
departments.
Energy Manager shall provide for energy training and awareness programs at all levels of
the University.
Energy Manager shall keep the Associate Vice President advised of all efforts to increase
energy efficiency at University.
Energy committee and senior administration will perform regular annual reviews of
Energy Management Program as part of University’s commitment to continual
improvement expressed in this policy. It is the responsibility of Energy Manager to
prepare the required reports for such review.
Heating and Air Conditioning Policy
The heating or cooling systems will be turned on each morning early enough to allow
buildings to reach proper temperature by 8:00 a.m. on regular working days
Heating or cooling for academic program purposes will be provided on weekends and
off-hours as needed. The Action Desk should receive requests for off-hour/holiday
heating by 12:00pm of the proceeding business day.
The Physical Plant will utilize the most energy efficient means of supplying heat for the
approved off-hour/holiday requests.
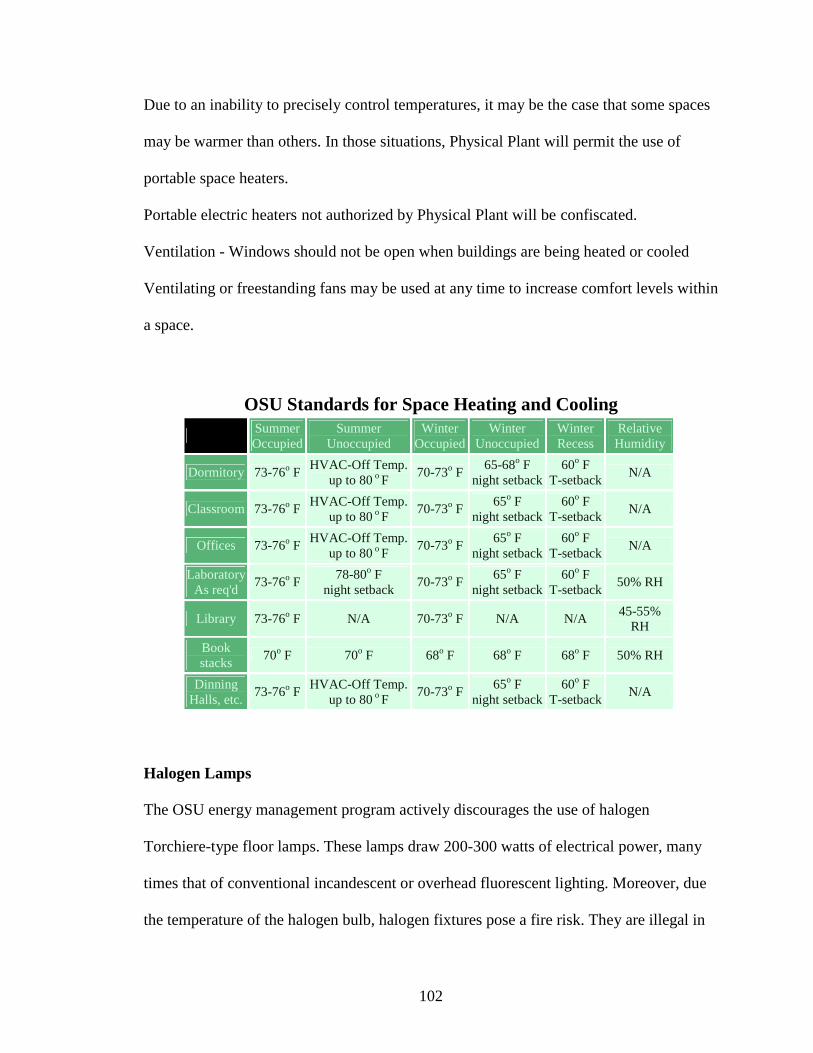
102
Due to an inability to precisely control temperatures, it may be the case that some spaces
may be warmer than others. In those situations, Physical Plant will permit the use of
portable space heaters.
Portable electric heaters not authorized by Physical Plant will be confiscated.
Ventilation - Windows should not be open when buildings are being heated or cooled
Ventilating or freestanding fans may be used at any time to increase comfort levels within
a space.
OSU Standards for Space Heating and Cooling Summer
Occupied Summer
Unoccupied Winter
OccupiedWinter
UnoccupiedWinter Recess
Relative Humidity
Dormitory 73-76o F HVAC-Off Temp.up to 80 o F 70-73o F 65-68o F
night setback60o F
T-setback N/A
Classroom 73-76o F HVAC-Off Temp.up to 80 o F 70-73o F 65o F
night setback60o F
T-setback N/A
Offices 73-76o F HVAC-Off Temp.up to 80 o F 70-73o F 65o F
night setback60o F
T-setback N/A
LaboratoryAs req'd 73-76o F 78-80o F
night setback 70-73o F 65o F night setback
60o F T-setback 50% RH
Library 73-76o F N/A 70-73o F N/A N/A 45-55% RH
Book stacks 70o F 70o F 68o F 68o F 68o F 50% RH
Dinning Halls, etc. 73-76o F HVAC-Off Temp.
up to 80 o F 70-73o F 65o F night setback
60o F T-setback N/A
Halogen Lamps
The OSU energy management program actively discourages the use of halogen
Torchiere-type floor lamps. These lamps draw 200-300 watts of electrical power, many
times that of conventional incandescent or overhead fluorescent lighting. Moreover, due
the temperature of the halogen bulb, halogen fixtures pose a fire risk. They are illegal in
103
all campus buildings.
Computer policy
Leaving a 150-watt computer operating continuously for one year uses an amount of
energy equivalent to a 1,000 pounds of coal or over 100 gallons of oil. That translates
into a lot of pollution, health and environmental costs. Furthermore, it costs the
University over $75 a year per computer in electricity and additional cooling costs.
Office use
University asks everybody to help lower the energy consumption by not leaving
computers on continuously. To save energy, enable power management features so your
computer saves energy when on. And please turn off your computer at the end of working
day and over weekends.
Computer Lab Use
On all computers power management features have to be enabled. In addition in
computer labs that are not operating 24/7, computers must be turned off before closing. In
computer labs that are operating 24/7 will, after determining the use during the night and
weekends, designate the optimal number of computers to be turned off during the times
of low use (nights and weekends).
104
Appendix B - Examples of Low to Medium Cost Projects
• Energy Audit.
• Computer operations and green computing policy (Activating Energy Star
features on electrical equipment, turning them off when not needed).
• Develop equipment energy efficiency purchasing standards.
• Review of heating and cooling season temperature settings.
• Review of building HVAC and fan schedules, review of night setback.
• Instituting temperature setbacks during breaks, if needed.
• Synchronizing heating and cooling systems so that they do not run simultaneously
in the same room.
• Ban of halogen lamps.
• Outreach Program Promoting Energy Efficiency: develop OSU’s energy
conservation website, establish cooperation on conservation with staff within the
Physical Plant, with student groups, with faculty and staff and with outside
organizations.
• Initiate inter-dormitory or inter-building competitions for energy efficiency.
• Develop Energy conservation practices for residence halls and student apartments.
• Offer incentives for students to buy Energy Star appliances for their dorm rooms.
• Improve heating and insulation system of dormitory rooms.
105
• Install motion and daylight sensors in campus bathrooms, classrooms, and offices
and possibly even hallways (saves 25-50% of electricity, up to 75% in bathrooms,
not counting lower cooling load).
• Replace all regular showerheads with low-flow aerated showerheads. Low-flow
showerheads cut water use up to 50%, and thus lower the cost of heating the
water.
• Vending Mi$er – energy saving device for vending machines that, if installed
would save OSU over $14,000 a year in electricity (not counting lower cooling
cost during summer) with simple payback in less than two years.
• Spectrally Selective Window Film – by enhancing the ability of existing glass to
significantly reduce solar heat gain during the summer, and by insulating against
heat loss by as much as 15 percent it helps save the energy all year round, all
without darkening building interiors or changing a building's aesthetic
appearance. Film can be applied on the interior of existing glass window thus
significantly lowering the installation labor costs.
• Green design for new construction and major renovations, also at least one person
at Physical Plant LEED certified, thus eliminating charges to the projects by
outside consultants.
• Incorporate passive solar design in the construction of new buildings, use
geothermal for HVAC systems.
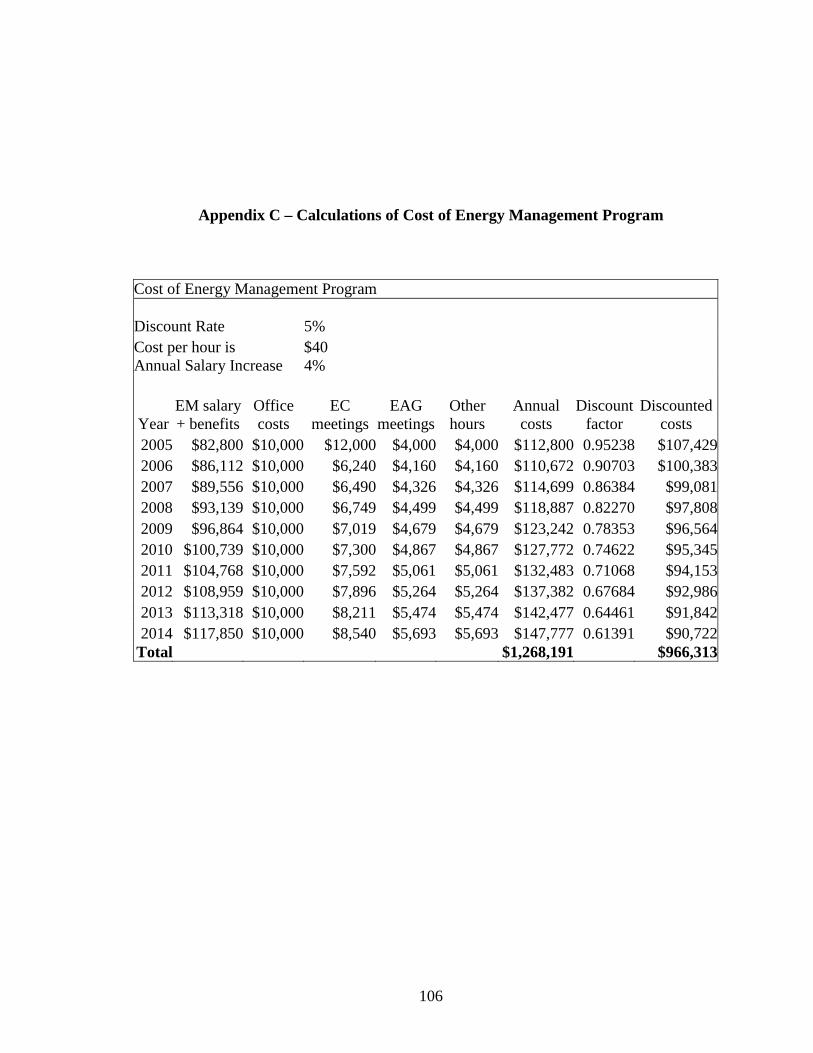
106
Appendix C – Calculations of Cost of Energy Management Program
Cost of Energy Management Program Discount Rate 5% Cost per hour is $40 Annual Salary Increase 4%
Year EM salary + benefits
Office costs
EC meetings
EAG meetings
Other hours
Annual costs
Discount factor
Discounted costs
2005 $82,800 $10,000 $12,000 $4,000 $4,000 $112,800 0.95238 $107,4292006 $86,112 $10,000 $6,240 $4,160 $4,160 $110,672 0.90703 $100,3832007 $89,556 $10,000 $6,490 $4,326 $4,326 $114,699 0.86384 $99,0812008 $93,139 $10,000 $6,749 $4,499 $4,499 $118,887 0.82270 $97,8082009 $96,864 $10,000 $7,019 $4,679 $4,679 $123,242 0.78353 $96,5642010 $100,739 $10,000 $7,300 $4,867 $4,867 $127,772 0.74622 $95,3452011 $104,768 $10,000 $7,592 $5,061 $5,061 $132,483 0.71068 $94,1532012 $108,959 $10,000 $7,896 $5,264 $5,264 $137,382 0.67684 $92,9862013 $113,318 $10,000 $8,211 $5,474 $5,474 $142,477 0.64461 $91,8422014 $117,850 $10,000 $8,540 $5,693 $5,693 $147,777 0.61391 $90,722
Total $1,268,191 $966,313
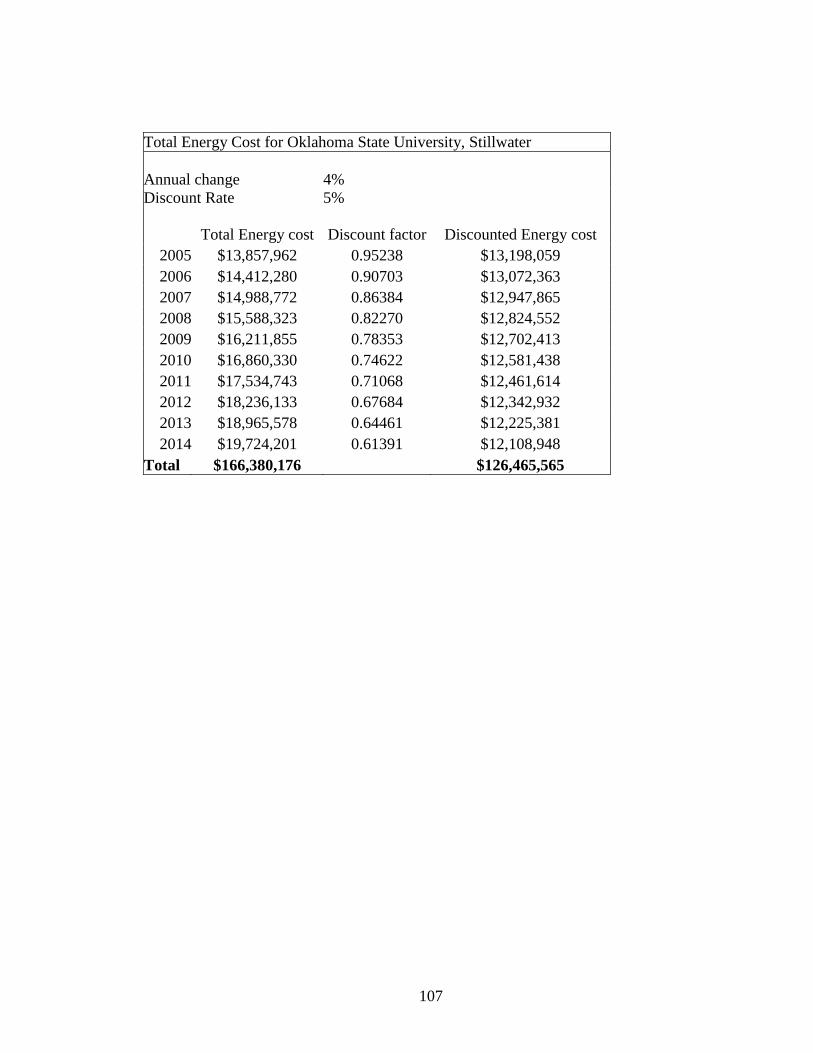
107
Total Energy Cost for Oklahoma State University, Stillwater Annual change 4% Discount Rate 5%
Total Energy cost Discount factor Discounted Energy cost 2005 $13,857,962 0.95238 $13,198,059 2006 $14,412,280 0.90703 $13,072,363 2007 $14,988,772 0.86384 $12,947,865 2008 $15,588,323 0.82270 $12,824,552 2009 $16,211,855 0.78353 $12,702,413 2010 $16,860,330 0.74622 $12,581,438 2011 $17,534,743 0.71068 $12,461,614 2012 $18,236,133 0.67684 $12,342,932 2013 $18,965,578 0.64461 $12,225,381 2014 $19,724,201 0.61391 $12,108,948
Total $166,380,176 $126,465,565
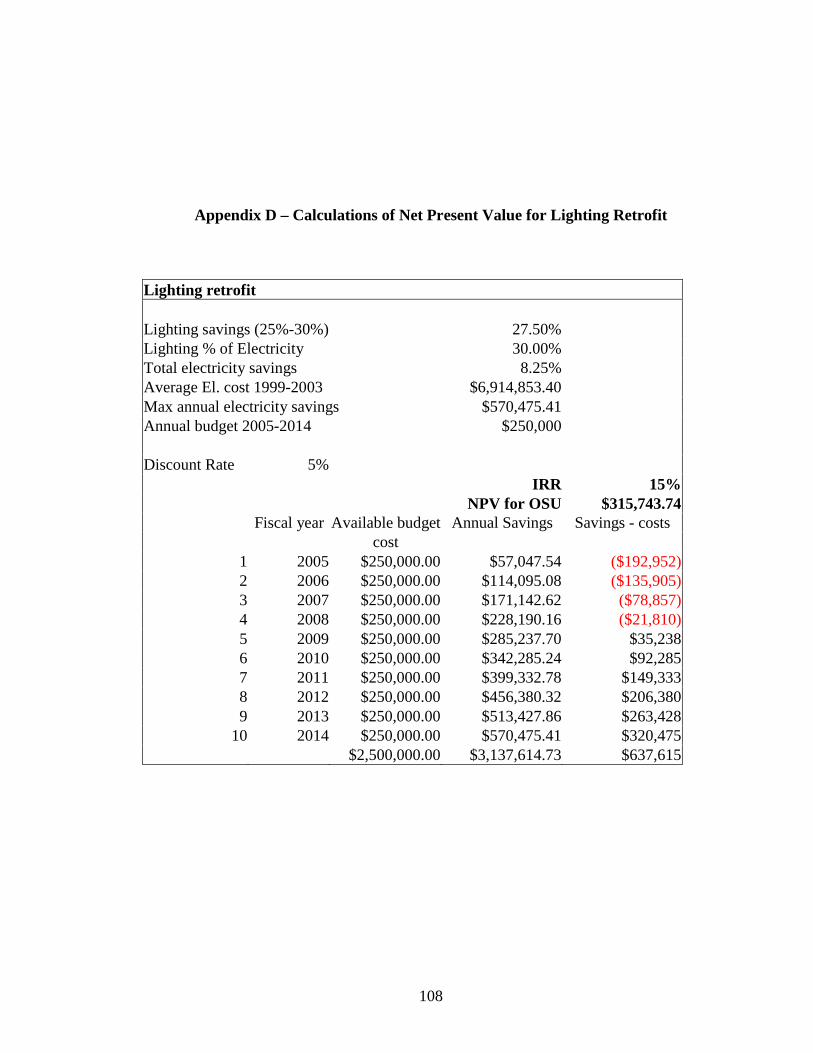
108
Appendix D – Calculations of Net Present Value for Lighting Retrofit
Lighting retrofit Lighting savings (25%-30%) 27.50% Lighting % of Electricity 30.00% Total electricity savings 8.25% Average El. cost 1999-2003 $6,914,853.40 Max annual electricity savings $570,475.41 Annual budget 2005-2014 $250,000 Discount Rate 5% IRR 15% NPV for OSU $315,743.74 Fiscal year Available budget Annual Savings Savings - costs cost
1 2005 $250,000.00 $57,047.54 ($192,952)2 2006 $250,000.00 $114,095.08 ($135,905)3 2007 $250,000.00 $171,142.62 ($78,857)4 2008 $250,000.00 $228,190.16 ($21,810)5 2009 $250,000.00 $285,237.70 $35,238 6 2010 $250,000.00 $342,285.24 $92,285 7 2011 $250,000.00 $399,332.78 $149,333 8 2012 $250,000.00 $456,380.32 $206,380 9 2013 $250,000.00 $513,427.86 $263,428
10 2014 $250,000.00 $570,475.41 $320,475 $2,500,000.00 $3,137,614.73 $637,615
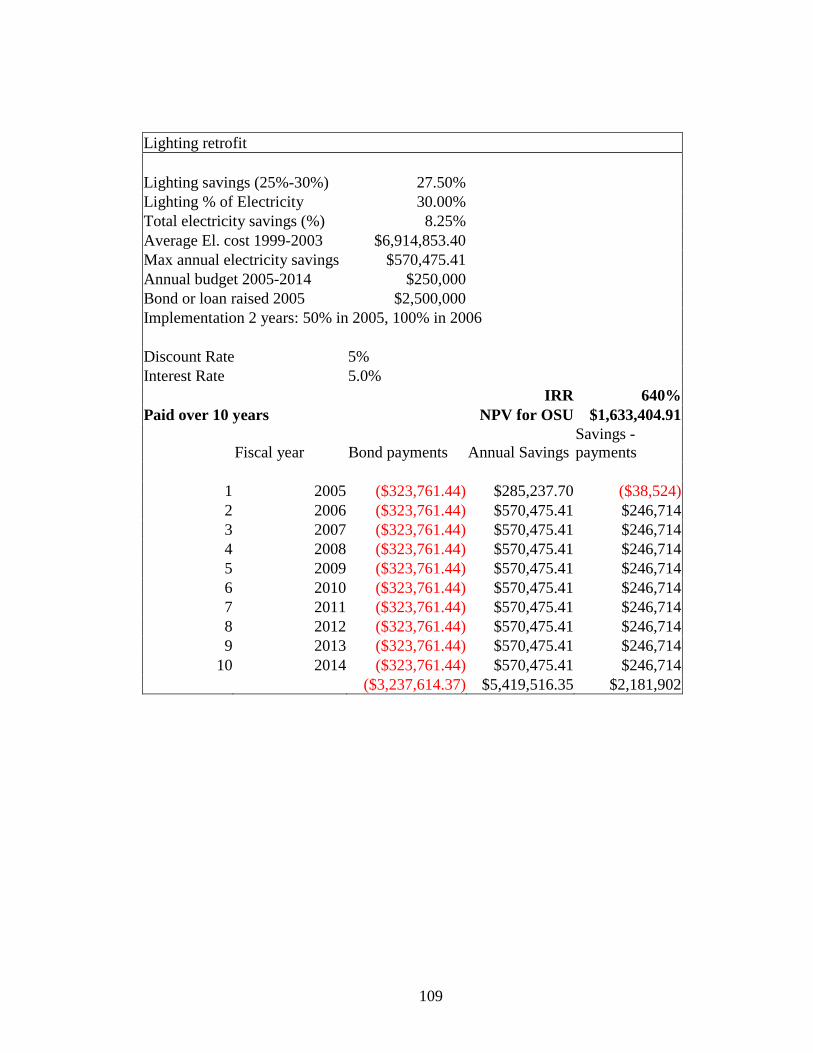
109
Lighting retrofit Lighting savings (25%-30%) 27.50% Lighting % of Electricity 30.00% Total electricity savings (%) 8.25% Average El. cost 1999-2003 $6,914,853.40 Max annual electricity savings $570,475.41 Annual budget 2005-2014 $250,000 Bond or loan raised 2005 $2,500,000 Implementation 2 years: 50% in 2005, 100% in 2006 Discount Rate 5% Interest Rate 5.0% IRR 640%Paid over 10 years NPV for OSU $1,633,404.91
Fiscal year Bond payments Annual SavingsSavings - payments
1 2005 ($323,761.44) $285,237.70 ($38,524)2 2006 ($323,761.44) $570,475.41 $246,714 3 2007 ($323,761.44) $570,475.41 $246,714 4 2008 ($323,761.44) $570,475.41 $246,714 5 2009 ($323,761.44) $570,475.41 $246,714 6 2010 ($323,761.44) $570,475.41 $246,714 7 2011 ($323,761.44) $570,475.41 $246,714 8 2012 ($323,761.44) $570,475.41 $246,714 9 2013 ($323,761.44) $570,475.41 $246,714
10 2014 ($323,761.44) $570,475.41 $246,714 ($3,237,614.37) $5,419,516.35 $2,181,902
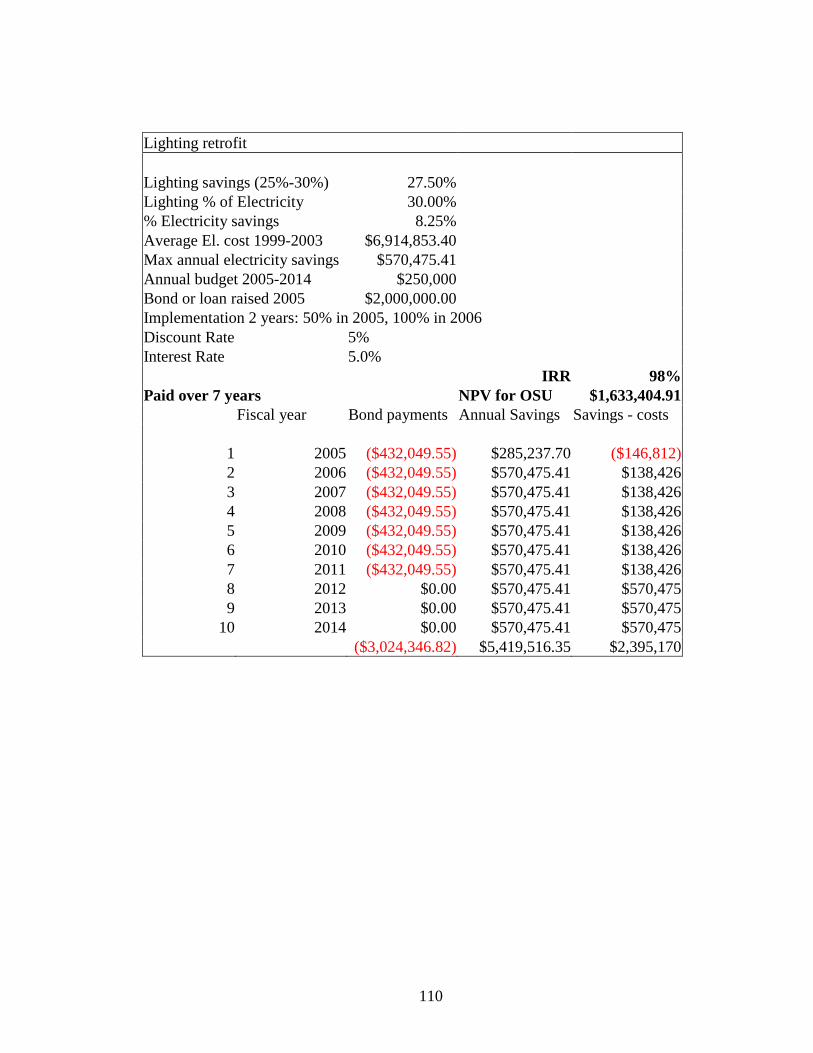
110
Lighting retrofit Lighting savings (25%-30%) 27.50% Lighting % of Electricity 30.00% % Electricity savings 8.25% Average El. cost 1999-2003 $6,914,853.40 Max annual electricity savings $570,475.41 Annual budget 2005-2014 $250,000 Bond or loan raised 2005 $2,000,000.00 Implementation 2 years: 50% in 2005, 100% in 2006 Discount Rate 5% Interest Rate 5.0% IRR 98%Paid over 7 years NPV for OSU $1,633,404.91 Fiscal year Bond payments Annual Savings Savings - costs
1 2005 ($432,049.55) $285,237.70 ($146,812)2 2006 ($432,049.55) $570,475.41 $138,426 3 2007 ($432,049.55) $570,475.41 $138,426 4 2008 ($432,049.55) $570,475.41 $138,426 5 2009 ($432,049.55) $570,475.41 $138,426 6 2010 ($432,049.55) $570,475.41 $138,426 7 2011 ($432,049.55) $570,475.41 $138,426 8 2012 $0.00 $570,475.41 $570,475 9 2013 $0.00 $570,475.41 $570,475
10 2014 $0.00 $570,475.41 $570,475 ($3,024,346.82) $5,419,516.35 $2,395,170
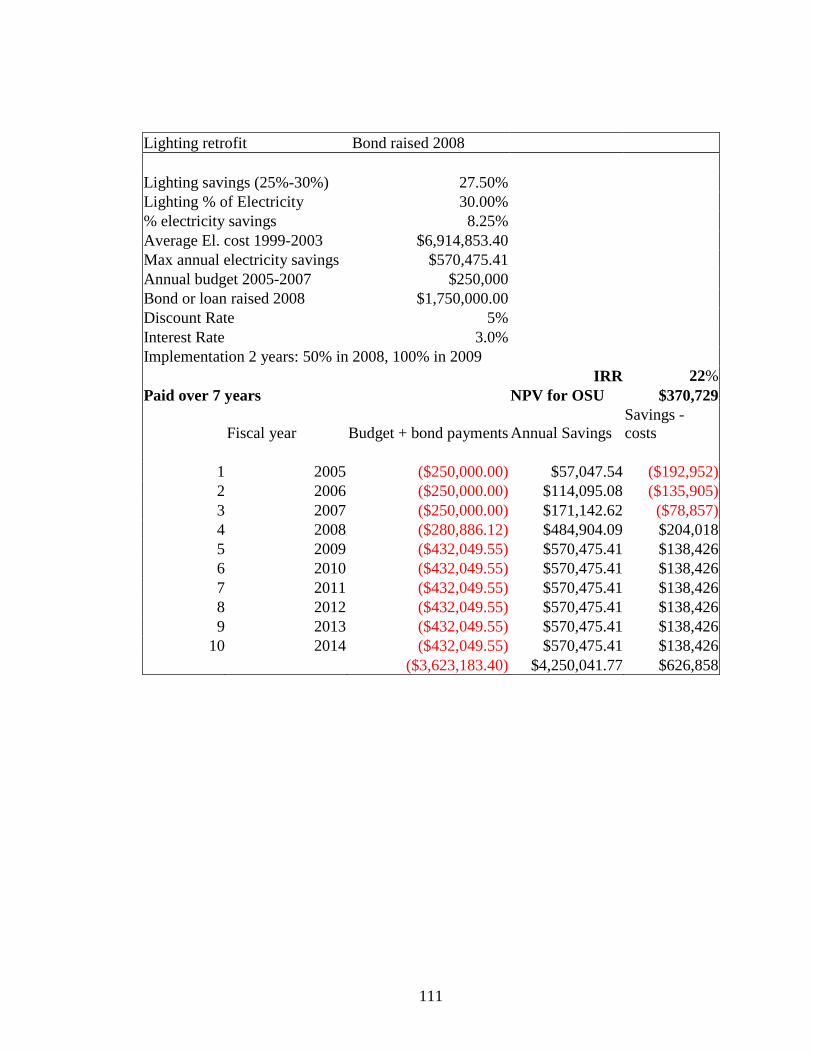
111
Lighting retrofit Bond raised 2008 Lighting savings (25%-30%) 27.50% Lighting % of Electricity 30.00% % electricity savings 8.25% Average El. cost 1999-2003 $6,914,853.40 Max annual electricity savings $570,475.41 Annual budget 2005-2007 $250,000 Bond or loan raised 2008 $1,750,000.00 Discount Rate 5% Interest Rate 3.0% Implementation 2 years: 50% in 2008, 100% in 2009 IRR 22%Paid over 7 years NPV for OSU $370,729
Fiscal year Budget + bond payments Annual Savings Savings - costs
1 2005 ($250,000.00) $57,047.54 ($192,952)2 2006 ($250,000.00) $114,095.08 ($135,905)3 2007 ($250,000.00) $171,142.62 ($78,857)4 2008 ($280,886.12) $484,904.09 $204,018 5 2009 ($432,049.55) $570,475.41 $138,426 6 2010 ($432,049.55) $570,475.41 $138,426 7 2011 ($432,049.55) $570,475.41 $138,426 8 2012 ($432,049.55) $570,475.41 $138,426 9 2013 ($432,049.55) $570,475.41 $138,426
10 2014 ($432,049.55) $570,475.41 $138,426 ($3,623,183.40) $4,250,041.77 $626,858
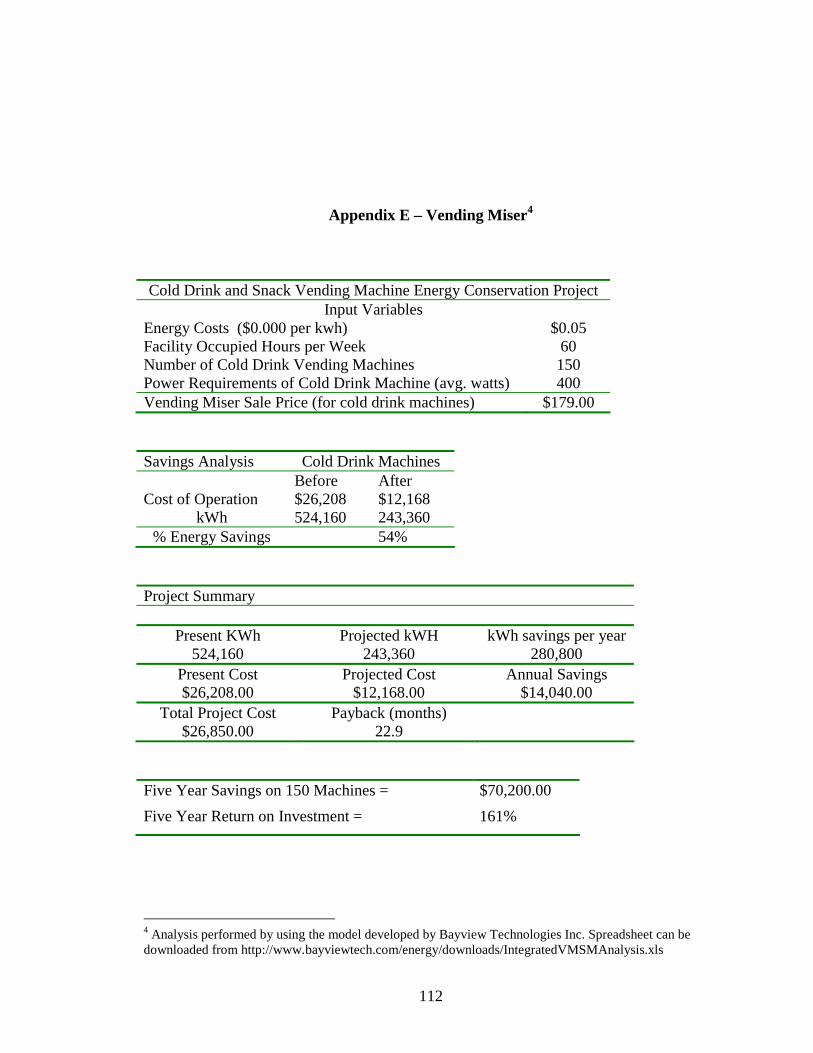
112
Appendix E – Vending Miser4
Cold Drink and Snack Vending Machine Energy Conservation Project Input Variables
Energy Costs ($0.000 per kwh) $0.05 Facility Occupied Hours per Week 60 Number of Cold Drink Vending Machines 150 Power Requirements of Cold Drink Machine (avg. watts) 400 Vending Miser Sale Price (for cold drink machines) $179.00
Savings Analysis Cold Drink Machines Before After Cost of Operation $26,208 $12,168
kWh 524,160 243,360 % Energy Savings 54%
Project Summary
Present KWh Projected kWH kWh savings per year 524,160 243,360 280,800
Present Cost Projected Cost Annual Savings $26,208.00 $12,168.00 $14,040.00
Total Project Cost Payback (months) $26,850.00 22.9
Five Year Savings on 150 Machines = $70,200.00 Five Year Return on Investment = 161%
4 Analysis performed by using the model developed by Bayview Technologies Inc. Spreadsheet can be downloaded from http://www.bayviewtech.com/energy/downloads/IntegratedVMSMAnalysis.xls
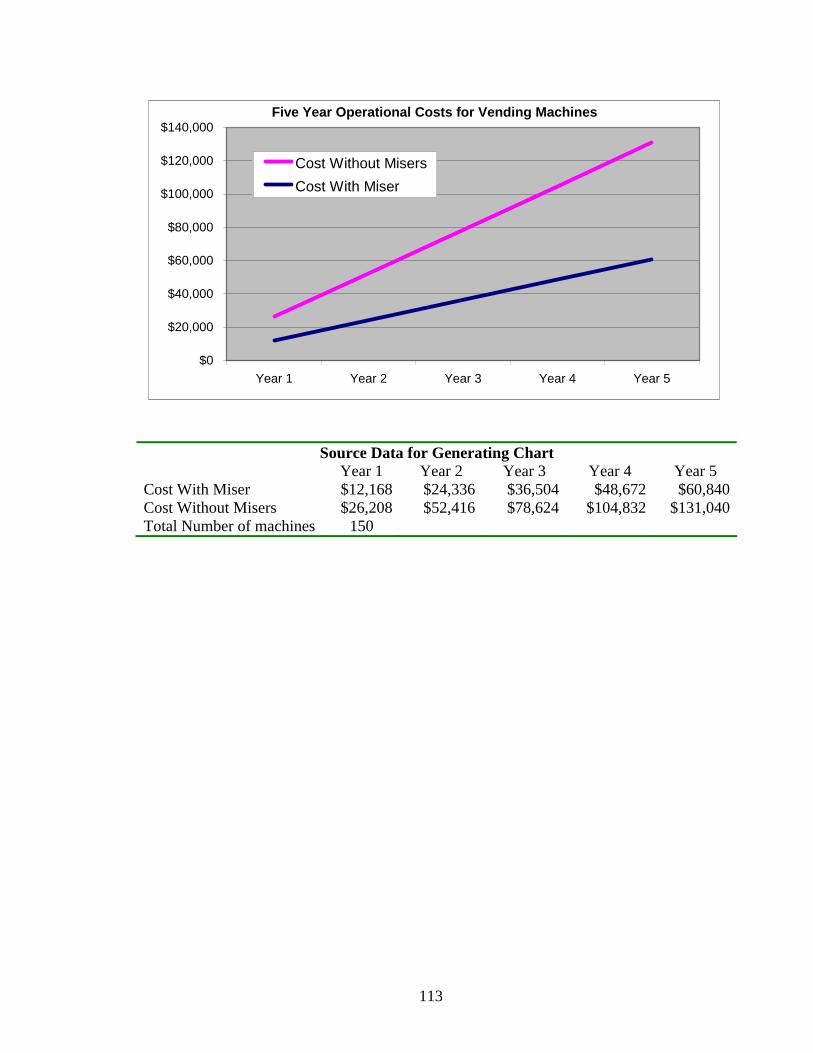
113
Five Year Operational Costs for Vending Machines
$0
$20,000
$40,000
$60,000
$80,000
$100,000
$120,000
$140,000
Year 1 Year 2 Year 3 Year 4 Year 5
Cost Without MisersCost With Miser
Source Data for Generating Chart Year 1 Year 2 Year 3 Year 4 Year 5 Cost With Miser $12,168 $24,336 $36,504 $48,672 $60,840 Cost Without Misers $26,208 $52,416 $78,624 $104,832 $131,040 Total Number of machines 150
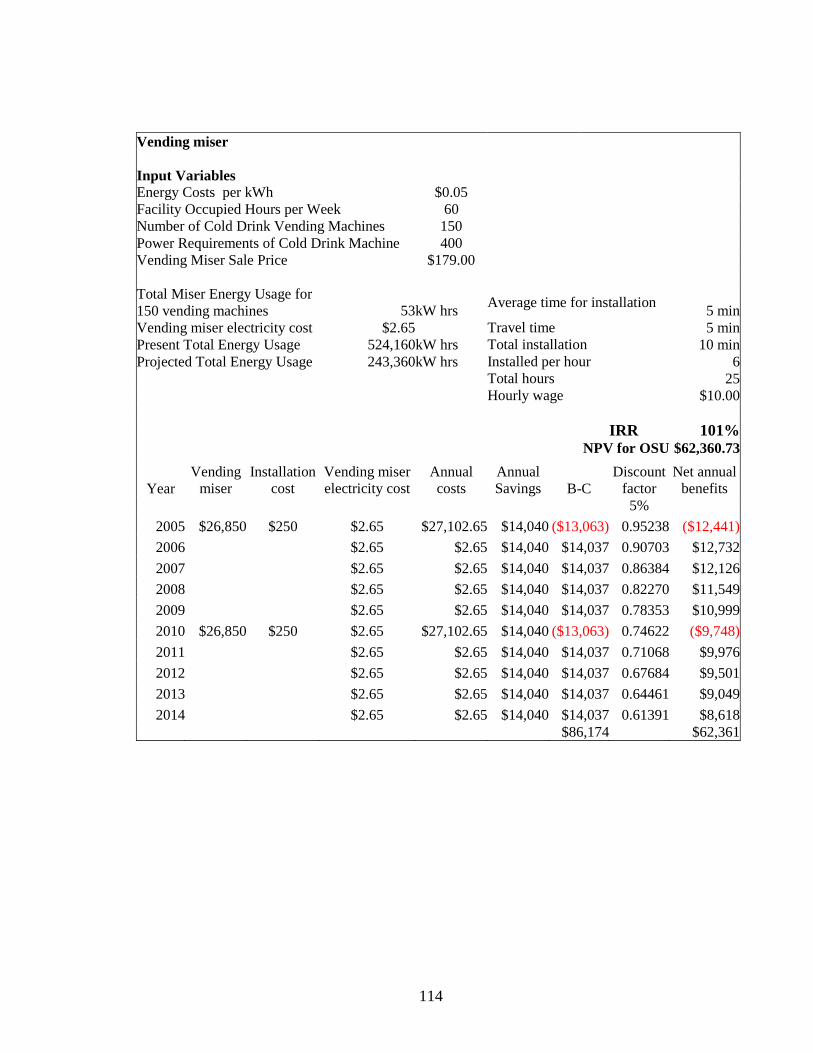
114
Vending miser Input Variables Energy Costs per kWh $0.05 Facility Occupied Hours per Week 60 Number of Cold Drink Vending Machines 150 Power Requirements of Cold Drink Machine 400 Vending Miser Sale Price $179.00 Total Miser Energy Usage for 150 vending machines 53kW hrs Average time for installation 5 min Vending miser electricity cost $2.65 Travel time 5 min Present Total Energy Usage 524,160kW hrs Total installation 10 min Projected Total Energy Usage 243,360kW hrs Installed per hour 6 Total hours 25 Hourly wage $10.00 IRR 101% NPV for OSU $62,360.73
Year Vending
miser Installation
cost Vending miser electricity cost
Annual costs
Annual Savings B-C
Discount factor
Net annual benefits
5% 2005 $26,850 $250 $2.65 $27,102.65 $14,040 ($13,063) 0.95238 ($12,441)2006 $2.65 $2.65 $14,040 $14,037 0.90703 $12,732 2007 $2.65 $2.65 $14,040 $14,037 0.86384 $12,126 2008 $2.65 $2.65 $14,040 $14,037 0.82270 $11,549 2009 $2.65 $2.65 $14,040 $14,037 0.78353 $10,999 2010 $26,850 $250 $2.65 $27,102.65 $14,040 ($13,063) 0.74622 ($9,748)2011 $2.65 $2.65 $14,040 $14,037 0.71068 $9,976 2012 $2.65 $2.65 $14,040 $14,037 0.67684 $9,501 2013 $2.65 $2.65 $14,040 $14,037 0.64461 $9,049 2014 $2.65 $2.65 $14,040 $14,037 0.61391 $8,618
$86,174 $62,361
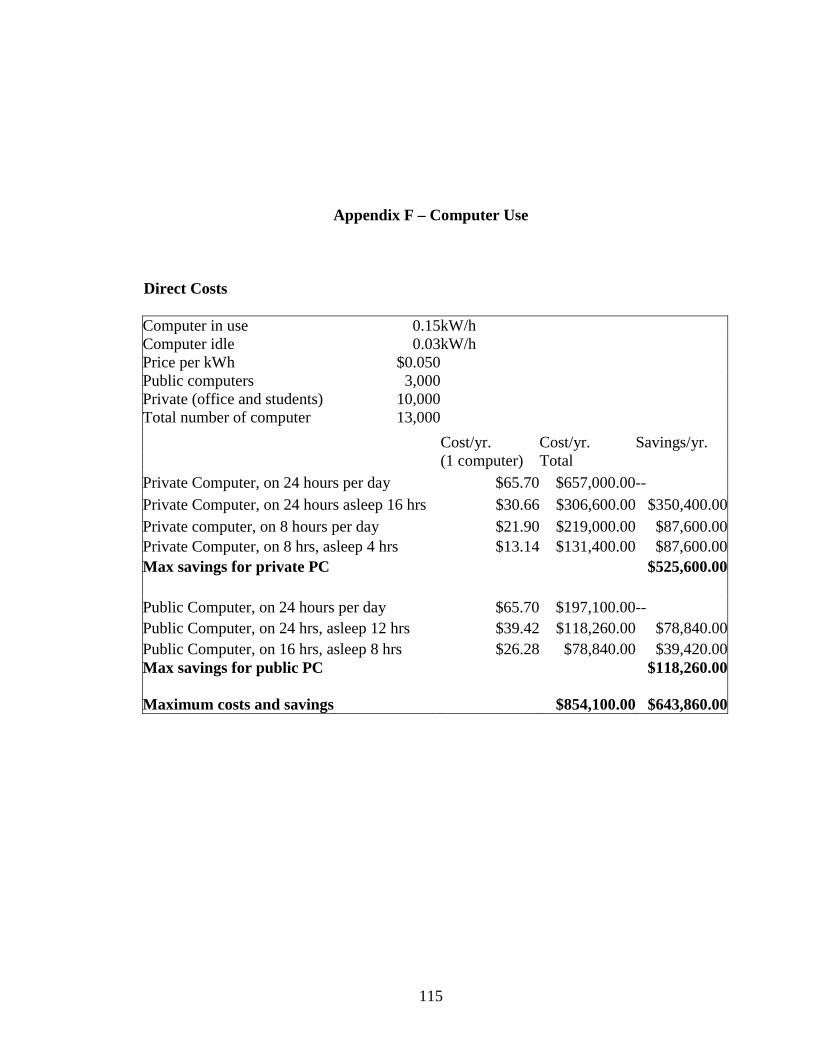
115
Appendix F – Computer Use
Direct Costs
Computer in use 0.15kW/h Computer idle 0.03kW/h Price per kWh $0.050 Public computers 3,000 Private (office and students) 10,000 Total number of computer 13,000 Cost/yr. Cost/yr. Savings/yr. (1 computer) Total Private Computer, on 24 hours per day $65.70 $657,000.00-- Private Computer, on 24 hours asleep 16 hrs $30.66 $306,600.00 $350,400.00Private computer, on 8 hours per day $21.90 $219,000.00 $87,600.00Private Computer, on 8 hrs, asleep 4 hrs $13.14 $131,400.00 $87,600.00Max savings for private PC $525,600.00 Public Computer, on 24 hours per day $65.70 $197,100.00-- Public Computer, on 24 hrs, asleep 12 hrs $39.42 $118,260.00 $78,840.00Public Computer, on 16 hrs, asleep 8 hrs $26.28 $78,840.00 $39,420.00Max savings for public PC $118,260.00 Maximum costs and savings $854,100.00 $643,860.00
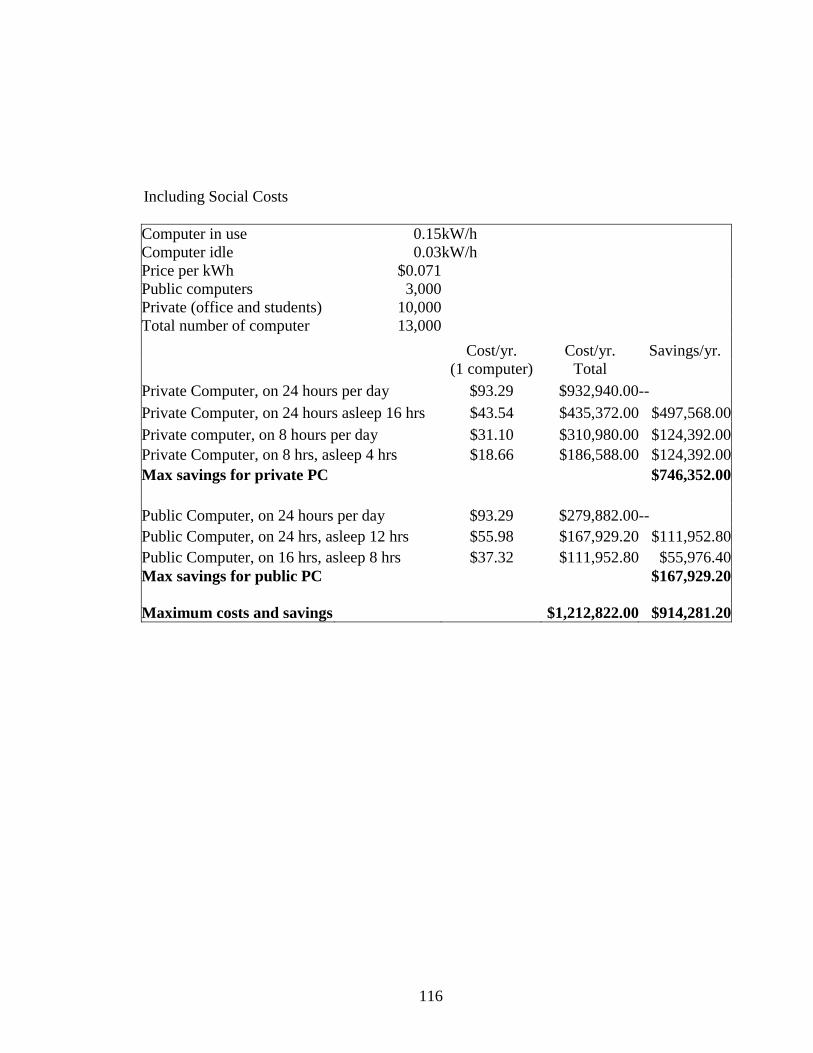
116
Including Social Costs
Computer in use 0.15kW/h Computer idle 0.03kW/h Price per kWh $0.071 Public computers 3,000 Private (office and students) 10,000 Total number of computer 13,000 Cost/yr. Cost/yr. Savings/yr. (1 computer) Total Private Computer, on 24 hours per day $93.29 $932,940.00-- Private Computer, on 24 hours asleep 16 hrs $43.54 $435,372.00 $497,568.00Private computer, on 8 hours per day $31.10 $310,980.00 $124,392.00Private Computer, on 8 hrs, asleep 4 hrs $18.66 $186,588.00 $124,392.00Max savings for private PC $746,352.00 Public Computer, on 24 hours per day $93.29 $279,882.00-- Public Computer, on 24 hrs, asleep 12 hrs $55.98 $167,929.20 $111,952.80Public Computer, on 16 hrs, asleep 8 hrs $37.32 $111,952.80 $55,976.40Max savings for public PC $167,929.20 Maximum costs and savings $1,212,822.00 $914,281.20
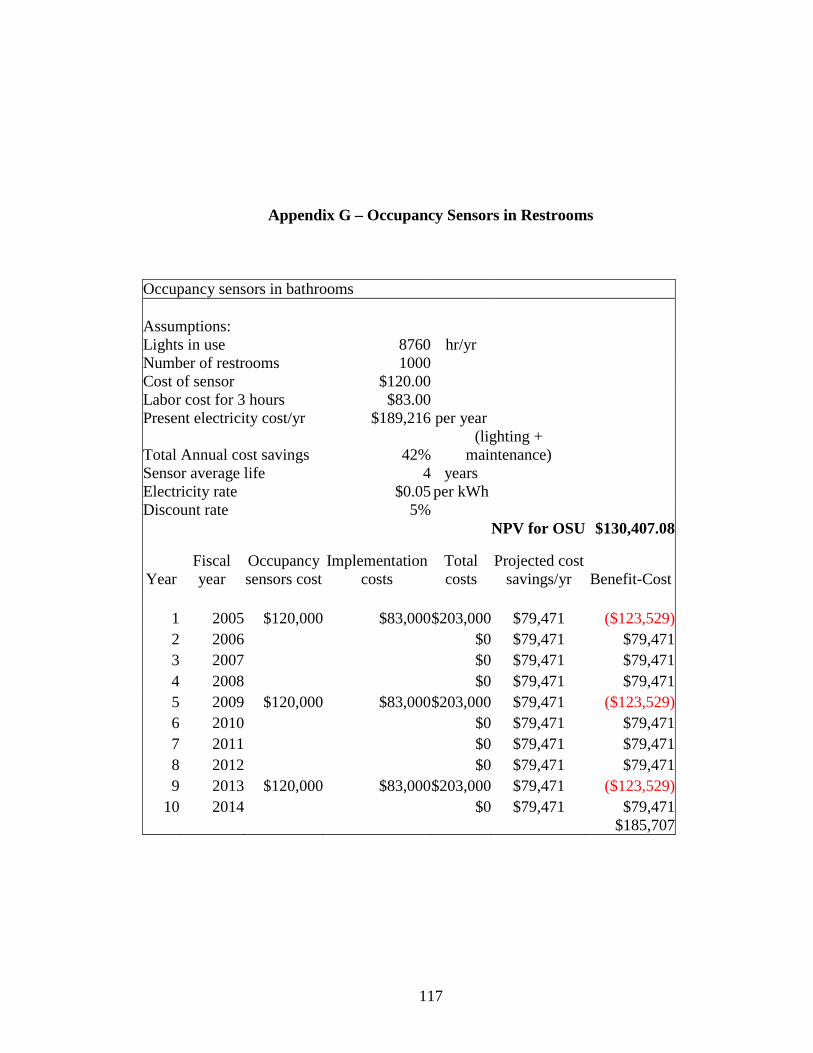
117
Appendix G – Occupancy Sensors in Restrooms
Occupancy sensors in bathrooms Assumptions: Lights in use 8760 hr/yr Number of restrooms 1000 Cost of sensor $120.00 Labor cost for 3 hours $83.00 Present electricity cost/yr $189,216 per year
Total Annual cost savings 42%(lighting +
maintenance) Sensor average life 4 years Electricity rate $0.05 per kWh Discount rate 5% NPV for OSU $130,407.08
Year Fiscal year
Occupancy sensors cost
Implementation costs
Total costs
Projected cost savings/yr Benefit-Cost
1 2005 $120,000 $83,000$203,000 $79,471 ($123,529)2 2006 $0 $79,471 $79,471 3 2007 $0 $79,471 $79,471 4 2008 $0 $79,471 $79,471 5 2009 $120,000 $83,000$203,000 $79,471 ($123,529)6 2010 $0 $79,471 $79,471 7 2011 $0 $79,471 $79,471 8 2012 $0 $79,471 $79,471 9 2013 $120,000 $83,000 $203,000 $79,471 ($123,529)
10 2014 $0 $79,471 $79,471 $185,707
VITA
Dejan Skoric
Candidate for the Degree of
Master of Science
Thesis: COST BENEFIT ANALYSIS OF POTENTIAL ENERGY CONSERVATION PROGRAM AT OKLAHOMA STATE UNIVERSITY
Major Field: Environmental Science
Biographical:
Personal Data: Born in Osijek, Croatia, on April 15, 1976, the son of Kamenko and Brigita Skoric
Education: Graduated from Prva Gimnazija u Osijeku, Croatia in June 1994; received Bachelor of Science degree in Economics from University Josip Juraj Strossmayer in Osijek, Croatia in September, 2000. Completed the requirements for the Masters of Science degree with a Major in Environmental Science at Oklahoma State University in July, 2004.
Experience: Undergraduate Teaching and Research Assistant, School of Economics, University of J.J. Strossmayer, Osijek, Croatia from October 1997 to September 1999; Project Manager on Stronger Together Project, PRONI Centre for Social Education, Osijek, Croatia, April 2001 to July 2002; Energy Management Program Intern at Yale University, Summer 2003.
Professional Memberships: Society of Environmental Scientists at Oklahoma State University