Embed Size (px)
Citation preview
FACTORS INFLUENCING CALCULUS COURSE
SUCCESS AMONG FRESHMEN
ENGINEERING STUDENTS
By
MWARUMBA MWAVITA
Bachelor of Education Kenyatta University
Nairobi, Kenya 1989
Master of Education
University of Central Oklahoma Edmond, Oklahoma
1994
Submitted to the Faculty of the Graduate College of the
Oklahoma State University in partial fulfillment of
the requirements for the Degree of
DOCTOR OF PHILOSOPHY May, 2005
ii
FACTORS INFLUENCING CALCULUS COURSE
SUCCESS AMONG FRESHMEN
ENGINEERING STUDENTS
Dissertation Approved:
Dr. Janice Miller
Dissertation Adviser
Dr. Diane Montgomery
Dr. Katye Perry
Dr. Dale Fuqua
Dr. A. Gordon Emslie

iii
Dean of the Graduate College
iv
DEDICATION
This dissertation is dedicated to my parents
Renelice and Rodgers Mwavita for the way they modeled faith in God in their daily lives.
�Kwa Imani, yote yawezekana.�
To my sisters, Sophie and Pendo, this one is for you too.
v
ACKNOWLEDGEMENTS I wish to acknowledge God, who has been very faithful to me since I came to
know him personally. To Him be Glory and Honor forever. I would like to thank my
dissertation advisor Dr. Janice Miller for her leadership and support during this process.
In addition I wish to acknowledge committee members Dr. Katye Perry, Dr. Dale Fuqua,
and Dr. Diane Montgomery for their very constructive and valuable insight into this
study. I would like to also thank Dr. David Thompson, Associate Dean of College of
Engineering, Architecture and Technology for his tremendous support and insight. Dr.
Johnson, thank you too for your assistance and expertise advice.
I would also extend my appreciation to Wanjiku my sister in law, Ralph and Ruby
Dreessen, Tom and Linda Hunter, Ruth and Steve Owens, the Opiyo�s, C.G., Njeri, and
all of our friends for you support, and prayers during this journey. I must also
acknowledge family members in Kenya: my father, Rodgers Mwavita, my mother
Renelice Mwavita, my sisters Sophie and Pendo, mother-in-law Josephine Macharia,
sister-in-law Wakini, and brother-in-laws, Nyanjui and Mae for their prayers. We can all
say Amen!
Last but certainly no least, I want to express my sincere and deepest appreciation
and love to my family for their support and encouragement: my wife and friend, Njoki
Mwarumba, you have been my inspiration and support in this educational process, thank
you. My two lovely and wonderful boys, Tuzo and Tuli, thank you for your patience and
prayers during this process.
vi
TABLE OF CONTENTS
Chapter Page I. INTRODUCTION . . . . . . . . . . . . . . . . . . . . . . . . . . . . . . . . . . . . . . . . . . . 1 Academic Background Characteristics . . . . . . . . . . . . . . . . . . . . . . . . 2 Intervention Programs . . . . . . . . . .. . . . . . . . . . . . . . . . . . . . . . . . . . . . 4 The Problem. . . . . . . . . . . . . . . . . . . . . . . . . . . . . . . . . . . . . . . . . . . . . . 6 Purpose of the Study. . . . . . . . . . .. . . . . . . . . . . . . . . . . . . . . . . . . . . . . 7 Research Questions. . . . . . . . . . . . . . . . . . . . . . . . . . . . . . . . . . . . . . . . 7 Expectancy and Value. . . . . . . . . . . . . . . . . . . . . . . . . . . . . . . . . . . . . .
Value-related Variables. . . . . . . . . . . . . . . . . . . . . . . . . . . . . . . . . . Expectancy-related Variables. . . . . . . . . . . . . . . . . . . . . . . . . . . . .
8 8 9
Definition of Terms . . . . . . . . . . . . . . . . . . . . . . . . . . . . . . . . . . . . . . . 10 Significance of the Study. . . . . . . . . . . . . . . . . . . . . . . . . . . . . . . . . . . 10 Limitations of the Study. . . . . . . . . . . . . . . . . . . . . . . . . . . . . . . . . . . . 11 Organization of the Study. . . . . . . . . . . . . . . . . . . . . . . . . . . . . . . . . . . 12 II. LITERATURE REVIEW. . . . . . . . . . . . . . . . . . . . . . . . . . . . . . . . . . . . . . 13 Theoretical Framework. . . . . . . . . . . . . . . . . . . . . . . . . . . . . . . . . . . . . 14 Expectancy-value Theory . . . . . . . . . . . . . . . . . . . . . . . . . . . . . . . . . . 15 Value-related Variables. . . . . . . . . . . . . . . . . . . . . . . . . . . . . . . . . . . . . 16 Utility Value. . . . . . . . . . . . . . . . . . . . . . . . . . . . . . . . . . . . . . . . . . 17 Self-regulated Learning. . . . . . . . . . . . . . . . . . . . . . . . . . . . . . . . . . 20 Classroom Academic Engagement . . . . . . . . . . . . . . . . . . . . . . . . . 24 Help-seeking Behavior. . . . . . . . . . . . . . . . . . . . . . . . . . . . . . . . . . . 27 Expectancy-related Variables. . . . . . . . . . . . . . . . . . . . . . . . . . . . . . . . 32 Number of Mathematics courses taken. . . . . . . . . . . . . . . . . . . . . . 32 ACT scores. . . . . . . . . . . . . . . . . . . . . . . . . . . . . . . . . . . . . . . . . . . . 37 High school GPA. . . . . . . . . . . . . . . . . . . . . . . . . . . . . . . . . . . . . . . 38 Chapter Summary . . . . . . . . . . . . . . . . . . . . . . . . . . . . . . . . . . . . . . . . . 41 III. RESEARCH METHOD . . . . . . . . . . . . . . . . . . . . . . . . . . . . . . . . . . . . . . . 43 Research Questions. . . . . . . . . . . . . . . . . . . . . . . . . . . . . . . . . . . . . . . . 43 Background . . . . . . . . . . . . . . . . . . . . . . . . . . . . . . . . . . . . . . . . . . . . . . 44 Sample. . . . . . . . . . . . . . . . . . . . . . . . . . . . . . . . . . . . . . . . . . . . . . . . . 45 Procedures. . . . . . . . . . . . . . . . . . . . . . . . . . . . . . . . . . . . . . . . . . . . . . . 46 File manipulation. . . . . . . . . . . . . . . . . . . . . . . . . . . . . . . . . . . . . . . . 47 Measures . . . . . . . . . . . . . . . . . . . . . . . . . . . . . . . . . . . . . . . . . . . . . . . 49 Telephone Survey . . . . . . . . . . . . . . . . . . . . . . . . . . . . . . . . . . . . . . . 50 Archived Student Database. . . . . . . . . . . . . . . . . . . . . . . . . . . . . . . . 51
vii
Chapter Page
III. Research Variables. . . . . . . . . . . . . . . . . . . . . . . . . . . . . . . . . . . . . . 51 Dependent variable . . . . . . . . . . . . . . . . . . . . . . . . . . . . . . . . . . . . 51 Independent variables. . . . . . . . . . . . . . . . . . . . . . . . . . . . . . . . . . . 51 Scales for variables. . . . . . . . . . . . . . . . . . . . . . . . . . . . . . . . . . . . . 51 Data Analysis Plan . . . . . . . . . . . . . . . . . . . . . . . . . . . . . . . . . . . . . . 55 Phase I. . . . . . . . . . . . . . . . . . . . . . . . . . . . . . . . . . . . . . . . . . . . . . . 56 Phase II. . . . . . . . . . . . . . . . . . . . . . . . . . . . . . . . . . . . . . . . . . . . . . 56
Chapter Summary. . . . . . . . . . . . . . . . . . . . . . . . . . . . . . . . . . . . . . . 59
IV. RESULTS. . . . . . . . . . . . . . . . . . . . . . . . . . . . . . . . . . . . . . . . . . . . . . . . 60 Descriptive Statistics. . . . . . . . . . . . . . . . . . . . . . . . . . . . . . . . . . . . . 60 Summary. . . . . . . . . . . . . . . . . . . . . . . . . . . . . . . . . . . . . . . . . . . . . . 72 Analyses . . . . . . . . . . . . . . . . . . . . . . . . . . . . . . . . . . . . . . . . . . . . . . . 72 Convergent and Divergent Validity. . . . . . . . . . . . . . . . . . . . . . . . 72 Research Question One. . . . . . . . . . . . . . . . . . . . . . . . . . . . . . . . . 74 Expectancy Construct. . . . . . . . . . . . . . . . . . . . . . . . . . . . . . . . . . . 75 Research Question Two. . . . . . . . . . . . . . . . . . . . . . . . . . . . . . . . . 76 Value Construct . . . . . . . . . . . . . . . . . . . . . . . . . . . . . . . . . . . . . . . 76 Intercorrelations Across Constructs . . . . . . . . . . . . . . . . . . . . . . . 77 Research Question Three. . . . . . . . . . . . . . . . . . . . . . . . . . . . . . . . 80 Chapter Summary. . . . . . . . . . . . . . . . . . . . . . . . . . . . . . . . . . . . . . . . 90 V. DISCUSSION . . . . . . . . . . . . . . . . . . . . . . . . . . . . . . . . . . . . . . . . . . . . 91 Theoretical Implications. . . . . . . . . . . . . . . . . . . . . . . . . . . . . . . . . . . 91 Expectancy. . . . . . . . . . . . . . . . . . . . . . . . . . . . . . . . . . . . . . . . . . .
Value. . . . . . . . . . . . . . . . . . . . . . . . . . . . . . . . . . . . . . . . . . . . . . Expectancy-Value Model. . . . . . . . . . . . . . . . . . . . . . . . . . . . . .
92 93 94
Implications for Practice. . . . . . . . . . . . . . . . . . . . . . . . . . . . . . . . . . . 101 Recommendation for Future Research. . . . . . . . . . . . . . . . . . . . . . . .
Conclusion. . . . . . . . . . . . . . . . . . . . . . . . . . . . . . . . . . . . . . . . . . . . . 102 103
REFERENCES . . . . . . . . . . . . . . . . . . . . . . . . . . . . . . . . . . . . . . . . . . . . 105 APPENDIXES . . . . . . . . . . . . . . . . . . . . . . . . . . . . . . . . . . . . . . . . . . . . 121 Appendix A: Institutional Review Board Approval. . . . . . . . . . . . . 121 Appendix B: Implied Assent Statement . . . . . . . . . . . . . . . . . . . . . . 122 Appendix C: The Engineering Survey . . . . . . . . . . . . . . . . . . . . . 123 Appendix D: BSR Step by Step Procedure . . . . . . . . . . . . . . . . . . . . 132 Appendix E: Confidentiality Statement. . . . . . . . . . . . . . . . . . . . . . . 135 Appendix F: Interview Script. . . . . . . . . . . . . . . . . . . . . . . . . . . . . . . 136 Appendix G: Frequently asked questions. . . . . . . . . . . . . . . . . . . . . 152 Appendix H: Engineering Survey Codebook. . . . . . . . . . . . . . . . . . 153 VITA . . . . . . . . . . . . . . . . . . . . . . . . . . . . . . . . . . . . . . . . . . . . . . . . . . . . . . . . 162
viii
LIST OF TABLES
Table Page I. Theoretical factors with corresponding variables for the study. . . . . . . . . . 42
II. Factors, variables, and items sources. . . . . . . . . . . . . . . . . . . . . . . . . . . . . . . 47
III. Factors, variables, and variables score range. . . . . . . . . . . . . . . . . . . . . . . . . 50
IV. Descriptive statistics for variables:
Total number, mean, standard deviation,
minimum and maximum values, range of possible scores,
range of possible scores. . . . . . . . . . . . . . . . . . . . . . . . . . . . . . . . . . . . . . . . .
61
V. Bivariate correlations among the four expectancy variables . . . .. . . . . . . . . 75
VI. Bivariate correlations among the four value variables. . . . . . . . . . . . . . . . . . 76
VII. Bivariate correlations of the expectancy-value variables in the study. . . . . . 78
VIII. Regression analysis of all eight variables. . . . . . . . . . . . . . . . . . . . . . . . . . . . 83
IX. Regression analysis with ACT math deleted . . . . . . . . . . . . . . . . . . . . . . . . . 85
X. Regression analysis with ACT composite deleted. . . . . . . . . . . . . . . . . . . . . 86
XI. Regression analysis with the four selected variables . . . . . . . . . .. . . . . . . . . 88
ix
LIST OF FIGURES
Figure Page
1. Theoretical model based on Expectancy-Value Theory. . . . . . . . . . . . . . . . . 15
2. Path diagram of the full theoretical model. . . . . . . . . . . . . . . . . . . . . . . . . . . 58
3. Calculus course grades distribution. . . . . . . . . . . . . . . . . . . . . . . . . . . . . . . . 62
4. Total number of math courses taken distribution . . . . . . . . . . . . . . . . . . . . . 63
5. ACT composite distribution. . . . . . . . . . . . . . . . . . . . . . . . . . . . . . . . . . . . . . 64
6. ACT math distribution . . . . . . . . . . . . . . . . . . . . . . . . . . . . . . . . . . . . . . . . . . 65
7. High school GPA distribution . . . . . . . . . . . . . . . . . . . . . . . . . . . . . . . . . . . . 67
8. Utility value distribution. . . . . . . . . . . . . . . . . . . . . . . . . . . . . . . . . . . . . . . . . 68
9. Class engagement distribution. . . . . . . . . . . . . . . . . . . . . . . . . . . . . . . . . . . . 69
10. Help-seeking distribution. . . . . . . . . . . . . . . . . . . . . . . . . . . . . . . . . . . . . . . . 70
11. Self-regulated learning distribution. . . . . . . . . . . . . . . . . . . . . . . . . . . . . . . . 71
12. Full theoretical prediction model. . . . . . . . . . . . . . . . . . . . . . . . . . . . . . . . . 81
13. Reduced prediction model . . . . . . . . . . . . . . . . . . . . . . . . . . . . . . . . . . . . . . 89
1
CHAPTER ONE
Introduction
Engineering programs in America have several core courses that freshman
engineering students take before they can be accepted as engineering majors. Calculus is
one of these courses. Calculus provides the foundation for understanding higher-level
science, mathematics, and engineering courses (Gainen & Willemsen, 1995). Further,
Sorby and Hamlin (2001) have pointed out that calculus is the starting point in
mathematics instruction for many engineering programs. Success in calculus is therefore
imperative for freshman engineering students. Calculus provides the mathematical
background and foundation for future engineering courses. The importance of succeeding
in first year calculus among freshman engineering students has been emphasized in
several studies (Gainen & Willemsen, 1995). Due to poor performance in calculus among
freshman students in the last ten years, the undergraduate calculus course has attracted an
unprecedented level of national interest (Bonsangue & Drew 1995). Many of the
freshman engineering students fail to meet the minimum grade criterion of A, B, or C in
their calculus course (Seymour & Hewitt, 1997). Thus, researchers have conducted
several studies to determine factors that cause low performance in calculus among
college students. As such, several interventions have been used to modify performance.
These interventions have focused on specific areas that are believed to be linked to
calculus success at the college level.
2
Academic background characteristics
Struggles with mathematics courses at the junior and high school level often lead
to an overall weak background in calculus and may contribute to performance difficulties
among freshman engineering students. One of the academic background characteristics
that has been examined by researchers is the role of prior mathematics preparation in
relationship to calculus performance. Wang and Goldschmidt (2000) examined the
effects of mathematics courses taken by students at the junior and high school level. This
study reported that the number of mathematics courses taken at the junior and high school
level plays a prominent role in higher level mathematics achievement (Wang &
Goldschmidt, 2000). In a recent study, Ma (2001) examined the impact of mathematics
course work and subsequent mathematical attainment of 7th to 12th grade students. This
study showed that students exposed to advanced mathematics courses at the middle and
junior high school level had high mathematics achievement in subsequent years. The
results of this study are supported by previous research done using nationally
representative data that high school students who take more mathematics courses perform
better in standardized tests of mathematics achievement (Gamoran, 1987; Hoffer et al.
1995; Rock & Pollack, 1995).
Other academic background characteristics that have been found to be an
indication of the level of mathematics ability of many freshman engineering students
have been high school GPA, and ACT scores. Wilhite et al. (1998) examined high school
calculus and other variables with respect to achievement in a first-semester college
calculus course among college students at the University of Arkansas. They found that
both high school GPA and ACT mathematics score were strong predictors of college

3
calculus course grade. Further, Edge and Friedberg (1984) at Illinois State University,
identified factors affecting achievement in the first course in calculus. Among the
variables that they used to predict success (i.e. grades A, B, or C) was ACT scores. The
analysis showed that the ACT math score was the best predictor of success (Edge &
Friedberg 1984). Moreover, colleges and universities continue to use standardized
predictive tests, such as ACT in their admission criteria. Other studies have indicated that
students with high ACT scores have typically done well in college level courses (Noeth,
Cruce, & Harmston, 2003).
Researchers have also examined the impact of high school GPA on calculus
achievement. In a study conducted at the University of California, Davis among
engineering students, students graduating with engineering degrees came more
academically prepared for college work and had higher high school GPAs (Lucas, 2003).
These findings are consistent with prior research that has shown that high school GPA is
a predictor of calculus performance at the college level (Wilhite, 1998).
Despite the fact that these two academic background indicators are widely used as
criteria for college admission, studies have also shown that both high school GPA and
ACT scores fail to represent all students, especially women and minorities. For example,
Sedlacek (1989) showed that ACT correlates well with freshman grades for Caucasian
students in general, but reported lower correlations for nonwhite students. As a result of
the shortcomings of these indicators, some students are neglected. To alleviate the
potential problem of neglecting able students, several intervention programs have been
incorporated in colleges. These programs focus on able students who have relatively
lower GPA and ACT scores.
4
Intervention programs
Among the most widely recognized intervention programs in college mathematics
is the calculus workshop model that was originally developed to serve under-represented
students at the University of California, Berkeley by Uri Treisman in the late 1970s
(Treisman, 1985). The Berkeley model, known as the Emerging Scholars Program (ESP),
has been adapted in mathematics courses at several major universities (Selvin, 1992).
Today, these programs are intentionally serving both diverse and inclusive student
populations (Asera, 2001). These programs provide mathematics workshops designed to
identify and build on student strengths for those students arriving at college with gaps in
their mathematical backgrounds. Besides addressing the mathematical background issue,
these programs also addressed the study skills factors, taking notes, doing assignments,
studying for a test, using the available resources, working in groups, and emphasizing
attendance and planning (Asera, 2001).
Another aspect of involvement in ESP programs is the impact the program has on
academic patterns and self-perceptions (Bonsangue & Drew, 1995). ESP provides a safe
environment for students to collaborate, study and even gain effective study skill in
calculus (Asera, 2001). These particular factors have been found to influence students�
performance at the college level.
Allen (2001) at the University of Missouri in Rolla determined the impact of the
�Summer Bridge Program� on calculus performance among engineering freshmen.
Students who enrolled in the Summer Bridge Program performed significantly higher in
college calculus as compared to their counterparts who did not attend the summer
program (Allen, 2001). The Summer Bridge Program was created specifically to address
5
inadequate high school preparation. The selection criteria included students� academic
success in high school, interest in engineering, and ACT score, recommendations from
high school counselors, math or science teachers. The program was 7-weeks long. The
goals of the summer program were: 1) to enhance and strengthen students� academic
preparation in mathematics, chemistry and English; 2) to familiarize students with the
resources of the engineering departments and university; and 3) to build students into
community that supports each other academically, socially, and emotionally. This is
accomplished by academic advising, clustering in math and science courses, and study
skills seminars, such as stress and time management. Depending on their high school
math background and their scores on Missouri Mathematics Placement Test (MMPT),
students are placed into algebra, trigonometry or calculus courses. These students are in
class five hours per day, Monday through Friday. The MMPT is used to measure the
effect of the Summer Bridge Program on the math skills of the students. After
participation in the summer program, many students subsequently achieve higher post
MMPT scores enabling them to enroll in higher level mathematics courses. Essentially,
Allen (2001) reports that students who participate in the summer program fare better than
their non-Summer Bridge Program counterparts in calculus. The results from the Summer
Bridge Program on students� calculus performance are consistent with studies conducted
by other researchers (Bonsangue & Drew, 1995; Moreno & Muller, 1999; Prather, 1996).
It is clear that mathematics academic background plays a major role in calculus
achievement (Seymour & Hewitt, 1997). Specifically, mathematics course work taken at
the junior and high school levels (Ma, 2001), high school GPA (Lucas, 2003), and
standardized tests such as ACT (Noeth, Cruce, & Harmston, 2003) all contribute to
6
success in calculus. At the same time, college studying experiences do appear to impact
student performance. The Emerging Scholars Programs and Summer Bridge Programs
have shown that student engagement such as study patterns is also essential for students.
When students are aware of, and use the help seeking resources available to them, they
appear to do well.
The Problem
Calculus is a core required course for all incoming engineering freshman students
at a large Midwestern university. The students enroll in calculus in their first semester of
their freshman year. This course is taught by the Mathematics department faculty. The
course is a four-hour-credit class. In order to proceed in the engineering program,
freshman engineering students must obtain an �A�, �B�, or �C� grade in the first calculus
course.
The College of Engineering Architecture and Technology at this university had
observed that the number of freshman engineering students with grades �A�, �B�, or �C�
in calculus was declining at an alarming rate. As a result, faculty members of the College
of Engineering Architecture and Technology conducted a study that examined student
pass grades of �A�, �B�, or �C� in the calculus course as influenced by the number of
credit hours in the course. For example, a course listed as 2145 is five-credit-hours while
2144, is four-credit hours. The results of this study indicated that as the number of credit
hours in a course increased, student success tended to decline.
As a result, and in collaboration with the Mathematics department, the College of
Engineering, Architecture and Technology revised the basic calculus series from two
five-credit courses to three courses of four, three, and three credit hours. The first full
7
implementation of the new calculus sequence took place in 2002. Data collected by the
College have not been conclusive. However, preliminary analysis of the data indicated
that success rate in the new course was less than the previous course (i.e. the five-credit
calculus course). Since this new calculus course has not increased the calculus success
rate among freshman engineering students, a close examination of the factors that
influence success among freshmen engineering students has become necessary.
Purpose of the Study
The purpose of this study is to examine the theoretical path model of expectancy-
value variables that predict calculus success among freshmen engineering students. This
study examined eight variables. These were total number of mathematics courses taken at
junior high and high school levels, ACT composite score, ACT math score, high school
GPA, utility value (valuing of calculus), student class engagement habits, help-seeking
behaviors, and self-regulated learning. These factors were examined under the
expectancy-value theory. Specifically, the study was guided by the following questions.
Research questions
1. Are the theoretical expectancy variables (total number of mathematics courses
taken at junior high and high school level, ACT composite, ACT math,
HSGPA) significantly related? In other words, do these variables represent the
�expectancy� construct?
2. Are the theoretical value variables (utility value, class engagement, help-
seeking behavior, self-regulated learning) significantly related? In other
words, do these four variables represent the �value� construct?
3. Is the theoretical expectancy-value model supported by these data?
8
These questions are based on the expectancy-value model that guided this study.
This model provides a theoretical ground to examine all eight variables together and their
impact on calculus success.
Expectancy and Value
The questions posed in this study are each linked to a theoretical factor believed
to affect entry-level student success in calculus. These factors are expectancy and value.
Freshmen engineering students participating in this study will respond to survey items
developed around the theoretical factors. The theoretical factors are fully developed in
Chapter 2, review of literature. A brief explanation of each factor follows here, along
with a description of the intended variables for each factor.
Value-related variables
Value factors identified in this study are; utility value, class engagement,
student�s help-seeking behavior and self-regulated learning. These variables are also
believed to directly affect success in a first-year calculus course. The relationship
between valuing calculus and success in the calculus course will be assessed through the
use of nine Likert-type modified scaled items based developed by Schau�s (1995)
Student�s Attitude Toward Statistics for Engineering, value subscale (SATS-E). These
items are based on Eccles et al. (1983) expectancy-value theory. A total score will be
developed for each student, with this score expressing student perception of the value of
calculus.
Class engagement refers to involvement and participation in a subject matter by
students. This entails working on class work outside the classroom or participating inside
the class. Students� activities such as doing class assignments, studying before class
9
and/or exam, are indicators of class engagement. These class engagement activities will
be assessed and related to student performance in calculus.
Help-seeking behavior refers to use of academic resources that are available to all
students. This factor is divided into three components; a) use of instructor time, b) use of
review sessions designed for calculus students, and c) use of the university Resource
Center. These three utilization variables will be assessed and related to student
performance in calculus.
Self-regulated learning will be measured through the use of Bandura�s (1996)
self-regulated learning subscale from his Multidimensional Scales of Perceived Self-
Efficacy. A composite store to the eleven-item subscale will be determined for each
student, and this total score will serve as the measure of self-regulated learning for the
participating first-year freshmen.
Expectancy- related variables
This factor serves to identify those characteristics of freshmen engineering
students believed to directly affect success in a first-year calculus course. Variables used
to measure this factor will include number of mathematics course work taken at both the
a) junior and high school levels, and prior academic achievement, as determined by c)
high school GPA, c) student ACT composite and ACT math scores. Thus four variables
will be assessed for the expectancy factor in this study.
The first expectancy variable is the total number of mathematics courses taken at
junior high and high school levels. This variable refers to the sum of mathematics courses
taken from 8th grade to 12th grade. The relationship between total number of mathematics
10
courses taken at junior high and high school levels and students� calculus performance
will be assessed.
ACT composite score and ACT math score are the second and third expectancy
variables respectively. A relationship between each variable with calculus performance
among freshmen engineering students will be assessed. High school GPA (HSGPA) is
the fourth expectancy variable. The relation between calculus success and high school
GPA will be assessed.
Definition of Terms
1. Calculus Success: College calculus achievement measured by end of semester�s
grade for the Calculus 2144 course, consists of A, B, or C grades.
2. Self-regulation: refers to student activities such as planning, monitoring, and
regulating, measured as one variable by the eleven item subscale of Bandura�s
(1986) Multidimensional Scales of Perceived Self-Efficacy (MSPSE) survey.
3. Value: refers to the perceived usefulness or worth of Calculus 2144, measured as
one variable by the nine item subscale of the Schau (1995) SATS-E survey
instrument which is based on Eccles et al. (1983) expectancy-value theory.
Significance of the Study
The available research indicates that there is a need for the identification of
factors that contribute to the successful completion of calculus among freshman
engineering students. This is because many of the freshman engineering students who fail
calculus in their first semester most likely drop out of the program. This indication is
echoed by many studies performed in engineering programs around the country (Moreno
& Muller, 1999; Seymour & Hewitt, 1997; Shuman, Delaney, Wolfe, Scalise &
11
Besterfield-Sacre, 1998; Wong & Eide, 1997). Furthermore, knowledge of the factors
will assist engineering program advisors to better advise students, and notice student
problems before it is too late.
Further, the Mathematics department will be able to pace the presentation of
material, and take into consideration student factors that enhance understanding of the
subject matter, which leads to success in the course. All in all, the information that will
be obtained from this study will aid in identifying key factors that may improve
performance in entry-level calculus among freshman engineering students. Both the
College of Engineering and the Mathematics department at this large Midwestern
University will benefit from the study�s results.
Limitations of the Study
The following limitations are identified;
1. This study will include freshman engineering students at one university; therefore,
the results may not be generalizable to all higher education institutions.
2. Only freshman engineering students who had enrolled in Calculus 2144 in fall
2002 and spring 2003 will be included in this study.
3. The sample of the engineering students used in this study was not randomly
selected.
4. This study is an example among many that attempt to find factors affecting
calculus achievement among engineering students, in an effort to predict
engineering students� success in calculus. As such, the results are by no means to
be considered definitive. This investigation is merely an attempt to offer insight
12
into the possible need for further research in this area. Even if this approach
appears to identify factors contributing to accurate estimation of student success, a
much larger body of evidence for the factors cited here would be needed before
this approach could be used with confidence.
Organization of the study
This chapter has provided the background and foundation of this study. Two
theoretical factors that impact calculus success among college students have been
identified. These factors are expectancy and value and are briefly discussed under the
expectancy-value framework. A total of eight variables that are believed to impact
calculus success are identified under this frame work. These are utility value, class
engagement, help-seeking behavior, and self-regulated learning, total number of
mathematics courses taken at junior high and high school levels, ACT composite
score, ACT math score, and high school GPA. Utility, class engagement, help-
seeking behavior, and self-regulated learning are identified as value-related variables.
Total number of mathematics courses taken at junior high and high school level, ACT
composite score, ACT math score, and high school GPA are identified as expectancy-
related variables. The chapter provides the significance of this study, definition of
terms, and limitations. Chapter II provides the theoretical model and review of the
literature related to these two factors. In Chapter III, the method used in this study is
presented. While, results of the analyses are presented in Chapter IV. Finally, Chapter
V presents a summary of the study, discussion, implications of the findings and
recommendations.

13
CHAPTER TWO
Review of the literature
This chapter presents a review of the literature relevant to the study. The first
section will present the theoretical framework of this study. This framework is based on
expectancy-value theory. An overview of this theory will be reviewed. The next section
will focus on eight research variables believed to affect entry-level college student
success in calculus. These variables are divided into two categories of the expectancy-
value model that directly influence academic achievement; expectancies and values.
Under expectancies, total number of mathematics courses taken at junior high and high
school levels, ACT composite score, ACT math score, and high school GPA are
discussed. Utility value, class engagement, help seeking behavior, and self-regulated
learning are all discussed under the value category.
14
Theoretical Framework
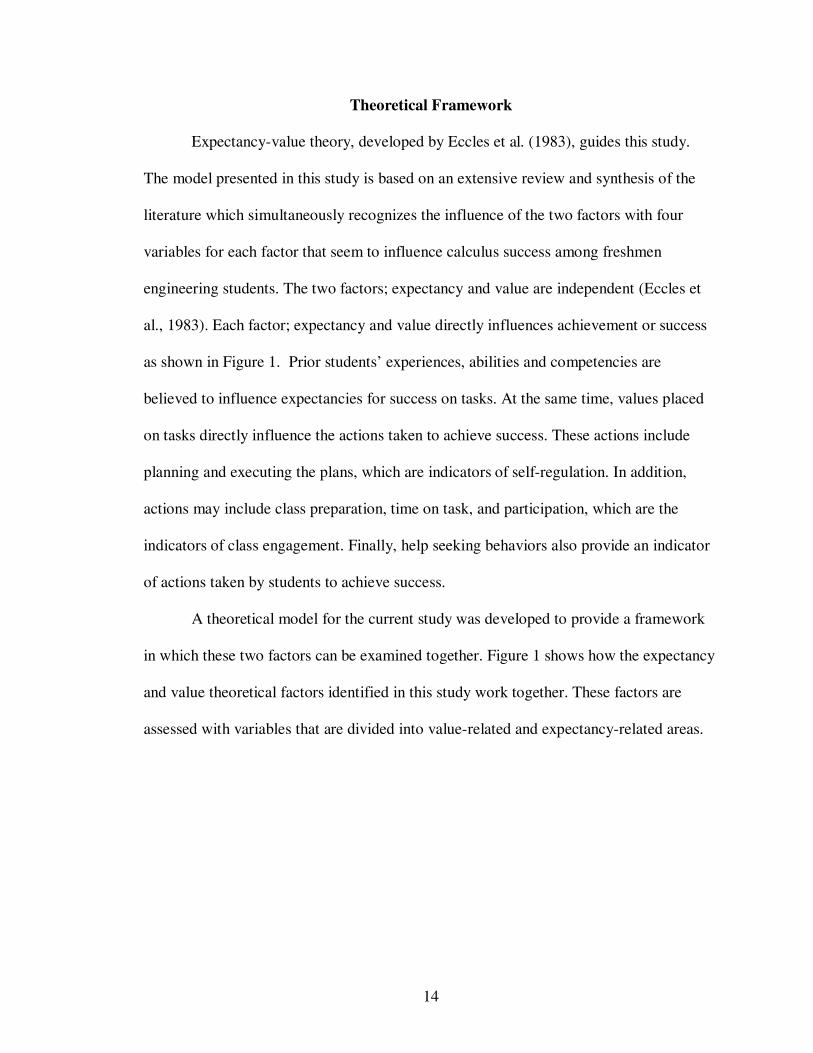
Expectancy-value theory, developed by Eccles et al. (1983), guides this study.
The model presented in this study is based on an extensive review and synthesis of the
literature which simultaneously recognizes the influence of the two factors with four
variables for each factor that seem to influence calculus success among freshmen
engineering students. The two factors; expectancy and value are independent (Eccles et
al., 1983). Each factor; expectancy and value directly influences achievement or success
as shown in Figure 1. Prior students� experiences, abilities and competencies are
believed to influence expectancies for success on tasks. At the same time, values placed
on tasks directly influence the actions taken to achieve success. These actions include
planning and executing the plans, which are indicators of self-regulation. In addition,
actions may include class preparation, time on task, and participation, which are the
indicators of class engagement. Finally, help seeking behaviors also provide an indicator
of actions taken by students to achieve success.
A theoretical model for the current study was developed to provide a framework
in which these two factors can be examined together. Figure 1 shows how the expectancy
and value theoretical factors identified in this study work together. These factors are
assessed with variables that are divided into value-related and expectancy-related areas.

15
Figure 1 Theoretical model based on Expectancy-Value Theory Variables all related Variables all related
Expectancy-value theory
Among psychological theories of motivation, expectancy-value theory has been
one of the most important views on the nature of achievement motivation (Wigfield,
1994). This theory posits that individuals� expectancies for success and the value they
have for succeeding are important determinants of their motivation to perform different
tasks (Wigfield, 1994). One of the recent models of expectancy-value theory is that of
Eccles et al. (1983). This model was developed as a framework to understanding early
adolescents and adolescents� performance in the mathematics achievement domain
(Wigfield, 1994). Eccles et al. (1983) proposed that children�s� achievement performance
and choice of achievement tasks were most directly predicted by their expectancies for
success on those tasks and the subjective value they attach to success on those tasks. In
Expectancy-Related Variables
Total math courses taken ACT composite ACT math High school GPA
Value-Related Variables Utility value Self-regulated learning Classroom engagement Help seeking behavior
Achievement
Calculus Success
16
addition, they contend that expectancies and values are most directly determined by other
achievement-related beliefs, including achievement goals, and self-schemata, and beliefs
about ability and competence.
The expectancy-value model of achievement posits that individuals� expectancies
for success and the value they have for succeeding are important determinants of their
motivation to perform different tasks, and their choices of which tasks to pursue
(Wigfield and Eccles, 2001). Eccles et al., (1983) posit that these two constructs;
expectancy and values are independent. A crucial factor influencing achievement is the
task value component. Wigfield and Eccles (2001) identify four components of task
value. They are attainment, intrinsic interest, extrinsic utility, and cost value components.
This present study will focus on the extrinsic utility value and its relation to academic
achievement.
Value-related variables
The value related factor identified in this study will be measured with four
variables; are utility value, students� self-regulated learning (SRL), classroom
engagement, and help seeking behavior. According to Eccles et al., (1983) model, value
has four components. These are attainment, interest, utility, and cost (Wigfield & Eccles,
2002). The value category of Eccles et al. (1983) expectancy-value model captures these
four variables. Three of the four theoretical variables examined in this study are captured
by the cost component of the value construct. These are self-regulated learning, help-
seeking behavior, and classroom engagement. It is hypothesized that these three variables
strongly correlated with each other. On the other hand utility value correlates
significantly with self-regulated learning and classroom engagement. All in all, the four
17
theoretical variables capture the value construct. Therefore, it is expected that if students
value a task, they are likely to engage in activities that enhance achievement and or
success on the task. Activities for this study that impact achievement are self-regulation,
classroom engagement, and students� help seeking behaviors.
This section of the review will focus on extrinsic utility value, self-regulated
learning, classroom engagement, and students� help-seeking behaviors.
Utility value
Jacobs & Eccles (2000) define utility value as the usefulness of the task for
individuals in terms of their future goals. They argue that a task can have positive value
to an individual because it facilitates important future goals, even if s/he is not interested
in the task for its own sake. For instance, an engineering student may not be interested in
calculus, but because s/he wishes to become an engineer, the calculus course has a high
utility value for them. In one sense, this component captures the extrinsic reasons for
engaging in a task (Jacobs & Eccles, 2000).
Research on values has identified achievement �related indicators. For example,
Eccles and Wigfield (1995) identified interest, usefulness, and importance to doing well
on a task as indicators of values. Ryan and Deci (2000) reported the same indicators. In
studies of achievement values, individuals typically rate particular domains, such as
science or math, in terms of interests, usefulness, or how important it is that they do well
(Eccles & Wigfield, 1995). Values have been found to predict achievement (Berndt &
Miller, 1990).
The expectancy-value model of achievement posits that individuals� expectancies
for success and the value they have for succeeding are important determinants of their
18
motivation to perform different tasks, and their choices of which tasks to pursue
(Wigfield and Eccles, 2002). Hence one crucial factor influencing achievement is the task
value component. Eccles and Wigfield (2002) identify the utility component of task value
influencing achievement behavior. According to them, utility value refers to the
usefulness of the task for individuals in terms of their future goals, including their career
goals. Calculus among engineering students renders itself clearly to the utility value
aspect of the expectancy-value model. Calculus, in the present study is taught by the
mathematics department hence there may be a tendency for students to wonder about the
value of the subject.
Besterfield-Sacre, Atman, and Shuman (1998) studied engineering student
attitude and proposed a need to evaluate students� attitudes toward the engineering
program such as the courses and or curriculum. In addition, Sorge (2001) investigated the
impact of engineering students� attitudes on statistics performance in a large
comprehensive university. She discussed the need to investigate the relationship of value
and achievement among engineering students� courses. The study had shown that values,
specifically utility values, influenced the engineering students in their performance on a
statistics course (Sorge, 2001).
Since the early 1950�s, values have been recognized as impacting achievement
(Atkinson, 1957). Early value scales were designed to measure both values and
expectancies. In the past two decades, value scales have evolved. As such, many value
scales mirror those early value scales. For example, Rokeach (1973, 1979, and 1983)
developed value scales that assess general human values. Rokeach�s (1979) view values
as standards or criteria to guide judgment, choice, attitude, evaluation, argument,

19
exhortation, rationalization, and one might add, attribution of causality� (p. 2). In this
case, value scale measures the clusters of values that are correlated to political opinions,
involvement, racism, altruism and religious activity (Rokeach, 1973, 1980). On the other
hand, Feather (1975, 1979& 1982) describes values as general, stable beliefs about what
goals and ways of behaving are desirable, and also as the standards or criteria used by
individuals to evaluate behavior. Feather�s (1971) value instrument involves ranking of
values on the terminal and instrumental values scales.
More recently scales to measure components of utility value that are theorized to
impact achievement have been developed. For example, Schau, Stevens, Dauphinee, Del
Vecchio (1995) developed the Students Attitude Toward Statistics for Engineering
(SATS-E). Schau�s et al. (1995) value scale was developed specifically for engineering
students. This values subscale was developed to capture the utility value factor, a
variable examined by this study. It is clear that the Value subscale of SATS-E has
Expectancy-value theory as its foundation. This well developed and tested subscale will
be used in this study. According to Eccles et al. (1983), worth, importance, and
usefulness of a task are indicators of utility value. Wigfield & Eccles (2000) posit that
students with high utility values put effort into tasks, in turn they become successful. As
such, in this study the impact of utility on the value calculus course is examined.
In conclusion, literature presented here provides a basis to incorporate values as
variable to be explored by this study. Utility value of a course or subject tends to
influence achievement. Studies have shown that students who see the value of the course
tend to perform higher compared to those students who have value the course less.
20
Self-Regulated Learning
According to social cognitive theory, self-regulation is viewed as an interaction of
personal, behavioral, and environmental processes (Bandura, 1986). In essence, it entails
behavioral skills of self-managing environmental contingencies, and knowledge and
sense of personal agency to enact this skill in relevant contexts (Zimmerman, 2000).
Zimmerman (2000) explains that self-regulation incorporates thoughts, feelings, and
actions that are planned and cyclically adapted to the attainment of personal goals.
In the past two decades, a number of researchers have investigated the effects of
self-regulation on students� academic achievement (Schunk & Zimmerman, 1997). This
research has consistently demonstrated the importance of self-regulated learning to
academic achievement. Self-regulated learning has also been demonstrated to be a
significant predictor of achievement track (high or low) (Zimmerman & Martniez-Pons,
1986), college student�s assignment to developmental/remedial or regular college
admission (Ley & Young, 1998), and college student�s academic success (Zimmerman,
Bandura, & Martinez-Pons, 1992). Thus, the significance of self-regulated learning to
academic settings and performance has been fairly established.
According to Bandura (1997), self-regulated learning capabilities are linked to
achievement. As such educational researchers have linked self-regulation to achievement
in classroom settings (Miller, 2000). Zimmerman (1994) posits that research on self-
regulated learning continues to identify attributes and strategies used by effective self-
regulated learners. For example, Pintrich and De Groot (1990) examined individual
differences in a number of self-regulated learning strategies among students (e.g.,
rehearsal, persistence, comprehension monitoring). Research studies on academic
21
learning show that students who are able to regulate their own learning in the face of
many distractions and difficulties in classrooms perform and learn better than students
who lack self-regulatory capabilities (Pintrich, 2000).
Given the importance of self-regulating learning in general, and more specifically
within classroom settings, it is interesting that there is very limited empirical research
focused on self-regulated learning among engineering students. The impact of self-
regulated learning on calculus success among freshmen engineering students has not been
studied. Given that self-regulated learning has been found to be domain-specific (Miller,
2000), the current study examined the impact of self-regulated learning among freshmen
engineering students on calculus success.
There are many different models of self-regulated learning that propose different
constructs and mechanisms, but they do share some basic assumptions about learning and
regulation. Pintrich (2000) identifies four assumptions that these models have in
common. First, all models view learners as active participants in the learning process.
Secondly, all models assume that learners can monitor, control, and regulate certain
aspects of their own cognition, motivation, and behavior as well as some features of their
environments. Thirdly, all models assume that there is some type criterion or standard
against which comparisons are made in order to assess whether the process should
continue as is or if some type of change is necessary. Finally, all models assume that self-
regulatory activities are mediators between personal and contextual characteristics such
as achievement or performance.
These four self-regulated learning model assumptions identify key indicators of
self-regulated learning strategies. These are organization, concentrating, participating,
22
identifying and using available resources to enhance achievement. All four indicators of
self-regulated learning strategies are examined in this study. Since calculus course work
involves completing assigned problems, students enrolled in the class are expected to
plan and work on the problems outside the classroom. However, students do face various
distractions while in college. There are many activities in college besides academics. For
example, sports, parties, and social life in general. These extracurricular activities may
come in the way of students� academic work and jeopardize their performance. However,
according to research on self-regulated learning, students who exercise self-regulated
learning strategies in the midst of all distractions are more likely to succeed in their
academic endeavors (Pintrich, 2000).
This study used Bandura�s (1989) Multidimensional Scales of Perceived Self-
Efficacy (MSPSE). This scale was designed to measure student�s perceived capability to
use various self-regulated strategies; organizing school work, participating in class
discussions by taking notes, concentrating on subjects by studying and completion of
assignments, and even using the help resources when in need of assistance.
Research indicates that organizing is an important study activity (DiVesta & Moreno,
1993). Organizing materials may be broadly described as transforming and �rearranging
instructional materials to improve learning, for example, �I make an outline before I write
my paper� (Zimmerman & Martinez-Pons, 1986, p. 618). Organizing was strongly
associated with achievement in several studies. For example, Zimmerman and Martinez-
Pons (1988) reported that organizing strategies are strongly related to achievement
among middle school students. In addition organizing strategies were found to be strong
contributors in explaining the difference between advanced track and lower track high
23
school students (Zimmerman & Martinez-Pons, 1986). At the college level, organizing
strategies predicted regular admission and underprepared college student group
classification (Ley & Young, 1998).
Successful learners make efforts to determine or arrange a place where a task is to
be completed (Trawick & Corno, 1995). Structuring the environment relates to a learner�s
ability to cope effectively with disturbances, a crucial part of self-regulation process
(Corno, 1994). In a confirmatory study among 100 college students managing
distractions was a first order factor contributing to self-regulation (Orange, 1999). The
ability to concentrate on schoolwork in midst of distractions is a vital self-regulated
learning strategy. Gagne (1985) showed that environmental structuring enables learners
to eliminate or decrease distractions and to attend to learning. Before learners can pay
attention they must have an environment that allows, if not encourages, them to focus
attention on the learning task at hand (Ley & Young, 2001). Expert learners have
knowledge about the optimal study conditions for meeting demands of the task (Ertmer &
Newby, 1996). These learners ask themselves, �When and where do I study best? How
supportive is the learning environment?� (Ertmer & Newby, 1996, p. 20). Evidence from
studies in which learners have recalled their usual study practices suggests that
academically stronger learners use environmental structuring more than do academically
weaker learners (Ley & Young, 1998).
Review of self-regulated learning has investigated the presence of SRL skills and
documented their impact on academic achievement. This literature indicates the
importance of SRL in academic achievement. These studies strongly support the notion
that effort expended organizing, concentrating, participating, and managing distractions
24
while involved in academic work influences achievement. These four identified aspects
are indicators of self-regulated learning strategies. The current study examined the effect
of self-regulated learning on calculus success among freshmen engineering students.
Classroom academic engagement
Academic engagement is a term often used to describe active involvement,
commitment, and attention as opposed to apathy and lack of interest (Newmann,
Wehlage, & Lamborn, 1992). Researchers of academic engagement identify certain
indicators of engagement. For example, Singh, Granville and Dika (2002) consider doing
homework, coming prepared for classes, regular attendance, not skipping classes as a
reflection of student engagement. In addition, Connell and Klem (2004) identify time
students spend on work, intensity of concentration and effort, tendency to stay on task,
and propensity to initiate action when given an opportunity as indicators of academic
engagement.
Research on academic engagement links higher levels of engagement in school to
improved performance (Connell & Klem, 2004). For example, Finn (1993) found that
student engagement is a robust predictor of student achievement and behavior. In
addition, Wasserstein (1995) asserts that highly engaged students are intrinsically
motivated to learn and thus perform at higher levels than low engaged students. In
addition, Guthrie and Anderson (1999) contend that engaged students are good learners.
Skinner, Wellborn, and Connell (1990) investigated predictors of achievement in grade
school students and determined that engagement mediated the effects of students� beliefs
about learning on school achievement. It is clear that time, participation, and preparations
are key indicators of academic engagement.
25
Time on task has been identified as an indicator of class engagement. For
example, Ficham, Hokoda, and Sanders (1989) showed that time on task influences
achievement. Time on task in this study was measured by the time students spend doing
work. In fact, students who did more work than required performed at higher levels.
Nymstrand and Gamoran (1991) document similar results that suggest substantive
engagement behavior in class work produces higher scores on achievement measures. In
addition Boekaerts, Pintrich and Zeidner (2000) note that engaged students spend time on
their work and use self-regulation strategies to study. In a study to examine the effect of
engagement and achievement related outcomes, Marks (2000) reported a positive
correlation between engagement and grades. In addition, Finn and Rock (1997) document
large significant differences on engagement measures between students classified as
academically successful and non-academically successful. This study showed students
that exhibit high class engagement behaviors perform higher on academic measures. Thus
time spent doing class work is an indication of the level of academic engagement. These
studies suggest that the more time one spends on doing class work the likely they are to
succeed.
Although learning involves cognitive processes that take place within each
individual, motivation to learn also depends on the student�s active involvement in the
classroom. Active classroom participation is one of the indicators of academic class
engagement. Greenwood, Delquadri, and Hall (1984) identify classroom behaviors such
as participating in tasks, writing notes in class, reading silently, asking and answering
questions as indicators as indicators of classroom engagement. These indicators have
been found to impact academic achievement (Gettinger & Seibert, 2002). Other

26
researchers such as Linnenbrink and Pintrich have termed them as enablers to academic
achievement. These researchers therefore suggest that these classroom behaviors
identified are relevant measures of students� class participation, subsequently a measure
of academic engagement. Given that class engagement influences performance, any form
of engagement is important. A link of class participation is suggested to be an influence
on academic performance.
Academic activities done prior to class are indicators of preparation. These
activities provide an indication of how one is engaged in a class. These activities are
studying the textbook, reviewing class notes, reading a head, doing homework before
class to name just a few. Researchers contend that students who prepare before class tend
to perform well in class. For example, Newman (1981) identified student participation in
school as one characteristic students� involvement and engagement. Ficham, Hokoda, and
Sanders (1989) showed that students who prepared by studying and doing extra academic
work outside the class outperformed their counterparts. Further, students who engage in
these academic activities outside the classroom tend to increase their comprehension and
learning of new materials (Hancock & Betts, 2002). Academic activities outside the class
are a clear indication of student academic engagement. Academically disengaged
students tend to be lazy and bored (Dowson & McInerney, 2001). Further, they tend to
avoid work resulting to poor class performance.
Despite some encouraging results linking academic engagement and achievement,
there has been limited research on this topic at the college level. Handlesman, Briggs,
Sullivan, and Towler contend that engagement studies at the college level have focused
on major projects such as the National Survey of Student Engagement (NSSE) at Indiana

27
University (NSSE; 2000, 2002). The NSSE assesses how an institution�s programs and
practices produce desired effect on students� activities, experiences, and outcomes. Thus,
the survey measures engagement as a global quality that students have in relation to
elements such as level of academic challenge and supportive campus environments. The
focus of NSSE is on active learning and other educational experiences and does not focus
on individual courses; rather it assesses students� overall perception.
Given that the focus of this study is to explore factors that influence success in a
calculus course among engineering freshman students, research indicates academic
engagement should serve as a factor. In conclusion, the research reviewed shows that
class engagement is correlated with higher achievement. Further the literature identifies
time on task activities such as doing homework, studying, participating in class, and
doing more work than required work outside the class as indicators of student
engagement. Since little research has been done on the impact of student engagement
behaviors on calculus among engineering students, there is evidence from a variety of
studies to suggest that engagement behaviors may positively influence achievement.
Help-Seeking Behaviors
Help seeking is a way of regulating the social environment to promote learning
(Schunk, 2000). Help seeking behavior incorporates strategies students use in seeking
assistance when they encounter difficulties. Theory on academic help seeking among
students treats help seeking behavior as an adaptive strategy for coping with difficulty
and promoting mastery (Butler & Neumann, 1995). In addition, research on help seeking
posits help seeking as an important self-regulatory strategy that contributes to student
learning (Newman, 1994).

28
A help-seeking model was originally presented by Nelson-LeGall (1981). This
model identified is a task analysis of the help seeking process, and it is comprised of five
steps. These steps are:
1. Become aware of need for help.
2. Decide to seek help.
3. Identify potential helper(s).
4. Use strategies to elicit help.
5. Evaluate help-seeking episode
In this model, a learner first must become aware that the task is difficult or that
s/he is stuck and is in need of help. In the next step, learners must consider all available
information and decide whether to seek help. Once a decision is made to ask for help, a
suitable helper must be found. In the next step, the request for help must be expressed in
a suitable way. This step is influenced by students� knowledge and skills of discourse
(Newman, 1998a); the request must match the task demands. When students have
received help, they must decide on what the degree of help that is useful to address their
difficulties. If it does not help them, they must request further help, or they may even
need to identify a new helper. The first three steps of this model will be used for this
study. The last two steps are beyond the scope of the present study. In the following
section, literature on help seeking behavior and achievement is reviewed in the light of
the identified three steps of the help-seeking model.
Being aware of need for assistance when students encounter situations in which
there is some discrepancy between the demands made and their ability to meet them is
the first step in the helping seeking model. In addition, when students monitor their
29
academic performance, show awareness of difficulty they cannot overcome on their own,
and exhibit the wherewithal and self-determination to remedy that difficulty by
requesting assistance from a more knowledgeable individual, they are exhibiting
awareness of need for help (Newman, 2002). This step is foundational for the help
seeking strategy. Newman (2002) contends that help seeking can avert possible failure,
maintain engagement, lead to task success, and increase the likelihood of long-term
mastery and autonomous learning. These studies suggest that for a student to be aware of
a need for help, s/he must be faced with a difficulty in the subject area. The ability to
assess task difficulty, monitor task progress, and evaluate one�s own comprehension and
knowledge are major metacognitive functions (Newman, 1998a). However, another way
to assess the need for help is through feedback. When students get feedback on their
academic work, they are able to assess whether they need help or not.
After assessing the need for help, the second step is to make a decision to seek
help. In this step, learners must consider all available information and decide whether to
seek help. Puustinen (1998) assumed that efficient self-regulated learners first question
themselves, seeking the right answer or solution to the task at hand before deciding to ask
for help. Ryan and Pintrich (1998) consider this step crucial in the help seeking process.
There are several learner- related factors that have an effect on this decision. For
example, learners may not ask for help out of fear that they will receive less credit for a
successful outcome (Nelson-LeGall, 1981) or that the instructor or fellow students will
view them as incompetent (Ryan, Pintrich, & Midgley, 2001). One motivation to seeking
assistance is performance. Karabenick (2003) has shown that students who adopt mastery
30
goals (a focus on learning and self-improvement) are more likely decide to engage in help
seeking.
Once the decision has been made to seek assistance, a suitable helper must be
found. In classroom contexts, an instructor or fellow student might serve this role. The
criterion for choosing the helper appears to differ by age (Aleven, et al., 2003). For
example, Nelson-LeGall (1981) contend that perceived competence of the helper and his
or her expected sensitivity to the needs of the learner may play a key role in selecting a
helper. Nonetheless, students at the college level have a choice of helpers. These range
from their fellow students, learning resource centers, teaching assistants, review sessions,
and instructors.
Asking for help has been found to correlate significantly with self-regulated
learning strategies (Newman, 1994). When students monitor their academic
performance, show awareness of difficulty they cannot overcome on their own, and
exhibit an effort to remedy that difficulty by requesting assistance from a more
knowledgeable individual, they are exhibiting self-regulated learning strategy (Newman,
2002). Zimmerman (1990) also observed that self-regulated learning employs
extraordinary effort in achieving task. This effort according to Bandura (1993) is
predicated by ability of the students. Students with low ability on a task, and with high
self-regulated learning strategies are bound to seek for help; where as those with low self-
regulated learning skills may avoid seeking-help (Ryan, Pintrich, & Midgley, 2001). As
such, studies have shown that help-seeking is an important self-regulatory strategy that
contributes to student learning (Karabenick & Sharma, 1994; Newman, 1994).
31
Studies on help-seeking among engineering students are limited despite the fact
that help-seeking may be beneficial to students. Most work has been done on advising,
study skills, and curriculum integration. Treisman�s (1985) Emerging Scholars Programs
have been established in many colleges of engineering. These programs have become
sources of assistance and community among students, and have thus encouraged help-
seeking behavior.
Asera�s (2003) review of Emerging Scholars Programs (ESPs) posits that these
programs have become a major source of help to students in need of help. Students who
realize that the task at hand is beyond their ability attend these programs to get assistance.
In fact several studies have pointed out that students who attend these programs to get
assistance do perform higher than their counterparts. For example, Allen (2001) at the
University of Missouri, Rolla showed that engineering students who attended the ESP
program had higher calculus grades than the non ESP participants.
Calculus has been identified as one of the challenging courses among college
students (Gainen & Willemsen, 1995). In calculus class, students are provided with home
work problems, quizzes and exams. After given assignments, quizzes or tests, students
receive feedback. This feedback provides an assessment for the student.
In fact, most of the universities and colleges have developed programs to provide
assistance to students who realize a need for help in this subject area.
Taken together these studies suggest help-seeking is an important factor that
facilitates learning. Students are prone to face difficulties especially, in calculus. The
availability of help resources to students when they face difficulties is crucial. This
present study identifies instructors, teaching assistants, Mathematics Learning Resource

32
Center, review sessions, and study groups as helpful resources. The fact that these
resources are available to students leads to an evaluation of the use in the form of their
help seeking behaviors of students.
Expectancy-related factors
The expectancy related factor identified by this study are the total number of
mathematics courses taken at junior high and high school level, ACT composite scores,
ACT mathematics scores, and high school GPA. The literature will review each of these
four variables as it relates to college entry level calculus course success.
Number of mathematics courses
There are a number of indicators of academic background characteristics. These
indicators are believed to impact mathematics achievement. For example, mathematics
curriculum structure, prior mathematics achievement as measured by GPA, the average
of the highest course completed at the junior high and high school level, overall school
achievement and the course work rigor. One crucial indicator of background
characteristics is the total number of mathematics courses taken at junior high and high
school level (Ma, 2000).
Research in the mid 80s and 90s posits that course taking behavior influences
achievement. Bryk, Lee, and Smith (1990) studied high school organization and its
effects on teachers and students. Among several factors identified was curricular
organization in schools in terms of courses that students take. This has powerful effects
on academic achievement. For instance students who are exposed to many mathematics
courses earlier in junior high school tend to perform well in their subsequent mathematics
courses (Ma, 2000). Further, the principal determinant of student achievement is course
33
taking (Bryk, Lee, & Smith, 1990). Lee, Chow-Hoy, Burkam, Geverdt and Smerdon
(1998) examined mathematics courses students take, whether students are in public,
independent or Catholic schools, and low ability versus high ability in mathematics in
relationship to mathematics achievement among high school students. Among the
findings, the number of mathematics courses taken by students influenced mathematics
achievement in all three groups of students (public, Catholic, independent). They
concluded that mathematics courses students take prior to high school strongly influences
mathematics achievement at high school level.
Raizen and Jones (1985) express similar views from their preliminary review of
indicators of pre-college education in science and mathematics. In this study, they
identified the number of mathematics courses students take as a vital indicator of school
input. This variable shows a dimension of opportunity to learn mathematics as well as
course content. Cool and Keith (1991) examined ability, time spent on homework,
motivation, and academic coursework as they influence learning. They performed a path
analysis on High School and Beyond data to examine the effects of these variables on the
academic achievement of high school seniors. This study reports a strong direct effect of
academic coursework on student achievement. In addition, Smith and Walker (1988)
document that differences in mathematics proficiency among students can be explained
by differences in course taking behavior. Males and females perform equally well if they
have equivalent course taking backgrounds.
Additional research studies continue to confirm the relationship between number
of mathematics courses taken with students� achievement. In a study to determine factors
that influence high school achievement, Chaney, Burgdorf and Atash (1997) analyzed
34
1990 National Assessment of Educational Progress (NAEP) and the 1990 High School
Transcript Study data. They compared students� course taking patterns with their NAEP
achievement scores and with schools� graduation requirements. They reported that
student�s course taking patterns not only influenced graduation but also achievement. In
1995, Hoffer, Rasinski and More analyzed data from the National Education
Longitudinal Study (NELS), which controlled for student background characteristics such
as race. Their findings report a positive relationship between the total number of
mathematics courses completed and gains in achievement test scores from 8 grade to 12
grade. These findings are supported by Lee, Croninger, and Smith (1997) who
investigated how the organization of mathematics curriculum in the U. S. high schools
affects how much students learn in that subject. They used data on background and
academic proficiency of 3, 056 high school seniors in 123 public high schools from the
1990 National Assessment of Educational Progress (NAEP) in mathematics. They
investigated average course work in mathematics courses (in Carnegie units), variability
in academic course-taking in mathematics, proportions of graduates who follow an
academic or college-preparatory program, variability of graduates in an academic
program, proportion of mathematics courses taken that are academic, and average ninth-
grade GPA. The results indicate that students are advantaged by attending schools where
they take more academic mathematics courses. These results support prior findings in this
area, e.g., Rasinski and More (1995). Therefore, from these studies, it is clearly indicted
that the numbers of mathematics courses students take at the junior high and high school
level correlates positively with mathematics achievement.
35
As students progress from junior high to high school, they encounter more
opportunities to take more mathematics courses. Meyer (1998) reported that as students
take more mathematics courses their mathematics achievement gains increases. This
study suggests that as students advance from junior high to high school, they encounter
opportunities to enroll in more mathematics courses. Another study to investigate the
impact of mathematics course taking on student achievement conducted used the 1999
NAEP data. In this study, Campbell, Hombo, and Mazzeo (2000) report that the type of
mathematics courses students take impacts their performance. Among high school
students, they report that students who continuously enroll in progressively more
mathematics courses through out high school score highly on a mathematics achievement
test. A similar study was conducted among eighth grade students using data from the
1992 National Assessment of Educational Progress (NAEP) in mathematics for the nation
and the states. In this study, the researchers examined the mathematics course taking
patterns of eighth grade students and the impact on mathematics achievement. Type of
course and whether or not they were taking mathematics that particular year were the
variables of interest. This study found that students who had enrolled in pre-algebra and
algebra had higher proficiency scores than students taking only eighth grade mathematics
(NAEP Facts, 1996). Similarly, Ma�s (2000) study used six waves of data (grades 7-12)
from the Longitudinal Study of American Youth. This research examined the effects of
advanced mathematics course work on subsequent achievement in, and attitude toward,
mathematics, with partial adjustment for student background characteristics. Results
showed that in the early grades of high school, algebra courses and every advanced
mathematics course significantly affected mathematics achievement. These findings are
36
supported by earlier studies that used the same NELS data. In addition, Lee, Croninger
and Smith (1998) examined the effects of math course taking at the lower grades and
achievement. Their findings suggested that schools that offered courses higher than
algebra and more high �end offerings (especially calculus), their students progressed
farther in the mathematics curriculum. Further, their average achievement in mathematics
was higher compared to students who did not receive the advance mathematics offering.
The findings of these studies have encouraged an increase mathematics offering
in both junior high and high schools. According to Campbell, Jolly, Hoey, and Perlman
(2002), the number of eighth grade students taking Algebra has increased. Hence, the
more eighth grade students take Algebra, the more likely they will take calculus in high
school, according to Gamoran and Hannigan (2000). At the high school level, nearly two-
thirds of 17 year olds report taking Algebra II, Precalculus and/or calculus (Campbell,
Jolly, Hoey, & Perlman, 2002). As a result, NAEP mathematics achievement scores
among high school students have been on the increase.
Noeth, Cruce, and Harmston (2003) conducted a survey among high school
students intending to major in engineering. They report that high school students
planning to major in engineering at the college level take more advanced mathematics
courses. Out of 52,112 students planning to major in engineering, 56 percent took
calculus high whereas all students took Algebra 1, Algebra 2, and geometry. Further, 67.7
percent took of those planning to major in engineering trigonometry, and another 62.9
percent taking another advanced math course beyond Algebra II.
Number of mathematics courses taken at the junior high and high school levels
appears to have a strong correlation with mathematics achievement scores. These studies
37
have shown that advanced mathematics courses are an indicator of student�s mathematic
academic background. Besides, these studies indicate an increase in advanced
mathematics course taking patterns among students, especially students planning to join
engineering majors in colleges. Another important aspect revealed by these studies is that
students who take advanced mathematics courses continue to enroll in progressively
more advanced mathematics courses. Thus, students who take more and advanced
mathematics courses during their junior high and high school levels not only perform
higher in the mathematics, but also develop deep conceptual understanding.
In summary, the literature has shown that both number of mathematics courses
taken by students at the junior high and high school levels are very important academic
background characteristics for calculus achievement.
ACT scores
Another indicator of academic background aptitude is the ACT score. ACT score
primarily measures educational achievement in college-preparatory courses (ACT, 1997).
Thus various studies have used ACT scores as an academic background indicator. For
example, Edge and Friedberg (1984) examined factors affecting achievement in first
calculus course among freshman students at Illinois State University. They examined the
predictive power of several academic variables such as ACT scores, SAT scores, high
school GPA, high school rank, and placement scores. This study reported that among
variables such as high school rank, Algebra skills and concepts, ACT math scores were
the best predictors of first year calculus success. Students with high ACT math scores
were predicted to receive higher grades in the course. In addition, Wilhite, Windham, and
Munday, (1998) included ACT math scores, high school rank, age and high school
38
mathematics achievement as academic achievement predictors in first year calculus
course among college freshman. Their findings showed ACT math score to be a stronger
predictor of calculus success. Similarly, Allen (2001) examined the impact of pre-entry
characteristics of ACT math score and high school percentile rank on first semester
college GPA among freshman engineering students. He reported that 28.6 percent of the
variance in first-semester college GPA could be attributed to ACT math scores and high
school percentile rank. In another study examining high school GPA and ACT scores in
predicting college academic success, Noble and Sawyer (2002) analyzed of the 1996-97
ACT data comprised of 219,435 first year students from 301 postsecondary institutions.
The results of their analysis suggest that ACT score and high school GPA jointly are
more accurate in predicting first year college GPA. The use of ACT scores in predicting
success in first year calculus is also demonstrated in Dougherty and Cooley (2003) study
The inclusion of the ACT scores, specifically the composite and math scores for the
present study is clearly indicated by the literature reviewed. Further, at the present
institution, ACT scores and high school GPA are criteria used for admission in the
engineering program. The use of ACT scores is certainly an indicator of students�
academic background and thus serves as an important variable in this study.
High school GPA
High school GPA is an indicator of student�s high school performance
(Dougherty & Cooley, 2003). In addition, high school GPA has been used to predict
students� college performance. For example, Beecher and Fischer (1999) analyzed high
school courses and GPA as predictors of college success among 409 students at Utah
Valley State College. High school GPA was reported to be the most powerful predictor of
39
success and thus retention. Similarly, Miceri (2001) found that high school GPA had a
stronger relationship to student outcomes than test scores from analyzing nine years of
data from over 15, 000 students at the University of South Florida. Several studies have
considered high school GPA as an indicator of mathematics or calculus performance in
college. For example, Dougherty and Cooley (2003) used high school GPA to predict
calculus performance among engineering students at Colorado University.
Research studies on engineering students have continued to examine the impact of
high school GPA on calculus achievement, college success, persistence and retention in
the engineering program. For instance, in a study investigating the predictive effects of
high school calculus and other variables on achievement in first semester college calculus
courses among college freshman students, Wilhite, Windham, and Munday (1998)
examined high school GPA, high school rank, ACT scores, and age. Their analyses report
that high school GPA was among the strong predictors of calculus achievement in the set
of variables. Students who had high GPA performed well in their first college calculus
course. Similarly, Perkins (2002) examined academic aptitude variables, SAT scores,
high school GPA, high school rank, and high school grades in mathematics courses,
mathematics placement scores and their impact on persistence in the engineering program
among freshman engineering students. Among the variables reported to be significant in
predicting success, thus persistence in the program, was high school GPA. In another
study at the University of California, Davis, Frye-Lucas (2003) identified high school
GPA as an educational background indicator. The impact of high school GPA on calculus
success among African-American freshman engineering students was examined. The
results show high school GPA and number of high school mathematics courses were
40
strong predictors of student outcomes in first year calculus. More recently, Dougherty
and Cooley (2003) predicted student performance in freshman calculus. They report that
high school GPA was a strong predictor of calculus performance. Students with high high
school GPA�s tended to pass the first calculus course.
These studies all suggest that high school GPA can be a measure of academic
background. In fact, Bonsangue and Drew (1995) posit that high school GPA provides a
measure of precollege achievement as well as academic expthe Universityre. Hence the
current study plans to examine the impact of high school GPA on calculus.
Academic background characteristics play a crucial role in achievement.
Literature reviewed identified indicators of academic background believed to influence
calculus achievement at the college level. These are the number of mathematics of
courses students take at the junior high and high school levels. Such courses are believed
to provide the conceptual understanding and foundation to more advanced mathematics
courses such as calculus at the college level. In addition, the expthe Universityre to many
and advanced courses at the pre-college level is believed to influence students� attitude
toward mathematics. As students enroll in more mathematics courses, they appear more
likely to positively perceive mathematics. This perception can influence performance in
the long run.
In conclusion this study will examine the number of mathematics courses taken at
the junior high and high school. In addition, high school GPA and ACT composite and
ACT math scores will be examined to determine their influence on first year calculus
course success among freshman engineering students.
41
Chapter Summary
This chapter outlines eight variables affecting calculus success among freshman
engineering students. Taken together these variables are based on strong theoretical
foundation from the Eccles et al. (1983) expectancy-value model. Expectancy and value
are independent of each other (Eccles et al., 1983). Within this model, utility valuing of
calculus, self-regulated learning, classroom academic engagement, and student�s help-
seeking behavior are identified as a value-related factors. The review discussed how each
indicator influences achievement. In addition, academic background characteristics are
identified as an expectancy-related factor. The chapter reviewed four variables of
academic background characteristics. The four are the number of mathematics courses
taken at junior high and high school levels together, ACT composite score, ACT math
score, and high school GPA. Studies reviewed suggested that the number of mathematics
courses taken at junior high and high school levels, high school GPA, and ACT
composite scores and mathematics sub scores are good indicators of students�
mathematics background characteristics.
In conclusion, this literature review has provided a basis for exploring these eight
variables and their impact on calculus achievement among freshman engineering students
at one large Midwestern university. The expectancy-value theory provides a theoretical
framework for uniting these factors. Table 1 summarizes the factors, corresponding
variables, and corresponding variable indices identified in this study.
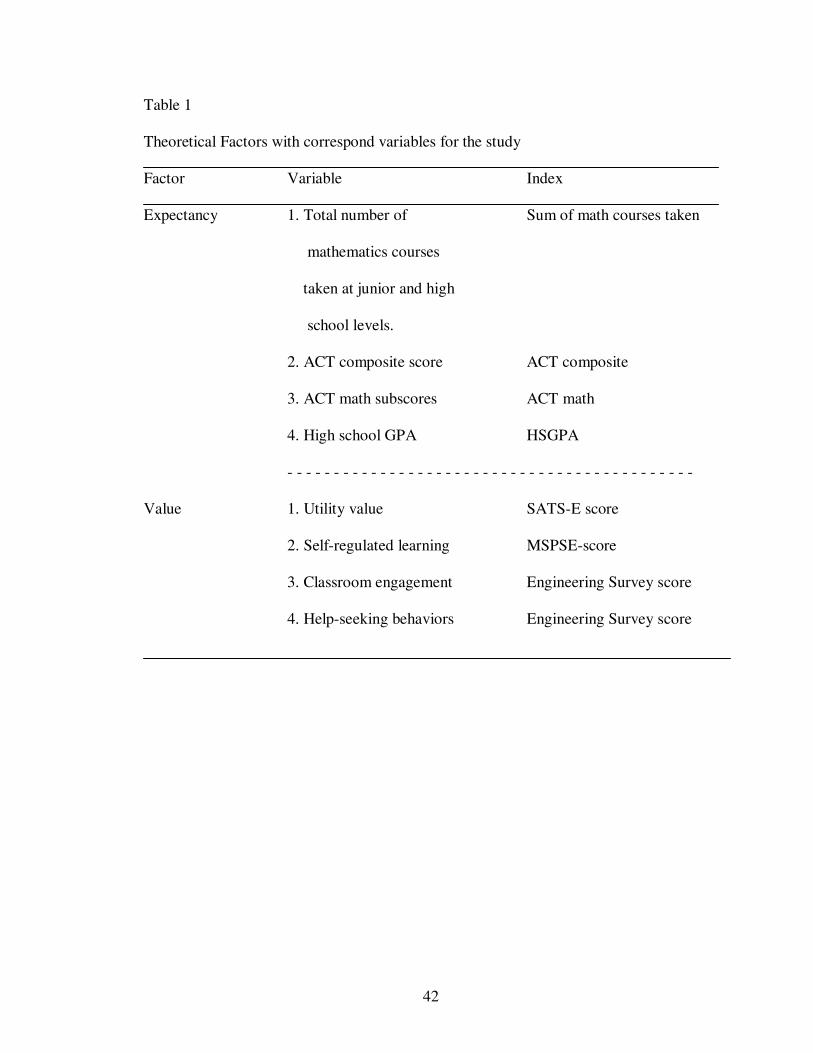
42
Table 1
Theoretical Factors with correspond variables for the study
Factor Variable Index
Expectancy 1. Total number of Sum of math courses taken
mathematics courses
taken at junior and high
school levels.
2. ACT composite score ACT composite
3. ACT math subscores ACT math
4. High school GPA HSGPA
- - - - - - - - - - - - - - - - - - - - - - - - - - - - - - - - - - - - - - - - - - - -
Value 1. Utility value SATS-E score
2. Self-regulated learning MSPSE-score
3. Classroom engagement Engineering Survey score
4. Help-seeking behaviors Engineering Survey score
43
CHAPTER THREE
Research Method
The purpose of this study was to examine the theoretical path model of
expectancy-value variables that predict calculus success among freshmen engineering
students. This study examined eight variables. These were total number of mathematics
courses taken at junior high and high school levels, ACT composite score, ACT math
score, high school GPA, utility value (valuing of calculus), student class engagement
habits, help-seeking behaviors, and self-regulated learning. These factors were examined
under the expectancy-value theory. The study was guided by the following questions.
Research questions
1. Are the theoretical expectancy variables (total number of mathematics courses
taken at junior high and high school level, ACT composite, ACT math,
HSGPA) significantly related? In other words, do these variables represent the
�expectancy� construct?
2. Are the theoretical value variables (utility value, class engagement, help-
seeking behavior, self-regulated learning) significantly related? In other
words, do these four variables represent the �value� construct?
3. Is the theoretical expectancy-value model supported by these data?

44
To answer these three research questions, this chapter is divided into five sections.
The first section provides the background information. The second section describes the
sample used in the study. The third section describes the measures used. Section four
reviews the variables used in the study, and describe the procedures used to collect the
data. The fifth section provides a description of the statistical analyses used to analyze the
data obtained.
Background
The setting of the study was the College of Engineering, at a large Midwestern
university. The target population of this study was all freshmen-engineering students
enrolled in one entry-level calculus course during Fall 2002 and Spring 2003 semesters.
The Dean�s office of the College of Engineering Architecture and Technology at this
university, through their Student Assessment Specialist and Student Information
Services, compiled a list of all freshman engineering students enrolled during the targeted
time frame. In the compiled list, both telephone contacts of the students and their parents
were included. A total of 512 students were identified. The contact information was vital
for this study. Data collection was done through the administration of the instrument via
telephone. Since the list contained all the students during the proposed time frame, all
students on the list were contacted. An Institutional Review Board approval was obtained
to collect data (See Appendix A). An implied consent statement (see Appendix B) was
used to solicit each student�s participation. Only students who were eighteen or older in
age were contacted by the BSR to participate in the study, therefore parents were not
contacted. Participation was solely voluntarily. The Bureau for Social Research (BSR) at
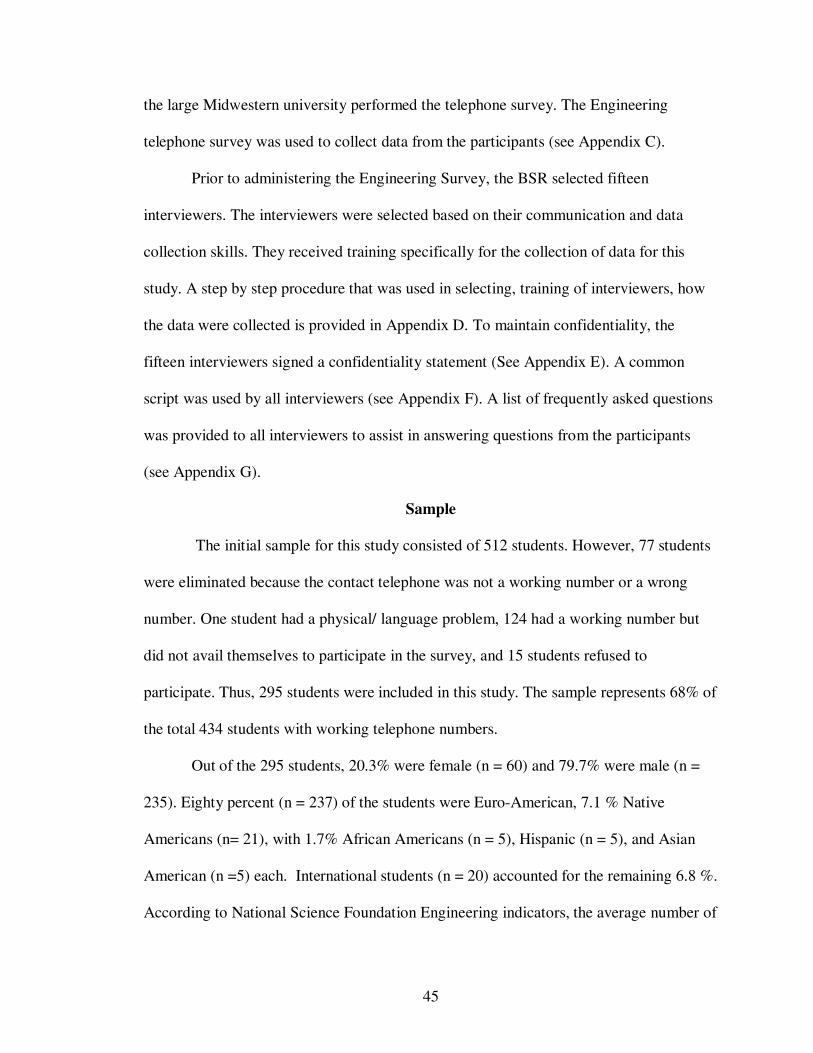
45
the large Midwestern university performed the telephone survey. The Engineering
telephone survey was used to collect data from the participants (see Appendix C).
Prior to administering the Engineering Survey, the BSR selected fifteen
interviewers. The interviewers were selected based on their communication and data
collection skills. They received training specifically for the collection of data for this
study. A step by step procedure that was used in selecting, training of interviewers, how
the data were collected is provided in Appendix D. To maintain confidentiality, the
fifteen interviewers signed a confidentiality statement (See Appendix E). A common
script was used by all interviewers (see Appendix F). A list of frequently asked questions
was provided to all interviewers to assist in answering questions from the participants
(see Appendix G).
Sample
The initial sample for this study consisted of 512 students. However, 77 students
were eliminated because the contact telephone was not a working number or a wrong
number. One student had a physical/ language problem, 124 had a working number but
did not avail themselves to participate in the survey, and 15 students refused to
participate. Thus, 295 students were included in this study. The sample represents 68% of
the total 434 students with working telephone numbers.
Out of the 295 students, 20.3% were female (n = 60) and 79.7% were male (n =
235). Eighty percent (n = 237) of the students were Euro-American, 7.1 % Native
Americans (n= 21), with 1.7% African Americans (n = 5), Hispanic (n = 5), and Asian
American (n =5) each. International students (n = 20) accounted for the remaining 6.8 %.
According to National Science Foundation Engineering indicators, the average number of
46
engineering students enrolled in engineering programs in America is 80 % are male and
20% are female (NSF, 2004). Of the engineering students enrolled, 15.5 % represents all
the minorities (NSF, 2004). Thus, the student sample in this study mirrors the national
average of students enrolled in engineering programs. Therefore, this sample is
representative of the population of engineering students taking calculus.
Procedures
The BSR obtained the Engineering Survey data and constructed an initial data
file. The researcher then matched the BSR databank participants with the archived
student database to compile the final databank used in the analysis. Table 2 provides the
factors, variables, and source of each of the items source used in this study.
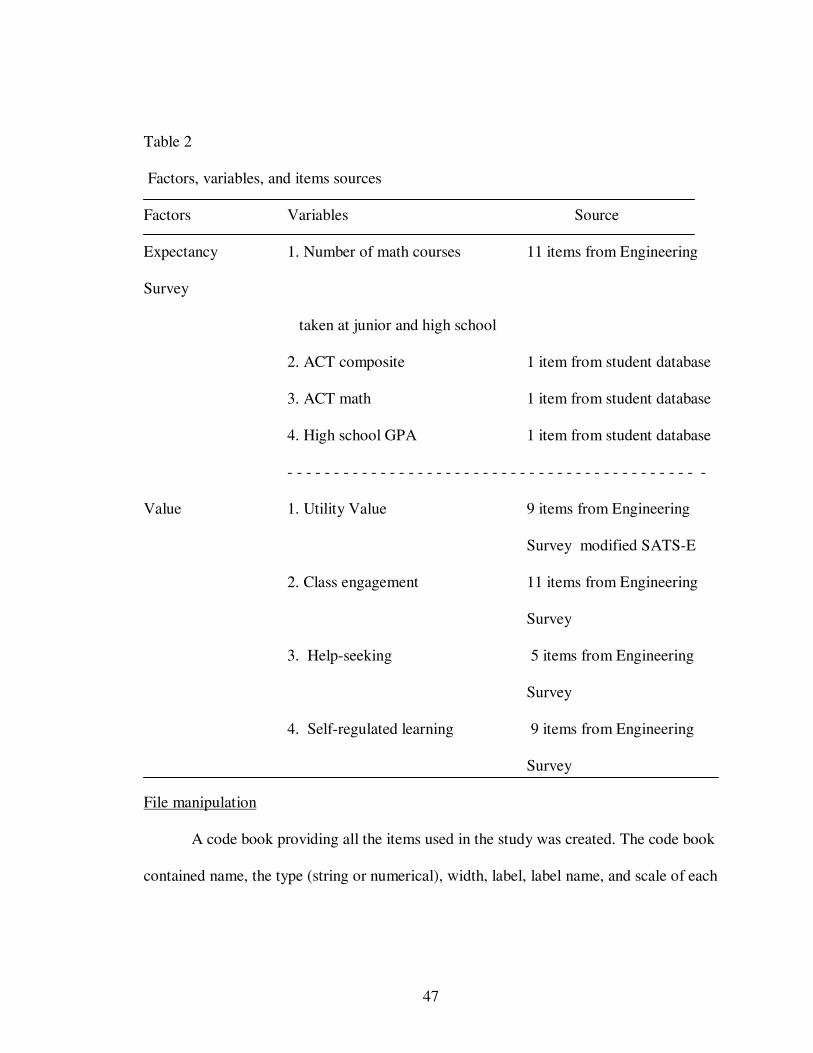
47
Table 2
Factors, variables, and items sources
Factors Variables Source
Expectancy 1. Number of math courses 11 items from Engineering
Survey
taken at junior and high school
2. ACT composite 1 item from student database
3. ACT math 1 item from student database
4. High school GPA 1 item from student database
- - - - - - - - - - - - - - - - - - - - - - - - - - - - - - - - - - - - - - - - - - - - -
Value 1. Utility Value 9 items from Engineering
Survey modified SATS-E
2. Class engagement 11 items from Engineering
Survey
3. Help-seeking 5 items from Engineering
Survey
4. Self-regulated learning 9 items from Engineering
Survey
File manipulation
A code book providing all the items used in the study was created. The code book
contained name, the type (string or numerical), width, label, label name, and scale of each
48
variable collected for this study. In addition, missing numbers were identified. Appendix
H shows a section of the code book constructed for this study.
After a code book was created, the researcher computed new variables from
existing variables. Five new variables had to be created. These were composite scores of
utility value, class engagement, help-seeking behavior, and self-regulated learning. SPSS
for windows version 12.0 was used to calculate composite scores for each of the five
variables. Number of mathematics courses taken at junior and high school level was
computed by summing up the 11 items identified in the Engineering Survey. Utility value
variable was computed by summing up the 9 items from collected from Engineering
Survey. Class engagement variable was computed by summing up the 11 items from the
Engineering Survey that assessed this variable. Help-seeking behavior was computed by
summing the 5 items from the Engineering Survey used to assess this variable. Finally,
self-regulated learning variable was computed by summing up the 9 items from the
Engineering Survey used to assess this variable. All five variables were added to the data
file.
The next step, the researcher recoded existing variables to new variables. The
variables that were recoded were gender, race, calculus course grade, and country of
origin. All these variables were strings and hence were recoded to numeric format. For
example �Female� was recoded to �1� and �Male� to �2�. Finally the researcher ran
frequencies on all variables to detect data entry problems.
49
Measures
Telephone survey
The measure developed for this study is known as the Engineering Survey (see
Appendix C). Table 3 provides the factors, variables, and the range of scores for each
variable used from the Engineering Survey. It should be noted that not all Engineering
Survey items were used in this study. Of the 58 engineering survey items, 47 items were
selected for use by the researcher in the current study.
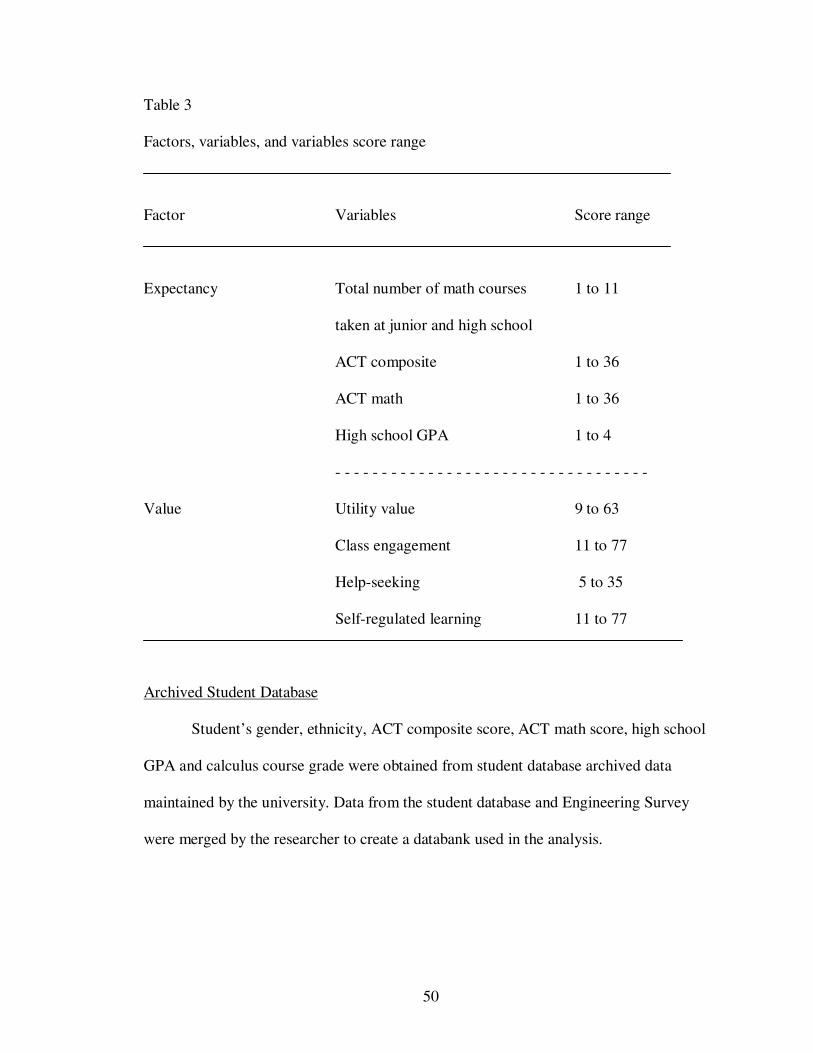
50
Table 3
Factors, variables, and variables score range
Factor Variables Score range
Expectancy Total number of math courses 1 to 11
taken at junior and high school
ACT composite 1 to 36
ACT math 1 to 36
High school GPA 1 to 4
- - - - - - - - - - - - - - - - - - - - - - - - - - - - - - - - - -
Value Utility value 9 to 63
Class engagement 11 to 77
Help-seeking 5 to 35
Self-regulated learning 11 to 77
Archived Student Database
Student�s gender, ethnicity, ACT composite score, ACT math score, high school
GPA and calculus course grade were obtained from student database archived data
maintained by the university. Data from the student database and Engineering Survey
were merged by the researcher to create a databank used in the analysis.
51
Research Variables
Table 2 provides the factors, variables, and the source of items assessing each
variable. Two sources were used to assess the variables in this study. These sources were
the Engineering Survey, which assessed number of mathematics courses taken at the
junior high and high school level, utility value, classroom engagement, help-seeking
behavior, and self-regulated learning. The student database at the large Midwestern
university provided ACT composite scores, ACT math scores, and high school GPA.
Dependent variable
The dependent variable in this study was calculus success. This variable was
scaled from 5 to 1. An �A� grade = 5, �B� grade = 4, �C� grade = 3, �D� = 2, �F� = 1.
This variable was obtained from the SIS archived data.
Independent variables
A total of eight research variables representing the expectancy-value factors were
examined with regard to calculus success in this study. Four variables of students�
academic background represented expectancy. These are number of mathematics courses
taken at junior and high school levels, ACT composite score, ACT math score, and high
school GPA. Four other variables, utility value, class engagement, help-seeking, and self-
regulated learning, represented value. These variables are shown in Table 3.
Scales for variables
The first variable cited in Table 2, the number of mathematics courses taken at
junior high and high school level was a sum of all the mathematics courses a student took
during those years as reported by the student. For example, if a student took Algebra I in
eighth grade, pre-calculus in ninth grade, trigonometry and calculus in tenth grade, AP
calculus in eleventh grade and geometry in twelfth grade, their score on this variable was
52
six. Scale scores on this variable ranged from 1 to 11. A high score on this variable
means the student took many mathematics courses at the junior and high school level.
ACT composite and ACT math score were obtained from the SIS archived data.
ACT scores are standardized measures that range from 1 to 36. ACT scores assess
college readiness (ACT, 2004). College readiness refers to level of preparation a student
needs to be ready to enroll and succeed without remediation in a credit-bearing course in
college (ACT, 2004). As such, ACT scores are indicators of educational background
experiences of students. A high score on this variable means the student was ready for
college education (ACT, 2004).
High school GPA is a measure of student�s success in high school. High school
GPA is a measure of student�s academic performance (Noble & Sawyer, 2002). Both
high school GPA and ACT scores have been effective in predicting success of first �year
college GPA (Noble & Sawyer, 2002). Despite issues such as grade inflations, high
school GPA is used as one of the many college admission criteria (Noble & Sawyer,
2002). High school GPA ranged from 1 to 4. A high score on this variable indicated a
higher high school performance. These four variables are identified as expectancy
related variables.
The next four variables were considered value-related factor. The first one was
utility value. Utility value (valuing of calculus) variable was assessed using Schau�s
(1995) modified SATS-E. Replacing the term �statistics� with �calculus� in all the nine
items did the modification on this subscale. For example instead of, �Statistics is
worthless.� the modification to this statement was �Calculus is worthless.� This scale was
designed to measure student�s perceived worthiness of calculus. The subscale has 9
53
items. Students responded to items rated according to a 7-point Likert-type scale. For
example, �Calculus is worthless.� With choices �1� = �strongly disagree� to �7� =
�strongly agree�. A composite score across the 9 items was used as the measure of utility
value in this study. The scores ranged from 15 to 62, with higher scores indicating greater
perception of utility value of calculus to the student.
Other researchers have used this subscale. For example, Sorge (2001) used the
subscale to assess the value of statistics among engineering students and reported a
Cronbach�s alpha reliability estimate value of .78. This estimate suggests reasonable
internal consistency reliability. More recently, Hilton, Schau, and Olsen (2004)
investigated the attitude of college students toward statistics using the value subscale and
reported a Cronbach�s alpha coefficient of .68. In the current study, coefficient alpha
estimated for this modified value subscale was .73. This suggests reasonable internal
consistency reliability for this student sample.
The next value related variable assessed was class engagement. This variable was
assessed with a total of 11 items. One item used a 4-point Likert-type scale. The question
was, �How many notes did you take?� The choices were �1 = none�, �2 = occasionally
recorded important concepts�, �3 = recorded a summary of each lecture�, and �4 =
recorded everything the instructor wrote on the board or showed on the screen.� Three
items used a 5 �point Likert-type scale. These items were, for example, �How often did
you read the textbook sections before class that corresponded to that day�s lecture?�
Choices were �1�= �never� to �5� = �always�. Another example item is, �How much
time did you spend reviewing your notes when working on homework problems?� The
response choices ranged from �1� = �never� to �5� = �more that 1 hour and a half�. Four
54
items were rated on 6-point Likert-type scale. These items inquired how much time
students spent preparing for different tasks for class, for example, �What percentage of
the time did you attempt your homework problems within the week they were assigned?�
The response choices ranged from �1� = �never� to �6� = �90 to 100% of the time.�
Finally three items on this variable were scored along a 8-point Likert-type scale. These
items inquired on how much time students spent in studying before exams, for example,
�How many hours did you spend studying for your first major exam?� The choices
ranged from �1� = �0� to �8� = �more than 10 hours.� A composite score across all the
11 items served as the variable score. The composite score for class engagement ranged
from 11 to 77. A higher composite score on the variable indicated more class engagement
while a low score indicated a little class engagement by the student.
Third value related variable was student�s help-seeking behavior. This variable
was assessed in the same manner as class engagement. Five items were used to assess this
variable. Each item measured the number of times the student sought help or used the
available resources while enrolled in the calculus course. For example, �How many times
did you contact your instructor for help during office hours?� Choices were �1� = �0� to
�7� = �more than 10 times�. Students responded to all five items according to a 7-point
Likert-type scale, with higher scores indicating higher help-seeking behavior. The score
range for this help-seeking variable was 5 to 35.
Self-regulated learning was the fourth value related variable. This variable was
assessed with Bandura�s (1989) self-regulated learning (SRL) subscale from his
Multidimensional Scales of Perceived Self-Efficacy. This scale was designed to measure a
student�s perceived capability to use various self-regulated strategies. The subscale has
55
11 items. Students responded to items rated along a 7-point Likert-type scale. For
example, �How well can you complete your homework assignments by posted
deadlines?� With choices �1� = �not well at all� to �7� = �very well�. A composite score
across the 11 items was used as a measure of self-regulated learning. The scores ranged
from 11 to 77, with higher scores indicating greater capability perceptions for self-
regulating learning.
Studies that have used this scale have reported on the internal consistency
reliability of the subscale. For example, Miller (2000) reported alpha coefficient
estimates of .90 (English) and .93 (Math) with a sample of junior and high school
students, while Williams and Hellman (2004) reported an alpha coefficient of .79 while
assessing the self-regulated learning strategies of a sample of college students studying
online. These values suggest a reasonable level of reliability. In the current study,
coefficient alpha for the SRL scale was .74, which suggested a reasonable level of
reliability for this student sample.
Data analysis plan
Data were analyzed using SPSS version12 for windows. Univariate descriptive
statistics were obtained to analyze the data distribution and to ensure accuracy of data
entry. Bivariate correlations for all variables in the study were also obtained. Data
analysis proceeded in two phases to answer the research questions of the study.
56
Phase I
This phase of the analysis responded to research question one and two. The
questions were:
1. Are the theoretical expectancy variables (total number of mathematics courses
taken at junior high and high school level, ACT composite, ACT math,
HSGPA) significantly related? In other words, do these variables represent the
�expectancy� construct?
2. Are the theoretical value variables (utility value, class engagement, help-
seeking behavior, self-regulated learning) significantly related? In other
words, do these four variables represent the �value� construct?
To answer research question one, bivariate correlations for the four expectancy
variables were obtained. The pattern of significant correlations among variables was
noted. Similarly, to answer research question two, bivariate correlations for the four
value variables were obtained. The pattern of significant correlations among these
variables was noted.
Phase II
This phase of the analysis responded to research question three which was:
3. Is the theoretical expectancy-value model supported by these data?
A path analysis was conducted to answer this research question. Stage and Nora
(2004) describe a path diagram as an illustration wherein the variables are identified and
arrows from variables are drawn to other variables to indicate theoretically based causal
relationships. The independent variables are called exogenous variables. Exogenous
variables in a path model are those variables with no explicit causes (no arrows going to
57
them, other than the measurement error term). The dependent variables are called
endogenous variables. Endogenous variables, then, are those which do have incoming
arrows. Endogenous variables include intervening causal variables and dependents.
Intervening endogenous variables have both incoming and outgoing causal arrows in the
path diagram.
Figure 2 provides a path diagram used to guide the analysis. In this study, calculus
course grade was the dependent (endogenous) variable. Calculus had incoming arrows
only. The independent (exogenous) variables were the total number of mathematics
courses taken at junior high and high school level, ACT composite score, ACT math,
high school GPA, utility value, class engagement, help-seeking behavior, and self-
regulated learning. All eight variables had outgoing arrows only. A full, standard multiple
regression was conducted to assess theoretical fit of the model.
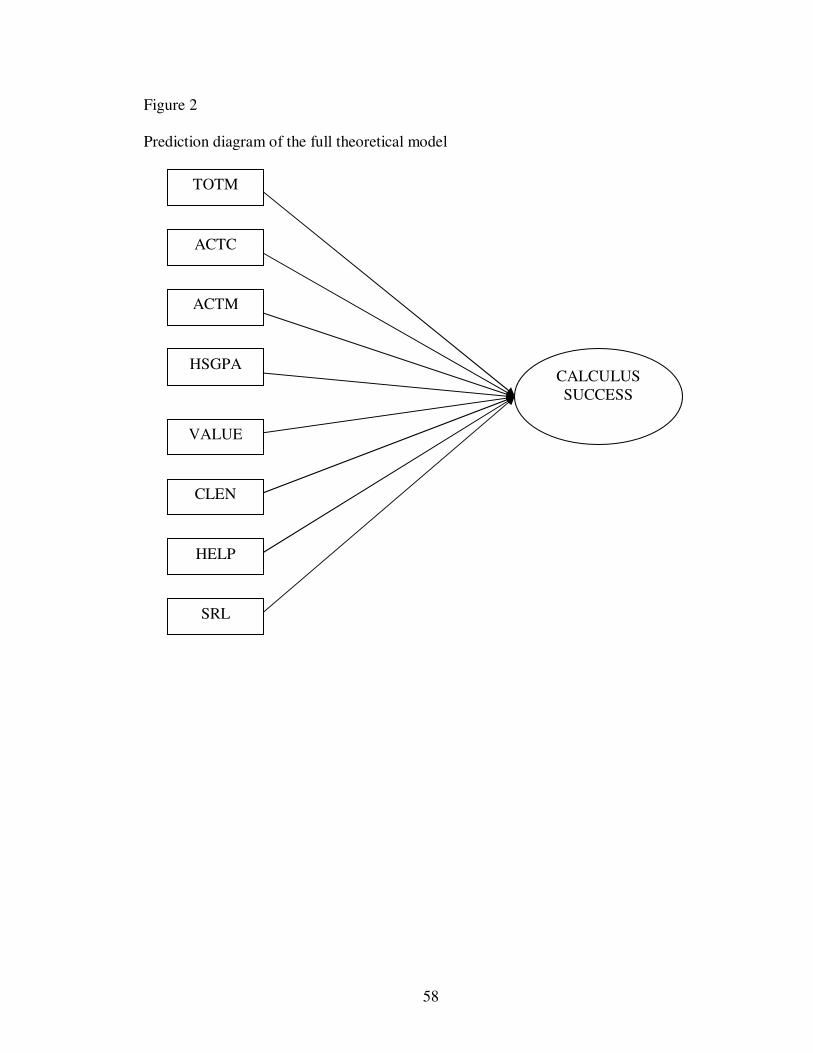
58
Figure 2
Prediction diagram of the full theoretical model
TOTM
ACTC
ACTM
HSGPA CALCULUS SUCCESS
VALUE
CLEN
HELP
SRL
59
Chapter summary
This chapter has described background information about the study, the sample,
measures, variables, procedures, and data analysis plan for the study. Freshmen
engineering students enrolled in calculus in the Fall 2002 and Spring 2003 semesters
were the target students. Two primary sources of data were used. Data collected from
Student database at the large Midwestern university and the telephone-administered
Engineering Survey were the two sources. A detailed procedure of how the study was
conducted and a discussion of the data analysis plan were provided. The data analysis
was divided into two phases. Phase one of data analysis focused on first and second
research questions while phase two focused on presenting and testing the theoretical
model proposed by this study. The results of data analysis are presented in chapter IV.
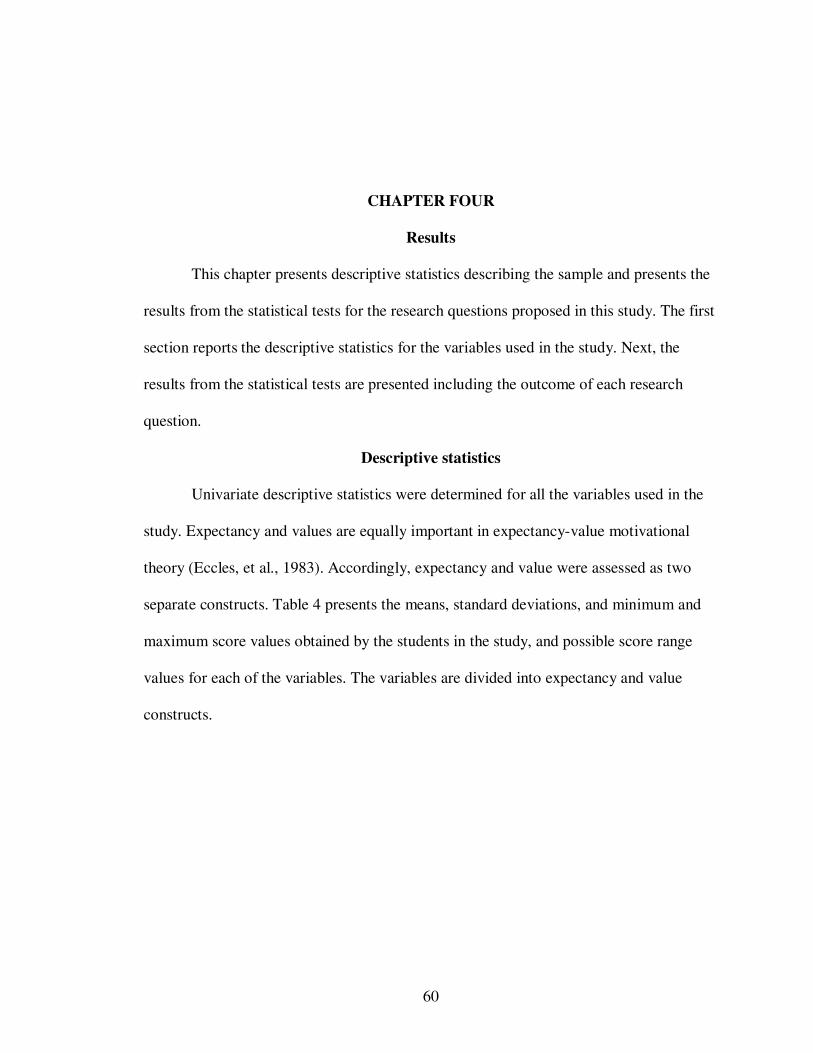
60
CHAPTER FOUR
Results
This chapter presents descriptive statistics describing the sample and presents the
results from the statistical tests for the research questions proposed in this study. The first
section reports the descriptive statistics for the variables used in the study. Next, the
results from the statistical tests are presented including the outcome of each research
question.
Descriptive statistics
Univariate descriptive statistics were determined for all the variables used in the
study. Expectancy and values are equally important in expectancy-value motivational
theory (Eccles, et al., 1983). Accordingly, expectancy and value were assessed as two
separate constructs. Table 4 presents the means, standard deviations, and minimum and
maximum score values obtained by the students in the study, and possible score range
values for each of the variables. The variables are divided into expectancy and value
constructs.
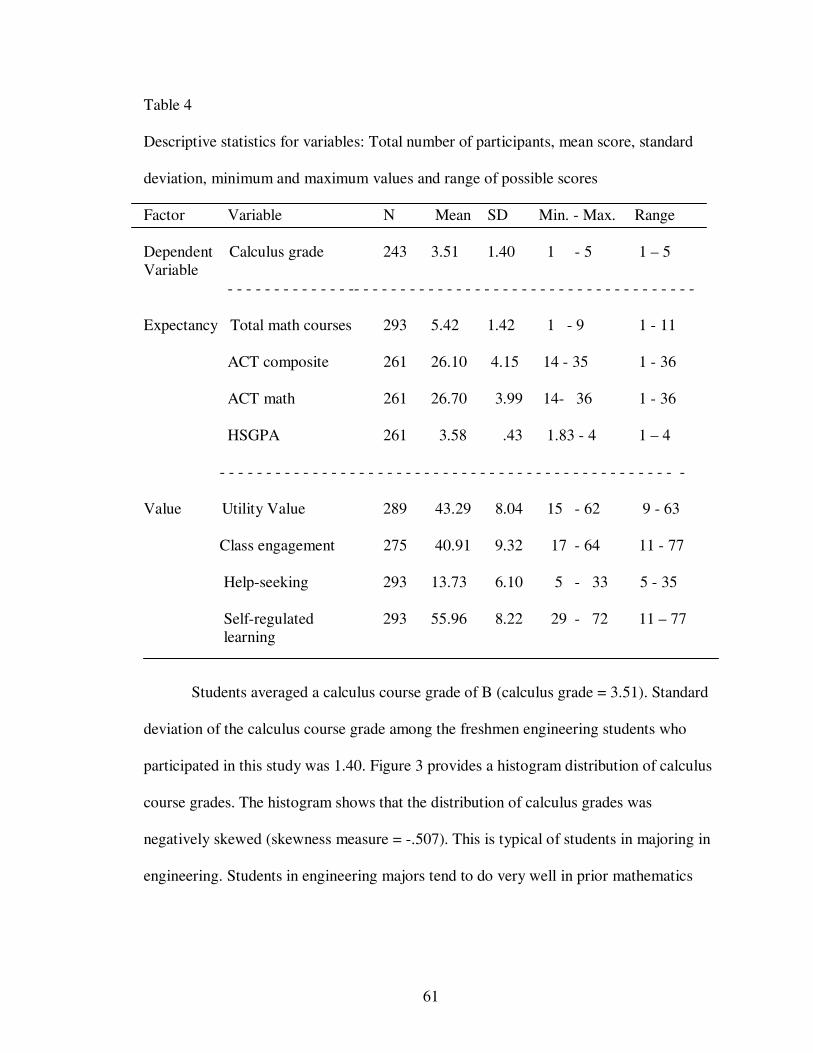
61
Table 4
Descriptive statistics for variables: Total number of participants, mean score, standard
deviation, minimum and maximum values and range of possible scores
Factor Variable N Mean SD Min. - Max. Range
Dependent Calculus grade 243 3.51 1.40 1 - 5 1 � 5 Variable - - - - - - - - - - - - - -- - - - - - - - - - - - - - - - - - - - - - - - - - - - - - - - - - - - -
Expectancy Total math courses 293 5.42 1.42 1 - 9 1 - 11
ACT composite 261 26.10 4.15 14 - 35 1 - 36
ACT math 261 26.70 3.99 14- 36 1 - 36
HSGPA 261 3.58 .43 1.83 - 4 1 � 4
- - - - - - - - - - - - - - - - - - - - - - - - - - - - - - - - - - - - - - - - - - - - - - - - - -
Value Utility Value 289 43.29 8.04 15 - 62 9 - 63
Class engagement 275 40.91 9.32 17 - 64 11 - 77
Help-seeking 293 13.73 6.10 5 - 33 5 - 35
Self-regulated 293 55.96 8.22 29 - 72 11 � 77 learning
Students averaged a calculus course grade of B (calculus grade = 3.51). Standard
deviation of the calculus course grade among the freshmen engineering students who
participated in this study was 1.40. Figure 3 provides a histogram distribution of calculus
course grades. The histogram shows that the distribution of calculus grades was
negatively skewed (skewness measure = -.507). This is typical of students in majoring in
engineering. Students in engineering majors tend to do very well in prior mathematics
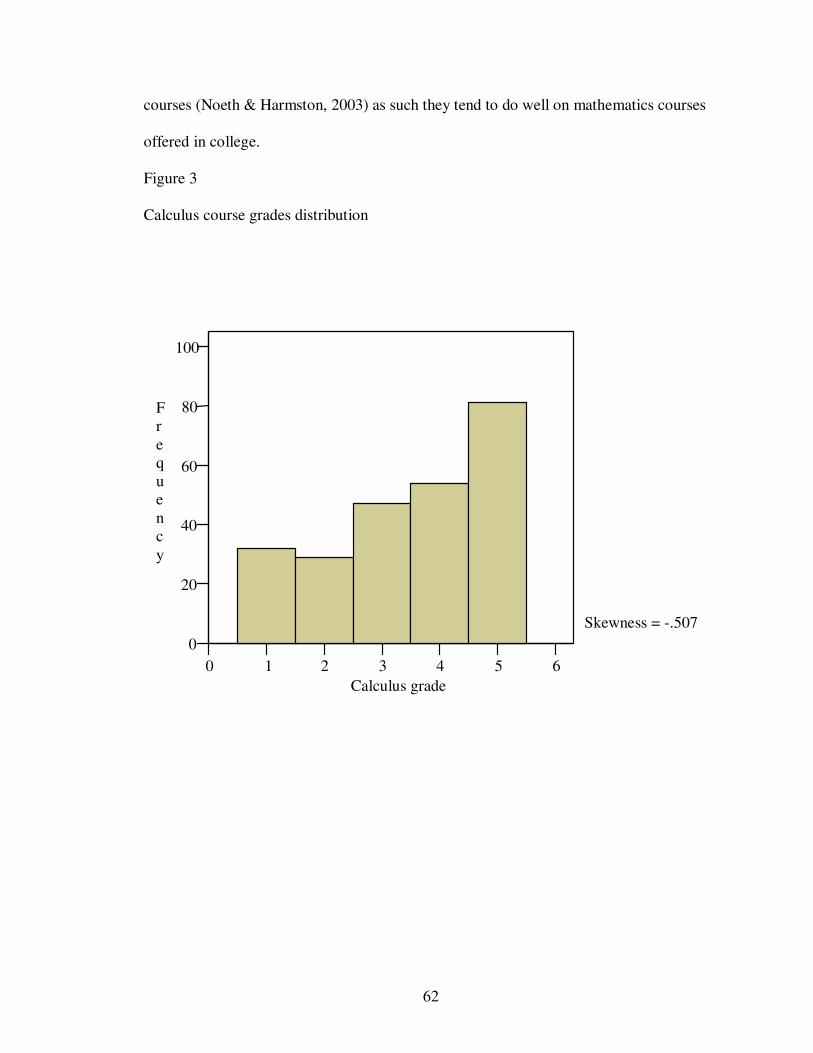
62
courses (Noeth & Harmston, 2003) as such they tend to do well on mathematics courses
offered in college.
Figure 3
Calculus course grades distribution
0 1 2 3 4 5 6 Calculus grade
0
20
40
60
80
100
F r e q u e n c y
Skewness = -.507
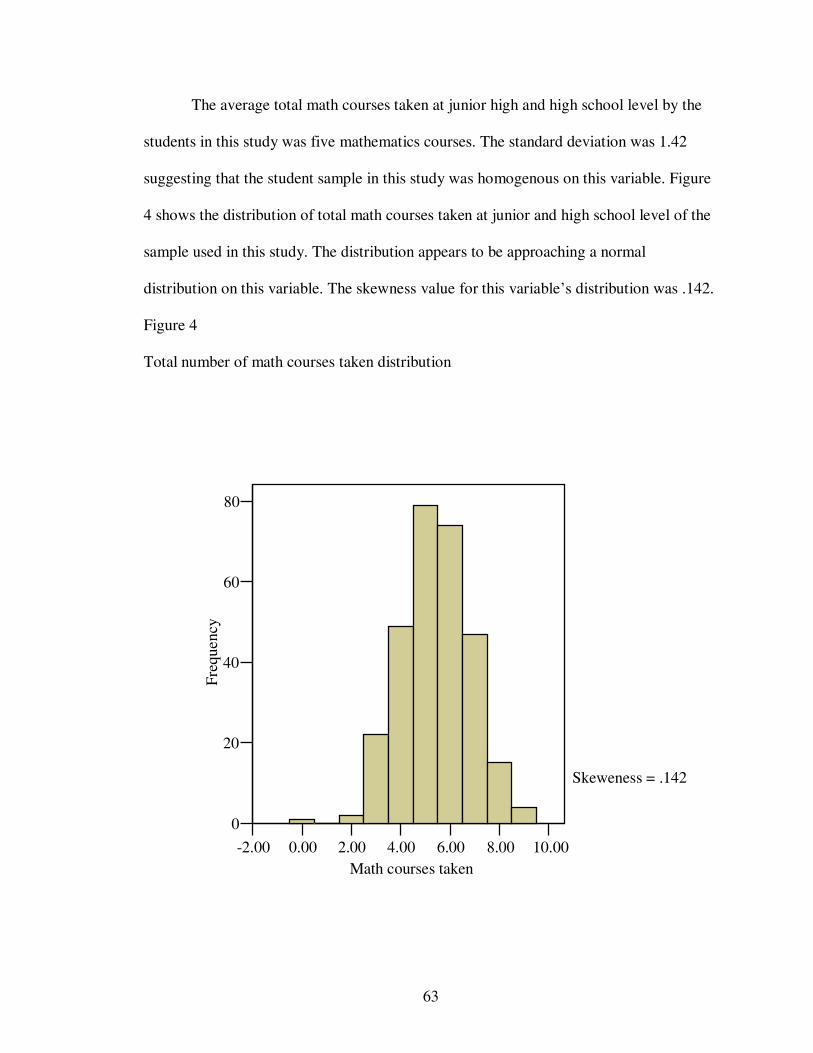
63
The average total math courses taken at junior high and high school level by the
students in this study was five mathematics courses. The standard deviation was 1.42
suggesting that the student sample in this study was homogenous on this variable. Figure
4 shows the distribution of total math courses taken at junior and high school level of the
sample used in this study. The distribution appears to be approaching a normal
distribution on this variable. The skewness value for this variable�s distribution was .142.
Figure 4
Total number of math courses taken distribution
-2.00 0.00 2.00 4.00 6.00 8.00 10.00Math courses taken
0
20
40
60
80
Freq
uenc
y
Skeweness = .142
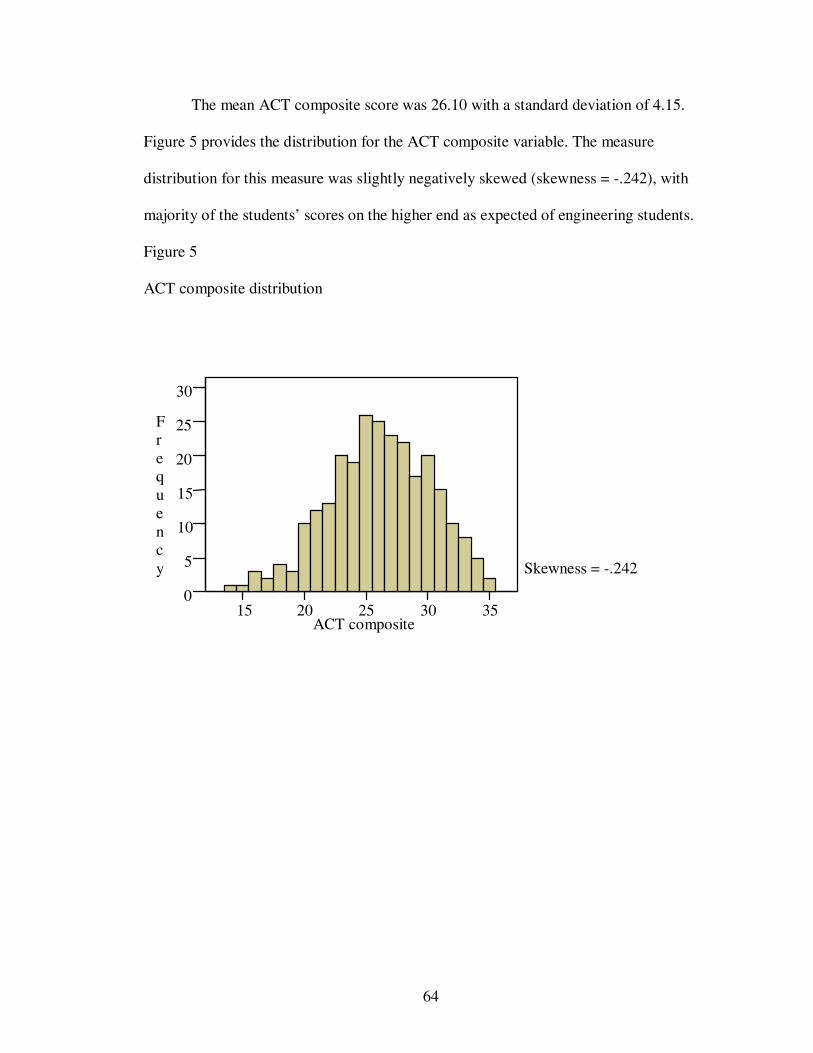
64
The mean ACT composite score was 26.10 with a standard deviation of 4.15.
Figure 5 provides the distribution for the ACT composite variable. The measure
distribution for this measure was slightly negatively skewed (skewness = -.242), with
majority of the students� scores on the higher end as expected of engineering students.
Figure 5
ACT composite distribution
15 20 25 30 35 ACT composite
0
5
10
15
20
25
30
Skewness = -.242
F r e q u ency
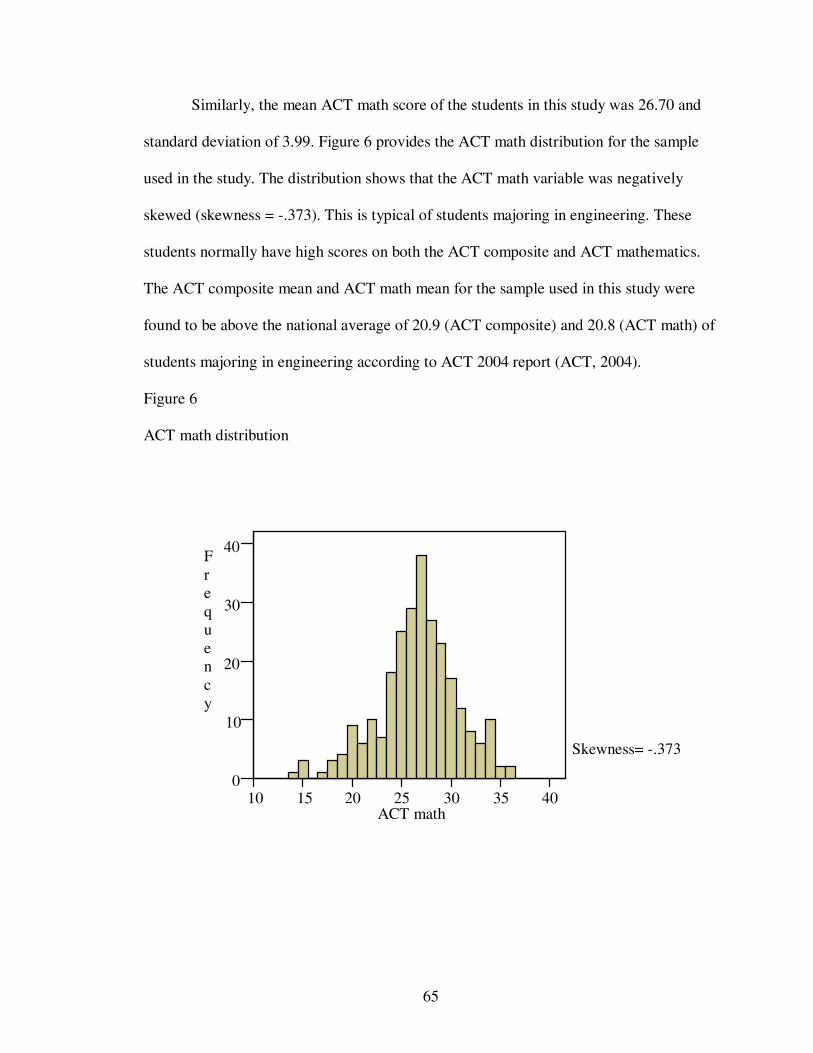
65
Similarly, the mean ACT math score of the students in this study was 26.70 and
standard deviation of 3.99. Figure 6 provides the ACT math distribution for the sample
used in the study. The distribution shows that the ACT math variable was negatively
skewed (skewness = -.373). This is typical of students majoring in engineering. These
students normally have high scores on both the ACT composite and ACT mathematics.
The ACT composite mean and ACT math mean for the sample used in this study were
found to be above the national average of 20.9 (ACT composite) and 20.8 (ACT math) of
students majoring in engineering according to ACT 2004 report (ACT, 2004).
Figure 6
ACT math distribution
10 15 20 25 30 35 40 ACT math
0
10
20
30
40 Frequency
Skewness= -.373
66
The average high school GPA was 3.58 implying students in this study had an
average high school GPA of B. The standard deviation was .43 suggesting a homogenous
sample. Figure 7 provides the distribution of high school GPA variable. The distribution
on this variable was negatively skewed (skewness = -1.055). This is because high school
GPA often suffers from grade inflation (Hardy, 1997; Ziomek & Svec, 1995). Grade
inflation occurs when a student receives a grade for course work unwarranted by the level
of work or achievement demonstrated (Stone, 1995). Inflating grades has, in part, been a
response to fears that stringent grading would damage the student's self-concept
(Edwards, 2000). Thus, there has been an increase in reported grades unaccompanied by
higher student achievement (Stone, 1995). The awarding of higher grades to students
causes a negatively skewed distribution. At the same time, students who major in
engineering tend to have very high school GPA. As such, the negative skewness of this
variable just like ACT composite and ACT math is expected.
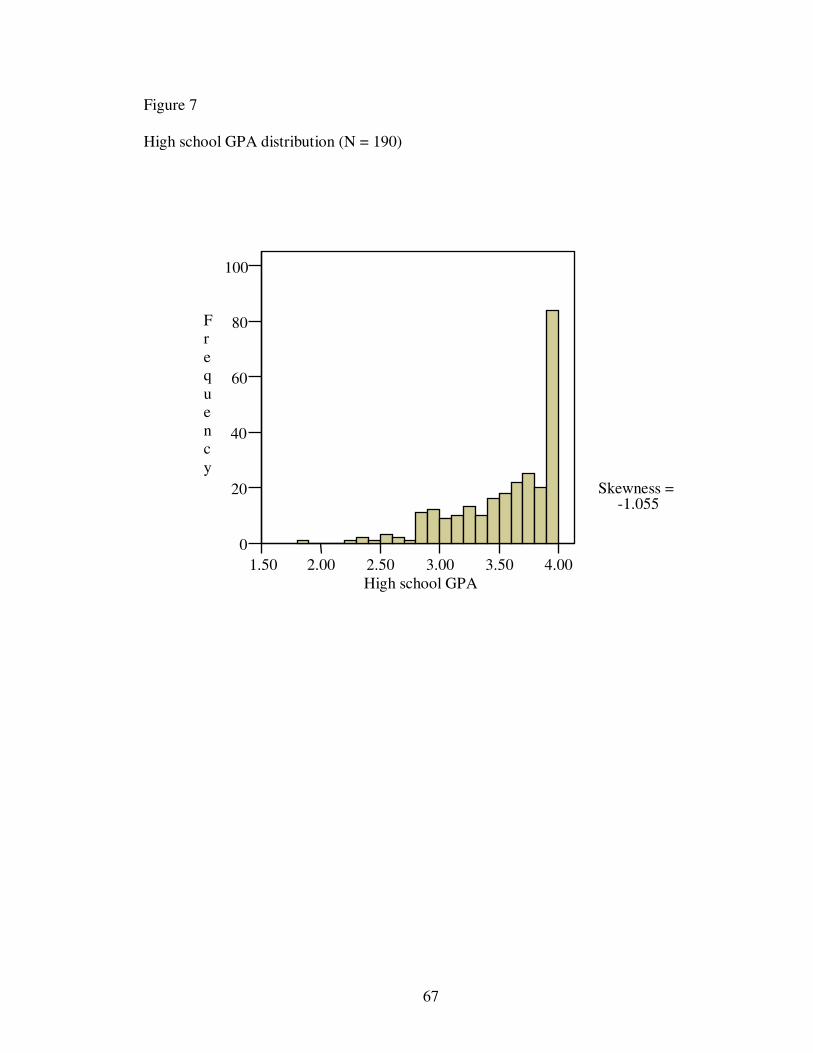
67
Figure 7
High school GPA distribution (N = 190)
1.50 2.00 2.50 3.00 3.50 4.00 High school GPA
0
20
40
60
80
100
Skewness = -1.055
F r e q u e n c y
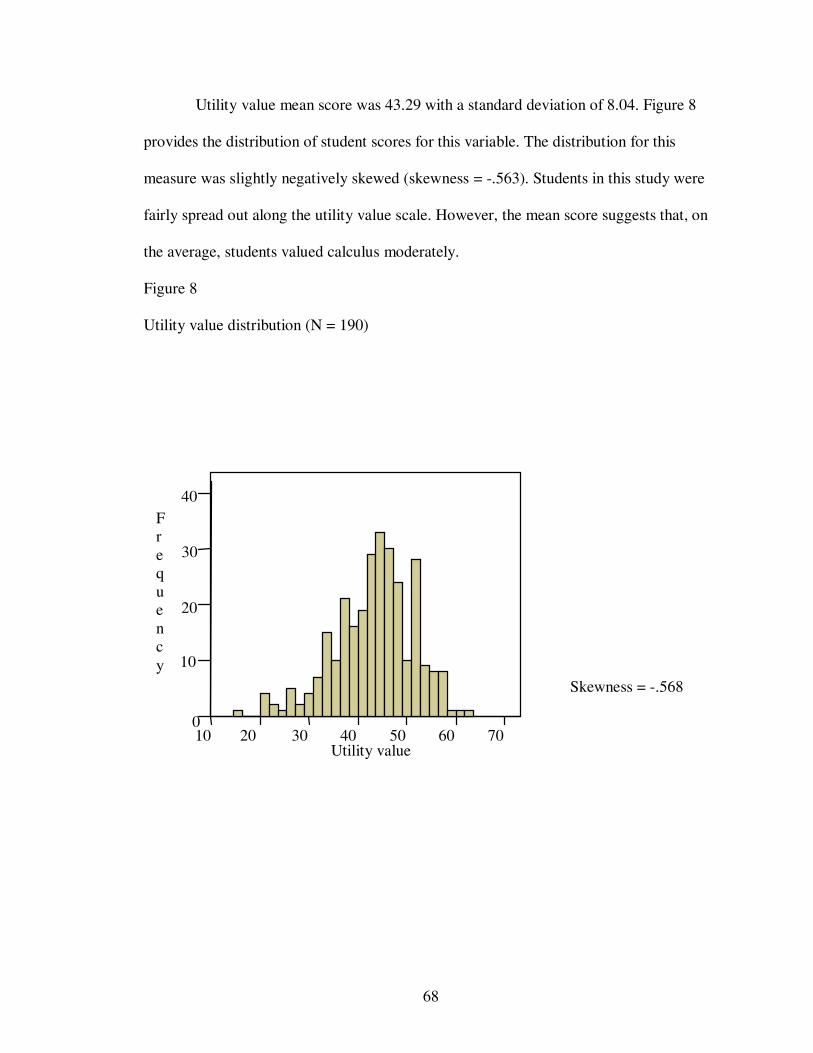
68
Utility value mean score was 43.29 with a standard deviation of 8.04. Figure 8
provides the distribution of student scores for this variable. The distribution for this
measure was slightly negatively skewed (skewness = -.563). Students in this study were
fairly spread out along the utility value scale. However, the mean score suggests that, on
the average, students valued calculus moderately.
Figure 8
Utility value distribution (N = 190)
10 20 30 40 50 60 70 Utility value
0
10
20
30
40 F r e q u e n c y
Skewness = -.568
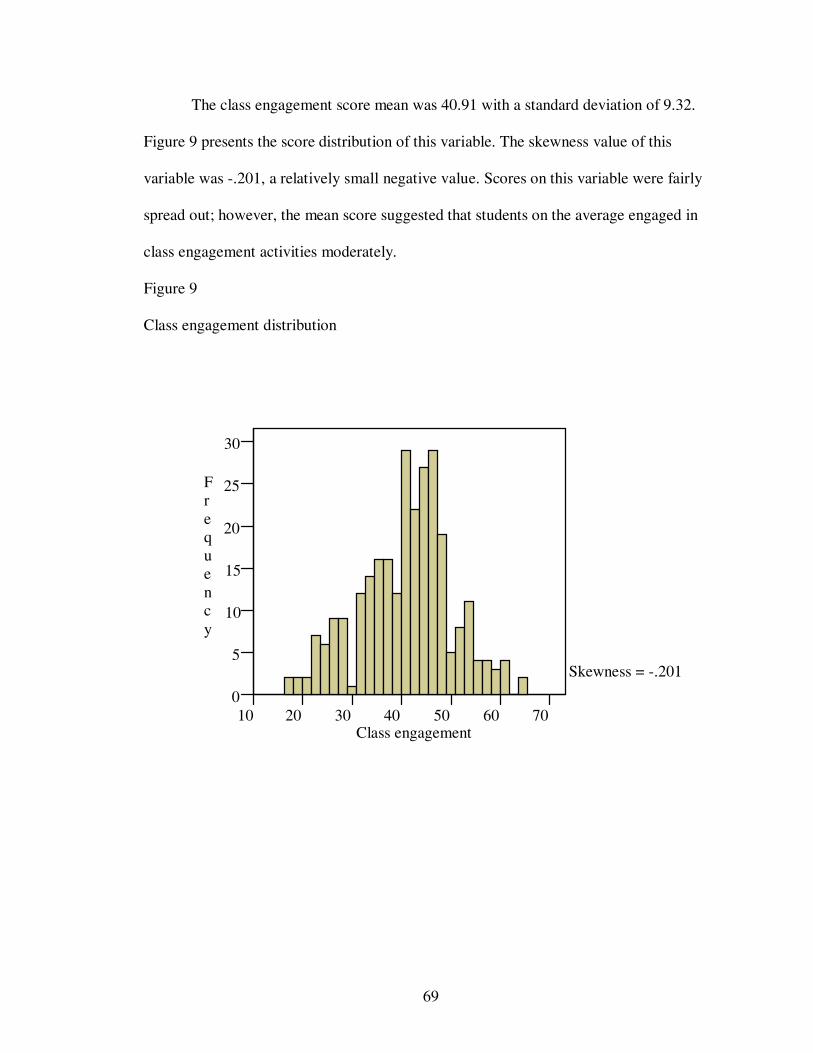
69
The class engagement score mean was 40.91 with a standard deviation of 9.32.
Figure 9 presents the score distribution of this variable. The skewness value of this
variable was -.201, a relatively small negative value. Scores on this variable were fairly
spread out; however, the mean score suggested that students on the average engaged in
class engagement activities moderately.
Figure 9
Class engagement distribution
10 20 30 40 50 60 70 Class engagement
0
5
10
15
20
25
30
Frequency
Skewness = -.201
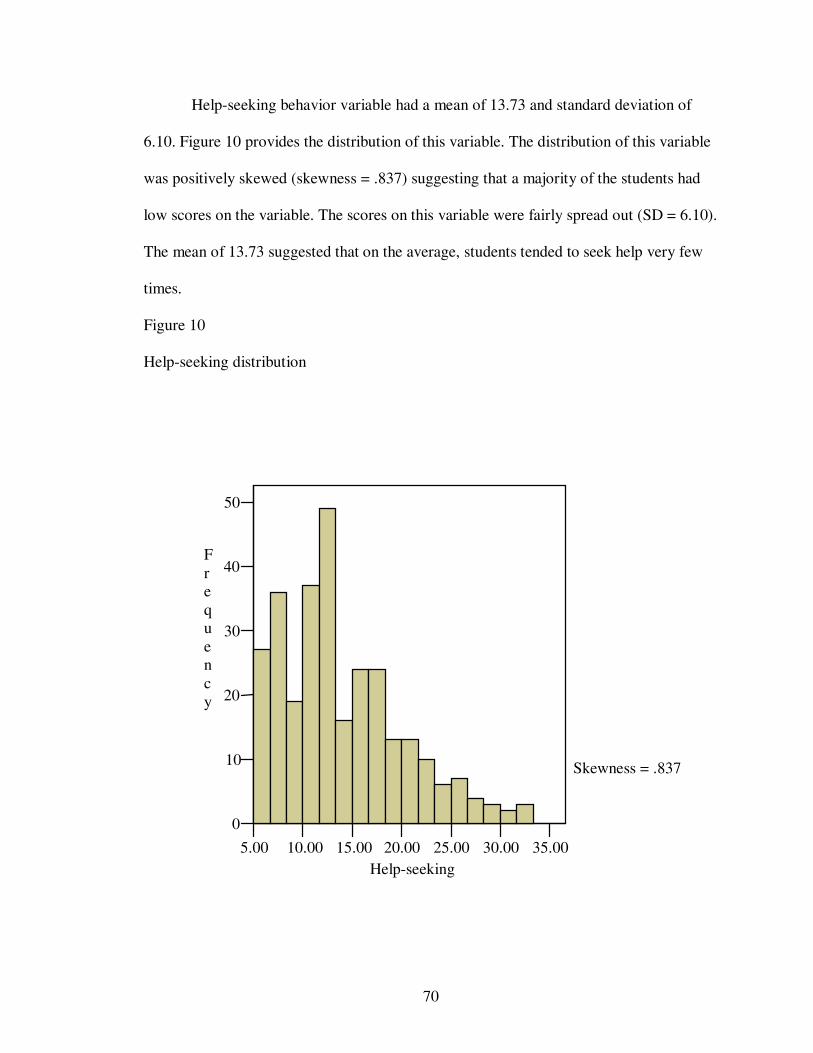
70
Help-seeking behavior variable had a mean of 13.73 and standard deviation of
6.10. Figure 10 provides the distribution of this variable. The distribution of this variable
was positively skewed (skewness = .837) suggesting that a majority of the students had
low scores on the variable. The scores on this variable were fairly spread out (SD = 6.10).
The mean of 13.73 suggested that on the average, students tended to seek help very few
times.
Figure 10
Help-seeking distribution
5.00 10.00 15.00 20.00 25.00 30.00 35.00 Help-seeking
0
10
20
30
40
50
Frequency
Skewness = .837
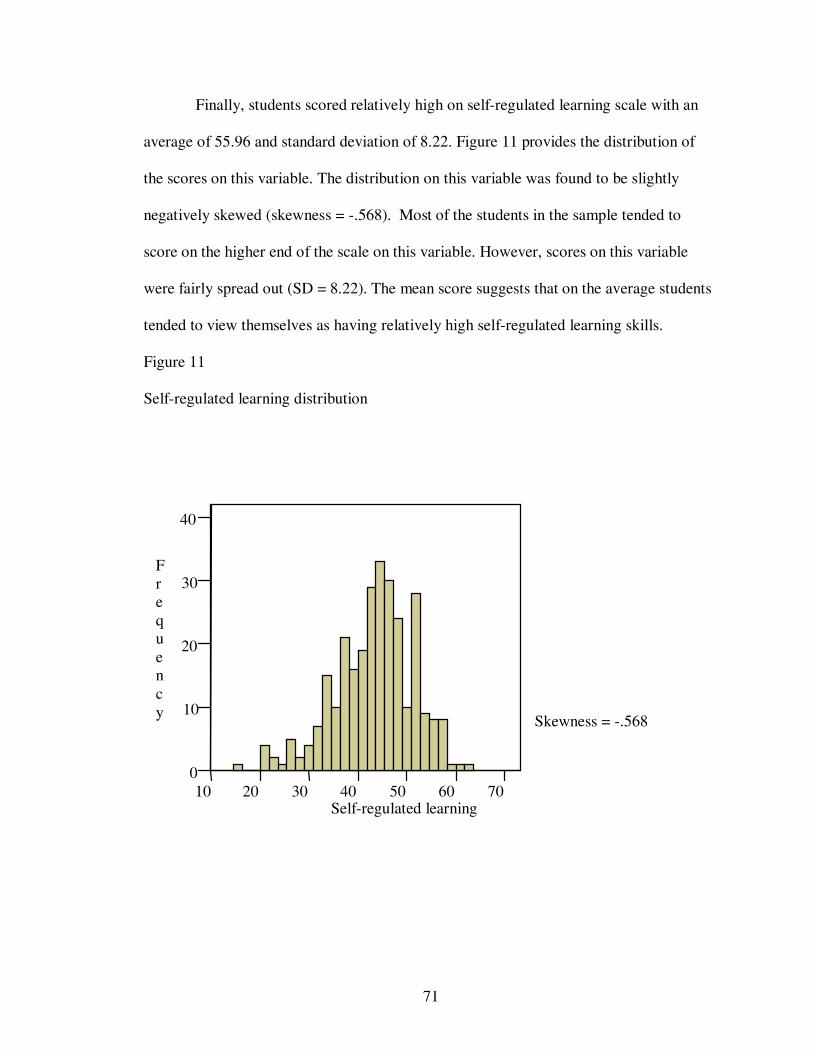
71
Finally, students scored relatively high on self-regulated learning scale with an
average of 55.96 and standard deviation of 8.22. Figure 11 provides the distribution of
the scores on this variable. The distribution on this variable was found to be slightly
negatively skewed (skewness = -.568). Most of the students in the sample tended to
score on the higher end of the scale on this variable. However, scores on this variable
were fairly spread out (SD = 8.22). The mean score suggests that on the average students
tended to view themselves as having relatively high self-regulated learning skills.
Figure 11
Self-regulated learning distribution
10 20 30 40 50 60 70 Self-regulated learning
0
10
20
30
40
Skewness = -.568
F r equency
72
Summary
Examination of the distributions of these nine variables indicated that they were
within a reasonable measure of skewness. The skewness statistic value for each variable�s
distribution was within the ±1, an acceptable range for low skewness (de Vaus, 2002). It
was concluded that all the distributions were symmetrical and thus the normality
assumption for the parametric analyses conducted in this study was apparently met.
Therefore, multiple regression was deemed an appropriate data analytic technique for this
dataset.
Analyses
This section of this chapter provides the analyses and results for each of the three
research questions examined in this study. Research question one was analyzed first
followed by research question two and finally research question three.
Convergent and Divergent validity
Convergent validity is achieved when variables that theoretically should be
related are in reality related (Nunnally, & Bernstein, 1994); consequently, significant
correlations between variables for a construct indicate convergence. On the other hand,
discriminant (divergent) validity is achieved when variables that should theoretically not
be related are in reality not related (Nunnally & Bernstein, 1994). Consequently, weak or
non-significant correlations are observed across the variables for two constructs
indicating lack of convergence, hence divergence. Correlation coefficients have been
used to establish both convergent and divergent validity. For example, Talaga and Beehr
(1995) used correlation coefficients to assess convergence of retirement variables. In their
study, Talaga and Beehr (1995) examined Pearson correlation coefficients for statistical

73
significance to establish convergence among three retirement variables. Significant
correlation coefficients (r) of the variable of interests ranged from .11 to .83 (Talaga &
Beehr, 1995). Since the intercorrelations coefficients among the three retirement
variables reached statistical significance, Talaga and Beehr (1995) concluded that the
variables converged to one construct, thus establishing construct validity. Most recently,
Caldwell, Rudolph, Troop-Gordon and Kim (2004) used Pearson bivariate correlations
coefficients on six constructs of self-worth and social disengagement by assessing for
both convergent and divergent validity among the variables of interest. They assessed the
Pearson bivariate correlation coefficients among the variables for statistical significance.
Variables that were expected to correlate were note and so were the variables that were
not expected to correlate. Two constructs were identified (self-worth and disengagement)
using this method. Significant and non-significant correlations between variables together
established convergent and divergent validity of the two constructs. They reported
significant correlations ranging from .10 to .24, stating that these correlations were
moderate in size (Caldwell, et al., 2004). Thus, this study used Pearson correlation
coefficient to establish both convergent and divergent validity.

74
Research question one
Are the theoretical expectancy variables (total number of mathematics courses
taken at junior high and high school level, ACT composite, ACT math, HSGPA)
significantly related? In other words, do these variables represent the �expectancy�
construct?
To answer this research question, Pearson correlation coefficients between
the theoretical �expectancy� variables were examined. Correlation coefficients indicate
the strength of relationship between variables and can range between +1 to -1 in
magnitude (Pedahzur, 1997). The closer the coefficient is to +1 or -1, the stronger the
relationship. If the sign is positive, the relationship between the variables is positive,
indicating that high scores on the one variable tend to go with high scores on the other
variable. If the sign is negative, the relationship is negative, indicating that high scores on
the one variable tend to go with low scores on the other variable. Coefficients that are at
or near .00 indicate that no relationship exists between the variables involved. In this
study, all Pearson coefficients were assessed for statistical significance.
Correlation coefficients are also used to check for construct validity (Nunnally &
Bernstein, 1994). A construct refers to something that exists theoretically but is not
directly observable (Vogt, 1999). Thus, construct validity refers to the extent to which
variables measure the constructs of interest (Vogt, 1999). In order to establish construct
validity, both convergent and discriminant, validity may be used (Nunnally & Bernstein,
1994).
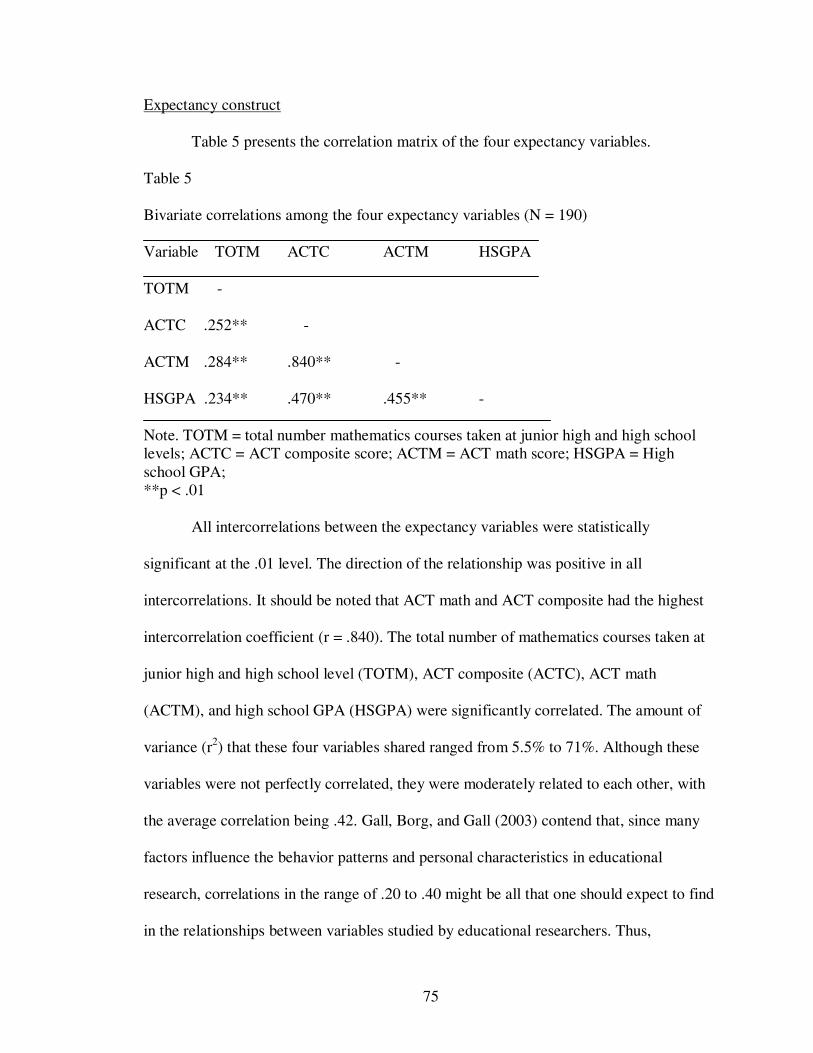
75
Expectancy construct
Table 5 presents the correlation matrix of the four expectancy variables.
Table 5
Bivariate correlations among the four expectancy variables (N = 190)
Variable TOTM ACTC ACTM HSGPA
TOTM -
ACTC .252** -
ACTM .284** .840** -
HSGPA .234** .470** .455** -
Note. TOTM = total number mathematics courses taken at junior high and high school levels; ACTC = ACT composite score; ACTM = ACT math score; HSGPA = High school GPA; **p < .01
All intercorrelations between the expectancy variables were statistically
significant at the .01 level. The direction of the relationship was positive in all
intercorrelations. It should be noted that ACT math and ACT composite had the highest
intercorrelation coefficient (r = .840). The total number of mathematics courses taken at
junior high and high school level (TOTM), ACT composite (ACTC), ACT math
(ACTM), and high school GPA (HSGPA) were significantly correlated. The amount of
variance (r2) that these four variables shared ranged from 5.5% to 71%. Although these
variables were not perfectly correlated, they were moderately related to each other, with
the average correlation being .42. Gall, Borg, and Gall (2003) contend that, since many
factors influence the behavior patterns and personal characteristics in educational
research, correlations in the range of .20 to .40 might be all that one should expect to find
in the relationships between variables studied by educational researchers. Thus,

76
examining the intercorrelations of these four variables, and using Gall et al., (2003)
argument, it was concluded that the four theoretical expectancy variables converged to
measure the �expectancy� construct. Thus, convergent validity was established.
Research question two
Are the theoretical value variables (utility value, class engagement, help-seeking
behavior, self-regulated learning) significantly related? In other words, do these four
variables represent the �value� construct?
Value construct
To answer this research question Pearson correlations between the theoretical
�value� variables were examined. Table 6 presents the correlation matrix of the four
value variables.
Table 6
Bivariate correlations among the four value variables (N = 190)
Variable VAL CLENG HELP SRL
VAL -
CLENG -.123* -
HELP -.083 .344** -
SRL .196** .280** .156** -
VAL = utility value; CLENG = class engagement; HELP = help-seeking behavior; SRL = self-regulated learning. *p < .05; **p < .01
Correlations between the value variables were examined for statistical
significance. All but one of coefficients reached statistical significance. The amount of
common variance shared (r2) between all of the six correlations ranged from .7% to 12%.
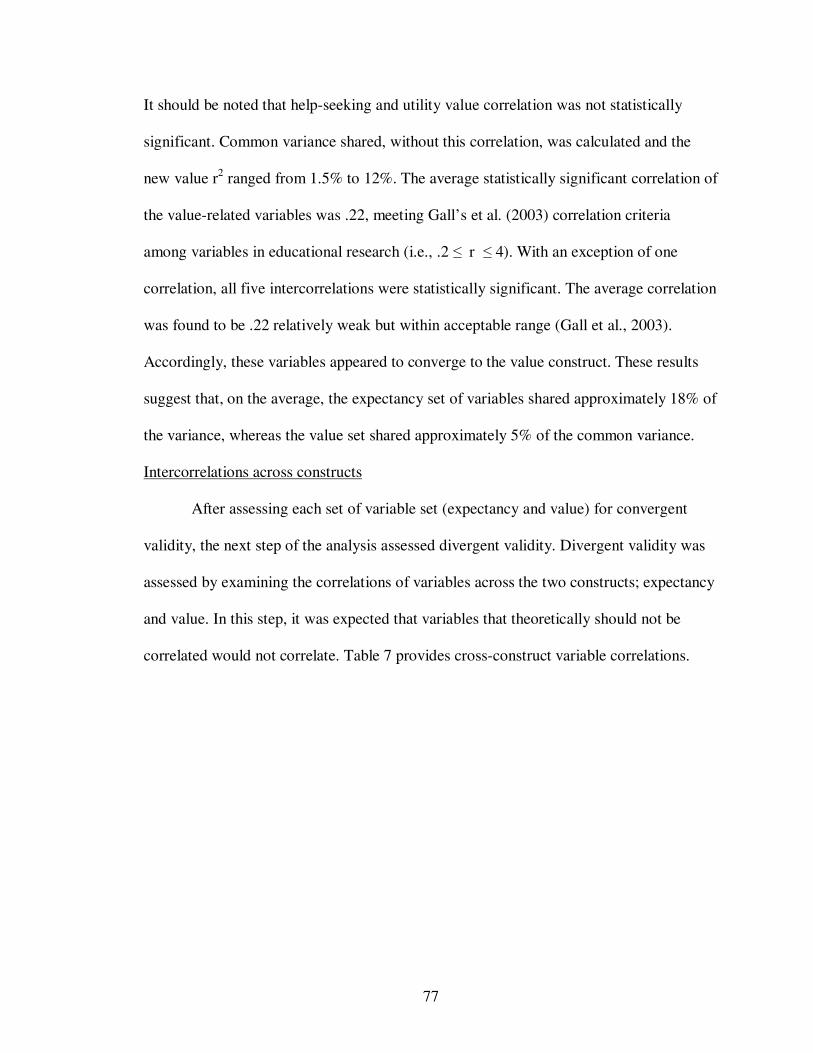
77
It should be noted that help-seeking and utility value correlation was not statistically
significant. Common variance shared, without this correlation, was calculated and the
new value r2 ranged from 1.5% to 12%. The average statistically significant correlation of
the value-related variables was .22, meeting Gall�s et al. (2003) correlation criteria
among variables in educational research (i.e., .2 ≤ r ≤ 4). With an exception of one
correlation, all five intercorrelations were statistically significant. The average correlation
was found to be .22 relatively weak but within acceptable range (Gall et al., 2003).
Accordingly, these variables appeared to converge to the value construct. These results
suggest that, on the average, the expectancy set of variables shared approximately 18% of
the variance, whereas the value set shared approximately 5% of the common variance.
Intercorrelations across constructs
After assessing each set of variable set (expectancy and value) for convergent
validity, the next step of the analysis assessed divergent validity. Divergent validity was
assessed by examining the correlations of variables across the two constructs; expectancy
and value. In this step, it was expected that variables that theoretically should not be
correlated would not correlate. Table 7 provides cross-construct variable correlations.
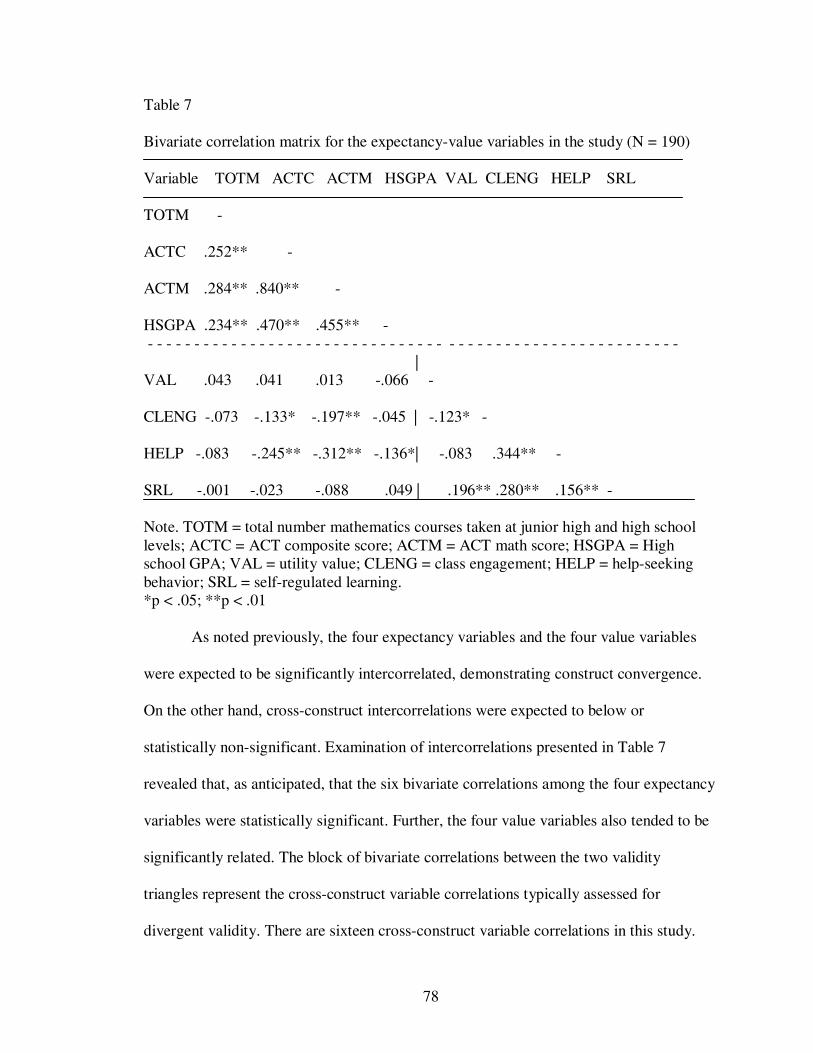
78
Table 7
Bivariate correlation matrix for the expectancy-value variables in the study (N = 190)
Variable TOTM ACTC ACTM HSGPA VAL CLENG HELP SRL
TOTM -
ACTC .252** -
ACTM .284** .840** -
HSGPA .234** .470** .455** - - - - - - - - - - - - - - - - - - - - - - - - - - - - - - - - - - - - - - - - - - - - - - - - - - - - - - - - - - | VAL .043 .041 .013 -.066 -
CLENG -.073 -.133* -.197** -.045 | -.123* -
HELP -.083 -.245** -.312** -.136*| -.083 .344** -
SRL -.001 -.023 -.088 .049 | .196** .280** .156** -
Note. TOTM = total number mathematics courses taken at junior high and high school levels; ACTC = ACT composite score; ACTM = ACT math score; HSGPA = High school GPA; VAL = utility value; CLENG = class engagement; HELP = help-seeking behavior; SRL = self-regulated learning. *p < .05; **p < .01
As noted previously, the four expectancy variables and the four value variables
were expected to be significantly intercorrelated, demonstrating construct convergence.
On the other hand, cross-construct intercorrelations were expected to below or
statistically non-significant. Examination of intercorrelations presented in Table 7
revealed that, as anticipated, that the six bivariate correlations among the four expectancy
variables were statistically significant. Further, the four value variables also tended to be
significantly related. The block of bivariate correlations between the two validity
triangles represent the cross-construct variable correlations typically assessed for
divergent validity. There are sixteen cross-construct variable correlations in this study.
79
Out of these sixteen correlations, only five coefficients reached statistical significance. It
should be noted that three of these five significant values included variables correlated
with help-seeking behaviors. The common variance shared among these cross-factor
variables ranged from .0001% to 9.7%. Further, the average r-squared value was 1.6%.
The average cross-construct correlation was .032, a value that is below the acceptable
range of .20 to .40 for expected correlations among variables in educational research
(Gall et al., 2003). In light of these results, these cross-construct intercorrelations did not
converge to a construct. The variables that were expected to correlate, did correlate
(expectancy and value) and the variables that were expected to not correlate (cross-
construct variables), indeed did not tend to correlate. Consequently, it was concluded that
both convergent and discriminant validity were demonstrated among the expectancy-
value variables.
In conclusion, these results showed that the four expectancy variables were
intercorrelated, and the four value variables tended to be intercorrelated. These findings
suggest that the eight theoretical variables measured two separate and distinct constructs.
The intercorrelations among the variables within their specific construct suggest
convergent validity. Only five out of sixteen cross-construct variable correlations
coefficients reached statistical significance. The value of the cross-construct variable
correlations suggested that discriminant validity was achieved for the variables. These
results tend to suggest that the eight theoretical variables measure two theoretically
separate constructs; expectancy and value.

80
Research question three
Is the theoretical expectancy-value model supported by these data?
Figure 12 was used to guide the analysis that answered this research question.
A standard multiple regression analysis was conducted with calculus course grade as the
dependent variable (criterion), and total number of mathematics courses taken at junior
and high school level, ACT composite, ACT math, high school GPA, utility value, class
engagement, help-seeking, and self-regulated learning serving as independent (predictor)
variables. Table 8 summarizes the regression results where calculus course grade was
regressed on the set of expectancy and value predictors. This regression analysis was
conducted to assess the two equally important theoretical constructs; expectancy and
value.
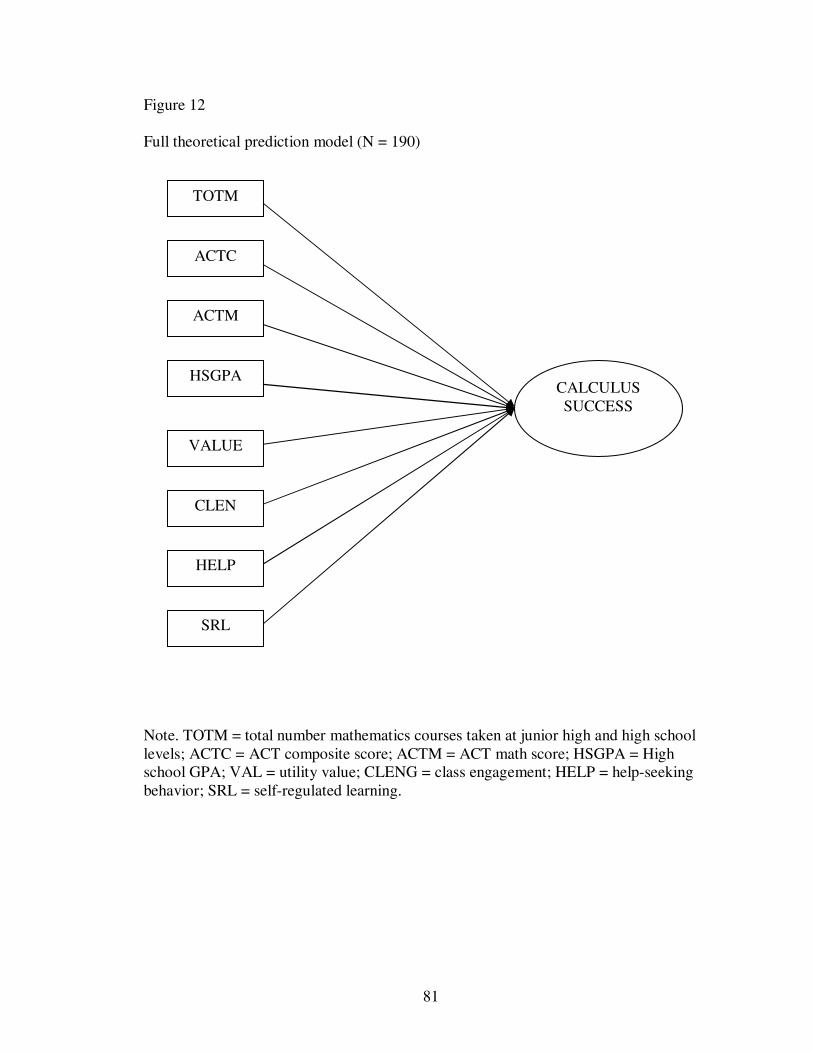
81
Figure 12
Full theoretical prediction model (N = 190)
Note. TOTM = total number mathematics courses taken at junior high and high school levels; ACTC = ACT composite score; ACTM = ACT math score; HSGPA = High school GPA; VAL = utility value; CLENG = class engagement; HELP = help-seeking behavior; SRL = self-regulated learning.
TOTM
ACTC
ACTM
HSGPA CALCULUS SUCCESS
VALUE
CLEN
HELP
SRL
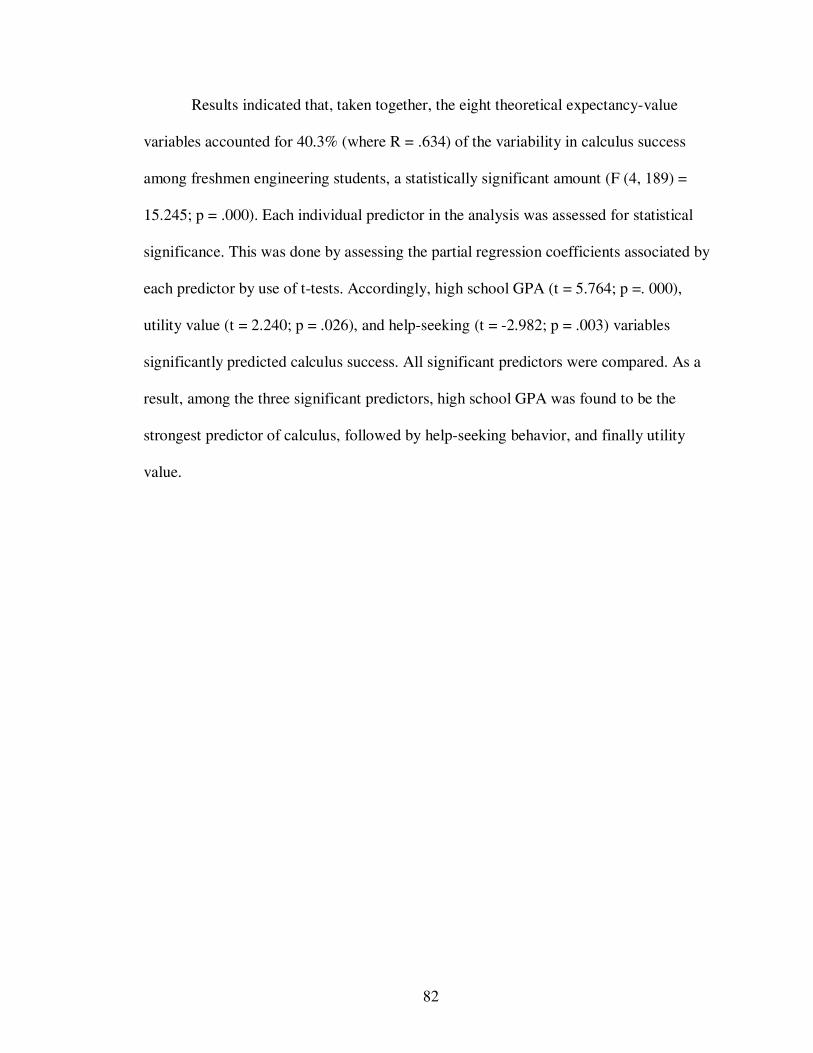
82
Results indicated that, taken together, the eight theoretical expectancy-value
variables accounted for 40.3% (where R = .634) of the variability in calculus success
among freshmen engineering students, a statistically significant amount (F (4, 189) =
15.245; p = .000). Each individual predictor in the analysis was assessed for statistical
significance. This was done by assessing the partial regression coefficients associated by
each predictor by use of t-tests. Accordingly, high school GPA (t = 5.764; p =. 000),
utility value (t = 2.240; p = .026), and help-seeking (t = -2.982; p = .003) variables
significantly predicted calculus success. All significant predictors were compared. As a
result, among the three significant predictors, high school GPA was found to be the
strongest predictor of calculus, followed by help-seeking behavior, and finally utility
value.
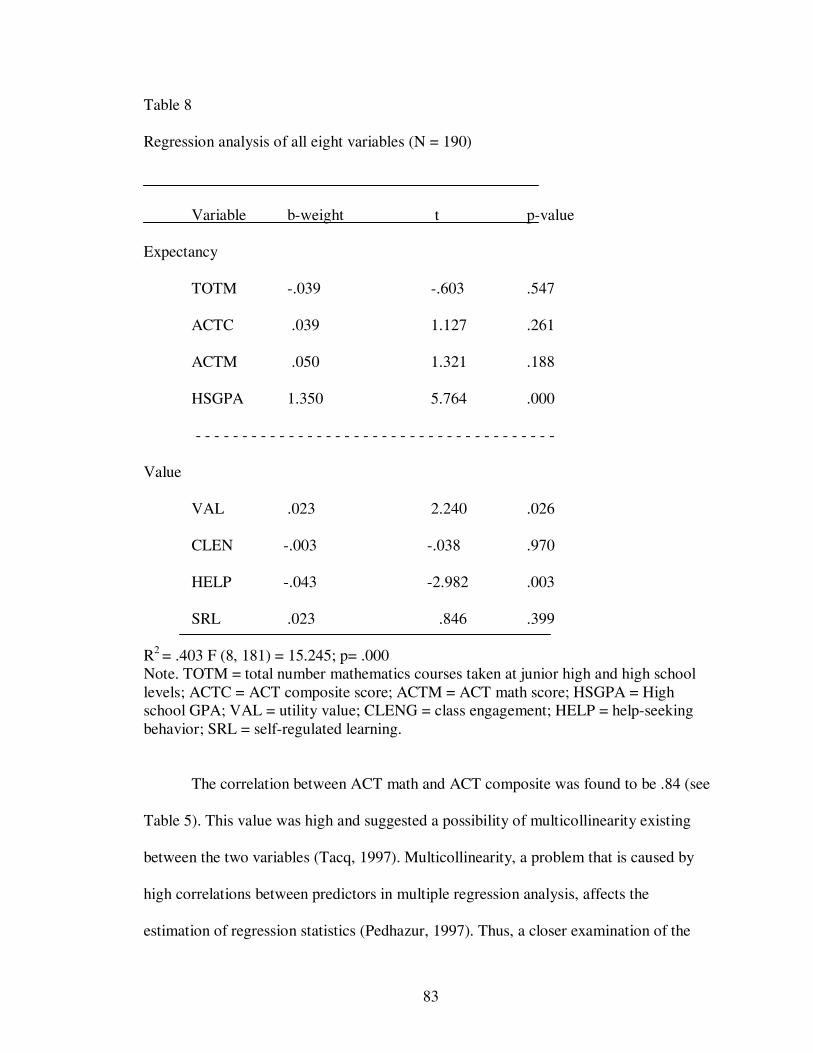
83
Table 8
Regression analysis of all eight variables (N = 190)
Variable b-weight t p-value
Expectancy
TOTM -.039 -.603 .547
ACTC .039 1.127 .261
ACTM .050 1.321 .188
HSGPA 1.350 5.764 .000
- - - - - - - - - - - - - - - - - - - - - - - - - - - - - - - - - - - - - - -
Value
VAL .023 2.240 .026
CLEN -.003 -.038 .970
HELP -.043 -2.982 .003
SRL .023 .846 .399
R2 = .403 F (8, 181) = 15.245; p= .000 Note. TOTM = total number mathematics courses taken at junior high and high school levels; ACTC = ACT composite score; ACTM = ACT math score; HSGPA = High school GPA; VAL = utility value; CLENG = class engagement; HELP = help-seeking behavior; SRL = self-regulated learning.
The correlation between ACT math and ACT composite was found to be .84 (see
Table 5). This value was high and suggested a possibility of multicollinearity existing
between the two variables (Tacq, 1997). Multicollinearity, a problem that is caused by
high correlations between predictors in multiple regression analysis, affects the
estimation of regression statistics (Pedhazur, 1997). Thus, a closer examination of the
84
two variables was warranted. Several approaches have been suggested to deal with highly
correlated predictors in regression analysis. According to Pedhazur (1997), variables that
are highly correlated should be �deleted one at a time so that the effect of the deletion on
the sizes and tests of significance for the b�s for the remaining variables may be noted�
(p. 202). Following Pedhazur (1997), two multiple regressions were conducted; one with
ACT math deleted and a second with ACT composite deleted. Table 9 summarizes the
regression analysis with ACT math deleted among the eight theoretical variables.
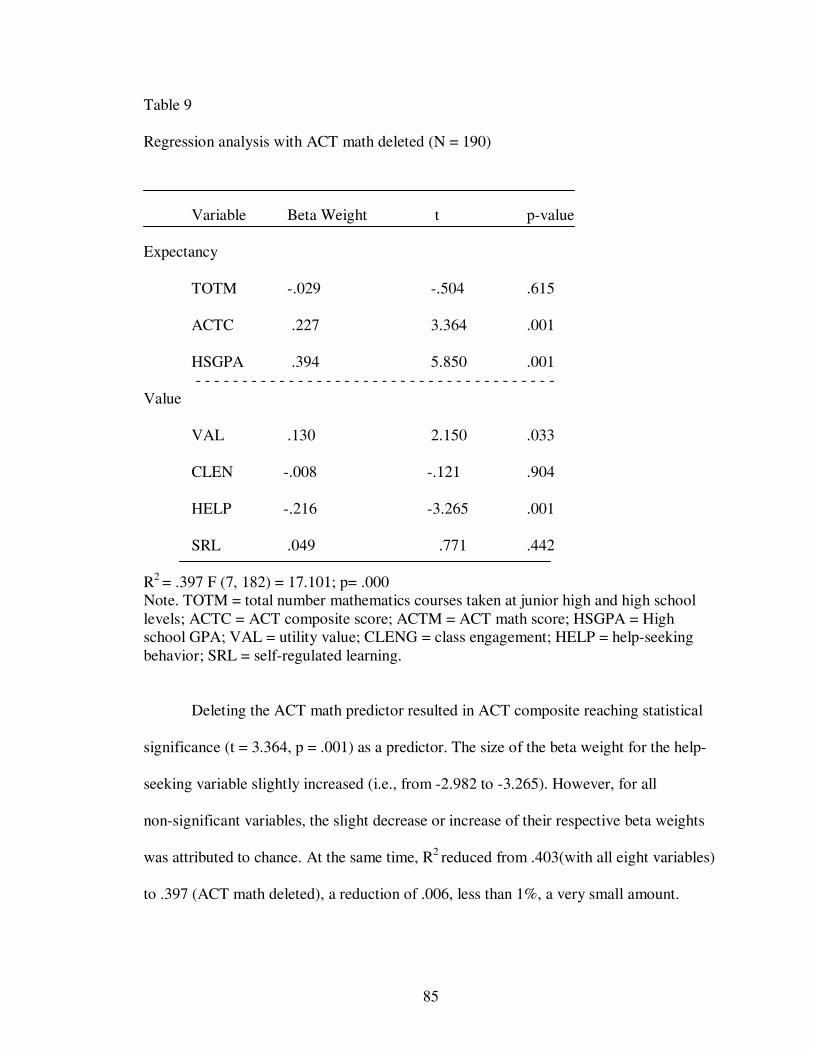
85
Table 9
Regression analysis with ACT math deleted (N = 190)
Variable Beta Weight t p-value
Expectancy
TOTM -.029 -.504 .615
ACTC .227 3.364 .001
HSGPA .394 5.850 .001 - - - - - - - - - - - - - - - - - - - - - - - - - - - - - - - - - - - - - - -
Value
VAL .130 2.150 .033
CLEN -.008 -.121 .904
HELP -.216 -3.265 .001
SRL .049 .771 .442
R2 = .397 F (7, 182) = 17.101; p= .000 Note. TOTM = total number mathematics courses taken at junior high and high school levels; ACTC = ACT composite score; ACTM = ACT math score; HSGPA = High school GPA; VAL = utility value; CLENG = class engagement; HELP = help-seeking behavior; SRL = self-regulated learning.
Deleting the ACT math predictor resulted in ACT composite reaching statistical
significance (t = 3.364, p = .001) as a predictor. The size of the beta weight for the help-
seeking variable slightly increased (i.e., from -2.982 to -3.265). However, for all
non-significant variables, the slight decrease or increase of their respective beta weights
was attributed to chance. At the same time, R2 reduced from .403(with all eight variables)
to .397 (ACT math deleted), a reduction of .006, less than 1%, a very small amount.
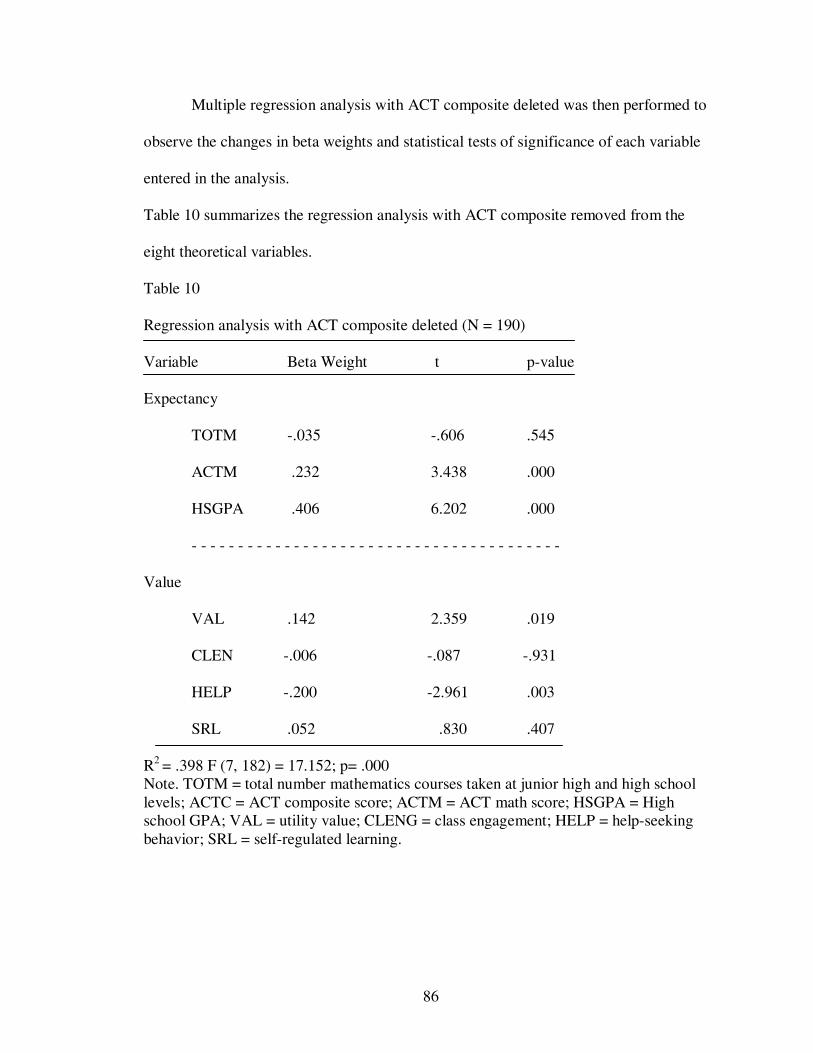
86
Multiple regression analysis with ACT composite deleted was then performed to
observe the changes in beta weights and statistical tests of significance of each variable
entered in the analysis.
Table 10 summarizes the regression analysis with ACT composite removed from the
eight theoretical variables.
Table 10
Regression analysis with ACT composite deleted (N = 190)
Variable Beta Weight t p-value
Expectancy
TOTM -.035 -.606 .545
ACTM .232 3.438 .000
HSGPA .406 6.202 .000
- - - - - - - - - - - - - - - - - - - - - - - - - - - - - - - - - - - - - - - -
Value
VAL .142 2.359 .019
CLEN -.006 -.087 -.931
HELP -.200 -2.961 .003
SRL .052 .830 .407
R2 = .398 F (7, 182) = 17.152; p= .000 Note. TOTM = total number mathematics courses taken at junior high and high school levels; ACTC = ACT composite score; ACTM = ACT math score; HSGPA = High school GPA; VAL = utility value; CLENG = class engagement; HELP = help-seeking behavior; SRL = self-regulated learning.
87
Deleting the ACT composite predictor resulted in ACT math reaching statistical
significance (t = 3.438, p= .000). The beta value for ACTM (.232) was larger than
ACTM composite�s (.227) shown in Table 9. With ACT composite deleted, the beta
weight magnitude for high school GPA increased from the full model value .338 to .406.
The beta weight for the utility value variable also increased from the full model value.135
to .142. Self-regulated learning�s beta weight decreased slightly and still did not reach
statistical significance and is thus not interpretable. At the same time, R2 was reduced
from .403 (with all eight variables) to .398 (ACT composite deleted), a reduction of .005
or .5%. Thus, when deleting ACT math, the reduction of R2 was higher (.6%) than that of
deleting ACT composite (.5%). Based on these findings and the fact that math has been
linked as a �critical filter� course for engineering students (Ganinen & Willemsen, 1995;
Seymour & Hewitt, 1997), in this study, ACT math was selected to be entered in the
regression analysis rather than ACT composite.
The final analysis that was selected included high school GPA, ACT math, utility
value, and help-seeking behavior. Calculus course success was regressed on these four
predictors. Table 11 summarizes the regression analysis with the four selected variables.
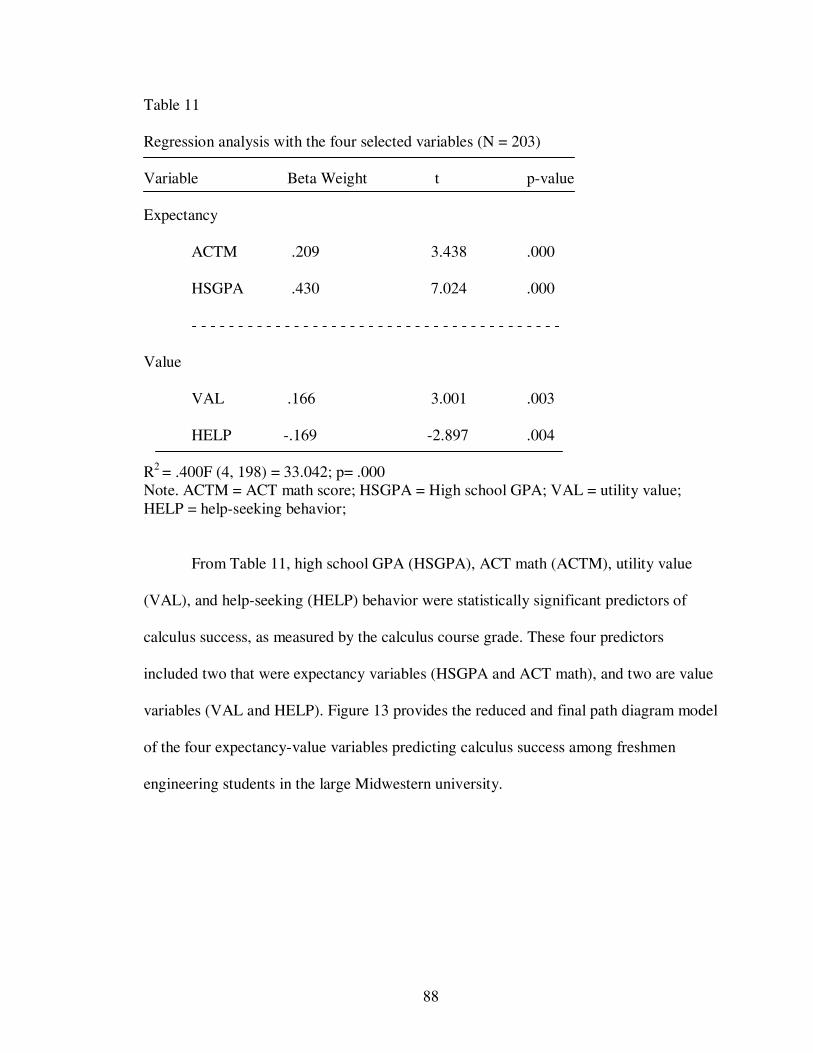
88
Table 11
Regression analysis with the four selected variables (N = 203)
Variable Beta Weight t p-value
Expectancy
ACTM .209 3.438 .000
HSGPA .430 7.024 .000
- - - - - - - - - - - - - - - - - - - - - - - - - - - - - - - - - - - - - - - -
Value
VAL .166 3.001 .003
HELP -.169 -2.897 .004
R2 = .400F (4, 198) = 33.042; p= .000 Note. ACTM = ACT math score; HSGPA = High school GPA; VAL = utility value; HELP = help-seeking behavior;
From Table 11, high school GPA (HSGPA), ACT math (ACTM), utility value
(VAL), and help-seeking (HELP) behavior were statistically significant predictors of
calculus success, as measured by the calculus course grade. These four predictors
included two that were expectancy variables (HSGPA and ACT math), and two are value
variables (VAL and HELP). Figure 13 provides the reduced and final path diagram model
of the four expectancy-value variables predicting calculus success among freshmen
engineering students in the large Midwestern university.
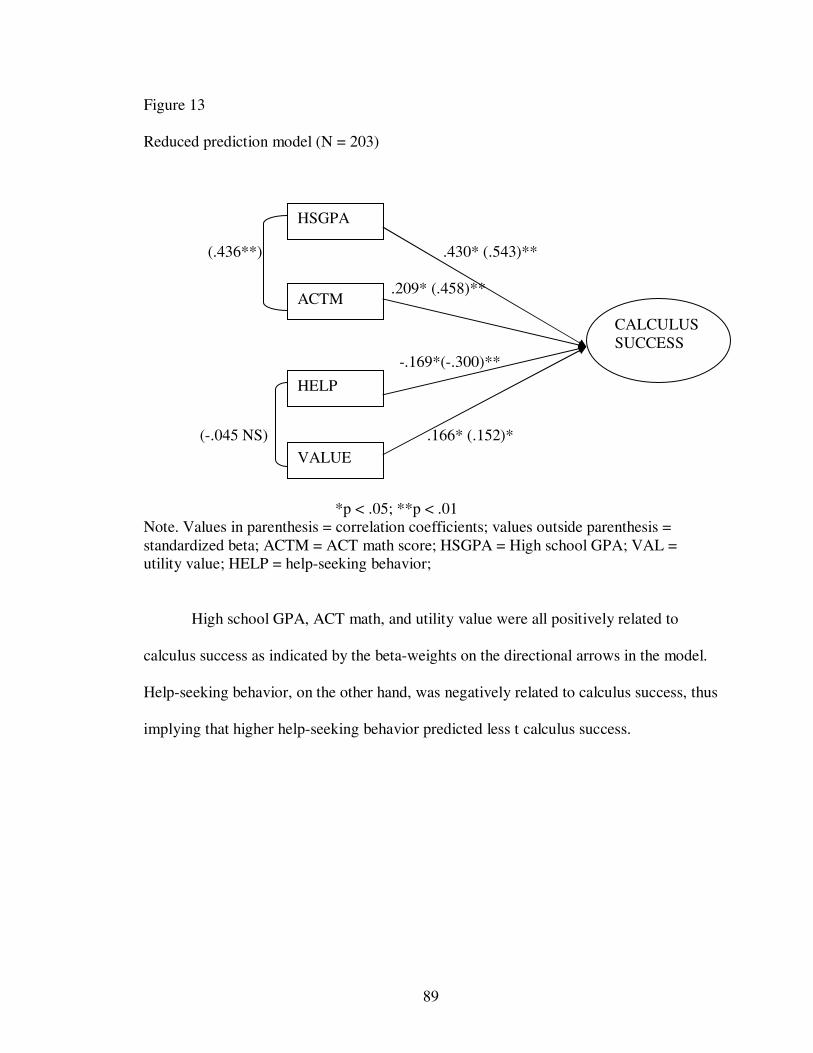
89
Figure 13
Reduced prediction model (N = 203)
(.436**) .430* (.543)**
.209* (.458)**
-.169*(-.300)**
(-.045 NS) .166* (.152)*
*p < .05; **p < .01 Note. Values in parenthesis = correlation coefficients; values outside parenthesis = standardized beta; ACTM = ACT math score; HSGPA = High school GPA; VAL = utility value; HELP = help-seeking behavior;
High school GPA, ACT math, and utility value were all positively related to
calculus success as indicated by the beta-weights on the directional arrows in the model.
Help-seeking behavior, on the other hand, was negatively related to calculus success, thus
implying that higher help-seeking behavior predicted less t calculus success.
HSGPA
ACTM
HELP
VALUE
CALCULUS SUCCESS
90
Chapter Summary
This chapter presented the results of the data analysis for the study. Three
research questions were addressed. Correlation matrices were used to assess research
questions one and two. The results showed that total mathematics courses taken at junior
high and high school level, ACT composite, ACT math, and high school GPA were
correlated. It was therefore concluded that these variables measured the same theoretical
construct � �expectancy�. Utility value, class engagement, and self-regulated learning
tended to be correlated and converged as �value�.
A full theoretical model with all eight expectancy-value variables predicting
calculus success was tested. A reduced model with statistically significant paths was
estimated. Two expectancy variables (HSGPA &ACT math) and two value variables
(HELP & VALUE) were found to be statistically significant predictors of calculus
success among freshmen engineering students in this study. Taken together, these
variables accounted for 40% of the variability in calculus success. In the final reduced
and final model, high school GPA was the strongest predictor of calculus success,
followed by ACT math, help-seeking behavior, and then utility value. Discussions,
recommendations, and conclusions for the study are presented in Chapter V.
91
CHAPTER FIVE
Discussion
This chapter discusses theoretical implications, recommendations for practice,
recommendations for future research and conclusion. The discussion of the theoretical
implications is organized into the following areas, expectancy and value variables in
relationship with the expectancy-value theory, and in relationship with calculus success.
The reason for this organization is to first discuss the common themes found in the results
from the hypotheses regarding the relationship between the eight theoretical expectancy-
value variables and their respective constructs (i.e., expectancy and value). Next, the
research findings for the third hypothesis are discussed in relationship with calculus
success among freshmen engineering students by comparing the results with the
theoretical support provided by the literature. Recommendations for practice and
suggestions for future studies are presented are presented next. Finally, the conclusions
are presented.
Theoretical Implications
The purpose of this research was to examine the theoretical model of the
expectancy-value variables that predict calculus success among freshmen engineering
students. This study examined eight variables. These were total number of mathematics
courses taken at junior high and high school level, ACT composite score, ACT math
92
score, high school GPA, utility value, class engagement, help-seeking behavior,
and self-regulated learning. These variables were examined under the expectancy-value
theory of motivation. Three research questions guided were examined in this study. These
questions were:
1. Are the theoretical expectancy variables (total number of mathematics courses
taken at junior high and high school level, ACT composite, ACT math,
HSGPA) significantly related? In other words, do these variables represent the
�expectancy� construct?
2. Are the theoretical value variables (utility value, class engagement, help-
seeking behavior, self-regulated learning) significantly related? In other
words, do these four variables represent the �value� construct?
3. Is the theoretical expectancy-value model supported by these data?
Expectancy
Research question one investigated whether the four theoretical expectancy
variables were intercorrelated, thus measuring the �expectancy� construct. The four
theoretical expectancy variables were, total number of math courses taken at junior high
and high school levels, ACT composite, ACT math, and high school GPA. The results
indicated that these variables were indeed strongly correlated establishing convergent
validity. Since this study was guided by the expectancy-value theory of motivation, this
finding was vital. The four theoretical expectancy variables measured �expectancy�
construct in reality.
This finding reinforces the expectancies for success literature advanced by
expectancy-value model proponents such as Atkinson (1957) and Eccles et al., (1983).
93
Literature on expectancy-value model identifies prior achievement behaviors such as
student�s prior success as measures of expectancy construct (Wigfield, 1994). In this
study, prior student�s success variables were examined and they all converged to
�expectancy� construct supporting the existing literature.
Overall, this study contributes not only confirmation of a previously supported
relationship between the four theoretical expectancy variables and the expectancy
construct; it also focuses attention on the college level students, specifically engineering
students. This is relevant because most of the research on expectancy under the
expectancy-value theory of motivation has been mainly with children during early
elementary and adolescents (Eccles & Wigfield, 1995; Eccles et al., 1993). In addition,
motivation research among engineering students has been limited (Willemsen, 1995). The
specific population of freshmen engineering students provides the researcher to partition
and isolate new factors associated with success in calculus course. This study
strengthened the support of the relationship between the theoretical expectancy variables
and the expectancy construct, and it provides a starting point for additional studies on
expectancies variables.
Value
The second research question investigated whether the four theoretical value
variables measure the �value� construct. The four theoretical value variables investigated
in this study were; utility value, class engagement, help-seeking, and self-regulated
learning. Results from this study showed that all but one of the six correlations was
statistically significant suggesting that these four variables converged to one construct of

94
�value�. This finding suggested that the four theoretical value variables measure the
�value� construct in reality.
Literature on values contends that importance, usefulness of the task, cost, and
attainment of task are major components of values (Eccles et al., 1983). These
components together provide the value construct that directly influences success and or
achievement. In addition, the value construct in the expectancy-value model of
achievement motivation is equally important in directly influencing achievement as the
expectancy construct (Eccles et al., 1983). The four theoretical value variables examined
in this study represented the value construct. This finding provides support to a more
specific of value definition (Wigfield & Eccles, 2000).
Values have been identified as a key component in the Eccles et al., (1983)
expectancy-value model of motivation and achievement. Values have been found to
influence achievement. For example, Wigfield et al., (1992) found that values impact
achievement in mathematics. This study found out that utility value, class engagement,
help-seeking behavior and self-regulated learning measure the �value� construct the
second construct in the expectancy-value model of motivation.
This study contributes not only confirmation of previously supported studies that
posit a relationship between theoretical value-related variables with the value construct
(Eccles, et al., 1983), but it also focuses on college students� value variables. This is
relevant because in order to expand knowledge of values in relationship with the
expectancy-value achievement motivation model, having a foundation established with a
specific population (freshmen engineering students) facilitates the control of variability
whereby new value variables can be identified. The specific population helps the
95
researcher partition and isolated new value factors associated with calculus success.
Thus, this study strengthened the relationship between theoretical value variables and the
value construct, and it also provides a foundation for additional studies under the
expectancy-value achievement motivational theory.
Expectancy-Value model
This research found support for the expectancy-value model. Both expectancy and
value variables predicted calculus success among freshmen engineering students,
supporting Eccles� (1984) assertion that expectancies and values are integral to
achievement or success. In the regression analysis performed, high school GPA
(expectancy variable) was the strongest predictor followed by help-seeking behavior
(value variable), utility value (value variable) ACT math (expectancy variable)
respectively. ACT composite was the fifth overall predictor. Self-regulated learning and
total number of mathematics courses taken at junior and high school levels were the
weakest predictors in the set.
Research on number of mathematics courses taken at junior and high school level
has been found to influence mathematics achievement in successive years (Lee, Chow-
Hoy, Burkam, Geverdt, & Smerdon, 1998). However, other researchers observe that
although, the number of mathematics may play an important role in mathematics
achievement, the type of mathematics course taken by students is very vital (Gamoran &
Hannigan, 2000). The findings from this study showed that number of mathematics
courses taken at both junior and high school did not significantly influence calculus
course success among freshmen engineering students at this large Midwestern university.
This finding is contrary to Lee et al., (1998) however, is consistent with studies on the
96
type of mathematics courses taken at junior and high school levels. For example, Jones
(1987) reported that students who had taken calculus at in grade 12 achieved better in
mathematics that did those who had not taken calculus regardless of prior mathematics
ability. In addition, Adelman, (1999) contends that taking specific courses beyond the
Algebra II more than doubles the odds of a student succeeding at the college level. Thus,
prior mathematics courses that provide the basic foundation for college calculus are
essential for students who plan to enroll in engineering majors. This study shows that it is
not just the number of mathematics courses taken at junior and high school but also the
specific mathematics courses taken at both levels are crucial in influencing calculus
course success among freshmen engineering students.
ACT composite and ACT math scores each influenced calculus achievement.
However, findings from this study indicated that when these two variables were included
in the regression analysis, their impact on calculus success was not statistically
significant. ACT composite was found to have a slightly lower impact than ACT math on
calculus achievement. Thus ACT math was retained in the analysis. The finding of this
study after retaining only ACT math in the analysis was consistent with prior research on
achievement. For example, Edge and Friedberg (1984) found that ACT math score was a
significant predictor of calculus achievement among freshmen college students. In
another study by Wilhite, Windham, and Munday (1998), noted that ACT math score was
a strong predictor in fist year calculus course among college freshmen. More recently,
Allen (2001) reported that ACT math score was a good predictor of success among
freshmen engineering students. Thus, this study�s finding in terms of ACT math as a
predictor of calculus course success is supported by previous studies.
97
High school GPA was found to be a stronger predictor of calculus success among
freshmen engineering students in this study. This finding is consistent with previous
research. One study by Edge and Friedman (1984), found that high school GPA
influenced calculus performance among freshmen college students. In one study by
Perkins (2002), found out that high school GPA was a stronger predictor of calculus
success among college students. Similarly, Frye-Lucas (2003) identified high school
GPA to influence calculus achievement among freshmen college students. This study not
only identified high school GPA as a predictor of calculus success among freshmen
engineering students, but also found this variable to be the strongest among all eight
theoretical variables.
Among the four values related variables, utility value and help seeking behavior
were found to be significant predictors of calculus course success among freshmen
engineering students. On the other hand, classroom engagement and self-regulated
learning were not statistically significant predictors.
Pintrich and Schunk (1996) posit that values are positively correlated with actual
achievement. This study not only found that values are positively correlated to calculus
success but also predicted calculus success among freshmen engineering students.
Students who valued calculus tended to perform higher than their counterparts who did
not value the subject matter. This finding supports research on values and achievement
motivation in the expectancy-value theory of motivation. For instance, Eccles et al.,
(1983) posit that utility value impacts achievement. In addition, Deci and Ryan (1985)
noted that usefulness of a task motivates students to do well.
98
Classroom engagement behavior was not found to be statistical significant
predictor of calculus course success among freshmen engineering students in this study.
Classroom engagement on the other hand was not a statistical significant predictor of
calculus course success. This finding is contrary to literature on engagement that posits
student engagement is a robust predictor of student achievement (Finn & Rock, 1997).
The fact that classroom engagement was not statistical significant predictor of calculus
course success may be due to classroom engagement being subsumed by the other value-
related variables. In addition, research on engagement contends that engagement is a
multidimensional construct that encompasses behavior, emotion, and cognition (Fredricks
et al., 2004). The vast majority of studies test the impact of single type of engagement
and a single outcome of interest, such as the correlation between behavioral engagement
and achievement (Fredricks et al., 2004). Classroom engagement was assessed as a
multidimensional construct. It is possible that specific type of engagement (behavioral,
emotional or cognitive) was significant but could not be captured in this study.
Studies on class engagement posit that for an engaged learner, the joy of learning
inspires persistence to accomplish the desired goals even in the face of difficulty
(Schletchy, 2002). Basically, it is assumed that engaged students have the skills to work
with others and know how to transfer knowledge to solve problems creatively (Jones,
Valdez, Nowakowski, & Rasmussen, 1994). Despite the fact that classroom engagement
was not a statistical significant predictor of calculus achievement among freshmen
engineering students in this study, more studies may be needed before conclusions are
made. In this study, classroom engagement correlated significantly with utility value,
self-regulated learning, and help-seeking behavior. Thus, there is all likelihood that this
99
particular variable was subsumed in the other value-related variables. Studies have shown
that if a student values a subject, then they will be engaged and do whatever it takes to be
successful (Assor, Kaplan, & Roth, 2002).
Help-seeking behavior was a statistical significant predictor of calculus course
success. Help-seeking has been identified as an adaptive strategy for coping with
difficulty and promoting mastery (Newman, 1991). This study found that help-seeking
behavior to be negatively related to calculus course success. Thus, as help-seeking
behavior of students increase, it is expected that the calculus course success to decrease.
This finding suggests that freshmen engineering students, who are successful in calculus
course, tend to exhibit less help-seeking behaviors. There are two possible explanations
to this finding. The first explanation may be due to the fact that freshmen engineering
students have had a strong calculus background, thus, capable of doing well with
minimum help. The second explanation emanates from help-seeking literature. Help-
seeking behavior may be avoided because it is experienced as dependency (Butler &
Neuman, 1995). This state may conflict both with personal autonomy needs, which Deci
and Ryan (1987) see as the major component of intrinsic motivation. Closely related to
the state autonomy is the perception help-seeking has on people. Studies have shown that
people are reluctant to seek help when the need for help is construed as evidence of low
ability, and thus threatening to one�s self-esteem (e. g., Shapiro, 1983). Students need to
have a nurturing and safe classroom environment that encourages students to seek
assistance when they encounter difficulties.
Studies have shown that students with learning goals seek help when they
encounter difficulties thus increase their competence on the task (Dweck, 1988).
100
Classroom that emphasizes mastery of knowledge facilitates learning goals among
students facilitating help-seeking behavior (Newman, 2002). On the other hand,
performance goal orientation classroom emphasizes good grades and looking good
among pears (Newman, 2002). Thus, students with performance goal orientation tend to
avoid seeking help when they encounter difficulties (Newman, 2002). Clearly, help-
seeking behavior is influenced by classroom environment. The role of teacher or
instructor and peers in the classroom may facilitate help-seeking behavior or help-
avoidance behavior among students.
All in all help seeking was found to be a significant predictor of calculus course
success consistent with studies that view help-seeking behavior as an important self-
regulatory strategy that contributes to student learning and achievement (Newman, 1994;
Zimmerman & Martinez-Pons, 1988).
Self-regulated learning was not statistically significant in predicting calculus
course success among freshmen engineering students in this study. Despite this finding,
literature on self-regulated learning suggests the contrary. For example, Schunk and
Zimmerman (1997) posit that self-regulated learning impacts students� academic
achievement. In addition, Zimmerman and Martinez-Pons (1986), found out that self-
regulated learning strategies to be predictive of test performance. It is likely that self-
regulated learning was also subsumed in the other value-related variables such as
classroom engagement and help-seeking behavior. Thus, before any conclusions are
made about the role of self-regulated learning and calculus course success, more research
is needed.
101
Implications for practice
Gainen (1995) contends that calculus is one of the gateway courses among
engineering students. In fact, most engineering programs in America require freshmen
engineering majors to enroll in calculus during their first year (Sorby, 2001). Research on
calculus performance among freshmen engineering students has indicated that a most of
them fail to meet the passing criteria. For example, Seymour and Hewitt (1997) posit that
between 40 to 60 percent of science, mathematics, and engineering students with higher
than average abilities are lost within their first college mathematics course. Responding
to this claim, this study explored factors that influence freshmen engineering to pass entry
level calculus course. The findings of the present study provide faculty members in
engineering programs and mathematics critical factors to pay attention to when admitting
or advising students.
The first implications of this study for educational practice have to do with the
importance of the expectancy-value variables in calculus achievement. The results of this
study showed that both expectancy and value variables have significant effect on
achievement behavior. This finding suggests that students� expectancies for success
predict calculus course success. Specifically, high school GPA and ACT math were
significant predictors of calculus course success among freshmen engineering students. In
fact, studies have demonstrated that expectancies are predictors of achievement (Eccles et
al., 1983). Thus, colleges of engineering may pay a closer attention to measures of prior
achievement closely related to calculus. This study identified high school GPA and ACT
math score. The findings of this study suggest that students with high scores on these two
variables are likely to do well in entry level calculus course. Prior successes tend to
102
enhance competency beliefs among students which in turn influence expectancies for
success (Eccles et al., 1983). Thus, admission criteria to engineering programs may
consider using these two expectancy variables.
Another implication relates to students� experiences and activities related to the
calculus course. Once a student is in college, value-related variables play a pivotal role in
influencing achievement. Students, who value a subject, tend to be highly engaged,
exercise self-regulated learning strategies, and thus seek assistance when they encounter
difficulties (Newman, 2002). In light of the present findings, value-related variables do
impact calculus course success. Specifically, in this study, both utility value and help-
seeking behavior were found to be significant predictors of calculus course success
among freshmen engineering students. Thus enhancing students� value of calculus for
their present and future goals is important. Increase in students� perceived value of
calculus motivates students to set higher processes goals (Bandura, 1986), thus, they
become engaged in the course and in turn use self-regulated learning skills to succeed in
the course (Zimmerman & Martinez-Pons, 1990). Not only should the faculty members
show and reinforce the value of calculus, but also there is a need to emphasize learning
goal orientation among students. Learning goals facilitate help-seeking behavior a self-
regulated learning strategy important for students when they face difficulties on a task.
Recommendation for future research
The expectancy-value theory of motivation has provided a theoretical model of
assessing various motivational factors that influence achievement. This model was tested
and supported in this study. Since, the eight theoretical expectancy-value variables
investigated in this study accounted for 40% of variance in calculus course success, there
103
is a need to explore other possible variables. It is evident that this model may be used to
identify other expectancy-value variables not investigated in this study.
Further research on classroom engagement and self-regulated learning among
freshmen engineering students is needed before any conclusions are made about their
impact on calculus course success.
The inclusion of a qualitative component such as focus groups to identify
students� perceptions regarding important factors or variables that contribute to their
calculus course success could provide and explanation for the variance that was not
accounted for in this study.
Replication of this study with other groups of subject (such as students enrolled in
calculus course in Spring 2004; Fall 2004) would be needed to validate this study.
Conclusion
The influence of expectancy-value variables on calculus course success among
freshmen engineering students provides understanding of motivational factors that are
associated with achievement. Literature on expectancy-value theory of motivation
contends that expectancy and value are two independent constructs that influence
achievement (Eccles et al., 1983). The purpose of this study was to examine eight
theoretical expectancy-value variables believed to influence calculus course success
among freshmen engineering students in a large Midwestern university.
Three research questions guided this study. The first research question examined
whether the four theoretical expectancy variables (Total number of mathematics courses
taken at junior and high school level, ACT composite, ACT math, and high school GPA)
measured the �expectancy� construct. Bivariate correlations among the four variables
104
were statistically significant. This indicated that these four variables were intercorrelated
and therefore converging to one construct of expectancy.
Research question two examined whether the four theoretical value variables
(utility value, class engagement, help-seeking behavior, and self-regulated learning)
measured the �value� construct. Most of the bivariate correlations were statistically
significant. This indicated that these four variables were intercorrelated and therefore
converging to one construct of value.
The third research question tested a theoretical path model that involved all eight
theoretical expectancy-value variables in predicting calculus. Four variables (high school
GPA, ACT math, utility value, and help-seeking behavior) were statistically significant
predictors of calculus course success among freshmen engineering students.
In conclusion, since most of the expectancy-value research has been done among
elementary and high school students, this study provides support for the expectancy-value
motivational theory in examining possible factors that influence calculus course success
among college students. Results from this study may assist faculty members from college
of engineering and mathematics departments to pay close attention to expectancy-value
variables as predictors of achievement.
105
REFERENCES
ACT (1997). ACT technical manual. Iowa City, IA: ACT.
ACT (2004). ACT national data release. Iowa City, IA: ACT, Inc.
Adelman, C. (1999). Answers in the tool box: Academic intensity, attendance patterns,
and bachelor�s degree attainment. Washington, DC: U.S. Department of
Education, Office of Educational Research and Improvement.
Aleven, V., Stahl, E., Schworm, S., Fischer, F., & Wallace, R. (2003). Help seeking and
help design in interactive learning environments. Review of Educational
Research, 73(3), 277-320.
Allen, L. (2001). An evaluation of the University of Missouri-Rolla minority engineering
program 7-weeks summer bridge program. Unpublished doctoral dissertation,
University of Missouri-Rolla.
Arberton, A. (1998). Student goal orientation and help-seeking strategy use. In S. A.
Karabenick (Ed.). Strategic help seeking: Implications for learning and teaching
(pp. 95-116). Mahwah, NJ: Erlbaum.
Archer, J., Cantwell, R., & Bourke, S. (1999). Coping at university: An examination of
achievement, motivation, self-regulation, confidence, and method of entry,
Higher Education Research and Development, 18(1), 31 � 54.
Asera, R. (2001). Calculus and community: A history of the emerging scholars program
(College Board Rep. No. 991381). New York: The College Board.
106
Assor, A., Kaplan, H., & Roth, G. (2002). Choice is good, but relevance is excellent:
Autonomy-enhancing and suppressing teacher behaviours in predicting student's
engagement in school work. British Journal of Educational Psychology, 72, 261-
278.
Atkinson, J. W. (1957). Motivational determinants of risk-taking behavior. Psychology
Review, 64(6), 359-372.
Atkinson, J. W. (1964). An introduction to motivation. New York: American Book.
Bandura, A. (1986). Social foundations of thought and action: A social cognitive
perspective. Englewood Cliffs, NJ: Prentice Hall.
Bandura, A. (1989). The multidimensional self-efficacy scales. Unpublished test, Stanford
University, Stanford, CA.
Besterfield-Sacre, M., Atman, J. C., Schuman, L. J. (1998). Characteristics of freshman
engineering students: Models for determining student attrition in engineering.
Journal of Engineering Education, 86(2), 139 � 149.
Boekarts, M., Pintrich, P. R., & Zeidner, M. (Eds.). (2000). Handbook of self-regulation:
Theory, research and applications. San Diego, CA: Academic Press.
Bonsangue, V. M., & Drew, E. E. (1995). Increasing minority students� success in
calculus. In Gainen, J. & Willemsen, W. E. (Eds.), New Directions for Teaching
and Learning: Fostering student success in quantitative gateway courses (Vol.
61, pp. 23-34). San Francisco: Jossey Bass.
107
Bryk, T., Lee, V., & Smith, J. (1990). High school organization and its effects on teachers
and students: An interpretive summary of the research. In W. H. Clune & J. F.
White (Eds.), Choice and Control in American Education (pp. 135 � 226).
Philadelphia, PA: Flamer.
Butler, R., & Neuman, O. (1995). Effects of task and ego achievement goals on help
seeking behaviors and attitudes. Journal of Educational Psychology, 87(1), 261-
271.
Caldwell, M. S., Rudolph, K. D., Troop-Gordon, W., & Kim, D. (2004). Reciprocal
influences among relational self-views, social disengagement, and peer stress
during early adolescence. Child Development, 74(4), 1140 � 1154.
Campbell, Patricia, Jolly, Eric, Hoey, Lesli & Perlman, Lesley (2002). Upping the
numbers: Using research-based decision making to increase the diversity in the
quantitative disciplines. Newton, MA: Education Development Center, Inc.
Campbell, J. R., Hombo, C. M., & Mazzeo, J. (2000). NAEP 1999 trends in academic
progress. Office of Educational Research and Improvement. (NCSES Rep. No.
2000-469).
Chaney, B., Burgdorf, K., & Atash, N. (1997). Influencing achievement through high
school graduation requirements. Educational Evaluation and Policy Analysis, 19
(3), 229 � 244.
Corno, L. (1994). Student volition and education: Outcomes, influences, and practices. In
D. H. Schunk & B. J. Zimmerman (Eds.), Self-regulation of Learning and
Performance: Issues and Educational Applications (pp. 229 0254). Hillsdale, NJ:
Lawrence Erlbaum Associates.
108
Crocker, L., & Algina, J. (1986). Introduction to classical and modern test theory. San
Diego, CA: Holt, Rinehart, and Winston.
Deci, E.L., & Ryan, R.M. (1987). The support of autonomy and the control of behavior.
Journal of Personality and Social Psychology, 53,1024-1037.
Deci, E. L., & Ryan, R. M. (1985). The general causality orientations scale: Self-
determination in personality. Journal of Research in Personality, 19, 109-134.
De Vaus, D. (2002). Analyzing social science data. Thousand Oaks: Sage
Publications.
Dougherty, A., & Cooley, D. (2003). Prediction of student performance in freshman
calculus. Unpublished manuscript, University of Colorado, Boulder.
Dowson, M., & McInerney, D. M. (2001). Psychological parameters of students' social
and work avoidance goals: A qualitative investigation. Journal of Educational
Psychology, 93(1), 35-42.
Dweck, C.S. (1988). Motivation. In R. Glaser & A. Lesgold (Eds.), The handbook of
psychology and education (Vol. 1, pp. 187-239). Hillsdale, NJ: Erlbaum.
Eccles, J. S., Adler, T. F., Futterman, R., Goff, S. B., Kaczala, C. M., Meece, J. L., &
Midgley, C. (1983). Expectancies, values, and academic behaviors. In J. T.
Spence (Ed.), Achievement and achievement motivation (pp. 75 �146). San
Francisco, CA: W. H. Freeman.
Eccles, J. S., & Wigfield, A. (1995). In the mind of the achiever: The structure of
adolescents� academic achievement-related beliefs and self-perceptions.
Personality and Social Psychology Bulletin, 21, 215-225.

109
Eccles, J. S., Wigfield, A., Schiefele, U. (1998). Motivation to succeed. In N. Eisenberg
(Vol. Ed.) & W. Damon (Series Ed.), Handbook of child psychology, (5 th ed.,
Vol 3, pp, 1017-1095). New York: John Wiley & Sons.
Eccles, J. S., & Wigfield, A. (2002). Motivational beliefs, values, and goals, Annual
Reviews of Psychology, 53, 109-132.
Edge, O. P., & Friedberg, S. H. (1984). Factors affecting achievement in the first course
in calculus. Journal of Experimental Education, 52 (3), 136-140.
Edwards, Clifford H. (2000). Grade Inflation: The effects on educational quality and
personal well being. Education, 120, 546-548.
Etmer, P. A., & Newby, T. J. (1996). The expert learner: Strategic, self-regulated, and
reflective. Instructional Science, 24, 1-24.
Feather, N. T. (1971). Similarity of value systems as a determinant of educational choice
at university level. Australian Journal of Psychology, 23 (2), 201-211.
Feather, N. T. (1975). Values in education and society. New York: The Free Press.
Feather, N. T. (1979). Values, expectancies, and action. Australian Psychologist, 14 (3),
243 �260.
Feather, N. T. (1982). Human values and prediction of action: An expectancy-valence
analysis. In N. T. Feather (Ed.), Expectations and Actions: Expectancy-value
Models in Psychology (pp. 263 �289).
Fincham, F. R., Hokoda, A., Sanders, R. (1989). Learned helplessness, test anxiety, and
academic achievement: A longitudinal analysis. Child Development, 60, 148-145.
Finn, J. D. (1993). School engagement and students at risk. Washington, DC: National
Center for Education Statistics.
110
Finn, J. D., & Rock, D. A. (1997). Academic success among students at risk for school
failure. Journal of Applied Psychology, 82, 221-234.
Frye-Lucas, S. (2003). Factors associated with African American engineering students
success in first year college calculus. Unpublished doctoral dissertation,
University California, Davis.
Gall, M. D., Borg, W. R., Gall, J. P. (2003). Educational research: An introduction (7th ed.). White Plains, New York: Longman.
Gagne, R. M. (1985). The conditions of learning (4 th ed.). New York: Holt, Rinehart &
Winston.
Gainen, J., & Willemsen, E. W. (Eds.). (1995). Fostering student success in quantitative
gateway courses. New Directions for Teaching and Learning (Vol. 61). San
Francisco: Jossey Bass.
Gamoran, A. (1987). The stratification of high school learning opportunities. Sociology of
Education, 60, 135 -155.
Gamoran, A., & Hannigan, E. C. (2000). Algebra for everyone? Benefits of college
preparatory mathematics for students with diverse disabilities in early secondary
school. Educational Evaluation and Policy Analysis, 22(3), 241-254.
Garcia, T., & Pintrich, P. R. (1994). Regulating motivation and cognition in the
classroom: The role of self-schemas and self-regulatory strategies. In D. H.
Schunk & B. J. Zimmerman (Eds.), Self-regulation of Learning and Performance:
Issues and Educational Applications (pp. 127-153). Hillsdale, NJ: Erlbaum.
Gettinger, M., & Seibert, J. K. (2002). Contributions of study skills to academic
competence. School Psychology Review, 32, 350-365.
111
Greenwood, C. R., Delquadri, J., & Hall, R. V. (1984). Opportunity to respond and
student academic performance. In W. Howard, T. Heron, D. Hill, & J. Trap-Porter
(Eds.), Behavior Analysis in Education (pp. 58 -88). Columbus, OH: Merrill.
Hancock, V., & Betts, F. (2002). Back to the future: Preparing learners for academic
success in 2004. Learning and Leading with Technology, 29(7), 10 -14.
Hardy, L. (1997). �Grade inflation: When everyone gets high marks, what�s an A really
worth?� TheAmerican School Board Journal 14, 28�31.
Hidi, S. (1990). Interest and its contribution as a mental resource for learning. Review of
Educational Research, 60(4), 549-571.
Hilton, S. C., Schau, C., & Olsen, J. O. (2004). Survey of attitudes toward statistics:
Factor structure invariance by gender and by administration time. Structural
Equation Modeling, 11(1), 92-109.
Hoffer, T. B., Rasinski, K. A., & Moore, W. (1995). Social background differences in
high school mathematics and science course taking and achievement (NCES
Report No. 95-206). Washington, DC: National Center for Educational Statistics.
Jones, B., Valdez, G., Nowakowski, J., & Rasmussen, C. (1994). Designing Learning and
Technology for Educational Reform. Oak Brook, IL: North Central Regional
Educational Laboratory.
Karabenick, S. A. (2004). Perceived achievement goal structure and college help seeking.
Journal of Educational Psychology, 96 (3), 569-581.
Kitsantas, A. (2002). Test preparation and performance: A self-regulatory analysis. The
Journal of Experimental Education, 70 (2), 101-113.
112
Klem, A. M., & Connell, J. P. (2004). Relationships matter: Linking teacher support to
student engagement and achievement. Journal of School Health, 74 (7), 262-273.
Lee, V.E., Chow-Hoy, T.K., Burkam, D.T., Geverdt, D., & Smerdon, B.A. (1998).
Sector differences in high school course taking: A private school or
catholic school effect? Sociology of Education, 71, 164�187.
Lee, V. E., Croninger, R. G., Smith, J. B. (1997). Course-taking, equity, and mathematics
learning: Testing the constrained curriculum hypothesis in U.S. secondary
schools. Educational Evaluation and Policy Analysis, 19(2), 99 -121.
Ley, K., & Young, D. B. (1998). Self-regulation behaviors in underprepared
(developmental) and regular admission college students. Contemporary
Educational Psychology, 23, 42 -64.
Ma, X. (2000). A longitudinal assessment of antecedent course work in mathematics and
subsequent mathematical attainment, The Journal of Educational Research, 94
(1), 16 � 28.
Marks, H. M. (2000). Student engagement in instructional activity: Patterns in the
elementary, middle, and high school years. American Journal of Education, 94,
153�181.
Meyer, R. (1998). The production of mathematics skills in high school: What works?
Chicago: University of Chicago, Irving B. Harris Graduate school of public policy
studies, and Madison: University of Wisconsin-Madison, Wisconsin center for
education and research.
Miceri, T. (2001). Facts and fantasies regarding admissions standards. Paper presented
at the Association for institutional Research Annual Forum, Long Beach, CA.
113
Michael, T. (1999). Using formative research to conceptualize and develop a marketing
plan for student health services, Journal of American College Health, 47(5), 237 �
239.
Miller, W. J. (2000). Exploring the source of self-regulated learning: The influence of
internal and external comparisons. Journal of Instructional Psychology, 27(1), 47
-53.
Miller, W. J., Coombs, T. W., & Fuqua, R. D. (1999). An examination of psychometric
properties of Bandura�s Multidimensional scales of perceived self-efficacy.
Measurement and evaluation in counseling and development, 31(4), 186-196.
Moller-Wong, C., & Eide, A. (1997). An engineering student retention study. Journal of
Engineering Education, 87(1), 7 � 15.
Moreno, S. E., & Muller, C. (1999). Success and diversity: The transition through first-
year calculus in the university. American Journal of Education, 108, 30 � 57.
Murdock, T. B. (1999). The social context of risk: Status and motivational predictors of
alienation in middle school. Journal of Educational Psychology, 91, 62 �75.
National Center for Education Statistics (NCES). 1996. NAEP Trends in academic
progress. (NCES Rep. No. 97986). Washington, DC: U.S. Department of
Education.
National Center for Education Statistics (NCES). 2001b. The Condition of Education
2001. (NCES 2002-072). Washington, DC: U.S. Department of Education.
National Science Foundation (2004). Science and Engineering Indicators 2004.
(NSB 04-1) Arlington, VA: National Science Foundation.
114
Nelson-Le Gall, S. (1981). Helps-seeking: An understudied problem-solving skill in
children. Developmental Review, 1, 334-246.
Newmann, F. M., Wehlage, G. G., & Lamborn, S. D. (1992). The significance and
sources of student engagement. In F.M. Newmann (Ed.), Student engagement and
achievement in American secondary schools. New York: Teachers� College Press.
Newman, R. S. (1991). Goals and self-regulated learning: What motivates children to see
academic help? In M. L. Maehr & P. R. Pintrich (Eds. ), Advances in motivation
and achievement (Vol. 7, pp. 11-183). Greenwich, CT: JAI press.
Newman, R. S. (1994). Adaptive help seeking: A strategy of self-regulated learning. In
D. H. Schunk & B. J. Zimmerman (Eds.), Self-regulation of learning and
performance: Issues and educational applications (pp. 283-301). Hillsdale, NJ:
Erlbaum.
Newman, R. S. (1998). Adaptive help seeking: A role of social interaction in self
regulated learning. In S. A. Karabenick (Ed.), Strategic help seeking: Implications
for learning and teaching (pp, 13-37). Mahwah, NJ: Erlbaum.
Newman, R. S. (2002). How self-regulated learners cope with academic difficulty: The
role of adaptive help seeking. Theory Into Practice, 41(2), 132 � 138.
Noble, J., & Sawyer, R. (2002). Predicting deferent levels of academic success in college
using high school GPA and ACT composite score (ACT Research Rep. No. 2002-
4). Iowa City, IA: ACT, Inc.
Noeth, R. J., Cruce, T. & Harmston, M. T. (2003). Maintaining a strong engineering
workforce (ACT Policy Report). Iowa City: ACT.
115
Nunnally, J. C., & Bernstein, I. H. (1994). Psychometric theory (3rd ed.). New York:
McGraw-Hill.
Nymstrand, M., & Gamoran, A. (1991). Instructional discourse, student engagement,
literature achievement. Research in the Teaching of English, 25, 261-290.
Orange, C. (1999). Using peer modeling to teach self-regulation. Journal of Experimental
Education, 68 (1), 21-39.
Pedhazur, E. J. (1997). Multiple regression in behavioral research. Harcourt Brace:
Orlando, FL
Perkins, M. M. (2002). An investigation of student persistence in engineering at the
University of South Carolina. Unpublished doctoral dissertation, University of
South Carolina, Columbia.
Pintrich, P. R., & DeGroot, E. V. (1990). Motivational and self-regulated learning
components of classroom academic performance. Journal of Educational
Psychology, 82, 71-80.
Pintrich, P.R., & Schunk, D.H. (1996). Motivation in education: Theory, research, and
applications. Englewood Cliffs: Prentice Hall.
Posavac, E. J., & Carey, R. G. (2002). Program evaluation: Methods and case studies.
Englewood Cliffs, NJ: Prentice Hall.
Prather, E. (1996). Better than the SAT: A study of the effectiveness of the extended
bridge program on the academic success of minority first-year engineering
students. Unpublished doctoral dissertation, University of Cincinnati.
116
Puustinen, M. (1998). Help-seeking behavior in a problem-solving situation:
Development of self-regulation. European Journal of Psychology of Education,
13, 271-282.
Raizen, S. A., & Jones, L. V. (Eds.). (1985). Indicators of precollege education in science
and mathematics: A preliminary review. Washington, DC: National Academy
Press.
Ryan, A. M., & Pintrich, P. R. (1997). �Should I ask for help?� The role of motivation
and attitudes in adolescents� help seeking in math class. Journal of Educational
Psychology, 89, 329-341.
Ryan, R. M., & Deci, E. (2000). Intrinsic and extrinsic motivations: Classic definitions
and new directions. Contemporary Education Psychology, 25, 54-67.
Ryan, R. M., Pintrich, P. R., & Midgley, C. (2001). Avoiding help in the classroom: Who
and why? Educational Psychology Review, 13, 93-114.
Schau, C. G., Dauphinee, T., & Delvecchio, A. (1995). The development and validation
of the survey of attitude toward statistics. Educational and Psychological
Measurement, 55, 868-875.
Schau, C. (2003). Survey of attitudes toward statistics. In J. Maltby, C. A. Lewis, & A.
Hill (Eds.), Commissioned Reviews on 250 Psychological Tests (pp. 898-901).
Lampter, Wales: Edwin Mellen Press.
Schletchty, P. C. (2002). Working on the work: An action plan for teachers, principals,
and superintendents. San Francisco: Jossey-Bass.
Schunk, D. H. (2000). Learning theories: An educational perspective (4th. ed.). Upper
Saddle River, NJ: Prentice-Hall.
117
Schunk, D. H., & Zimmerman, B. J. (Eds.). (1994). Self-regulation of learning and
performance: Issues and educational applications. Hillsdale, NJ: Lawrence
Erlbaum.
Schunk, D. H., & Zimmerman, B. J. (1997). Social origins of self-regulatory competence.
Educational Psychologist, 32, 195-208.
Selvin, P. (1992). Math education: Multiplying the meager numbers. Science, 258, 1200-
1201.
Seymour, E., & Hewitt, N. M. (1997). Talking about leaving: Why undergraduates leave
the sciences. Boulder, CO: Westview.
Shapiro, G.E. (1983). Embarrassment and help-seeking. In B.M. DePaulo, A. Nadler, &
J.D. Fisher (Eds.), New directions in helping: Vol. 2. Help-seeking (pp. 143-163).
Toronto: Academic Press.
Singh, K., Granville, M., & Dika, S. (2002). Mathematics and science achievement:
Effects of motivation, interest, and academic engagement. The Journal of
Educational Research, 95 (6), 323-332.
Stone, J. E. (1995). Inflated grades, inflated enrollment, and inflated budgets: An analysis
and call for review at the state level. Education Policy Analysis Archives, 3(11),
1-31
Sorby, S. A., & Hamlin, A. J. (2001, August). The implementation of a first-year
engineering program and its impact on calculus performance. Paper presented at
the meeting of International Conference on Engineering Education, Oslo,
Norway.
118
Sorge, C. (2001). Impact of engineering students� attitudes on achievement in statistics:
A structural equation model analysis. Unpublished doctoral dissertation,
University of New Mexico, Albuquerque.
Tacq, J. (1997). Multivariate Analysis Techniques in Social Science Research:
From problem to analysis. Thousand Oaks, CA: Sage
Talaga, J. A., & Beehr, T. A. (1995). Are there gender differences in predicting
retirement decisions? Journal of Applied Psychology, 80, 16 - 28
Treisman, P. U. (1985). A study of the mathematics performance of black students at the
University of California, Berkeley. Unpublished doctoral dissertation, University
of California, Berkeley.
Vogt, W. P. (1999). Dictionary of statistics and methodology: A nontechnical guide for
social sciences (2nd ed.). Thousand Oaks, CA: Sage.
Wang, J., & Goldschmidt, P. (1999). Opportunity to learn, language proficiency and
immigrant status on mathematics achievement, The Journal of Educational
Research, 93 (2), 101 -111.
Wasserstein, P. (1995). What middle schoolers say about their school work. Educational
Leadership, 53, 41-43.
Wigfield, A., & Eccles, J. S. (2000). Expectancy-value theory of achievement motivation.
Contemporary Educational Psychology, 25, 68 �81.
Wigfield, A., & Eccles, J. S. (Eds.). (2002). Development of achievement motivation.
New York: Academic Press
119
Wilhite, P., Windham, B., & Munday, R. (1998). Predictive effects of high school
calculus and other variables on achievement in fist-semester college calculus
course. College Student Journal, 32 (4), 610-618.
Willemsen, E. W. (1995). "So what is the problem?: Difficulties at the gate." In J. Gainen
& E. W. Willemsen (Eds.) Fostering student success in quantitative gateway
courses: Vol 61. New Directions for Teaching and Learning, (pp. 15-21). San
Francisco: Jossey-Bass
Williams, J. E. (1996). The relationship between efficacy for self-regulated learning and
domain-specific academic performance, controlling for test anxiety. Journal of
Research in Education, 29, 77-80.
Williams, P. E., & Hellman, C. M. (2004). Differences in self-regulation for online
learning between first and second-generation college students. Research in Higher
Education, 45, 71-82.
Zimmerman, B. J. (2000). Attaining self-regulation: A social cognitive perspective. In M.
Boekaerts, P. Pintrich, & M. Seidner (Eds.), Self-regulation: Theory, Research
and Applications (pp. 13-39). Orlando, FL: Academic Press,
Zimmerman, B. J., & Martinez-Pons, M. (1986). Development of structured interview for
assessing student use of self-regulated learning strategies. American Educational
Research Journal, 23, 614-628
Zimmerman, B. J., Bandura, A., & Martinez-Pons, M. (1992). Self-motivation for
academic attainment: The role of self-efficacy beliefs and personal goal setting.
American Educational Research Journal, 29, 663-676.
120
Zimmerman, B. J. & Martinez-Pons, M. (1988). Construct validation of a strategy model
of student self-regulated learning. Journal of Educational Psychology, 80, 284-
290.
Ziomek, R. L., & Svec, J. C. (1995). High school grades and achievement: Evidence of
grade inflation. ACT Research Report Services. Iowa City: American College
Testing Program.
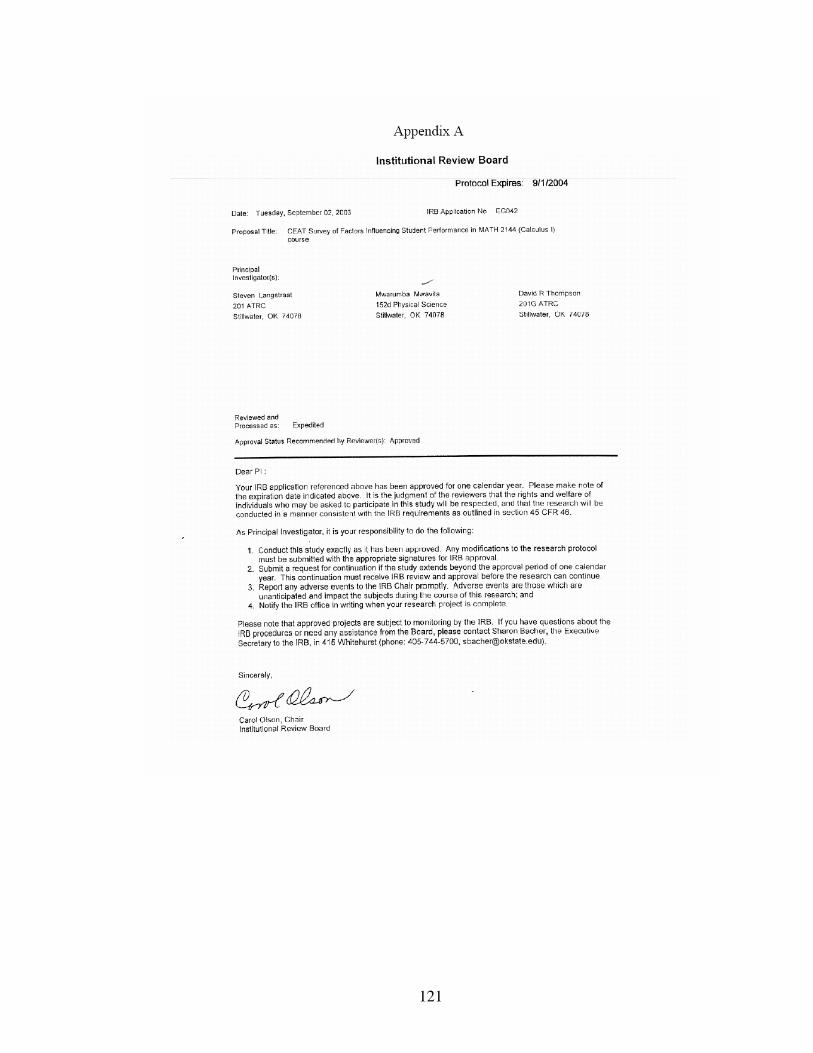
121
122
Appendix B
Engineering Survey of Factors Influencing Student Performance in MATH 2144 (Calculus I)
Implied Assent Statement
Hello, my name is __________ and I'm calling from 's Bureau for Social Research in Stillwater. We are doing a survey on behalf of the University and The College of Engineering.
THE UNIVERSITY and College of Engineering are continuously improving its programs and services so that students have the best opportunity for academic success. Part of this process is asking for feed back from former and current students.
You have been selected to participate in a telephone survey because of your past
enrollment at THE UNIVERSITY in MATH 2144 Calculus I. Participation in this survey is completely voluntary, and your responses are confidential.
The survey takes about fifteen minutes to complete, and if there are any questions
you do not wish to answer, you may ask to skip them. Your response to this survey will be kept in strict confidentiality. The results from
this study will be presented in reports, professional conferences, and or dissertation with no identification of participants. You can withdraw from the interview at anytime without penalty.
Could you take a moment to answer a few questions about your educational
experiences at THE UNIVERSITY?
INTERVIEWER: SELECT 1 TO CONTINUE WITH INTERVIEW, PRESS (CTRL + END) IF NOT AVAILABLE.
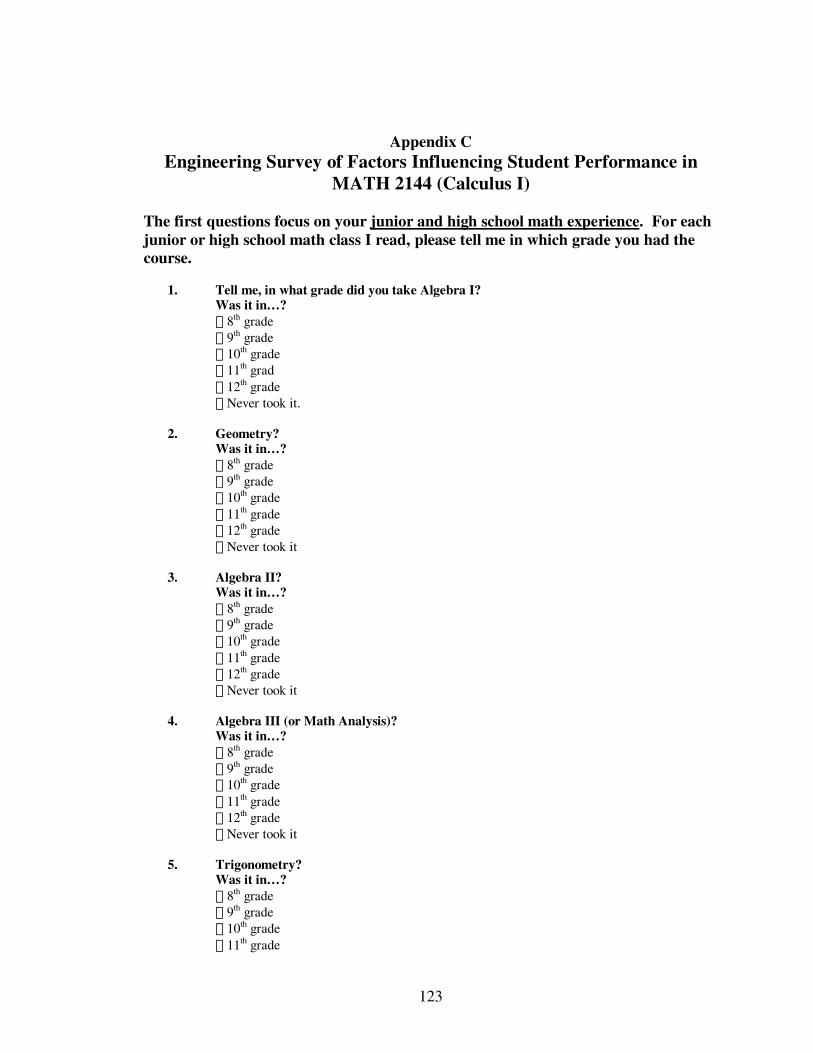
123
Appendix C Engineering Survey of Factors Influencing Student Performance in
MATH 2144 (Calculus I)
The first questions focus on your junior and high school math experience. For each junior or high school math class I read, please tell me in which grade you had the course.
1. Tell me, in what grade did you take Algebra I?
Was it in�? ! 8th grade ! 9th grade ! 10th grade ! 11th grad ! 12th grade ! Never took it.
2. Geometry?
Was it in�? ! 8th grade ! 9th grade ! 10th grade ! 11th grade ! 12th grade ! Never took it
3. Algebra II?
Was it in�? ! 8th grade ! 9th grade ! 10th grade ! 11th grade ! 12th grade ! Never took it
4. Algebra III (or Math Analysis)?
Was it in�? ! 8th grade ! 9th grade ! 10th grade ! 11th grade ! 12th grade ! Never took it
5. Trigonometry?
Was it in�? ! 8th grade ! 9th grade ! 10th grade ! 11th grade
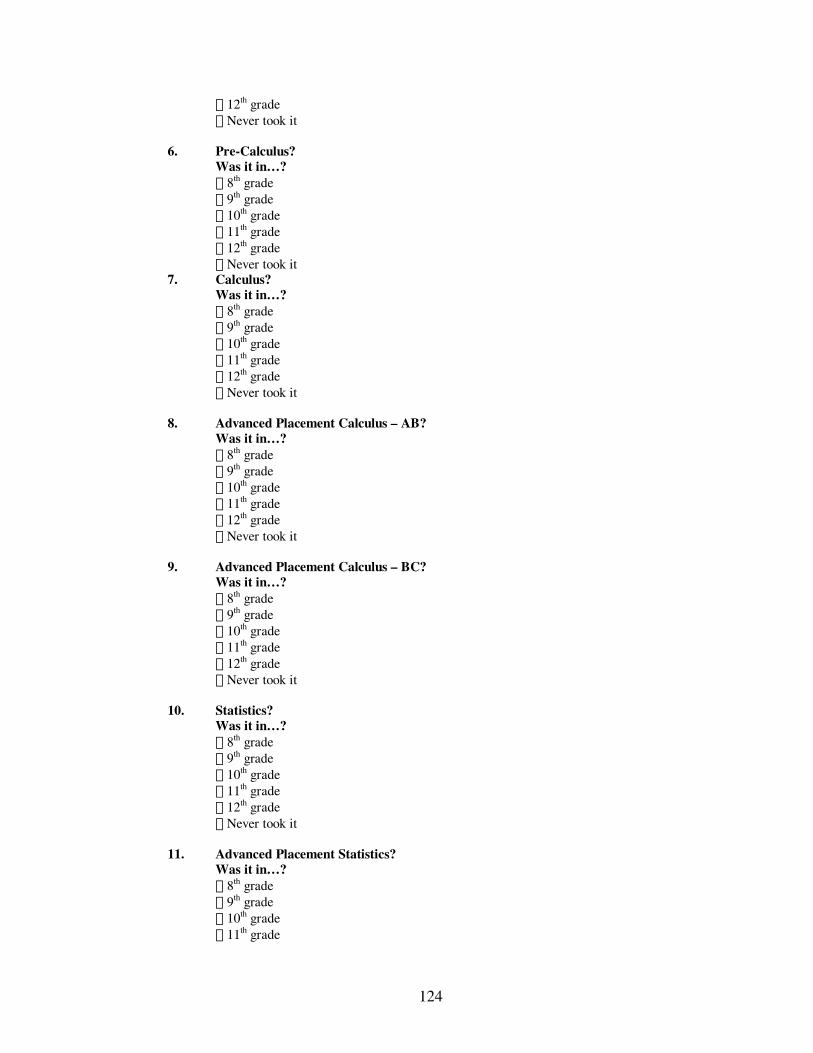
124
! 12th grade ! Never took it
6. Pre-Calculus?
Was it in�? ! 8th grade ! 9th grade ! 10th grade ! 11th grade ! 12th grade ! Never took it
7. Calculus? Was it in�? ! 8th grade ! 9th grade ! 10th grade ! 11th grade ! 12th grade ! Never took it
8. Advanced Placement Calculus � AB?
Was it in�? ! 8th grade ! 9th grade ! 10th grade ! 11th grade ! 12th grade ! Never took it
9. Advanced Placement Calculus � BC?
Was it in�? ! 8th grade ! 9th grade ! 10th grade ! 11th grade ! 12th grade ! Never took it
10. Statistics?
Was it in�? ! 8th grade ! 9th grade ! 10th grade ! 11th grade ! 12th grade ! Never took it
11. Advanced Placement Statistics?
Was it in�? ! 8th grade ! 9th grade ! 10th grade ! 11th grade

125
! 12th grade ! Never took it
The next questions also focus on your junior and high school math experience. For these questions, chose the response that BEST describes your situation.
1. (skip if never had HS algebra) How would you rate your high school ALGEBRA learning
experience in preparation for MATH 2144 (�Calculus I�)? Would you rate your learning experience as � ( Poor ) ( Fair ) ( Good ) ( Excellent )
2. (skip if never had HS calculus) How would you rate your high school CALCULUS learning experience in preparation for MATH 2144 (�Calculus I�)? Would you rate your learning experience as � ( Poor ) ( Fair ) ( Good ) ( Excellent )
3. Was your High school schedule � ( Block Schedule ) ( Regular Schedule )
4. In high school how much time OUTSIDE class per week did you devote to doing MATH
homework? Would you say you devoted � ( None ) ( 1minute � 1hour ) ( 61minutes � 2 hours ) ( 121minutes � 3 hours ) ( 181minutes � 4 hours )
( > 4 hours)
5. (skip if never had HS algebra II) In your ALGEBRA II class, did you cover � (Less than ½ of the MATH textbook. ) (½ of the MATH textbook but less
than ¾. ) (¾ of the MATH textbook, but less than the entire book. ) (The entire MATH textbook. )
The next set of questions focus on your MATH 2144 �CALCULUS I� experience at
the University. Chose the response that BEST describes your situation.
6. How many times did you miss MATH 2144 �CALCULUS I� class last semester? Would you say
you missed � ( 0 times ) ( 1-2 ) ( 3-4 ) ( 5-6 ) ( 7-8 ) ( 9-10 ) ( More than 10 )
7. How often did you READ the textbook sections BEFORE class that corresponded to that day�s
lecture? Would you say � ( Never ) ( Rarely ) ( Sometimes ) ( Often ) ( Always )
8. What percentage of the assigned problems did you do? Would you say � ( 0% - Never did them ) ( 1 - 50% ) ( 51 - 69% ) ( 70 - 79% ) ( 80 - 89% )
( 90 - 100% )
9. What percentage of the time did you attempt your homework problems within the week they were assigned? Would you say� ( 0% - Never ) ( 1 - 50% of the time ) ( 51 - 69% of the time ) ( 70 - 79% of the time ) ( 80 - 89% of the time ) (
90 - 100% of the time )
10. What percentage of the homework problems did you COMPLETE BEFORE the next class session? Would you say �
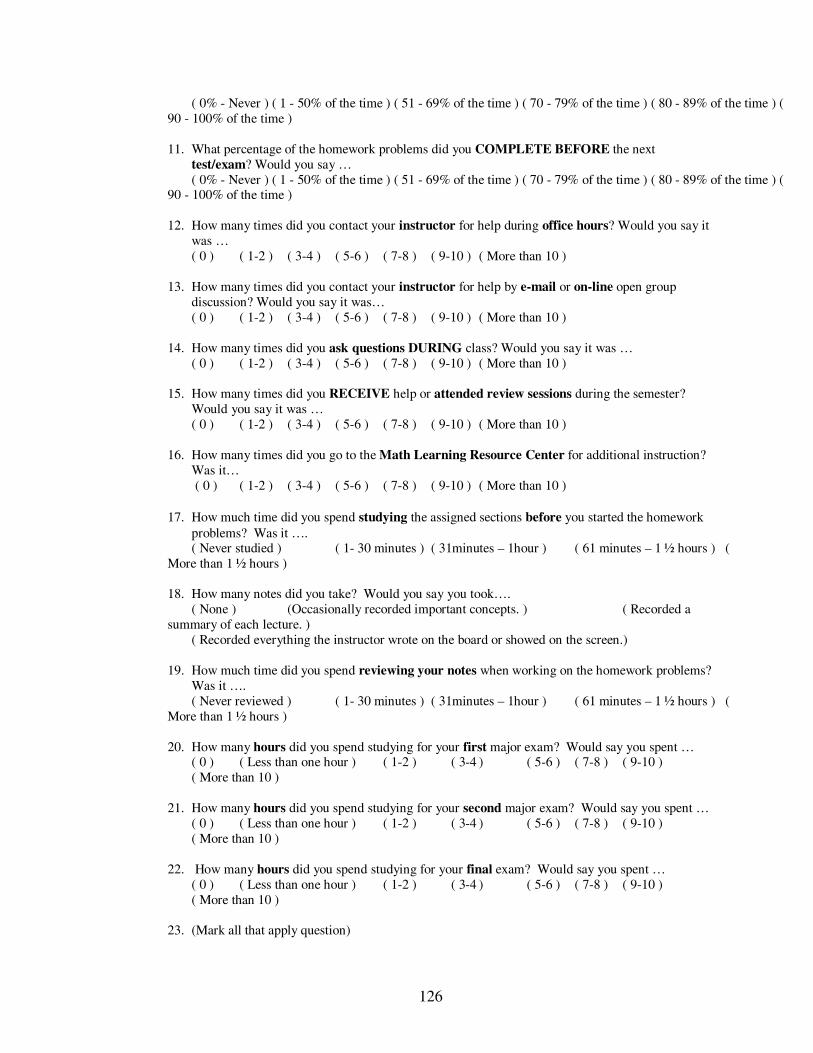
126
( 0% - Never ) ( 1 - 50% of the time ) ( 51 - 69% of the time ) ( 70 - 79% of the time ) ( 80 - 89% of the time ) ( 90 - 100% of the time )
11. What percentage of the homework problems did you COMPLETE BEFORE the next
test/exam? Would you say � ( 0% - Never ) ( 1 - 50% of the time ) ( 51 - 69% of the time ) ( 70 - 79% of the time ) ( 80 - 89% of the time ) (
90 - 100% of the time )
12. How many times did you contact your instructor for help during office hours? Would you say it was � ( 0 ) ( 1-2 ) ( 3-4 ) ( 5-6 ) ( 7-8 ) ( 9-10 ) ( More than 10 )
13. How many times did you contact your instructor for help by e-mail or on-line open group
discussion? Would you say it was� ( 0 ) ( 1-2 ) ( 3-4 ) ( 5-6 ) ( 7-8 ) ( 9-10 ) ( More than 10 )
14. How many times did you ask questions DURING class? Would you say it was �
( 0 ) ( 1-2 ) ( 3-4 ) ( 5-6 ) ( 7-8 ) ( 9-10 ) ( More than 10 )
15. How many times did you RECEIVE help or attended review sessions during the semester? Would you say it was � ( 0 ) ( 1-2 ) ( 3-4 ) ( 5-6 ) ( 7-8 ) ( 9-10 ) ( More than 10 )
16. How many times did you go to the Math Learning Resource Center for additional instruction? Was it� ( 0 ) ( 1-2 ) ( 3-4 ) ( 5-6 ) ( 7-8 ) ( 9-10 ) ( More than 10 )
17. How much time did you spend studying the assigned sections before you started the homework
problems? Was it �. ( Never studied ) ( 1- 30 minutes ) ( 31minutes � 1hour ) ( 61 minutes � 1 ½ hours ) (
More than 1 ½ hours )
18. How many notes did you take? Would you say you took�. ( None ) (Occasionally recorded important concepts. ) ( Recorded a
summary of each lecture. ) ( Recorded everything the instructor wrote on the board or showed on the screen.)
19. How much time did you spend reviewing your notes when working on the homework problems?
Was it �. ( Never reviewed ) ( 1- 30 minutes ) ( 31minutes � 1hour ) ( 61 minutes � 1 ½ hours ) (
More than 1 ½ hours )
20. How many hours did you spend studying for your first major exam? Would say you spent � ( 0 ) ( Less than one hour ) ( 1-2 ) ( 3-4 ) ( 5-6 ) ( 7-8 ) ( 9-10 )
( More than 10 )
21. How many hours did you spend studying for your second major exam? Would say you spent � ( 0 ) ( Less than one hour ) ( 1-2 ) ( 3-4 ) ( 5-6 ) ( 7-8 ) ( 9-10 )
( More than 10 )
22. How many hours did you spend studying for your final exam? Would say you spent � ( 0 ) ( Less than one hour ) ( 1-2 ) ( 3-4 ) ( 5-6 ) ( 7-8 ) ( 9-10 )
( More than 10 ) 23. (Mark all that apply question)
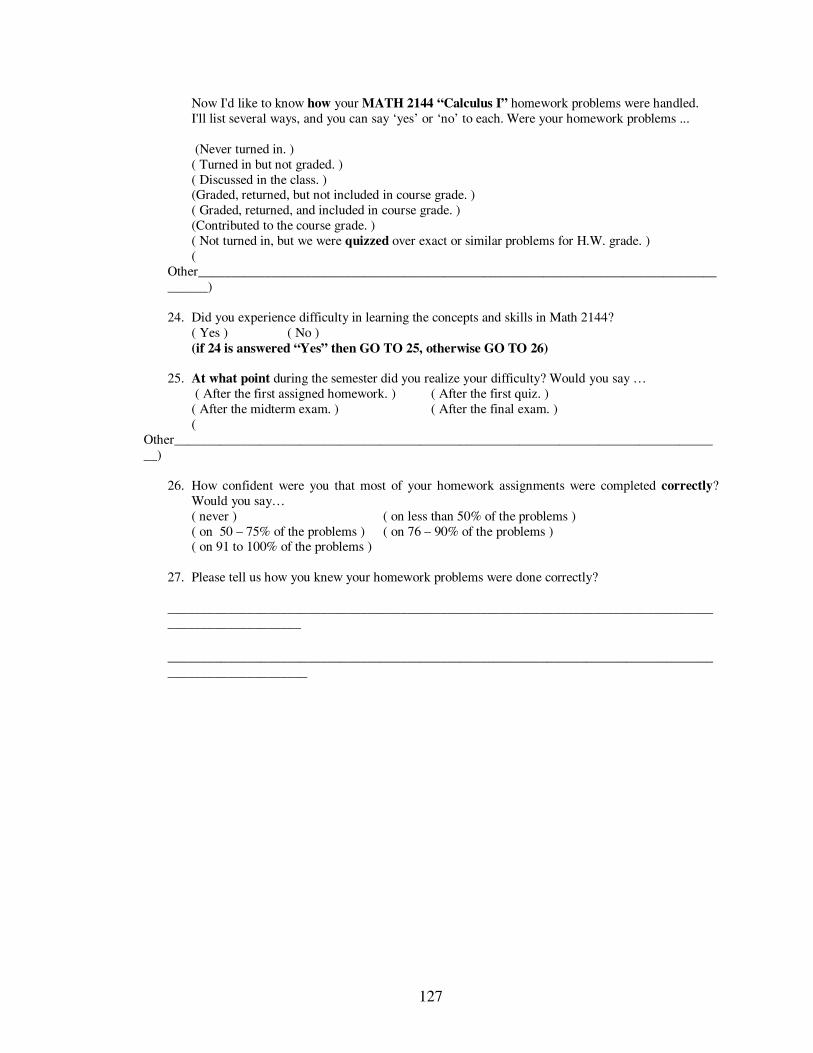
127
Now I'd like to know how your MATH 2144 �Calculus I� homework problems were handled. I'll list several ways, and you can say �yes� or �no� to each. Were your homework problems ... (Never turned in. ) ( Turned in but not graded. ) ( Discussed in the class. )
(Graded, returned, but not included in course grade. ) ( Graded, returned, and included in course grade. ) (Contributed to the course grade. ) ( Not turned in, but we were quizzed over exact or similar problems for H.W. grade. )
( Other____________________________________________________________________________________)
24. Did you experience difficulty in learning the concepts and skills in Math 2144?
( Yes ) ( No ) (if 24 is answered �Yes� then GO TO 25, otherwise GO TO 26)
25. At what point during the semester did you realize your difficulty? Would you say � ( After the first assigned homework. ) ( After the first quiz. ) ( After the midterm exam. ) ( After the final exam. ) (
Other___________________________________________________________________________________)
26. How confident were you that most of your homework assignments were completed correctly?
Would you say� ( never ) ( on less than 50% of the problems ) ( on 50 � 75% of the problems ) ( on 76 � 90% of the problems ) ( on 91 to 100% of the problems )
27. Please tell us how you knew your homework problems were done correctly? ______________________________________________________________________________________________________ _______________________________________________________________________________________________________
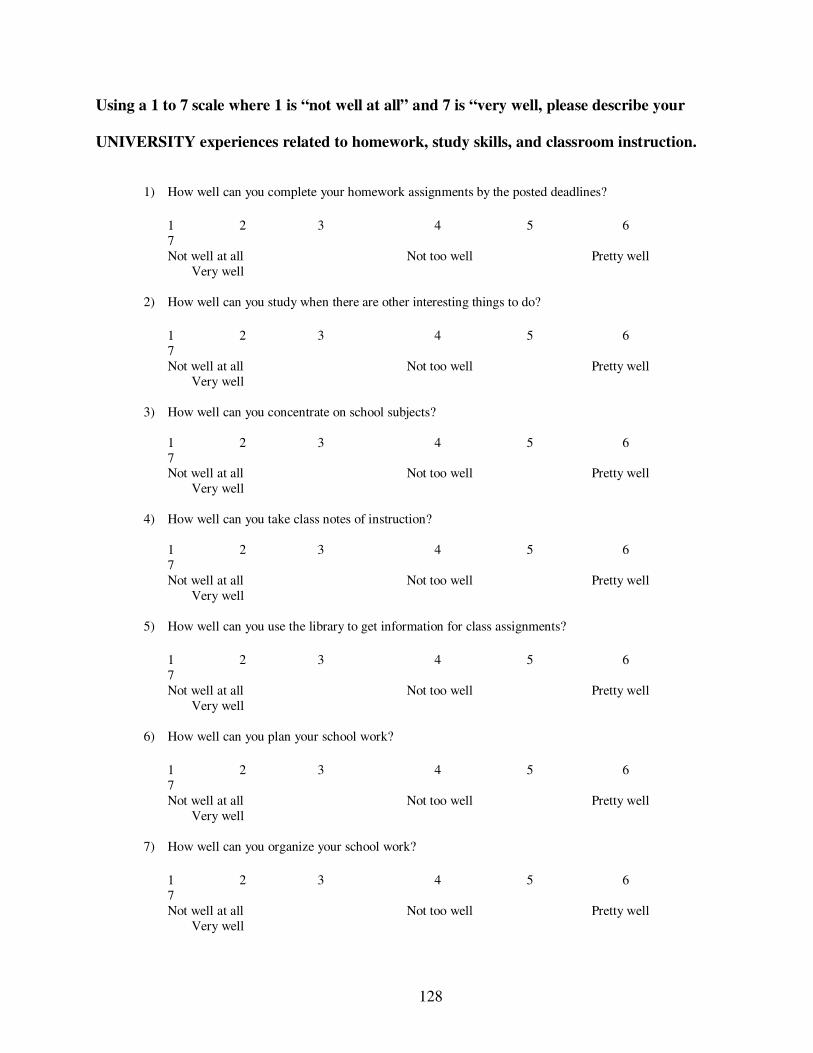
128
Using a 1 to 7 scale where 1 is �not well at all� and 7 is �very well, please describe your
UNIVERSITY experiences related to homework, study skills, and classroom instruction.
1) How well can you complete your homework assignments by the posted deadlines?
1 2 3 4 5 6 7 Not well at all Not too well Pretty well Very well
2) How well can you study when there are other interesting things to do?
1 2 3 4 5 6 7 Not well at all Not too well Pretty well Very well
3) How well can you concentrate on school subjects?
1 2 3 4 5 6 7 Not well at all Not too well Pretty well Very well
4) How well can you take class notes of instruction?
1 2 3 4 5 6 7 Not well at all Not too well Pretty well Very well
5) How well can you use the library to get information for class assignments?
1 2 3 4 5 6 7 Not well at all Not too well Pretty well Very well
6) How well can you plan your school work?
1 2 3 4 5 6 7 Not well at all Not too well Pretty well Very well
7) How well can you organize your school work?
1 2 3 4 5 6 7 Not well at all Not too well Pretty well Very well
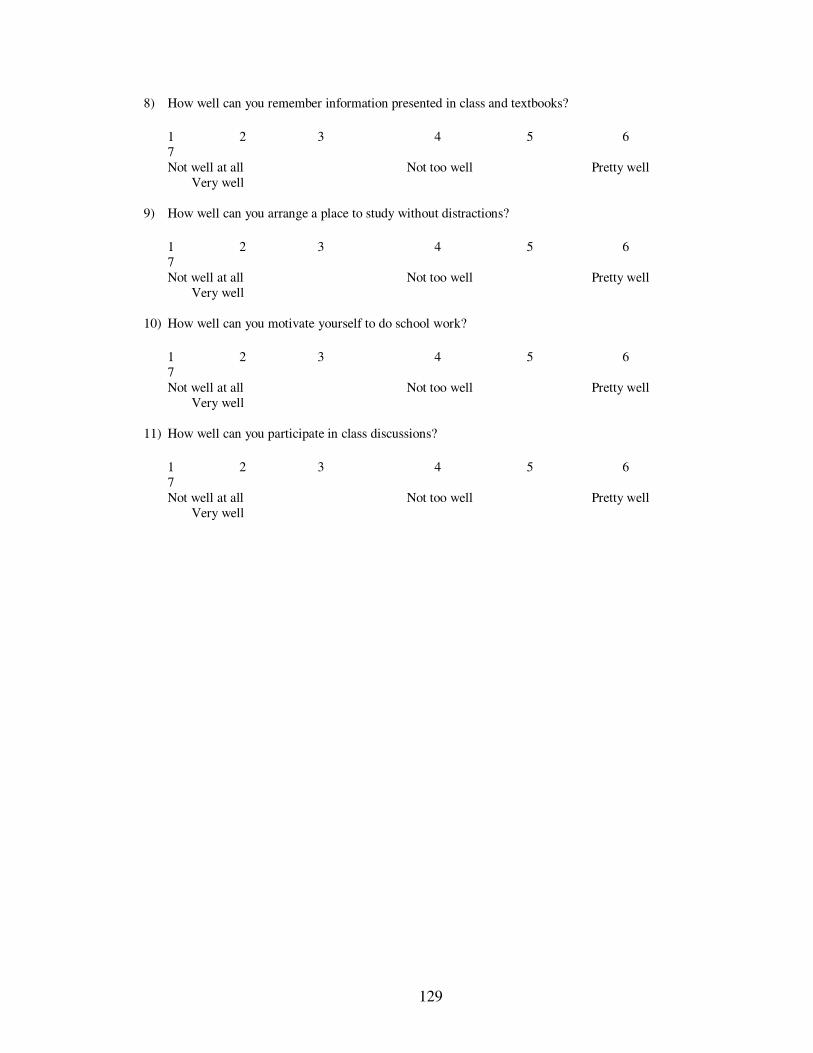
129
8) How well can you remember information presented in class and textbooks?
1 2 3 4 5 6 7 Not well at all Not too well Pretty well Very well
9) How well can you arrange a place to study without distractions?
1 2 3 4 5 6 7 Not well at all Not too well Pretty well Very well
10) How well can you motivate yourself to do school work?
1 2 3 4 5 6 7 Not well at all Not too well Pretty well Very well
11) How well can you participate in class discussions?
1 2 3 4 5 6 7 Not well at all Not too well Pretty well Very well
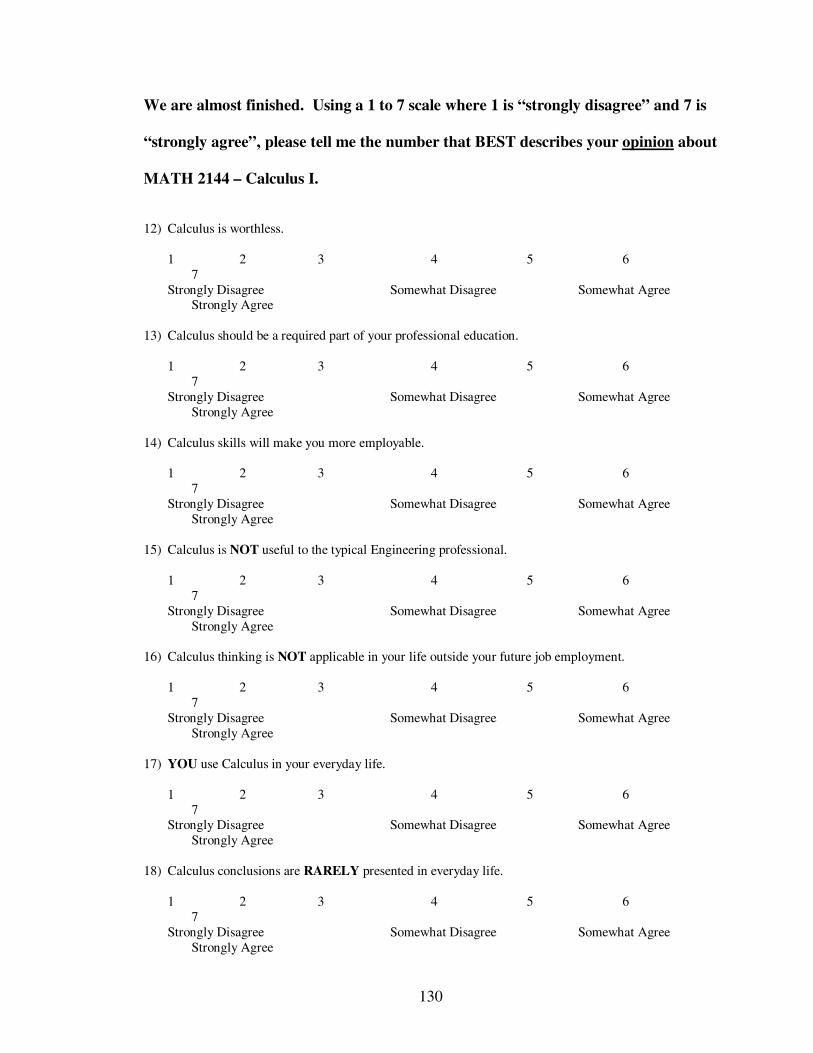
130
We are almost finished. Using a 1 to 7 scale where 1 is �strongly disagree� and 7 is
�strongly agree�, please tell me the number that BEST describes your opinion about
MATH 2144 � Calculus I.
12) Calculus is worthless.
1 2 3 4 5 6 7 Strongly Disagree Somewhat Disagree Somewhat Agree Strongly Agree
13) Calculus should be a required part of your professional education.
1 2 3 4 5 6 7 Strongly Disagree Somewhat Disagree Somewhat Agree Strongly Agree
14) Calculus skills will make you more employable.
1 2 3 4 5 6 7 Strongly Disagree Somewhat Disagree Somewhat Agree Strongly Agree
15) Calculus is NOT useful to the typical Engineering professional.
1 2 3 4 5 6 7 Strongly Disagree Somewhat Disagree Somewhat Agree Strongly Agree
16) Calculus thinking is NOT applicable in your life outside your future job employment.
1 2 3 4 5 6 7 Strongly Disagree Somewhat Disagree Somewhat Agree Strongly Agree
17) YOU use Calculus in your everyday life.
1 2 3 4 5 6 7 Strongly Disagree Somewhat Disagree Somewhat Agree Strongly Agree
18) Calculus conclusions are RARELY presented in everyday life.
1 2 3 4 5 6 7 Strongly Disagree Somewhat Disagree Somewhat Agree Strongly Agree

131
19) YOU will have NO application for Calculus in your future profession.
1 2 3 4 5 6 7 Strongly Disagree Somewhat Disagree Somewhat Agree Strongly Agree
20) Calculus is irrelevant in your life.
1 2 3 4 5 6 7 Strongly Disagree Somewhat Disagree Somewhat Agree Strongly Agree
21a) Would you be willing to participate in a follow � up focus group to discuss and elaborate further on your experience in Math 2144 in the coming two weeks? (Yes) (No � if no go to �Thank� screen) 21b) If Yes: You may be contacted via telephone or email with information about these focus groups about 2 weeks after this interview. (Then go to �Thank� screen�)
132
Appendix D BSR STEP BY STEP PROCEDURE
The �CEAT MATH 2144� study was a survey of students at the Large Midwesten University who had taken College Calculus I (MATH 2144) during the Fall 2002 semester and/orSpring 2003 semester. Data collection was conducted between September 3 and September 12, 2003 by the Bureau for Social Research at The Large Midwestern University. Computer Assisted Telephone Interviewing (CATI) was the data collection technology used for this project. Interviewer Selection
Interviewers were students at . They were selected for their communication and data collection skills, trained for this project, and supervised closely during all their work. Many interviewers had worked at the BSR previous semesters on other projects. Training of Interviewers
Training of the interviewers at the BSR was conducted in three phases. Phases one and two applied only for new interviewers, while phase three applied to all interviewers. In the first phase, new interviewers were required to attend an initial training session during which they were given basic instructions/guidance in survey interviewing. During the second phase, new interviewers attended a second training session which began with a written test over material covered in phase one, as well as content from the interviewer training manual. Then new interviewers were given instructions on using the CATI software. In the third phase, all interviewers attended a training session which covered survey protocol and policies for this project and the actual survey questionnaire was reviewed item by item. Following the project-specific training session, each interviewer had a practice session on the computer with a supervisor or other BSR staff members. All new interviewers had to pass an oral competency practice interview. As an employment requirement, all interviewers were required to read and sign a statement of professional ethics that contains explicit guidelines about appropriate interviewer behavior and protection of confidential respondent information. Fifteen (15) interviewers collected data for this survey. Many interviewers had worked at the BSR previous semesters on other projects. Computer Assisted Telephone Interviews
This project used the Ci3 for Windows system (from Sawtooth Software, Inc.) for authoring the interview script for the computer program. Once programmed, the
133
interview script was uploaded to the interviewing software, WinCATI version 4.2 (from Sawtooth Technologies, Inc.). To conduct interviews using Computer Assisted Telephone Interviewing (CATI) software, each interviewer uses a personal computer, which displays survey questions on the computer screen one at a time in the proper order. The interviewer wears a telephone headset and has both hands free for entering responses into the computer via the keyboard. Responses are entered as numbers, such as �1� for yes and �2� for no. Ci3 and WinCATI allow the computer to skip specified questions based on respondents' answers to previous questions. This eliminates asking certain questions that are not applicable to respondents. It also improves the quality of the data collected. Supervision
Interviews were supervised throughout the data collection process. Supervisory responsibilities include monitoring interviews, responding to interviewer questions, reviewing call back appointments for the next day, and running reports on interviewer productivity. Operations
Interviews were conducted by telephone from the phone bank located at the BSR. The interviewing was organized into evening shifts Monday through Thursday and an afternoon shift on Friday. The majority of interviewing took place in the evening. Telephone numbers (contact records) to be called were assigned a priority code automatically by the CATI system. The priority code was based on the outcome (or disposition) of the most recent call attempt. Attempts that resulted in the target respondent asking to be called back at a later day/time received the highest priority code. Attempts that resulted in answering machines, no answers, and busy signals received lower priority codes. The disposition of each attempt was recorded and stored in the CATI system. Interviewers were instructed to review the call history of previous attempts prior to making calls. Each telephone number in the sample was called until it had been attempted at least 12 times without success or until data collection ended on September 12, 2003. After each call attempt, the software allowed the interviewer to type a message describing the outcome of the attempt in a �message box�. Interviewers were instructed to record any pertinent information about the call in this box. For example, interviewers could indicate relevant information about respondents who refused to participate in the interview, or they could record information pertaining to scheduling future interview appointments. When a target respondent refused participation, interviewers were instructed to indicate the respondent�s reason for declining participation in the interview, the points used by the interviewer to encourage participation, and the point at which the introductory script was terminated. In many instances, target respondents who declined
134
participation were called again in hopes of gaining their cooperation. Once a target respondent refused the interview twice, their phone number was not attempted again. Interviewers who set call back appointments were instructed to record the specific date and time of the scheduled appointment, the name of the target respondent (if determined), and whether the appointment was definite or indefinite. The computer prompted the interviewer to enter the call back date and time using a computer calendar and clock function. These call back appointments were then stored by the CATI system until the appropriate date and time. Open-ended responses were typed, verbatim, directly into the computer using a text box on the computer screen. In addition, interviewers could record special notes or comments about the interview in a �notes� field using the computer�s function keys. For each call made, the CATI system recorded the date, time, and disposition of the call as well as the interviewer identification number. Completed interviews were recorded directly into the CATI system and stored on a BSR file server. Each completed interview was assigned a unique respondent number. The data files were backed up at the end of the day automatically by the CATI software. Answering Machine Messages
The sample for this study included many students with answering machines. Interviewers were instructed to leave a message stating they were calling from the Bureau for Social Research at the Large Midwestern University, and they would be calling back. Interviewers gave a local number (or toll-free number, if needed) and stated the respondent could call the BSR to participate in the study.
135
Appendix E Bureau for Social Research
Staff Confidentiality Agreement The Bureau for Social Research was created to support and facilitate social and behavioral science research at and beyond. Our research projects sometimes ask sensitive and confidential information from research participants. Truthful and accurate respondent information is critical to the accuracy of results and procedures. As a result, the nature of the information collected by staff working for the Bureau for Social Research requires a commitment of confidentiality to protect research participants� rights to privacy. Frequently a commitment of confidentiality is a prerequisite to facilitate participation by respondents in research projects. Therefore, we have made, and will continue to offer, a commitment of confidentiality to respondents and research sponsors. Because unauthorized breaches of that confidentiality would violate assurances we have given that are essential to obtaining truthful and accurate information, thereby impinging on our ability to produce accurate and reliable products, unauthorized disclthe Universityre of research information would result in a greater harm than benefit to the public interest. As a result, the Bureau for Social Research requests that each employee read and sign the following confidentiality agreement as a condition of employment. I HEREBY AGREE NOT TO RELEASE THE FOLLOWING PRIVILEDGED INFORMATION TO ANY NON-BUREAU PERSONNEL WITHOUT PROPER AUTHORIZATION FROM A DULY AUTHORIZED EMPLOYEE OR AGENT OF THE BUREAU FOR SOCIAL RESEARCH:
1. Information leading to the identification of study participants. 2. Questionnaire forms, questions and materials, 3. Individual participant responses and research results, and 4. Unpublished tabulations of research results.
I FURTHER AGREE:
5. To refrain from discussing material relating to individual respondents with persons other than project staff, and
6. To see that information is released only to authorized personnel.
I understand that violation of this agreement would result in dismissal and could result in civil action.
Signed Date Witness Date
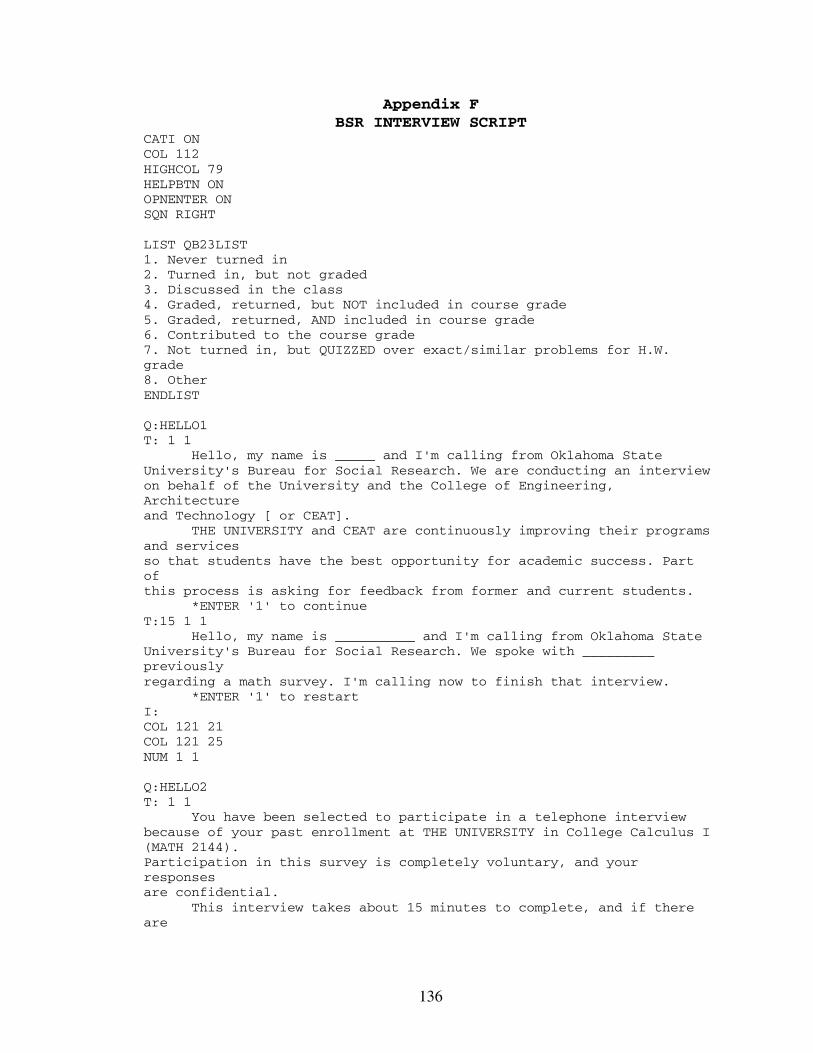
136
Appendix F BSR INTERVIEW SCRIPT
CATI ON COL 112 HIGHCOL 79 HELPBTN ON OPNENTER ON SQN RIGHT LIST QB23LIST 1. Never turned in 2. Turned in, but not graded 3. Discussed in the class 4. Graded, returned, but NOT included in course grade 5. Graded, returned, AND included in course grade 6. Contributed to the course grade 7. Not turned in, but QUIZZED over exact/similar problems for H.W. grade 8. Other ENDLIST Q:HELLO1 T: 1 1 Hello, my name is _____ and I'm calling from Oklahoma State University's Bureau for Social Research. We are conducting an interview on behalf of the University and the College of Engineering, Architecture and Technology [ or CEAT]. THE UNIVERSITY and CEAT are continuously improving their programs and services so that students have the best opportunity for academic success. Part of this process is asking for feedback from former and current students. *ENTER '1' to continue T:15 1 1 Hello, my name is __________ and I'm calling from Oklahoma State University's Bureau for Social Research. We spoke with _________ previously regarding a math survey. I'm calling now to finish that interview. *ENTER '1' to restart I: COL 121 21 COL 121 25 NUM 1 1 Q:HELLO2 T: 1 1 You have been selected to participate in a telephone interview because of your past enrollment at THE UNIVERSITY in College Calculus I (MATH 2144). Participation in this survey is completely voluntary, and your responses are confidential. This interview takes about 15 minutes to complete, and if there are

137
any questions you do not wish to answer, you may skip them. Would this be a good time to answer a few questions about your educational experience at THE UNIVERSITY? *IWER: SELECT 1 TO CONTINUE, PRESS (CTRL+END) IF NOT AVAILABLE. I: COL 121 9 COL 121 10 NUM 1 1 QAL Notqal INTDATE = SYSDATE INTTIME = SYSTIME CMDI ATTNUM "NumberOfAttempt" CMDI RECNUM "RecordNumber" CMDI IWERID "CurrentInterviewerID" Q:QA1 ******************************* T: 5 4 To begin, I would like to ask some questions that focus on your junior high (or middle school) and high school math experience(s). For each high school math class I read, please tell me in which grade you had the course. Tell me, in what grade did you take Algebra I? Was it in...? T: 12 4 1. 8th grade 2. 9th grade 3. 10th grade 4. 11th grade 5. 12th grade 6. Never took it [7. INVALID RESPONSE] 8. DON'T KNOW 9. REFUSED I: LOC 12 9 1 HLA .3 NUM 1 9 IF (ANS > 6) IF (ANS < 8) BEEP REASK ENDIF ENDIF Q:QA2 ******************************* T: 5 4 Geometry? Was it in...? T: 10 4 1. 8th grade 2. 9th grade 3. 10th grade 4. 11th grade 5. 12th grade
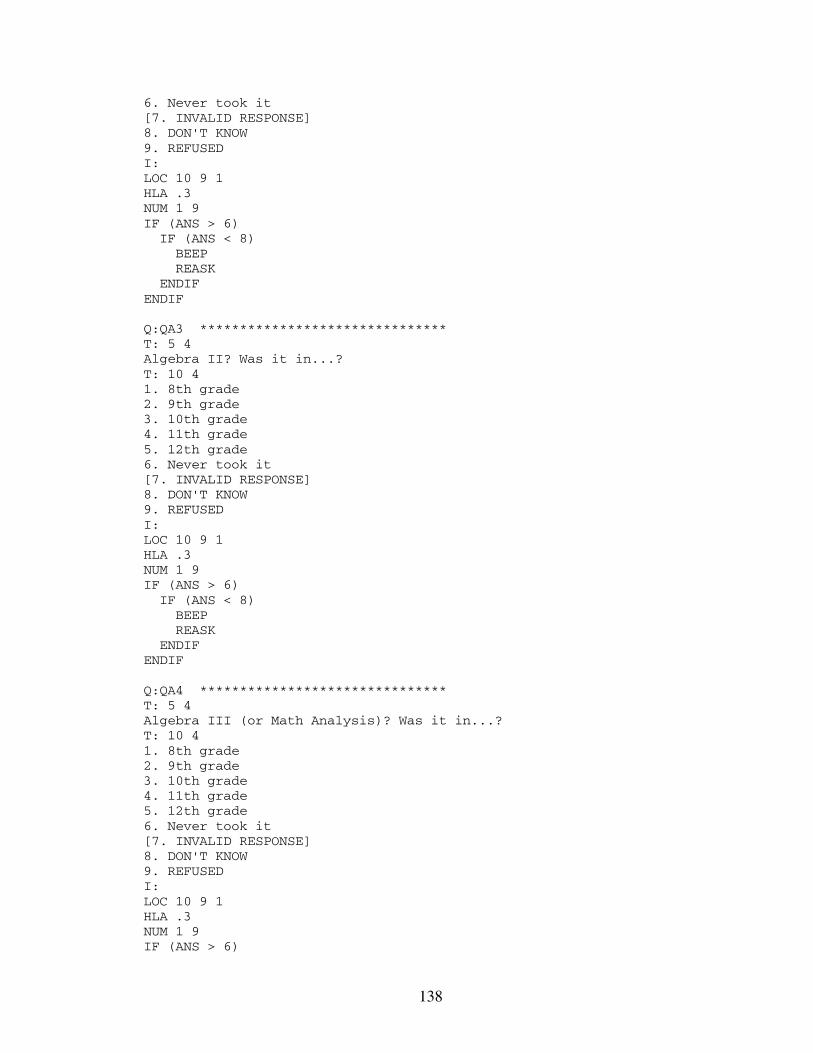
138
6. Never took it [7. INVALID RESPONSE] 8. DON'T KNOW 9. REFUSED I: LOC 10 9 1 HLA .3 NUM 1 9 IF (ANS > 6) IF (ANS < 8) BEEP REASK ENDIF ENDIF Q:QA3 ******************************* T: 5 4 Algebra II? Was it in...? T: 10 4 1. 8th grade 2. 9th grade 3. 10th grade 4. 11th grade 5. 12th grade 6. Never took it [7. INVALID RESPONSE] 8. DON'T KNOW 9. REFUSED I: LOC 10 9 1 HLA .3 NUM 1 9 IF (ANS > 6) IF (ANS < 8) BEEP REASK ENDIF ENDIF Q:QA4 ******************************* T: 5 4 Algebra III (or Math Analysis)? Was it in...? T: 10 4 1. 8th grade 2. 9th grade 3. 10th grade 4. 11th grade 5. 12th grade 6. Never took it [7. INVALID RESPONSE] 8. DON'T KNOW 9. REFUSED I: LOC 10 9 1 HLA .3 NUM 1 9 IF (ANS > 6)
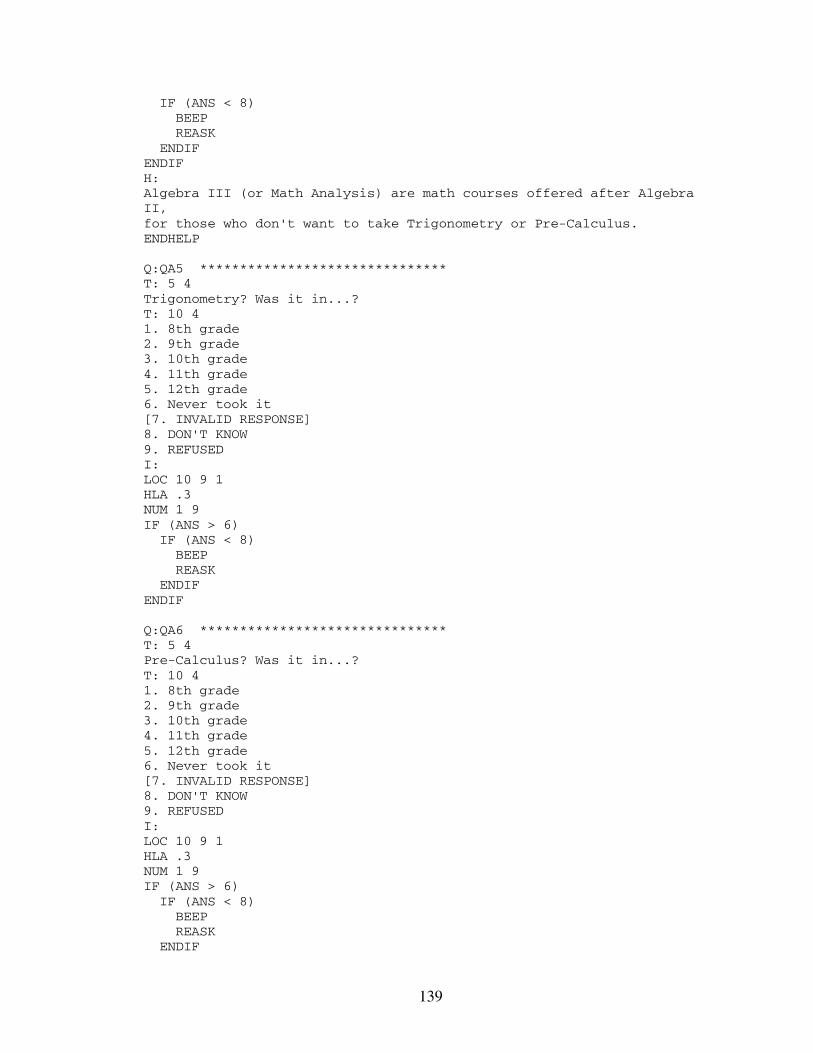
139
IF (ANS < 8) BEEP REASK ENDIF ENDIF H: Algebra III (or Math Analysis) are math courses offered after Algebra II, for those who don't want to take Trigonometry or Pre-Calculus. ENDHELP Q:QA5 ******************************* T: 5 4 Trigonometry? Was it in...? T: 10 4 1. 8th grade 2. 9th grade 3. 10th grade 4. 11th grade 5. 12th grade 6. Never took it [7. INVALID RESPONSE] 8. DON'T KNOW 9. REFUSED I: LOC 10 9 1 HLA .3 NUM 1 9 IF (ANS > 6) IF (ANS < 8) BEEP REASK ENDIF ENDIF Q:QA6 ******************************* T: 5 4 Pre-Calculus? Was it in...? T: 10 4 1. 8th grade 2. 9th grade 3. 10th grade 4. 11th grade 5. 12th grade 6. Never took it [7. INVALID RESPONSE] 8. DON'T KNOW 9. REFUSED I: LOC 10 9 1 HLA .3 NUM 1 9 IF (ANS > 6) IF (ANS < 8) BEEP REASK ENDIF
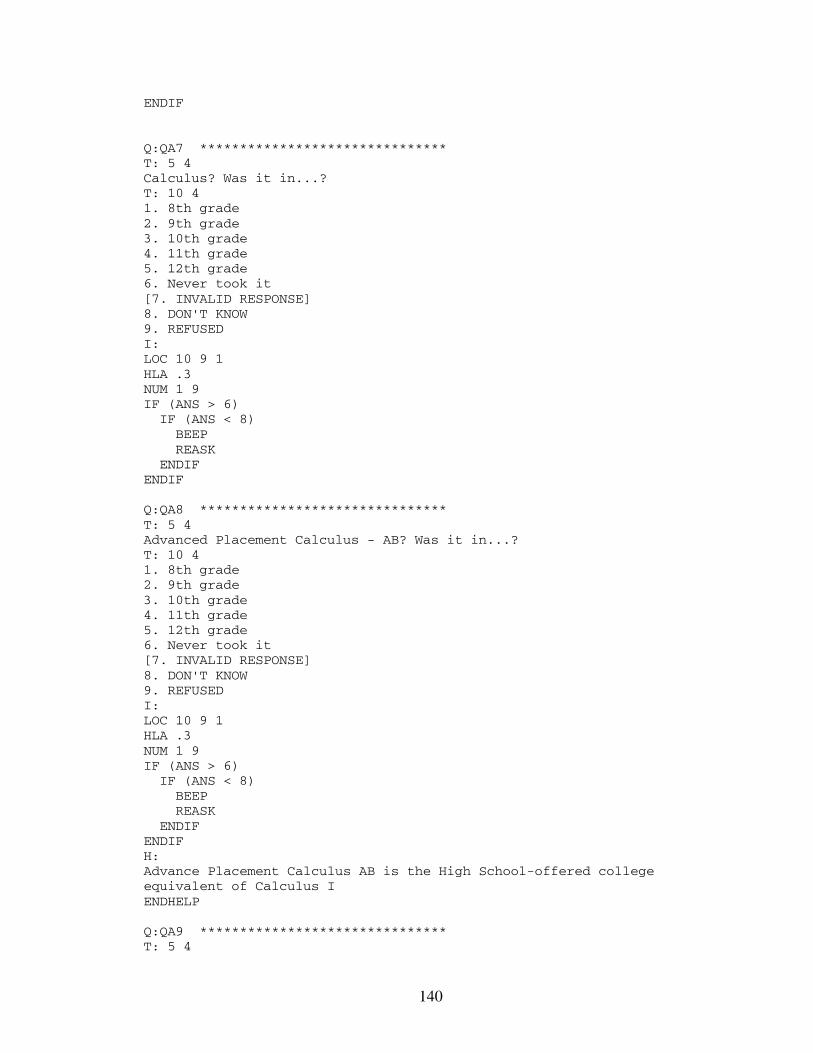
140
ENDIF Q:QA7 ******************************* T: 5 4 Calculus? Was it in...? T: 10 4 1. 8th grade 2. 9th grade 3. 10th grade 4. 11th grade 5. 12th grade 6. Never took it [7. INVALID RESPONSE] 8. DON'T KNOW 9. REFUSED I: LOC 10 9 1 HLA .3 NUM 1 9 IF (ANS > 6) IF (ANS < 8) BEEP REASK ENDIF ENDIF Q:QA8 ******************************* T: 5 4 Advanced Placement Calculus - AB? Was it in...? T: 10 4 1. 8th grade 2. 9th grade 3. 10th grade 4. 11th grade 5. 12th grade 6. Never took it [7. INVALID RESPONSE] 8. DON'T KNOW 9. REFUSED I: LOC 10 9 1 HLA .3 NUM 1 9 IF (ANS > 6) IF (ANS < 8) BEEP REASK ENDIF ENDIF H: Advance Placement Calculus AB is the High School-offered college equivalent of Calculus I ENDHELP Q:QA9 ******************************* T: 5 4

141
Advanced Placement Calculus - BC? Was it in...? T: 10 4 1. 8th grade 2. 9th grade 3. 10th grade 4. 11th grade 5. 12th grade 6. Never took it [7. INVALID RESPONSE] 8. DON'T KNOW 9. REFUSED I: LOC 10 9 1 HLA .3 NUM 1 9 IF (ANS > 6) IF (ANS < 8) BEEP REASK ENDIF ENDIF H: Advance Placement Calculus BC is the High School-offered college equivalent of Calculus II ENDHELP Q:QA10 ******************************* T: 5 4 Statistics? Was it in...? T: 10 4 1. 8th grade 2. 9th grade 3. 10th grade 4. 11th grade 5. 12th grade 6. Never took it [7. INVALID RESPONSE] 8. DON'T KNOW 9. REFUSED I: LOC 10 9 1 HLA .3 NUM 1 9 IF (ANS > 6) IF (ANS < 8) BEEP REASK ENDIF ENDIF Q:QA11 ******************************* T: 5 4 Advanced Placement Statistics? Was it in...? T: 10 4 1. 8th grade 2. 9th grade 3. 10th grade
142
4. 11th grade 5. 12th grade 6. Never took it [7. INVALID RESPONSE] 8. DON'T KNOW 9. REFUSED I: LOC 10 9 1 HLA .3 NUM 1 9 IF (ANS > 6) IF (ANS < 8) BEEP REASK ENDIF ENDIF Q:QB1 T: 5 4 The next questions also focus on your junior high (or middle school) and high school math experience(s). For these questions, choose the response that BEST describes your situation. Overall, how would you rate your HIGH SCHOOL ALGEBRA learning experience in preparation for College Calculus I (MATH 2144)? Would you rate your learning experience as... T: 13 4 1. Poor 2. Fair 3. Good 4. Excellent [5. INVALID RESPONSE] [6. INVALID RESPONSE] [7. INVALID RESPONSE] 8. DON'T KNOW 9. REFUSED I: IF (QA1 = 6) IF (QA3 = 6) IF (QA4 = 6) SKP ENDIF ENDIF ENDIF LOC 13 9 1 HLA .3 NUM 1 9 IF (ANS > 4) IF (ANS < 8) BEEP REASK ENDIF ENDIF Q:QB2 T: 5 4 Overall, how would you rate your HIGH SCHOOL CALCULUS learning
143
experience in preparation for College Calculus I (MATH 2144)? Would you rate your learning experience as... T: 10 4 1. Poor 2. Fair 3. Good 4. Excellent [5. INVALID RESPONSE] [6. INVALID RESPONSE] [7. INVALID RESPONSE] 8. DON'T KNOW 9. REFUSED I: IF (QA7 = 6) IF (QA8 = 6) IF (QA9 = 6) SKP ENDIF ENDIF ENDIF LOC 10 9 1 HLA .3 NUM 1 9 IF (ANS > 4) IF (ANS < 8) BEEP REASK ENDIF ENDIF Q:QB3 T: 5 4 Was your High school schedule... T: 10 4 1. Block Schedule 2. Regular Schedule [3. INVALID RESPONSE] [4. INVALID RESPONSE] [5. INVALID RESPONSE] [6. INVALID RESPONSE] [7. INVALID RESPONSE] 8. DON'T KNOW 9. REFUSED I: LOC 10 9 1 HLA .3 NUM 1 9 IF (ANS > 2) IF (ANS < 8) BEEP REASK ENDIF ENDIF H: Block scheduling is generally when H.S. courses are completed in 18 weeks instead of 36 weeks.
144
If respondent reports "both", then ask how a majority of their math classes were scheduled. If a majority were block, then choose block. ENDHELP Q:QB4 T: 5 4 In high school how much time OUTSIDE CLASS per week did you devote to doing MATH homework? Would you say you devoted... T: 10 4 1. None 2. 1 hour or less (1 to 60 min) 3. 1 to two hours (61 to 120 min) 4. 2 to three hours (121 to 180 min) 5. 3 to four hours (181 to 240 min) 6. More than 4 hours [7. INVALID ANSWER] 8. DON'T KNOW 9. REFUSED I: LOC 10 9 1 HLA .3 NUM 1 9 IF (ANS > 6) IF (ANS < 8) BEEP REASK ENDIF ENDIF Q:QB5 T: 5 4 In your ALGEBRA II class, did you cover... T: 10 4 1. Less than ½ of the MATH textbook. 2. ½ of the MATH textbook but less than ¾. 3. ¾ of the MATH textbook, but less than the entire book. 4. The entire MATH textbook. [5. INVALID ANSWER] [6. INVALID ANSWER] [7. INVALID ANSWER] 8. DON'T KNOW 9. REFUSED I: IF (QA3 = 6) SKP LOC 10 9 1 HLA .3 NUM 1 9 IF (ANS > 4) IF (ANS < 8) BEEP REASK ENDIF ENDIF Q:QB6 T: 5 4
145
The next set of questions focus on your College Calculus I experience at THE UNIVERSITY. Excluding the current semester, choose the response that BEST describes your situation during the most recent semester you were enrolled in Math 2144. When you took College Calculus I (MATH 2144), how many times would you say you missed class? T: 13 4 1. 0 times 2. 1-2 3. 3-4 4. 5-6 5. 7-8 6. 9-10 7. More than 10 8. DON'T KNOW 9. REFUSED I: LOC 13 9 1 HLA .3 NUM 1 9 H: Refer to the most recent semester in which they took the course. ENDHELP Q:QB7 T: 5 4 How often did you READ the textbook sections BEFORE class that corresponded to that day's lecture? Would you say... T: 10 4 1. Never 2. Rarely 3. Sometimes 4. Often 5. Always [6. INVALID ANSWER] [7. INVALID ANSWER] 8. DON'T KNOW 9. REFUSED I: LOC 10 9 1 HLA .3 NUM 1 9 IF (ANS > 5) IF (ANS < 8) BEEP REASK ENDIF ENDIF H: Refer to the most recent semester in which they took the course. ENDHELP Q:QB8 T: 5 4 What percentage of the assigned problems did YOU do?
146
*IWER: Do not read response options unless probing T: 10 4 [1. 0% - Never did them] [2. 1 - 50%] [3. 51 - 69%] [4. 70 - 79%] [5. 80 - 89%] [6. 90 - 100%] [7. INVALID ANSWER] [8. DON'T KNOW] [9. REFUSED] I: COL 121 7 LOC 10 9 1 HLA .3 NUM 1 9 IF (ANS > 6) IF (ANS < 8) BEEP REASK ENDIF ENDIF H: Refer to the most recent semester in which they took the course. "do" - Include both those attempted and those completed. Refers only to those done outside of class (not problems assigned to be worked on during class). ENDHELP Q:QB9 T: 5 4 What percentage of the time did you ATTEMPT your homework problems WITHIN THE WEEK they were assigned? *IWER: Do not read response options unless probing T: 10 4 [1. 0% - Never] [2. 1 - 50% of the time] [3. 51 - 69% of the time] [4. 70 - 79% of the time] [5. 80 - 89% of the time] [6. 90 - 100% of the time] [7. INVALID ANSWER] [8. DON'T KNOW] [9. REFUSED] I: COL 121 8 LOC 10 9 1 HLA .3 NUM 1 9 IF (ANS > 6) IF (ANS < 8) BEEP REASK ENDIF
147
ENDIF H: Refer to the most recent semester in which they took the course. ENDHELP Q:QB10 T: 5 4 What percentage of the homework problems did you COMPLETE BEFORE the next CLASS SESSION? *IWER: Do not read response options unless probing T: 10 4 [1. 0% - Never] [2. 1 - 50% of the time] [3. 51 - 69% of the time] [4. 70 - 79% of the time] [5. 80 - 89% of the time] [6. 90 - 100% of the time] [7. INVALID ANSWER] [8. DON'T KNOW] [9. REFUSED] I: COL 121 8 LOC 10 9 1 HLA .3 NUM 1 9 IF (ANS > 6) IF (ANS < 8) BEEP REASK ENDIF ENDIF H: Refer to the most recent semester in which they took the course. ENDHELP Q:QB11 T: 5 4 What percentage of the homework problems did you COMPLETE BEFORE the next TEST or EXAM? *IWER: Do not read response options unless probing T: 10 4 [1. 0% - Never] [2. 1 - 50% of the time] [3. 51 - 69% of the time] [4. 70 - 79% of the time] [5. 80 - 89% of the time] [6. 90 - 100% of the time] [7. INVALID ANSWER] [8. DON'T KNOW] [9. REFUSED] I: COL 121 8 LOC 10 9 1 HLA .3 NUM 1 9
148
IF (ANS > 6) IF (ANS < 8) BEEP REASK ENDIF ENDIF H: Refer to the most recent semester in which they took the course. ENDHELP Q:QB12 T: 5 4 How many times did you contact your INSTRUCTOR for help during OFFICE HOURS? *IWER: Do not read response options unless probing T: 10 4 [1. 0] [2. 1-2] [3. 3-4] [4. 5-6] [5. 7-8] [6. 9-10] [7. More than 10] [8. DON'T KNOW] [9. REFUSED] I: COL 121 8 LOC 10 9 1 HLA .3 NUM 1 9 H: Refer to the most recent semester in which they took the course. This would include TA's. Appointments count. ENDHELP Q:QB13 T: 5 4 How many times did you contact your INSTRUCTOR for help by E-MAIL or ON-LINE open group discussion? *IWER: Do not read response options unless probing T: 10 4 [1. 0] [2. 1-2] [3. 3-4] [4. 5-6] [5. 7-8] [6. 9-10] [7. More than 10] [8. DON'T KNOW] [9. REFUSED] I: COL 121 8

149
LOC 10 9 1 HLA .3 NUM 1 9 H: Refer to the most recent semester in which they took the course. On-line open group discussion is active communication such as in a chat room or instant reply messaging. This includes TA's. ENDHELP Q:QB14 T: 5 4 How many times did you ASK QUESTIONS IN class during the semester? *IWER: Do not read response options unless probing T: 10 4 [1. 0] [2. 1-2] [3. 3-4] [4. 5-6] [5. 7-8] [6. 9-10] [7. More than 10] [8. DON'T KNOW] [9. REFUSED] I: COL 121 8 LOC 10 9 1 HLA .3 NUM 1 9 H: Refer to the most recent semester in which they took the course. ENDHELP Q:QB15 T: 5 4 How many times did you RECEIVE help or ATTEND REVIEW SESSIONS during the semester? *IWER: Do not read response options unless probing T: 10 4 [1. 0] [2. 1-2] [3. 3-4] [4. 5-6] [5. 7-8] [6. 9-10] [7. More than 10] [8. DON'T KNOW] [9. REFUSED] I: COL 121 8 LOC 10 9 1 HLA .3
150
NUM 1 9 H: Refer to the most recent semester in which they took the course. Does not include receiving help during office hours. Does not include receiving help during class. Does include help from classmates, TAs, tutors, and instructors AS LONG AS it was a structured setting and not a social event. ENDHELP Q:QB16 T: 5 4 How many times did you go to the MATH LEARNING RESOURCE CENTER (MLRC) for additional instruction? *IWER: Do not read response options unless probing T: 10 4 [1. 0] [2. 1-2] [3. 3-4] [4. 5-6] [5. 7-8] [6. 9-10] [7. More than 10] [8. DON'T KNOW] [9. REFUSED] I: COL 121 8 LOC 10 9 1 HLA .3 NUM 1 9 H: Refer to the most recent semester in which they took the course. ENDHELP Q:QB17 T: 5 4 How much time did you spend STUDYING the assigned sections BEFORE YOU started the homework problems? *IWER: Do not read response options unless probing T: 10 4 [1. Never studied] [2. Half-hour or less (1 - 30 minutes)] [3. Half-hour to 1 hour (31 minutes - 60 min)] [4. One hour to 1 ½ hours (61 minutes - 90 min)] [5. More than 1 ½ hours (91 minutes or more)] [6. INVALID ANSWER] [7. INVALID ANSWER] [8. DON'T KNOW] [9. REFUSED] I: COL 121 8 LOC 10 9 1 HLA .3

151
NUM 1 9 IF (ANS > 5)
152
Appendix G Frequently Asked Questions
Following are some commonly asked questions and the necessary information to provide an answer in your own words. � �I�ve never heard of your organization� or �Where did you say you were from?�
� Bureau for Social Research � Provides resources and services for assisting social science research
• Assists in research done by THE UNIVERSITY faculty and other public and private organizations
Client � College of Engineering, at the Large Midwestern University.
� �What is this about?�
� Calling College of Engineering students who enrolled in MATH 2144 Calculus I course in either Fall 2002 or Spring 2003.
Survey questions regarding • Your Math preparation in High school � Your experience in MATH 2144 Calculus I course at THE UNIVERSITY
� �Who will see this information?�
� The information is coded (turned into numbers) and then statistically analyzed � Results will be summarized and then given to the College of Engineering at the Large
Midwestern Univeristy. • Survey results used to assess students� services and needs in MATH 2144 Calculus I
course • Results will be used in reports, conference presentations and doctoral dissertation
without identifying subjects involved in the study � Identifying information, such as phone number, is kept separate from the interview in
a confidential file � Identifying information will be destroyed when study is complete
� �How did you get my telephone number?�
� List of phone numbers: Contact information For questions regarding the survey, contact: Steven Langstraat � Assessment Specialist �
(405) 744-5140 Dr. David R. Thompson � Associate Dean for Instruction and Extension,
(405) 744-5140 Mwarumba Mwavita-Evaluator �(405) 744-4637
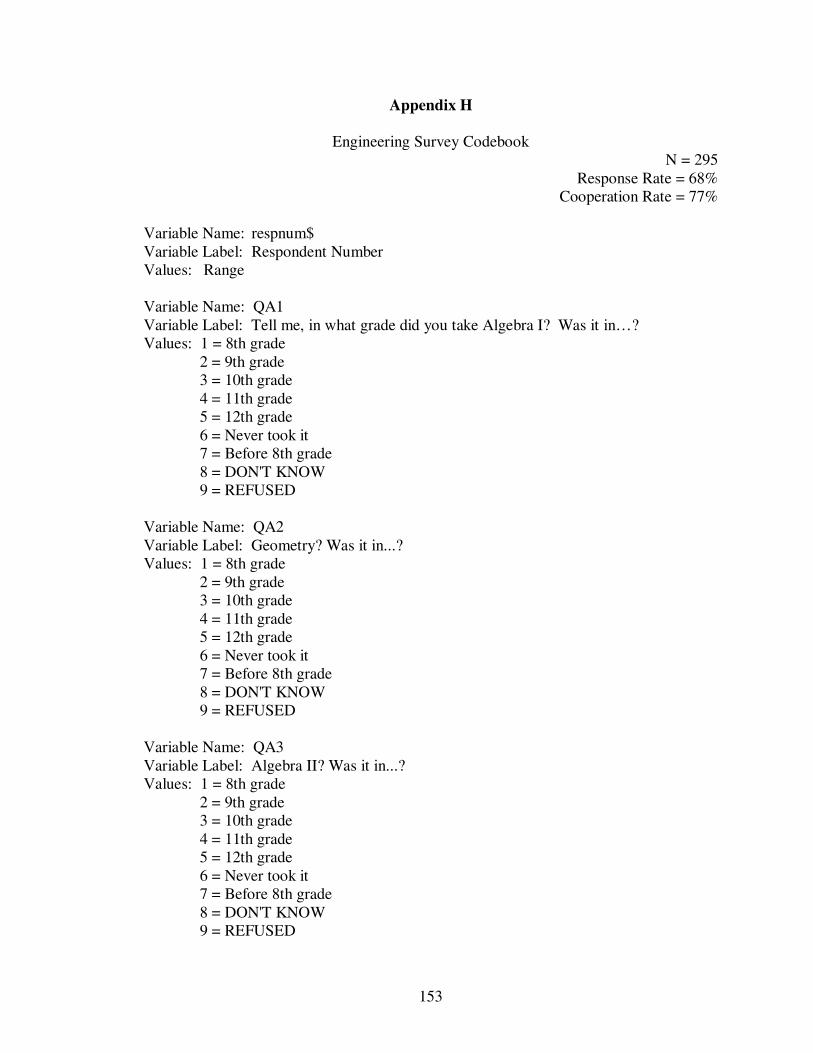
153
Appendix H
Engineering Survey Codebook N = 295
Response Rate = 68% Cooperation Rate = 77%
Variable Name: respnum$ Variable Label: Respondent Number Values: Range Variable Name: QA1 Variable Label: Tell me, in what grade did you take Algebra I? Was it in�? Values: 1 = 8th grade
2 = 9th grade 3 = 10th grade 4 = 11th grade 5 = 12th grade 6 = Never took it 7 = Before 8th grade 8 = DON'T KNOW
9 = REFUSED
Variable Name: QA2 Variable Label: Geometry? Was it in...? Values: 1 = 8th grade
2 = 9th grade 3 = 10th grade 4 = 11th grade 5 = 12th grade 6 = Never took it 7 = Before 8th grade 8 = DON'T KNOW
9 = REFUSED Variable Name: QA3 Variable Label: Algebra II? Was it in...? Values: 1 = 8th grade
2 = 9th grade 3 = 10th grade 4 = 11th grade 5 = 12th grade 6 = Never took it 7 = Before 8th grade 8 = DON'T KNOW
9 = REFUSED
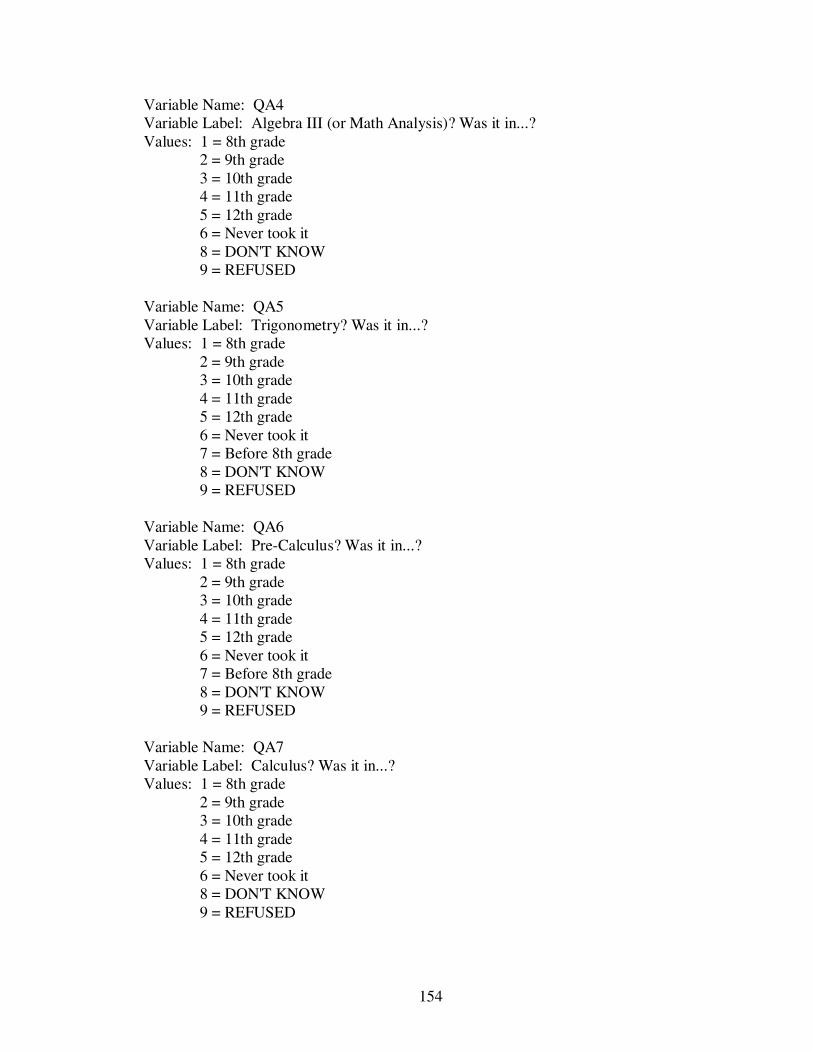
154
Variable Name: QA4 Variable Label: Algebra III (or Math Analysis)? Was it in...? Values: 1 = 8th grade
2 = 9th grade 3 = 10th grade 4 = 11th grade 5 = 12th grade 6 = Never took it 8 = DON'T KNOW
9 = REFUSED Variable Name: QA5 Variable Label: Trigonometry? Was it in...? Values: 1 = 8th grade
2 = 9th grade 3 = 10th grade 4 = 11th grade 5 = 12th grade 6 = Never took it 7 = Before 8th grade 8 = DON'T KNOW
9 = REFUSED Variable Name: QA6 Variable Label: Pre-Calculus? Was it in...? Values: 1 = 8th grade
2 = 9th grade 3 = 10th grade 4 = 11th grade 5 = 12th grade 6 = Never took it 7 = Before 8th grade 8 = DON'T KNOW
9 = REFUSED Variable Name: QA7 Variable Label: Calculus? Was it in...? Values: 1 = 8th grade
2 = 9th grade 3 = 10th grade 4 = 11th grade 5 = 12th grade 6 = Never took it 8 = DON'T KNOW
9 = REFUSED
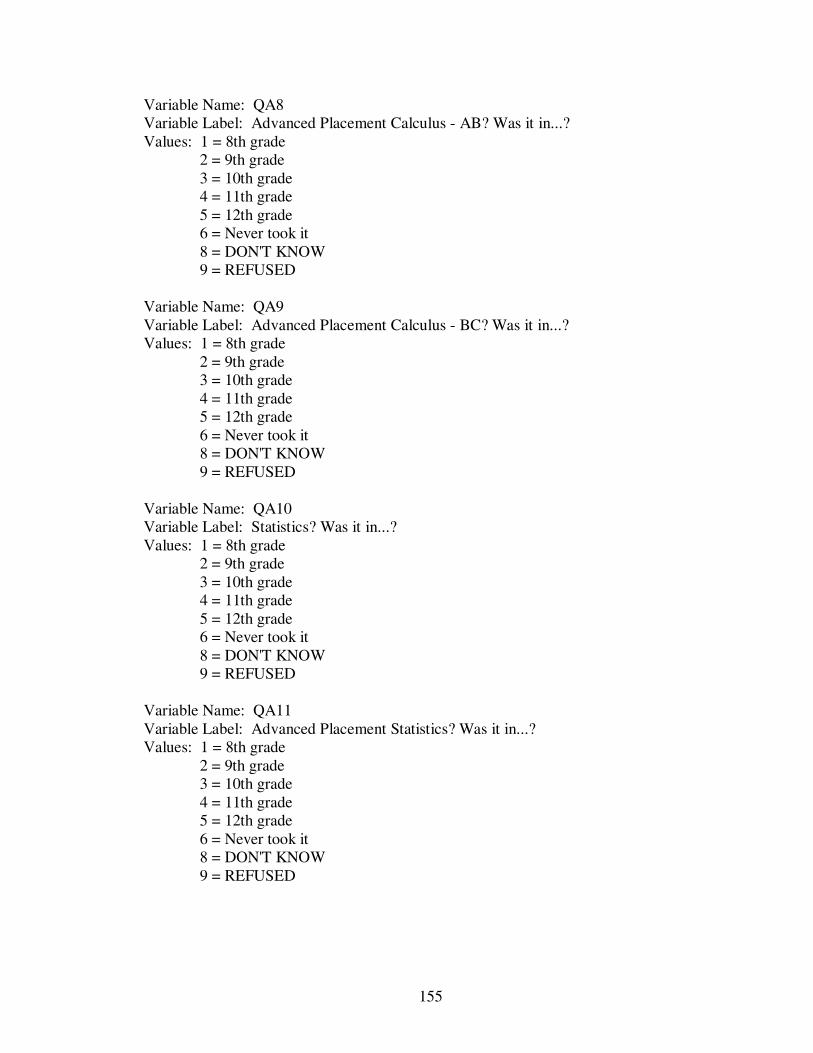
155
Variable Name: QA8 Variable Label: Advanced Placement Calculus - AB? Was it in...? Values: 1 = 8th grade
2 = 9th grade 3 = 10th grade 4 = 11th grade 5 = 12th grade 6 = Never took it 8 = DON'T KNOW
9 = REFUSED Variable Name: QA9 Variable Label: Advanced Placement Calculus - BC? Was it in...? Values: 1 = 8th grade
2 = 9th grade 3 = 10th grade 4 = 11th grade 5 = 12th grade 6 = Never took it 8 = DON'T KNOW
9 = REFUSED Variable Name: QA10 Variable Label: Statistics? Was it in...? Values: 1 = 8th grade
2 = 9th grade 3 = 10th grade 4 = 11th grade 5 = 12th grade 6 = Never took it 8 = DON'T KNOW
9 = REFUSED Variable Name: QA11 Variable Label: Advanced Placement Statistics? Was it in...? Values: 1 = 8th grade
2 = 9th grade 3 = 10th grade 4 = 11th grade 5 = 12th grade 6 = Never took it 8 = DON'T KNOW
9 = REFUSED
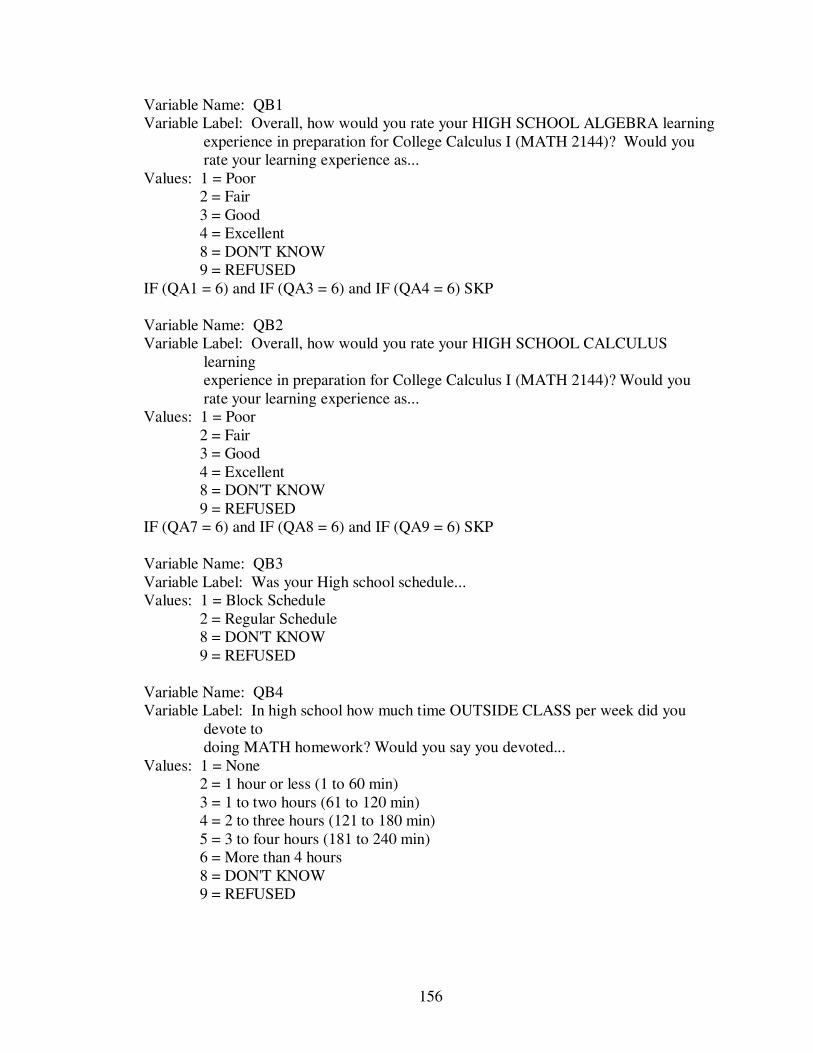
156
Variable Name: QB1 Variable Label: Overall, how would you rate your HIGH SCHOOL ALGEBRA learning
experience in preparation for College Calculus I (MATH 2144)? Would you rate your learning experience as...
Values: 1 = Poor 2 = Fair 3 = Good 4 = Excellent 8 = DON'T KNOW 9 = REFUSED
IF (QA1 = 6) and IF (QA3 = 6) and IF (QA4 = 6) SKP Variable Name: QB2 Variable Label: Overall, how would you rate your HIGH SCHOOL CALCULUS
learning experience in preparation for College Calculus I (MATH 2144)? Would you rate your learning experience as...
Values: 1 = Poor 2 = Fair 3 = Good 4 = Excellent 8 = DON'T KNOW 9 = REFUSED
IF (QA7 = 6) and IF (QA8 = 6) and IF (QA9 = 6) SKP Variable Name: QB3 Variable Label: Was your High school schedule... Values: 1 = Block Schedule
2 = Regular Schedule 8 = DON'T KNOW 9 = REFUSED
Variable Name: QB4 Variable Label: In high school how much time OUTSIDE CLASS per week did you
devote to doing MATH homework? Would you say you devoted...
Values: 1 = None 2 = 1 hour or less (1 to 60 min) 3 = 1 to two hours (61 to 120 min) 4 = 2 to three hours (121 to 180 min) 5 = 3 to four hours (181 to 240 min) 6 = More than 4 hours 8 = DON'T KNOW 9 = REFUSED
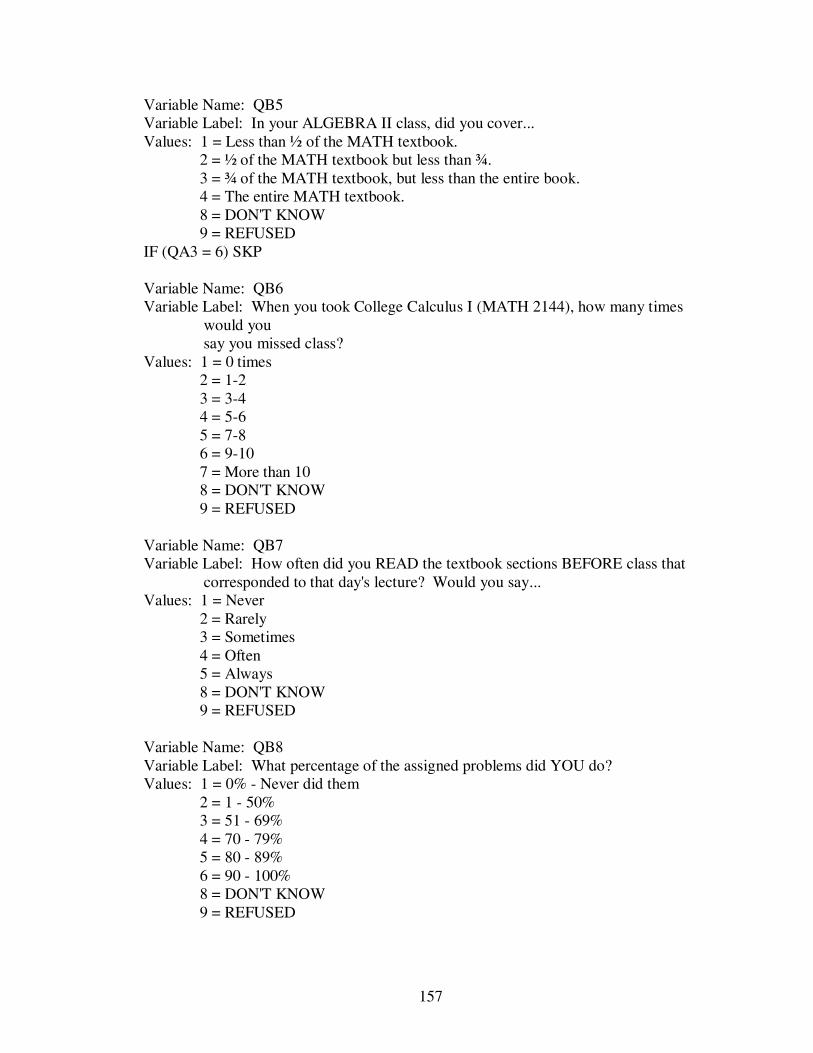
157
Variable Name: QB5 Variable Label: In your ALGEBRA II class, did you cover... Values: 1 = Less than ½ of the MATH textbook.
2 = ½ of the MATH textbook but less than ¾. 3 = ¾ of the MATH textbook, but less than the entire book. 4 = The entire MATH textbook. 8 = DON'T KNOW 9 = REFUSED
IF (QA3 = 6) SKP Variable Name: QB6 Variable Label: When you took College Calculus I (MATH 2144), how many times
would you say you missed class?
Values: 1 = 0 times 2 = 1-2 3 = 3-4 4 = 5-6 5 = 7-8 6 = 9-10 7 = More than 10 8 = DON'T KNOW 9 = REFUSED
Variable Name: QB7 Variable Label: How often did you READ the textbook sections BEFORE class that
corresponded to that day's lecture? Would you say... Values: 1 = Never
2 = Rarely 3 = Sometimes 4 = Often 5 = Always 8 = DON'T KNOW 9 = REFUSED
Variable Name: QB8 Variable Label: What percentage of the assigned problems did YOU do? Values: 1 = 0% - Never did them
2 = 1 - 50% 3 = 51 - 69% 4 = 70 - 79% 5 = 80 - 89% 6 = 90 - 100% 8 = DON'T KNOW 9 = REFUSED
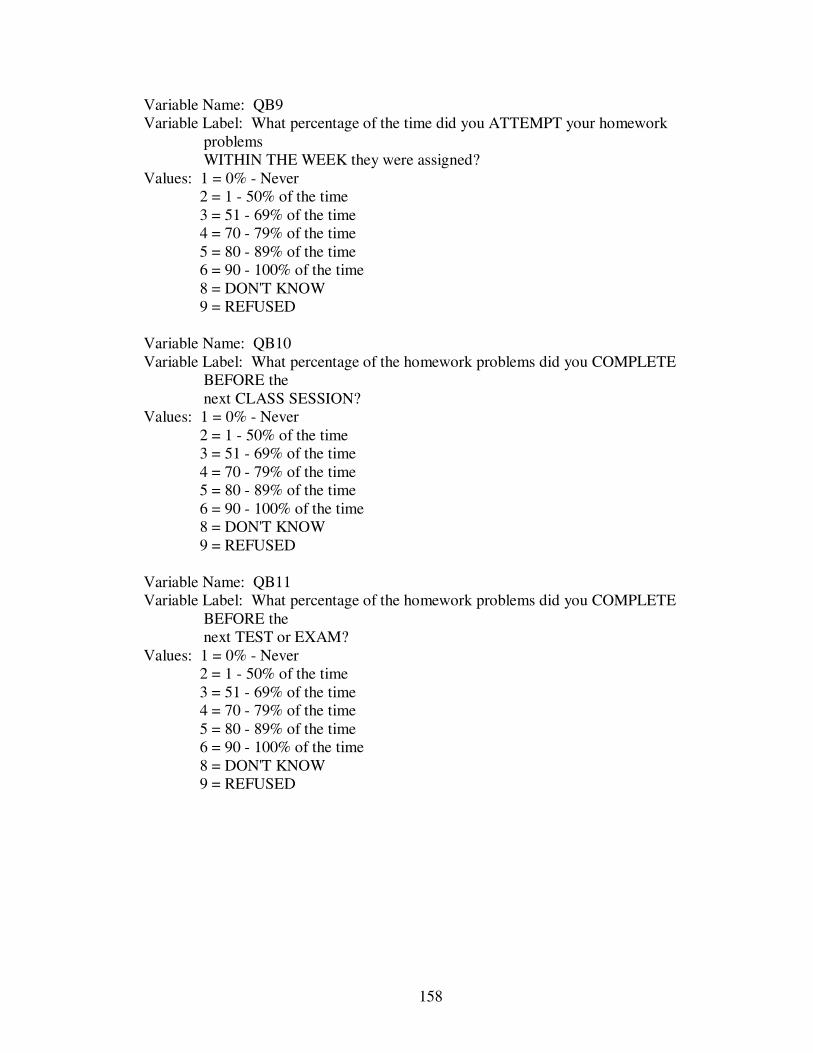
158
Variable Name: QB9 Variable Label: What percentage of the time did you ATTEMPT your homework
problems WITHIN THE WEEK they were assigned?
Values: 1 = 0% - Never 2 = 1 - 50% of the time 3 = 51 - 69% of the time 4 = 70 - 79% of the time 5 = 80 - 89% of the time 6 = 90 - 100% of the time 8 = DON'T KNOW 9 = REFUSED
Variable Name: QB10 Variable Label: What percentage of the homework problems did you COMPLETE
BEFORE the next CLASS SESSION?
Values: 1 = 0% - Never 2 = 1 - 50% of the time 3 = 51 - 69% of the time 4 = 70 - 79% of the time 5 = 80 - 89% of the time 6 = 90 - 100% of the time 8 = DON'T KNOW 9 = REFUSED
Variable Name: QB11 Variable Label: What percentage of the homework problems did you COMPLETE
BEFORE the next TEST or EXAM?
Values: 1 = 0% - Never 2 = 1 - 50% of the time 3 = 51 - 69% of the time 4 = 70 - 79% of the time 5 = 80 - 89% of the time 6 = 90 - 100% of the time 8 = DON'T KNOW 9 = REFUSED
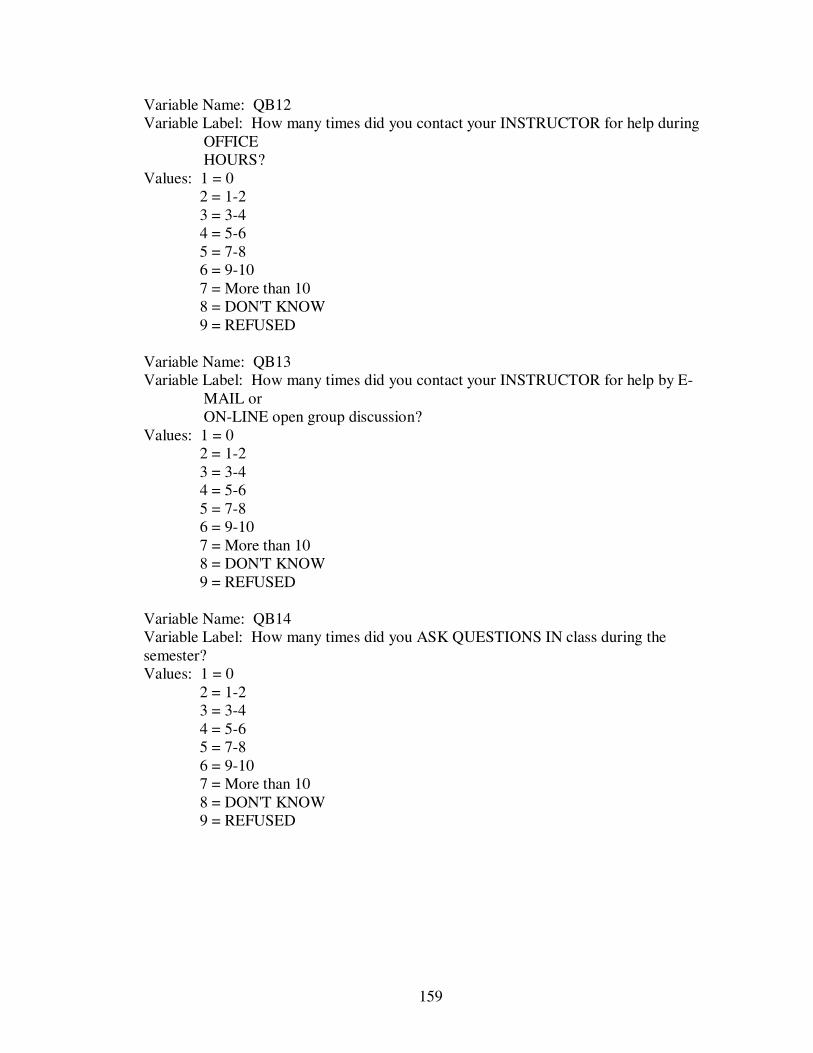
159
Variable Name: QB12 Variable Label: How many times did you contact your INSTRUCTOR for help during
OFFICE HOURS?
Values: 1 = 0 2 = 1-2 3 = 3-4 4 = 5-6 5 = 7-8 6 = 9-10 7 = More than 10 8 = DON'T KNOW 9 = REFUSED
Variable Name: QB13 Variable Label: How many times did you contact your INSTRUCTOR for help by E-
MAIL or ON-LINE open group discussion?
Values: 1 = 0 2 = 1-2 3 = 3-4 4 = 5-6 5 = 7-8 6 = 9-10 7 = More than 10 8 = DON'T KNOW 9 = REFUSED
Variable Name: QB14 Variable Label: How many times did you ASK QUESTIONS IN class during the semester? Values: 1 = 0
2 = 1-2 3 = 3-4 4 = 5-6 5 = 7-8 6 = 9-10 7 = More than 10 8 = DON'T KNOW 9 = REFUSED
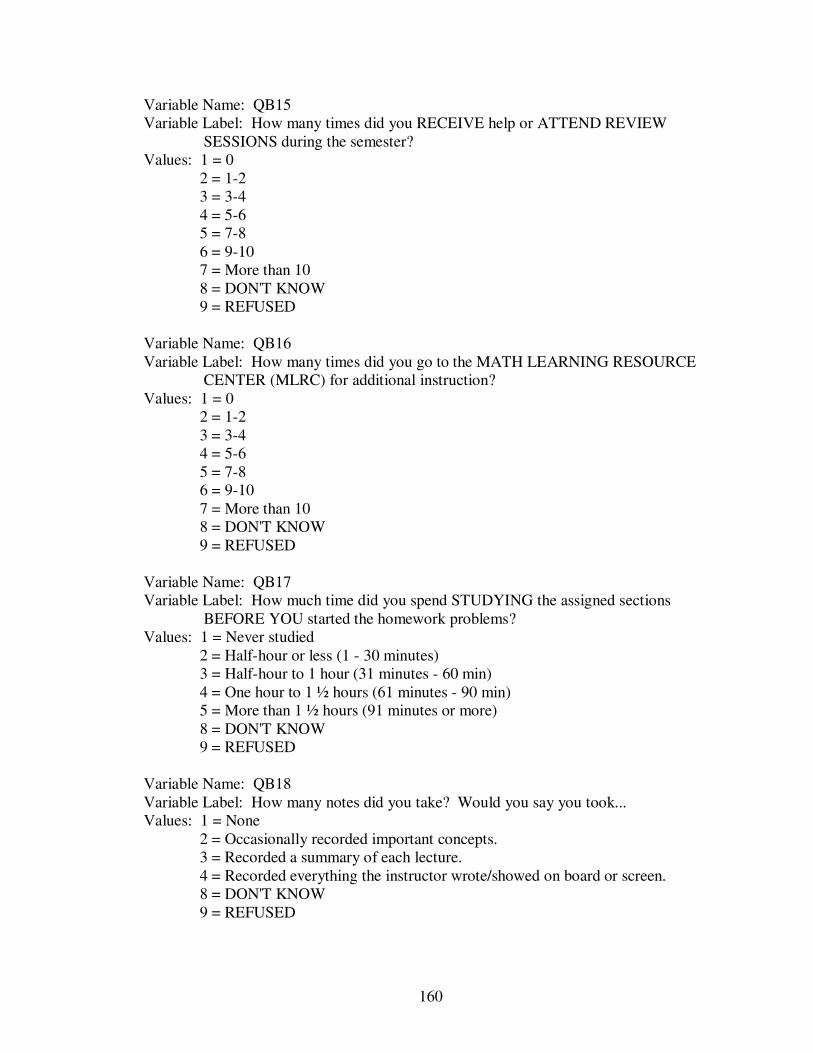
160
Variable Name: QB15 Variable Label: How many times did you RECEIVE help or ATTEND REVIEW
SESSIONS during the semester? Values: 1 = 0
2 = 1-2 3 = 3-4 4 = 5-6 5 = 7-8 6 = 9-10 7 = More than 10 8 = DON'T KNOW 9 = REFUSED
Variable Name: QB16 Variable Label: How many times did you go to the MATH LEARNING RESOURCE
CENTER (MLRC) for additional instruction? Values: 1 = 0
2 = 1-2 3 = 3-4 4 = 5-6 5 = 7-8 6 = 9-10 7 = More than 10 8 = DON'T KNOW 9 = REFUSED
Variable Name: QB17 Variable Label: How much time did you spend STUDYING the assigned sections
BEFORE YOU started the homework problems? Values: 1 = Never studied
2 = Half-hour or less (1 - 30 minutes) 3 = Half-hour to 1 hour (31 minutes - 60 min) 4 = One hour to 1 ½ hours (61 minutes - 90 min) 5 = More than 1 ½ hours (91 minutes or more) 8 = DON'T KNOW 9 = REFUSED
Variable Name: QB18 Variable Label: How many notes did you take? Would you say you took... Values: 1 = None
2 = Occasionally recorded important concepts. 3 = Recorded a summary of each lecture. 4 = Recorded everything the instructor wrote/showed on board or screen. 8 = DON'T KNOW 9 = REFUSED
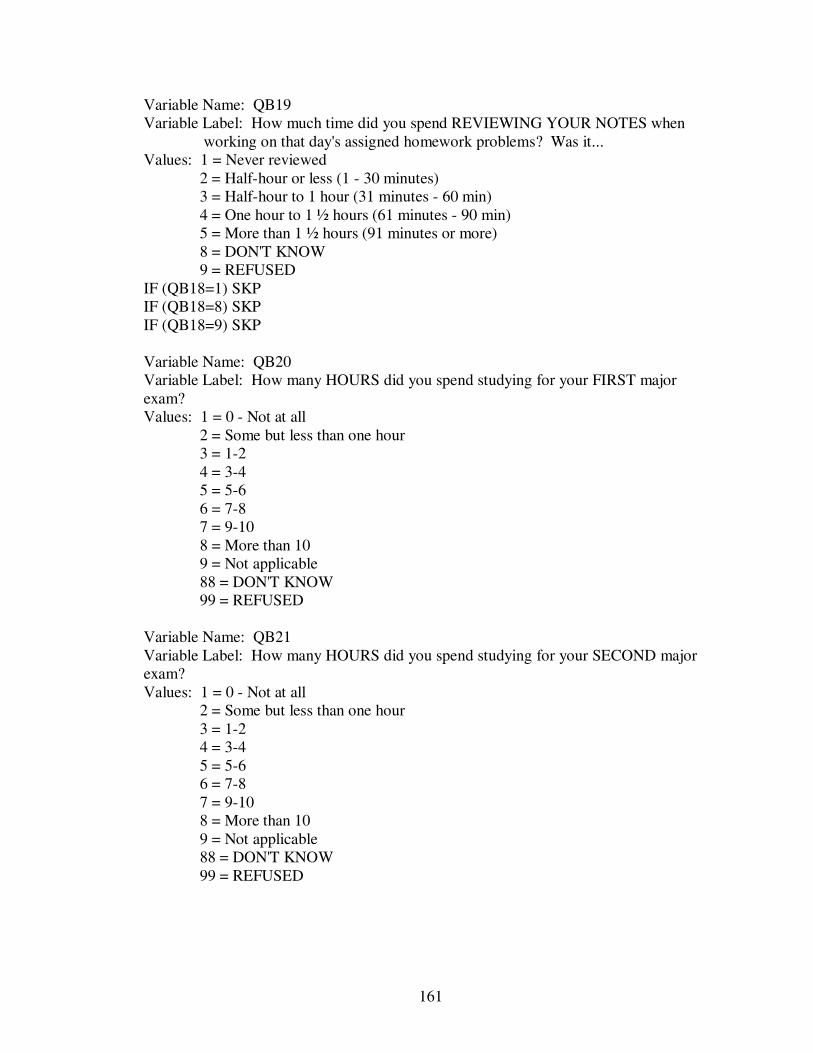
161
Variable Name: QB19 Variable Label: How much time did you spend REVIEWING YOUR NOTES when
working on that day's assigned homework problems? Was it... Values: 1 = Never reviewed
2 = Half-hour or less (1 - 30 minutes) 3 = Half-hour to 1 hour (31 minutes - 60 min) 4 = One hour to 1 ½ hours (61 minutes - 90 min) 5 = More than 1 ½ hours (91 minutes or more) 8 = DON'T KNOW 9 = REFUSED
IF (QB18=1) SKP IF (QB18=8) SKP IF (QB18=9) SKP Variable Name: QB20 Variable Label: How many HOURS did you spend studying for your FIRST major exam? Values: 1 = 0 - Not at all
2 = Some but less than one hour 3 = 1-2 4 = 3-4 5 = 5-6 6 = 7-8 7 = 9-10 8 = More than 10 9 = Not applicable 88 = DON'T KNOW 99 = REFUSED
Variable Name: QB21 Variable Label: How many HOURS did you spend studying for your SECOND major exam? Values: 1 = 0 - Not at all
2 = Some but less than one hour 3 = 1-2 4 = 3-4 5 = 5-6 6 = 7-8 7 = 9-10 8 = More than 10 9 = Not applicable 88 = DON'T KNOW 99 = REFUSED
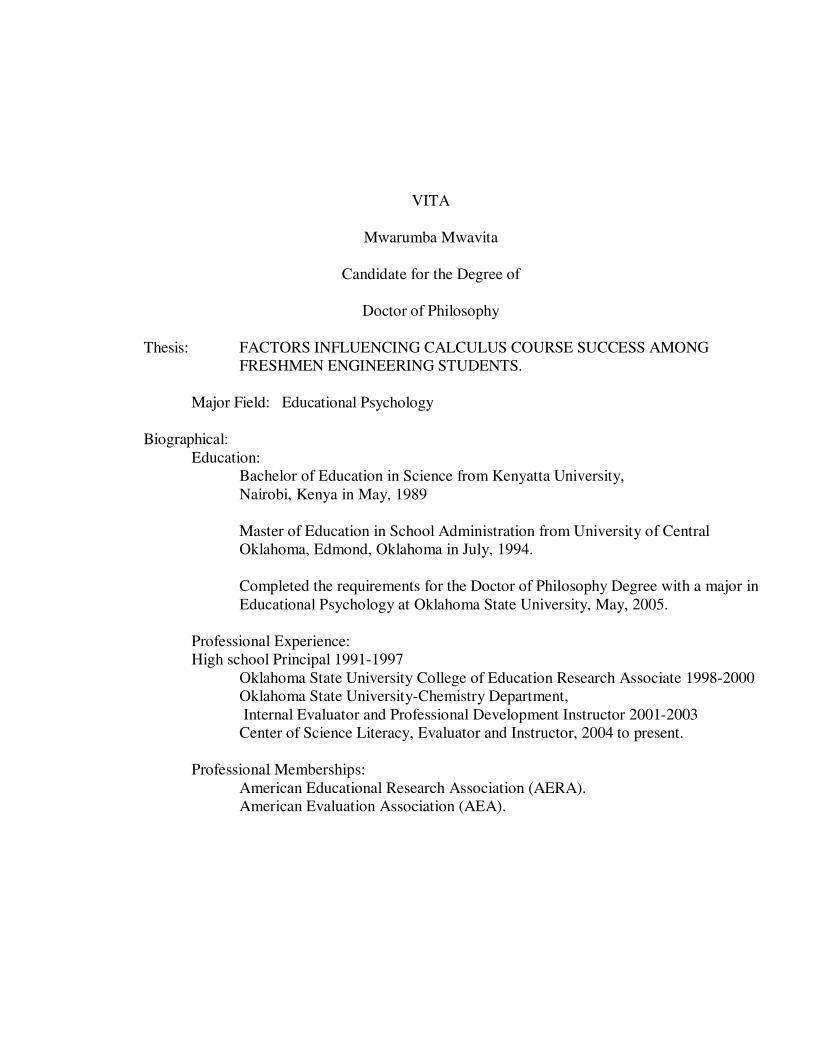
VITA
Mwarumba Mwavita
Candidate for the Degree of
Doctor of Philosophy
Thesis: FACTORS INFLUENCING CALCULUS COURSE SUCCESS AMONG FRESHMEN ENGINEERING STUDENTS.
Major Field: Educational Psychology
Biographical:
Education: Bachelor of Education in Science from Kenyatta University, Nairobi, Kenya in May, 1989 Master of Education in School Administration from University of Central Oklahoma, Edmond, Oklahoma in July, 1994. Completed the requirements for the Doctor of Philosophy Degree with a major in Educational Psychology at Oklahoma State University, May, 2005.
Professional Experience: High school Principal 1991-1997
Oklahoma State University College of Education Research Associate 1998-2000 Oklahoma State University-Chemistry Department, Internal Evaluator and Professional Development Instructor 2001-2003 Center of Science Literacy, Evaluator and Instructor, 2004 to present.
Professional Memberships:
American Educational Research Association (AERA). American Evaluation Association (AEA).
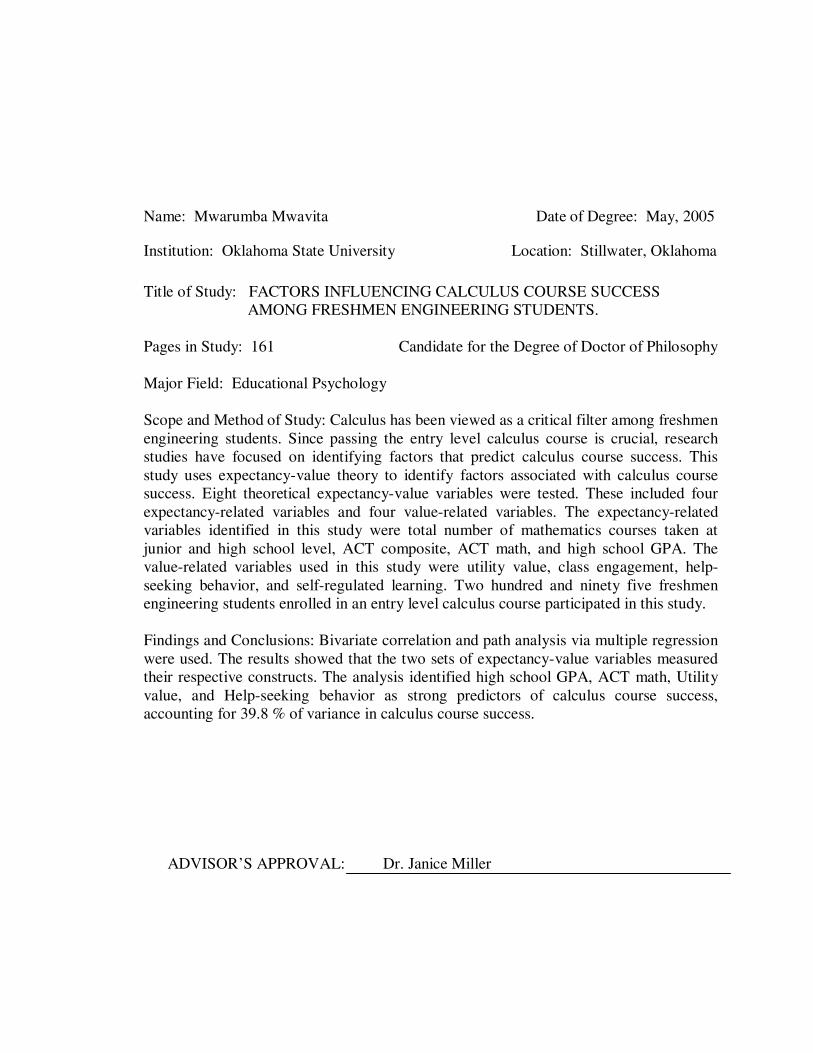
Name: Mwarumba Mwavita Date of Degree: May, 2005
Institution: Oklahoma State University Location: Stillwater, Oklahoma
Title of Study: FACTORS INFLUENCING CALCULUS COURSE SUCCESS AMONG FRESHMEN ENGINEERING STUDENTS. Pages in Study: 161 Candidate for the Degree of Doctor of Philosophy Major Field: Educational Psychology
Scope and Method of Study: Calculus has been viewed as a critical filter among freshmen engineering students. Since passing the entry level calculus course is crucial, research studies have focused on identifying factors that predict calculus course success. This study uses expectancy-value theory to identify factors associated with calculus course success. Eight theoretical expectancy-value variables were tested. These included four expectancy-related variables and four value-related variables. The expectancy-related variables identified in this study were total number of mathematics courses taken at junior and high school level, ACT composite, ACT math, and high school GPA. The value-related variables used in this study were utility value, class engagement, help-seeking behavior, and self-regulated learning. Two hundred and ninety five freshmen engineering students enrolled in an entry level calculus course participated in this study. Findings and Conclusions: Bivariate correlation and path analysis via multiple regression were used. The results showed that the two sets of expectancy-value variables measured their respective constructs. The analysis identified high school GPA, ACT math, Utility value, and Help-seeking behavior as strong predictors of calculus course success, accounting for 39.8 % of variance in calculus course success.
ADVISOR�S APPROVAL: Dr. Janice Miller


![Factors influencing[1]](https://img.pdfslide.us/doc/110x75/54be1c8d4a795948378b4597/factors-influencing1.jpg)