Embed Size (px)
Citation preview
CHALLENGES IN IMPLEMENTING
THE INA CBG
dr. Andi Afdal Abdullah, MBA, AAK
Deputy Director of Research and Development
Presented at the 2018 InaHEA
Jakarta, November 1, 2018
2
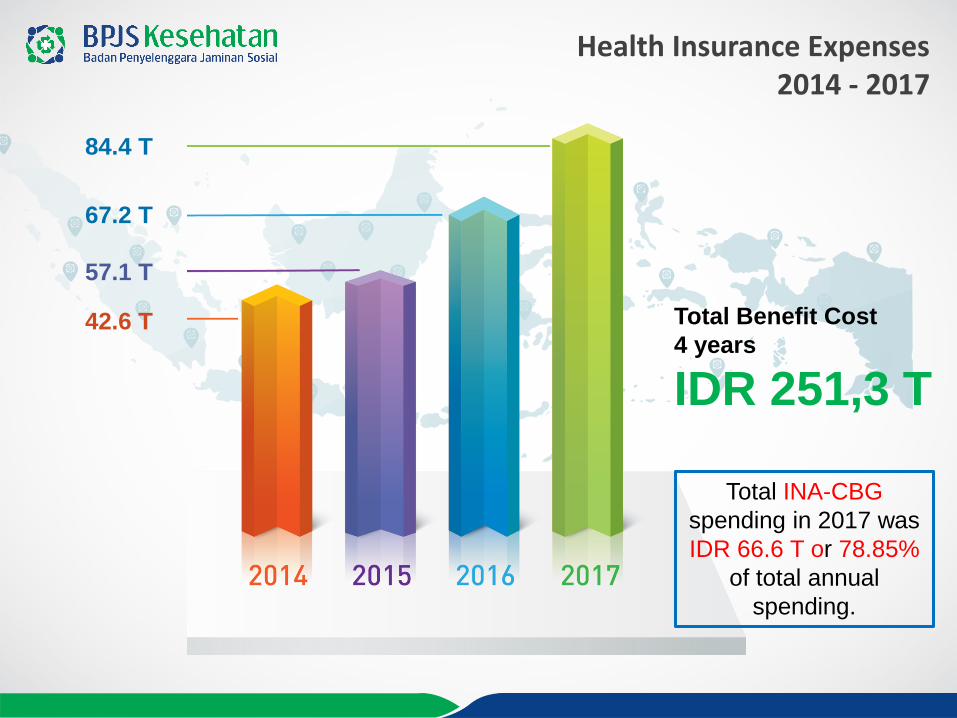
Health Insurance Expenses 2014 - 2017
42.6 T
57.1 T
67.2 T
84.4 T
Total Benefit Cost
4 years
IDR 251,3 T
Total INA-CBG
spending in 2017 was
IDR 66.6 T or 78.85%
of total annual
spending.

3
IMPLEMENTING HEALTH ECONOMICS IN EFFECTIVE FINANCING
FUNDSCARCE and
LIMITED
NEEDs/WANTsUNLIMITED
When fund is limited, we are forced
to do “trade-offs” or a compromise,
by:
Rationing budgeting
Prioritizing what medical
treatments do we need the
most?
THUS, DESIGNING BENEFIT
PACKAGE AND PURCHASING POLICY
TO MAKE OPTIMUM USE OF THE
LIMITED RESOURCES
Act No 40/2004 article 22:
JKN provides insurance and
financial protection for medical
necessities
JKN offers comprehensive
benefits
But benefit packages should be
adjusted to the people’s needs
and ability to pay of BPJS
The future of benefit
package design will
depends of ATP of BPJS
Kesehatan.
The ATP is strongly
related to price setting
and payment systems,
i.e the INA-CBG

4
THE INA-CBG CHALLENGES
Almost 5 years into implementation
Providers: resistance coping (hopefully) acceptance
Despite, the system is not quite well understood by providers (and other stakeholders)
• How the tariff is developed
• The logic of the grouper
• How much is HBR, casemix index, adjustment rate
Things to ponder:
Have we established a quality tracking system to prevent caveats, prevent unnecessary admissions
and readmission?
Have we improved the coding systems which fully utilize the ICD 10 and ICD 9-CM?
Have we improved the costing system so only robust and high quality data are used to develop the
tariff?
After almost 5 years in collecting and analyzing data, have we tried to improve the grouper and the
system to accommodate the local needs developing Indonesian own grouper?
Two main factors:
1. Capacity to develop and improve the groupers and the system
2. Political will of stakeholders

5
1. Low incentives to improve
performance• The price settings are in favor of hospital classes, not their performance nor
their compliance to standard
• Low incentive to prevent and deter the caveat of INA-CBG (bloody discharge,
readmissions, upcoding, etc)
• No national consensus of readmission (the interval of rehospitalization) and no
payment reduction mechanism toward the cases
43%
43%
13%
1%
Credentialing Compliance of Hospitals
<75% 75% s.d <86% 86% s.d <96% 96%-100%
These hospitals have the same
HBR if they belong to the same
class, regardless of whether
they have facilities or doctors
according to the standard

6
2. Low incentives to improve efficiency
• Low incentive to develop clinical pathway and/or compliance to clinical guidelines (if
any)
– The example of unintended effects:
• the case of neonates which are paid regardless of the resource consumption.
• Variations in providing care which way is the most effective and efficient considering the
available resources in the hospitals?
• Notes: the availability of clinical pathway in the hospitals is one of the consideration in credentialing
but there in no scheme to make sure that the hospitals comply with the CP.
• INA CBG is quite inefficient for outpatient admissions*
– Dumping to another hospitals due to low tariff
– Outpatient admitted to inpatients
– Recommendations*• Risk sharing with primary providers to reduce unnecessary referral for chronic diseases
• Tariff adjustment for high readmission rates groups (chronic groups, wound care, teeth care, etc)
• Urgent need for indicators to measure performance in outpatient setting such as : waiting time, availability of drugs, no illegal cost
sharing,
• Has costing data of the hospitals been assessed for efficiency? The need to assess of
the quality of data is not just taking out the outliers, but more to make sure that the
hospitals have done their best in improving the spending
*Kajian Sistem Pembayaran di RJTL selain INA-CBG, KP-MAK UGM
7
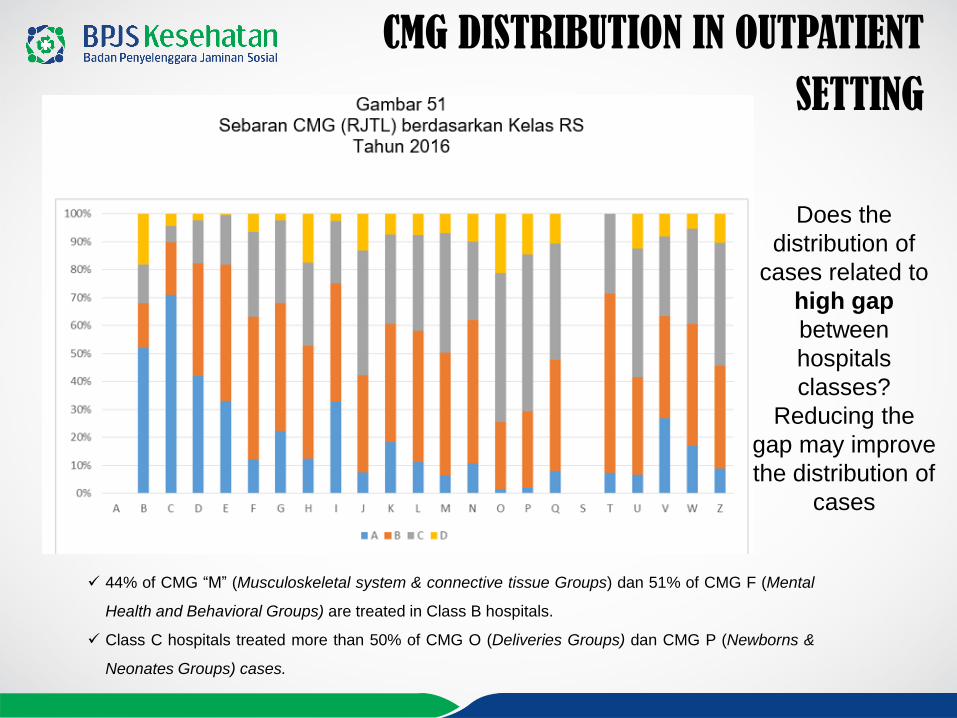
CMG DISTRIBUTION IN OUTPATIENT
SETTING
44% of CMG “M” (Musculoskeletal system & connective tissue Groups) dan 51% of CMG F (Mental
Health and Behavioral Groups) are treated in Class B hospitals.
Class C hospitals treated more than 50% of CMG O (Deliveries Groups) dan CMG P (Newborns &
Neonates Groups) cases.
Does the
distribution of
cases related to
high gap
between
hospitals
classes?
Reducing the
gap may improve
the distribution of
cases

8
THE CASES of NEONATES PRICE SETTING and CODING INDICATION of INEFFICIENCY?
2015 sd 2017
-
5,000
10,000
15,000
20,000
25,000
30,000
Jan
-15
Feb
-15
Mar
-15
Ap
r-1
5
May
-15
Jun
-15
Jul-
15
Au
g-1
5
Sep
-15
Oct
-15
No
v-1
5
De
c-1
5
Jan
-16
Feb
-16
Mar
-16
Ap
r-1
6
May
-16
Jun
-16
Jul-
16
Au
g-1
6
Sep
-16
Oct
-16
No
v-1
6
De
c-1
6
Jan
-17
Feb
-17
Mar
-17
Ap
r-1
7
May
-17
Jun
-17
Jul-
17
Au
g-1
7
Sep
-17
Oct
-17
No
v-1
7
De
c-1
7
Jan
-18
The number of cases increase
by 87%
The cost increase by 125%
The number of cases increase by
82%
The cost increase by 177%
The number of cases increase by
241%
The cost increase by 524%
THE CASES OF NEONATES:
Neonates from caesarean delivery are coded and submitted as
individual cases, regardless of the condition of the baby
The average annual increase in the number of neonates submitted
as individual cases = 85% .
The number of neonates cases in 2017 = 270.719
The cost for neonates increases 151% annually.
The cost for neonates in 2015, 2016 and 2017 are Rp 175 M, Rp
394 M dan Rp 1 Trillions, respectively
9
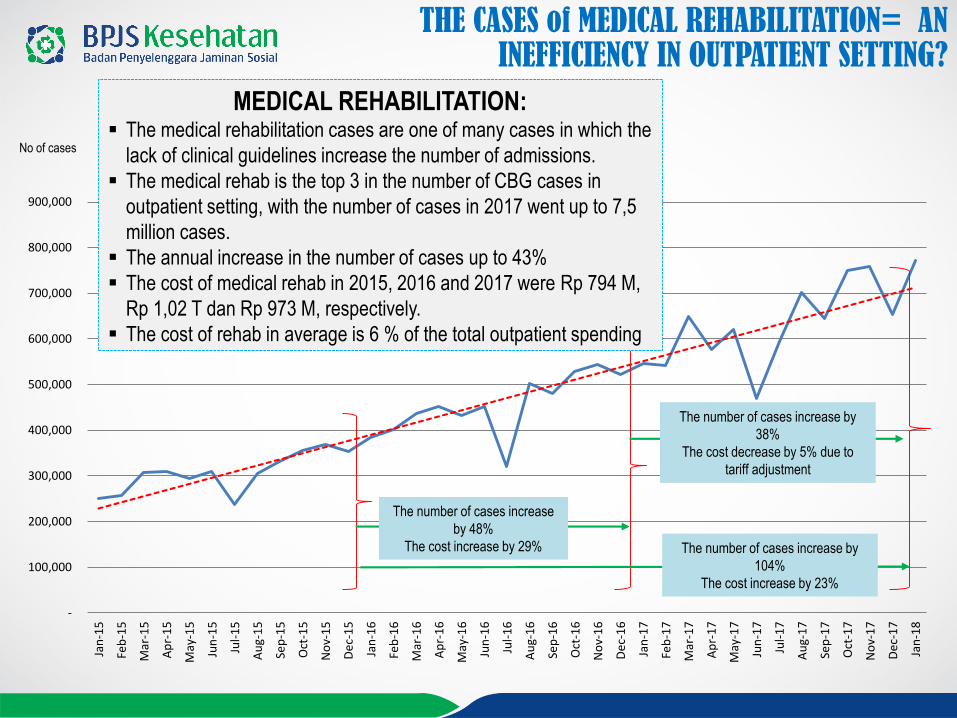
THE CASES of MEDICAL REHABILITATION= AN INEFFICIENCY IN OUTPATIENT SETTING?
-
100,000
200,000
300,000
400,000
500,000
600,000
700,000
800,000
900,000
Jan
-15
Feb
-15
Mar
-15
Ap
r-1
5
May
-15
Jun
-15
Jul-
15
Au
g-1
5
Sep
-15
Oct
-15
No
v-1
5
De
c-1
5
Jan
-16
Feb
-16
Mar
-16
Ap
r-1
6
May
-16
Jun
-16
Jul-
16
Au
g-1
6
Sep
-16
Oct
-16
No
v-1
6
De
c-1
6
Jan
-17
Feb
-17
Mar
-17
Ap
r-1
7
May
-17
Jun
-17
Jul-
17
Au
g-1
7
Sep
-17
Oct
-17
No
v-1
7
De
c-1
7
Jan
-18
No of cases
The number of cases increase
by 48%
The cost increase by 29%
The number of cases increase by
38%
The cost decrease by 5% due to
tariff adjustment
The number of cases increase by
104%
The cost increase by 23%
MEDICAL REHABILITATION: The medical rehabilitation cases are one of many cases in which the
lack of clinical guidelines increase the number of admissions.
The medical rehab is the top 3 in the number of CBG cases in
outpatient setting, with the number of cases in 2017 went up to 7,5
million cases.
The annual increase in the number of cases up to 43%
The cost of medical rehab in 2015, 2016 and 2017 were Rp 794 M,
Rp 1,02 T dan Rp 973 M, respectively.
The cost of rehab in average is 6 % of the total outpatient spending

10
OTHER CHALLENGES
a. National coding standard for the last years BPJS and MoH has
developed manual coding, but it’s still far from perfect
b. Utilization review
Lack of data in drugs utilization how much is spent on drugs?
All multiple admitted chronic diseases in outpatient belong to one group needs
effort to evaluate which diseases in a group
25 KODES CBGS RJTL TERBANYAK
BULAN PELAYANAN DESEMBER 2017 s.d AGUSTUS 2018
KODE CBGS NAMA CBGS KASUS BIAYA UC
Q-5-44-0 PENYAKIT KRONIS KECIL LAIN-LAIN 29,928,786 6,235,386,876,490 208,341
M-3-16-0 PROSEDUR THERAPI FISIK DAN PROSEDUR KECIL MUSKULOSKLETAL 3,893,331 456,751,776,400 117,316
N-3-15-0 PROSEDUR DIALISIS 3,038,046 2,642,208,017,900 869,706
Q-5-42-0 PENYAKIT AKUT KECIL LAIN-LAIN 2,012,142 389,555,305,000 193,602
Z-3-12-0 PROSEDUR REHABILITASI 1,754,330 277,486,731,700 158,172
Z-3-27-0 PERAWATAN LUKA 1,708,425 333,013,131,000 194,924
Z-3-25-0 PROSEDUR ULTRASOUND GINEKOLOGIK 1,381,845 429,619,415,200 310,903
Q-5-18-0 KONSULTASI ATAU PEMERIKSAAN LAIN-LAIN 1,308,986 182,825,010,000 139,669

11
The challenges of INA CBG can be overcame with several approaches by the government as the regulator and the hospitals
as providers
The hospital management adapt to the current
system
There is commitment to improve the quality of
claim reimbursement (better coding practice,
better documentation, better claim submissions)
There is commitment to improve quality control
and cost containment strategy (SOP, clinical
pathways, formulary, etc)
There is commitment to provide high quality
costing and coding data
There is commitment to constantly monitor and
evaluate performance
HOSPITALS
There is commitment to constantly monitor and
evaluate the fairness and adequacy of tariff,
including tariff-induced moral hazard.
Tariff adjustments should be derived from
strong data analysis
There is commitment to drive tariff adjustment
to more performance based.
There is commitment to constantly monitor and
evaluate the performance of hospitals that
provide costing and coding data.
Making optimum use of health technology
assessment
Reducing the tariff gap between hospital
classess
GOVERNMENT
RECOMENDATIONS
ANDDEVELOP A MIXED PROVIDER PAYMENTS TO BALANCE MULTIPLE
OBJECTIVES SUCH AS IMPROVING THE QUALITY OF CARE AND COST
EFFICIENCY -INA CBG + GLOBAL BUDGET

12
Thank You
Now Everything is in Your Hands!
www.bpjs-kesehatan.go.id

13
The Government Has Proclaimed The Roadmap to National Health Insurance(Jaminan Kesehatan Nasional) Until 2019
20192014
1. Started to operate
2. 121,6 millions of
participants (49% of
population)
3. Standard medical
benefits and non-medical
benefits according to
the class of treatment
4. Health facilities contracts
5. Established technical
regulations
6. Participants
satisfaction index 75%
7. Health facility
satisfaction index 65%
8. BPJS is managed in an
open, efficient and
accountable manner
1. Operational Sustainability2. 257,5 millions of participants
(100% of population)3. Medical benefits and non-
medical standard4. The number of health
facilities is sufficient5. Regulations are revised
regularly6. Participants satisfaction
index 85%7. Health facility satisfaction
index 80%
8. BPJS is managed in an open, efficient and accountable manner
2017
79,5%
187,9 millions
of people
201775,7%
(72,7%)
77.02%
Roadmap of JKN
As of October 1, 2018The number of participants was
203,284,896

14
77.02%
22.98%JKN-KIS Participants
203.284.896 PeopleAs of October 1, 2018*Dukcapil data source:1st Semester of 2018, Indonesia's population is 263,950,794
The Growth Rate of JKN-KIS Membership until
October 1, 2018
Comparison Of The Participants Number With Another Countries

15
FKTP includes Community Health Centers (Puskesmas), Doctor of Individual Practices, TNI / POLRI Clinics, Primary Clinics,Primary D Hospital and Individual Practical Dentist
18.437
19.969
20.708
Information:
Primary Care Health Facilities (FKTP)
22,681Source: BI Data of BPJS Kesehatan October 1, 2018
Source : Data of Deputy for PEO
Nu
mb
er o
f FK
TP
2,446Source: BI Data of BPJS Kesehatan October 1, 2018
Referral Health Facilities (FKRTL)
Source : Data of Deputy for PEO
Increase
The Growth of Contracted Health Facilities
2014-2017
Nu
mb
er o
f F
KR
TL

16
Amount of Contribution Income 2014 – 2017(In trillion)
2014 2015 2016 2017
40,72
52,69
67,40
74,25
Total contribution
4 years
IDR 235,06 T82,34 %
Escalation
Source : Data of Deputy for PEO

17
Health service utilization for 4 years at all levels of service
as much640,2
Of Utilization
millions
Source : Data of Deputy for PEO
Health Service Utilization
2014-2017
612.000Per Calendar Day
Or on average in 2017
2014
Dec Audited Rep.
2015
Dec Audited Rep.
2016
Dec Audited Rep.
2017
Dec Audited Rep.
252.877 401.198 487.123 612.055Total Utilization/
Calendar Day
Total Utilization/ Year
Utilization in Hospital
Inpatient Polyclinic
Utilization in Hospital
Outpatient Polyclinic
Utilization in FKTP
(Community Health Centers/ Doctor of
Individual Practices/ Primary Clinics)
92,3 Mil 146,7 Mil 177,8 Mil 223,4 Mil
4,2 Mil 6,3 Mil 7,6 Mil 8,7 Mil
21,3 Mil 39,8 Mil 49,3 Mil 64,4 Mil
66,8 Mil 100,6 Mil 120,9 Mil 150,3 Mil

18
Satisfaction Index 2017
Sample Respondent SurveyStratified random sampling method with a margin of error of 0.4%
126 Branch
Offices
238Cities/ DistrictsIn Indonesia
57.097Respondents at allService contact
PARTICIPANTS SATISFACTIONHIGH CATEGORY2017
Sample Respondent SurveyStratified random sampling method with a margin of error of 0.4%
126 Branch Offices
238Cities/ Districts
In Indonesia
4.766Health FacilitiesOf BPJS Kesehatan
SATISFACTION OF HEALTH FACILITIESHIGH CATEGORY2017
**) Benchmarks of various agencies' satisfaction results classification norms are calculated by internal PT SWASEMBADA Media Bisnis
*) Frontier Survey Results, 2017
** **
ACHIEVEMENT
Milions of People
ACHIEVEMENT
Milions of People Milions of People Milions of People