Embed Size (px)
Citation preview

Ch 12 Heart and Circulatory System
The Body’s Transport System
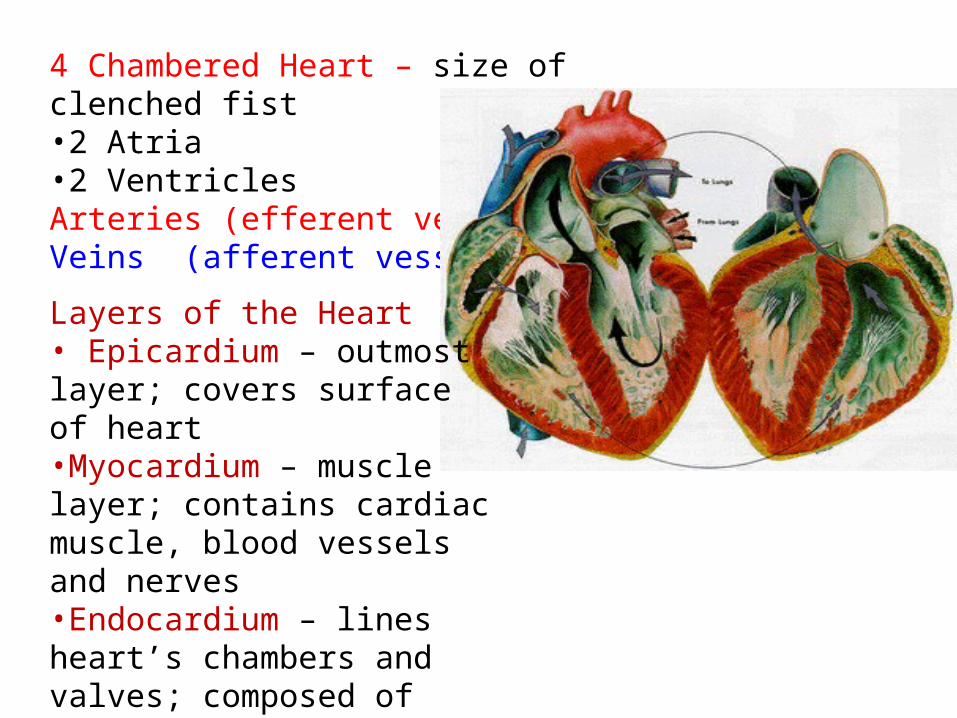
4 Chambered Heart – size of clenched fist•2 Atria•2 VentriclesArteries (efferent vessels)Veins (afferent vessels)
Layers of the Heart• Epicardium – outmost layer; covers surface of heart•Myocardium – muscle layer; contains cardiac muscle, blood vessels and nerves•Endocardium – lines heart’s chambers and valves; composed of simple squamous tissue

Two Circuits for Blood
• Pulmonary Circuit:
right side of heart; receives blood and transports de-oxygenated blood to lungs.
• Systemic Circuit:
left side of heart; supplies body with oxygenated blood.

Pericardium is the shiny covering around the heart.
Function:
•To reduce friction between surrounding surfaces as heart beats
• Protect the heart
• Anchor the surrounding structures

Characteristics of Heart MuscleIntercalated discsInvoluntaryStriatedOne nuclei per cell
Intercalated disks - allows heart to beat as one unit

Location of Heart

Structure of the Heart
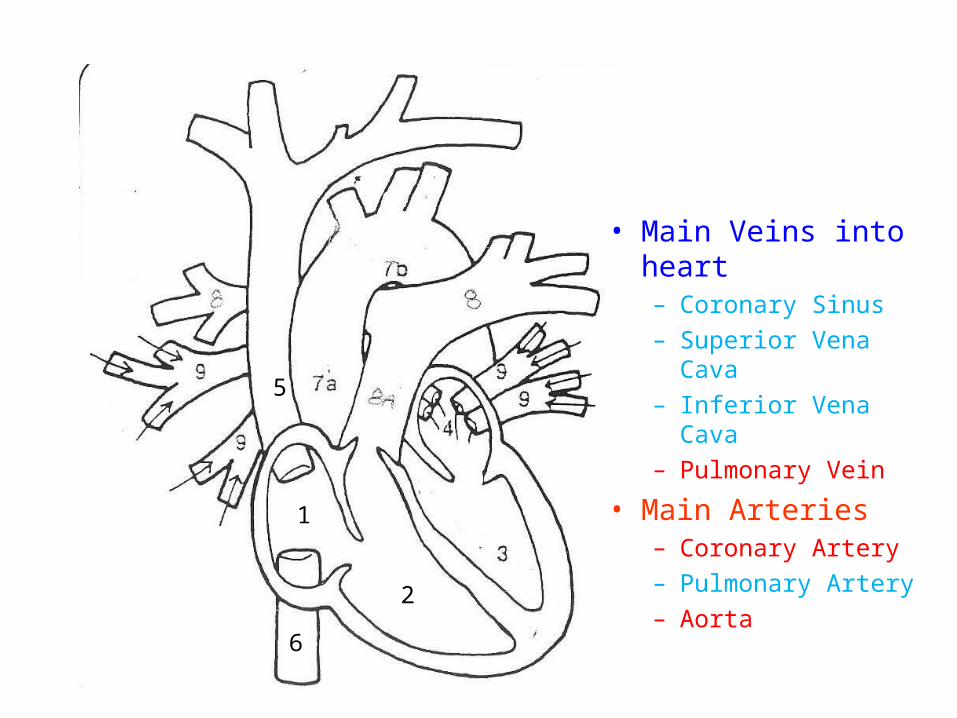
• Main Veins into heart– Coronary Sinus
– Superior Vena Cava
– Inferior Vena Cava
– Pulmonary Vein
• Main Arteries– Coronary Artery
– Pulmonary Artery
– Aorta
1
2
5
6
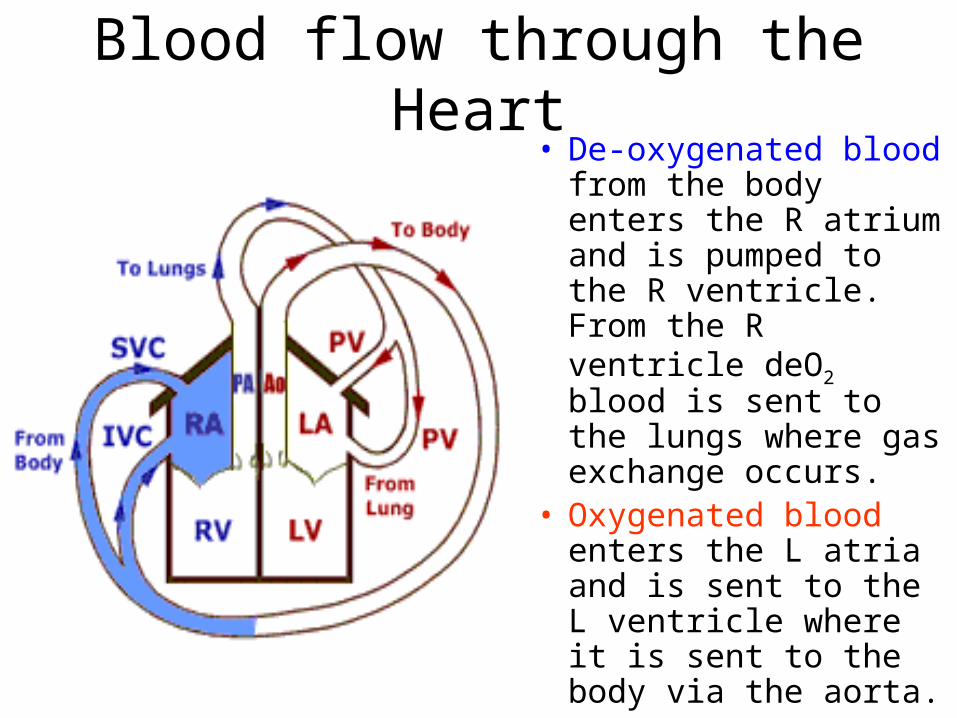
Blood flow through the Heart• De-oxygenated blood
from the body enters the R atrium and is pumped to the R ventricle. From the R ventricle deO2 blood is sent to the lungs where gas exchange occurs.
• Oxygenated blood enters the L atria and is sent to the L ventricle where it is sent to the body via the aorta.

Flow of blood through heart
1
1. Superior Vena Cava
2. Inferior Vena Cava
3. R. atrium
4. R. ventricle
5. Pulmonary trunk (artery)
6. Pulmonary vein
7. L. atrium
8. L. ventricle
9. AortaA. Brachiocephalic
B. L. Common Carotid
C. L. Subclavian
2
3
4
5 67
8
9
AB C


• Difference in myocardium thickness between R. ventricle and L. ventricle.
• Why?

Valves of the HeartAtrioventricular Valves
- one way valves; prevent back flow of blood
-chordae tendineae
- papillary muscles
• Tricuspid – 3 flaps– Found between R atrium and R.
ventricle
• Bicuspid (mitral) – 2 flaps– Found between L atrium and L.
ventricle

Anatomy of AV valvesOne-way valves
Atrioventricular valves
• Chordae tendineae
• Papillary muscles

Semilunar Valves
• Located in Pulmonary Artery and Aortic Artery
• 3 flaps• Prevents blood from
flowing back into ventricles

Valve position when ventricles relaxed
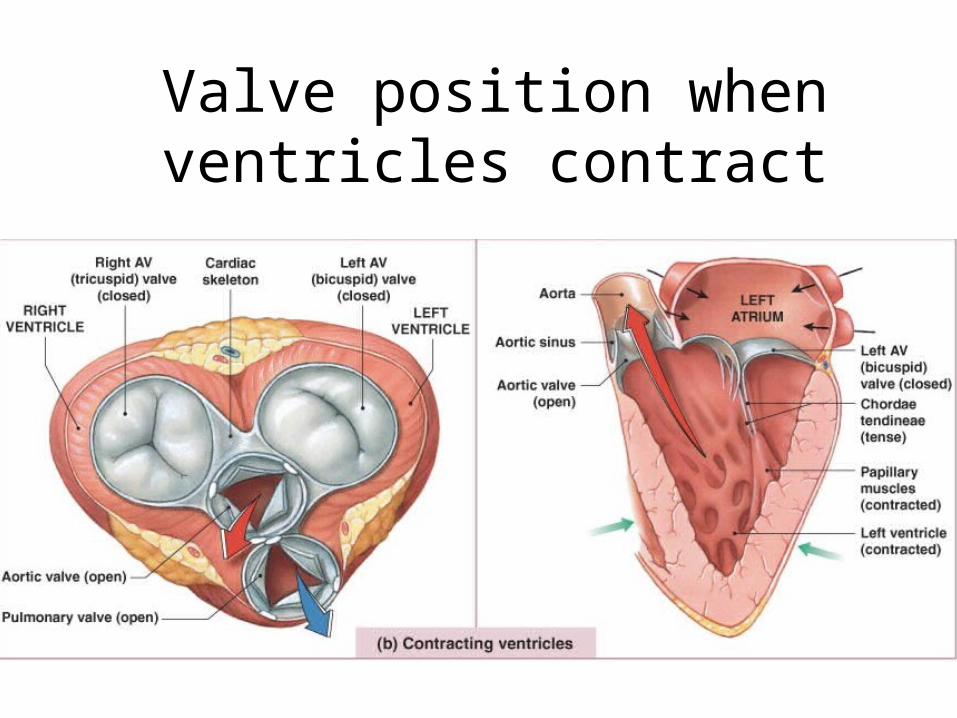
Valve position when ventricles contract

Heart Sounds
• Two sounds (lubb-dupp) associated with closing of heart valves– First sound occurs as AV valves close and
signifies beginning of systole– Second sound occurs when SL valves close at
the beginning of ventricular diastole
• Heart murmurs: abnormal heart sounds most often indicative of valve problems

Figure 18.19
Tricuspid valve sounds typically heard in right sternal margin of 5th intercostal space
Aortic valve sounds heard in 2nd intercostal space atright sternal margin
Pulmonary valvesounds heard in 2ndintercostal space at leftsternal margin
Mitral valve soundsheard over heart apex(in 5th intercostal space)in line with middle ofclavicle


Blood Flow and Valve Function

Cardiac Muscle ContractionRapid Depolarization: Threshold is reached along the
membrane.• Causes Na+ channels in the sarcolemma to open• Na+ enters cell reversing membrane potential from –90
mV to +30 mV (Na+ gates close)Plateau: Calcium channels open and Ca+2 enters
sarcoplasm• Ca+2 also is released from SR• Ca+2 surge prolongs the depolarization phase and delays
repolarization (excess + ions in cell)Repolarization: Ca+2 begin to close; K+ channels open and
K+ leaves the cell.

In Cardiac muscle, depolarization lasts longer. Thus cardiac muscle can’t increase tension with another impulse; tetanus doesn’t occur. Why is this important?

Heart Physiology: Electrical Events
• Intrinsic cardiac conduction system– A network of noncontractile (autorhythmic) cells
that initiate and distribute impulses to coordinate the depolarization and contraction of the heart
– Nodes – cells that are responsible for starting the impulse
– Conducting cells – distribute the impulse to the myocardium
– 1 % of the heart’s cardiac cells have this capability

• Internal Conduction System
• 1. Sinoatrial node• 2. AV node• 3. AV bundle or
Bundle of HIS• 4. R and L bundle
branches• 5. Purkinge fibers
Nodes – cluster of nervous tissue that begins an impulse.
5

1. Sinoatrial (SA) node (pacemaker)Generates impulses about 70-80 times/minute (sinus rhythm)Depolarizes faster than any other part of the myocardium

2. Atrioventricular (AV) node– Delays impulses approximately 0.1 second
• Allows for Atria to contract
– Depolarizes 40-60 times per minute in absence of SA node input

Conducting Cells
3. Atrioventricular (AV) bundle (bundle of His)
4. Right and left bundle branches– Two pathways in the interventricular
septum that carry the impulses toward the apex of the heart
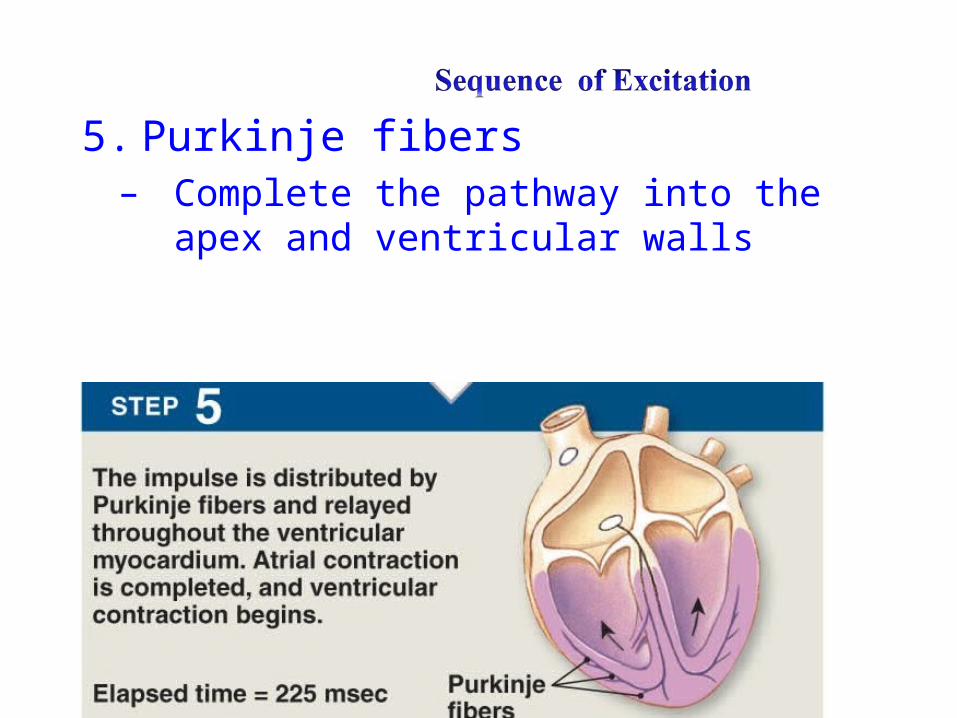
5. Purkinje fibers– Complete the pathway into the apex and
ventricular walls

Figure 18.14a
(a) Anatomy of the intrinsic conduction system showing the sequence of electrical excitation
Internodal pathway
Superior vena cavaRight atrium
Left atrium
Purkinje fibers
Inter-ventricularseptum
1 The sinoatrial (SA) node (pacemaker)generates impulses.
2 The impulsespause (0.1 s) at theatrioventricular(AV) node. The atrioventricular(AV) bundleconnects the atriato the ventricles.
4 The bundle branches conduct the impulses through the interventricular septum.
3
The Purkinje fibersdepolarize the contractilecells of both ventricles.
5

Electrocardiography• Electrocardiogram (ECG or EKG): a
composite of all the action potentials generated by nodal and contractile cells at a given time.
• Three waves1. P wave: depolarization of SA node
2. QRS complex: ventricular depolarization (AV node)
3. T wave: ventricular repolarization

Normal EKG has 3 distinct waves.
1st wave (P) - SA node fires
- Natural Pacemaker
- fires around 70-80 times/minute
The atria depolarize Impulse is being generated across R and L atria via diffusion.
.1s after P wave, atria contract.

• 2nd wave (QRS)• AV Node fires;
depolarization of ventricles.
• Q-R interval represents beginning of atrial repolarization and AV node firing; ventricles depolarize
• R-S interval represents beginning of ventricle contractions
• S-T End of Ventricular depolarization
AV node – back up pacemaker- Beats 40-60 times/minute- Impulse is delayed at bundle of HIS until Atria contract.

• 3rd Wave (T)• T wave repolarization
of ventricles• Ventricles return to
normal relaxed state. • In a healthy heart,
size, duration and timing of waves is consistent. Changes reveal a damage or diseased heart.

Figure 18.16
Sinoatrialnode
Atrioventricularnode
Atrialdepolarization
QRS complex
Ventriculardepolarization
Ventricularrepolarization
P-QInterval
S-TSegment
Q-TInterval

Figure 18.17, step 1
Atrial depolarization, initiated bythe SA node, causes the P wave.
P
R
T
QS
SA node Depolarization
Repolarization
1

Figure 18.17, step 2
Atrial depolarization, initiated bythe SA node, causes the P wave.
P
R
T
QS
SA node
AV node
With atrial depolarization complete,the impulse is delayed at the AV node.
P
R
T
QS
Depolarization
Repolarization
1
2

Figure 18.17, step 3
Atrial depolarization, initiated bythe SA node, causes the P wave.
P
R
T
QS
SA node
AV node
With atrial depolarization complete,the impulse is delayed at the AV node.
AV node depolarizes; Ventricular depolarization begins at apex, causing the QRS complex.Atrial repolarization occurs.
P
R
T
QS
P
R
T
QS
Depolarization
Repolarization
1
2
3

Figure 18.17, step 4
Ventricular depolarization iscomplete.
P
R
T
QS
Depolarization
Repolarization
4

Figure 18.17, step 5
Ventricular depolarization iscomplete.
Ventricular repolarization beginsat apex, causing the T wave.
P
R
T
QS
P
R
T
QS
Depolarization
Repolarization
4
5

Figure 18.17, step 6
Ventricular depolarization iscomplete.
Ventricular repolarization beginsat apex, causing the T wave.
Ventricular repolarization iscomplete.
P
R
T
QS
P
R
T
QS
P
R
T
QS
Depolarization
Repolarization
4
5
6

Figure 18.17
Atrial depolarization, initiatedby the SA node, causes theP wave.
P
R
T
QS
SA node
AV node
With atrial depolarizationcomplete, the impulse isdelayed at the AV node.
Ventricular depolarizationbegins at apex, causing theQRS complex. Atrialrepolarization occurs.
P
R
T
QS
P
R
T
QS
Ventricular depolarizationis complete.
Ventricular repolarizationbegins at apex, causing theT wave.
Ventricular repolarizationis complete.
P
R
T
QS
P
R
T
QS
P
R
T
QS
Depolarization Repolarization
1
2
3
4
5
6


Homeostatic Imbalances
Defects in the intrinsic conduction system
may result in:1. Arrhythmias: irregular heart rhythms
2. Uncoordinated atrial and ventricular contractions
3. Fibrillation: rapid, irregular contractions; useless for pumping blood

Problems with Sinus Rhythms
• Tachycardia: Heart rate in excess of 100 bpm when at rest– If persistent, may lead to fibrillation
• Bradycardia: Heart rate less than 60 bpm when at rest– May result in grossly inadequate blood circulation– May be desirable result of endurance training

Homeostatic Imbalances• Defective SA node may result
– Ectopic focus: abnormal pacemaker takes over
– No P waves; If AV node takes over, there will be a slower rhythm (40–60 bpm)
• Defective AV node may result in
– Partial or total heart block
– Longer delay at AV node than normal
– No all impulses from SA node reach the ventricles
• Ventricular fibrillation:
– cardiac muscle cells are overly sensitive to stimulation; no normal rhythm is established
–

Problems with Sinus Rhythms• 2nd degree heart block; Missed QRS complex• SA node is sending impulses, but the AV node is not
sending the impulses along the bundle branches• 1st degree is represented by a longer delay between P &
QRS
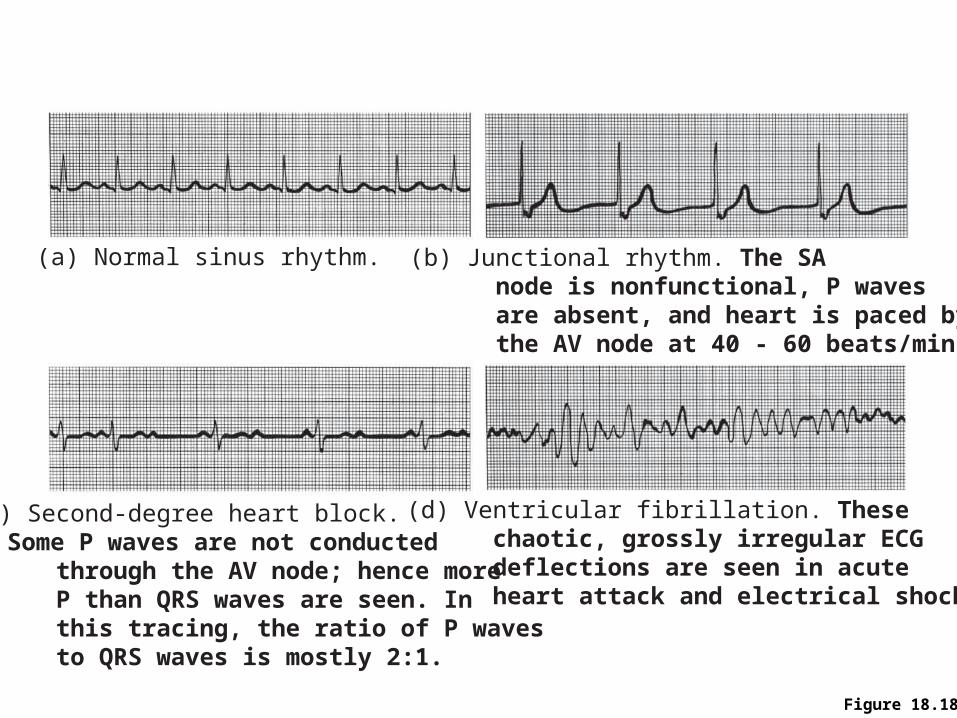
Figure 18.18
(a) Normal sinus rhythm.
(c) Second-degree heart block. Some P waves are not conducted through the AV node; hence more P than QRS waves are seen. In this tracing, the ratio of P waves to QRS waves is mostly 2:1.
(d) Ventricular fibrillation. These chaotic, grossly irregular ECG deflections are seen in acute heart attack and electrical shock.
(b) Junctional rhythm. The SA node is nonfunctional, P waves are absent, and heart is paced by the AV node at 40 - 60 beats/min.


Pacemaker
• Used to correct nodes that are no longer are in rhythm.
• Becomes the new heart’s pacemaker.

Myocardial Infarction• A Heart Attack is
caused by oxygen not getting to the heart muscle usually by blockages in the coronary arteries

Stopping a Heart Attack
• Breaking apart the blockage is done with:– Medication– Angioplasty– Stents– Coronary bypass
surgery (CABG)

Congestive Heart Failure (CHF)
• Progressive condition where the CO is so low that blood circulation is inadequate to meet tissue needs
• Caused by– Coronary atherosclerosis– Persistent high blood pressure– Multiple myocardial infarcts
Mechanical Events: The Cardiac Cycle
• Cardiac cycle: all events associated with blood flow through the heart during one complete heartbeat– Systole—contraction – Diastole—relaxation

Phases of the Cardiac Cycle
1. Ventricular filling—takes place in mid-to-late diastole
– AV valves are open – 80% of blood passively flows into ventricles– Atrial systole occurs, delivering the remaining
20%– End diastolic volume (EDV): volume of blood
in each ventricle at the end of ventricular diastole
Phases of the Cardiac Cycle
2. Ventricular systole– Atria relax and ventricles begin to contract – Rising ventricular pressure results in closing of
AV valves– In ejection phase, ventricular pressure exceeds
pressure in the large arteries, forcing the Semilunar valves open
– End systolic volume (ESV): volume of blood remaining in each ventricle

Phases of the Cardiac Cycle
3. Ventricles relax (diastole)– Decrease in pressure causes blood to flow
backward– Backflow of blood in aorta and pulmonary
trunk closes SL valves


EKG and One Cardiac Cycle

Cardiac Cycle & BPdescribes the contracting and relaxing stages of the heart.
• Includes all events that occur in the heart during one complete heart beat.
• Blood Pressure• Systolic pressure: (top
number) measurement of the force on the arterial walls when the L ventricle contracts.
• Diastolic pressure: (bottom number) measurement of the force on the arterial walls when the L ventricle is relaxed.
• Normal BP = 120/80• Hypertension • Hypotension

Cardiac Output• Volume of blood pumped by each ventricle in
1 minute.• CO = Heart rate (HR) x Stroke volume (SV)
– Heart Rate (beats/minute)– Stroke Volume – volume of blood pumped out of
the L. ventricle with each beat. Why Left ventricle?
• SV = EDV(end diastolic volume) – ESV (end systolic volume)
• Stroke volume can be determined by subtracting systolic BP volume from diastolic BP volume
• Stroke volume/pulse pressure = SBP – DBP

• Cardiac Output in a normal adult is 4.5 – 5 Liters of blood per minute– At rest: CO (ml/min) = HR (75 beats/min) SV (70
ml/beat) = 5.25 L/min
• Varies with body’s demands– Change in HR or force of contraction
• Cardiac Reserve – the heart’s ability to push cardiac output above normal limits– difference between resting and maximal CO– Healthier hearts can have a large increase in C.R.
• Athlete 7X C.O. = 35L/minute
• Nonathlete 4X C.O. = 20L/minute

Factors that Influence Heart Rate
• Age
• Gender
• Exercise
• Body temperature

Regulation of Stroke Volume
• Contractility: contractile strength at a given muscle length, independent of muscle stretch and EDV
• Factors which increase contractility– Increased Ca2+ influx due to sympathetic stimulation– Hormones (thyroxine and epinephrine)
• Factors which decrease contractility– Increased extracellular K+
– Calcium channel blockers

Factors that Control Cardiac Output
• Blood volume reflexes
• Autonomic Nervous System with assistance from neurotransmitters and hormones– Norepinephrine– Acethylcholine– Thyroxine
• Ions
• Temperature

Blood Volume Reflexes• Frank Starling Law of the Heart
– Stroke volume is controlled by Preload - the degree to which cardiac muscles are stretched just before they contract.
• “More blood in = More blood out”
– Increase in stretch is caused by an Increase in the venous return to the right atrium which causes the walls of the right atrium to stretch.
• Increase in stretch causes SA node to depolarize faster; increasing HR
• Increase in stretch also increases force of contraction; Stroke volume
• At rest heart walls are not overstretched; ventricles don’t need forceful contractions

Autonomic Nervous System• Controlled by Medulla oblongata• Parasympathetic (Resting and Digesting)
– Stimulates Vagus nerve (CN X) – decreases SV and HR; decreasing CO
– Acetylcholine – decreases HR and SV; opposite action on cardiac muscle then on skeletal muscle (stimulates)
• Sympathetic (Fight or Flight) – prepares the body for stress– Secretes Norephinephrine and epinephrine – increases
HR and SV; increasing CO
– Increasing HR causes overstretch (Frank S. law)
– Beta blockers-
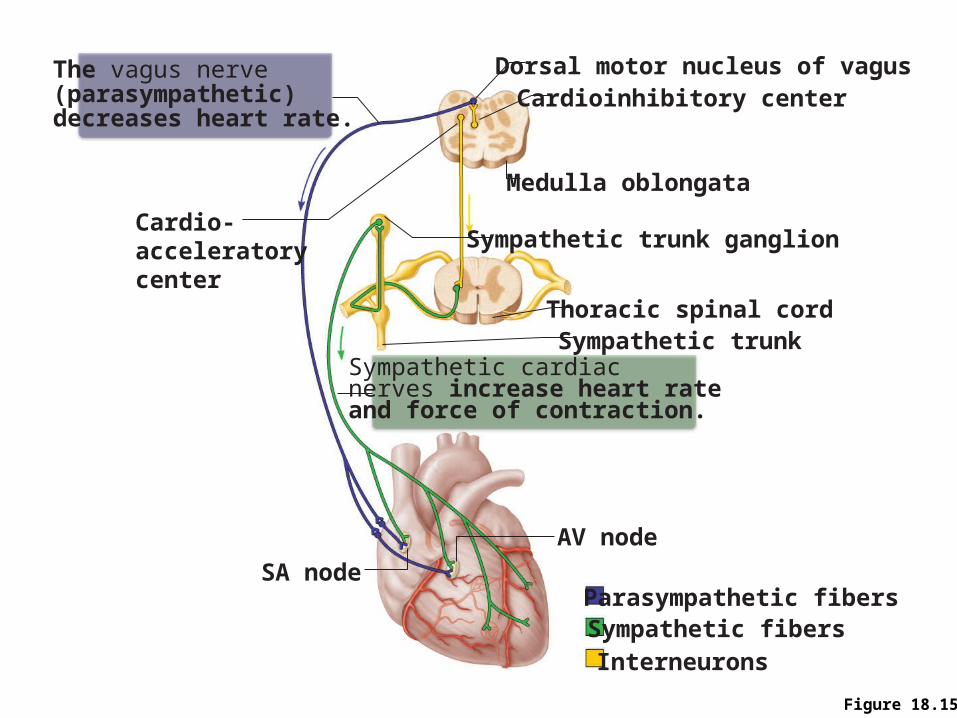
Figure 18.15
Thoracic spinal cord
The vagus nerve (parasympathetic) decreases heart rate.
Cardioinhibitory center
Cardio-acceleratorycenter
Sympathetic cardiacnerves increase heart rateand force of contraction.
Medulla oblongata
Sympathetic trunk ganglion
Dorsal motor nucleus of vagus
Sympathetic trunk
AV node
SA nodeParasympathetic fibersSympathetic fibersInterneurons
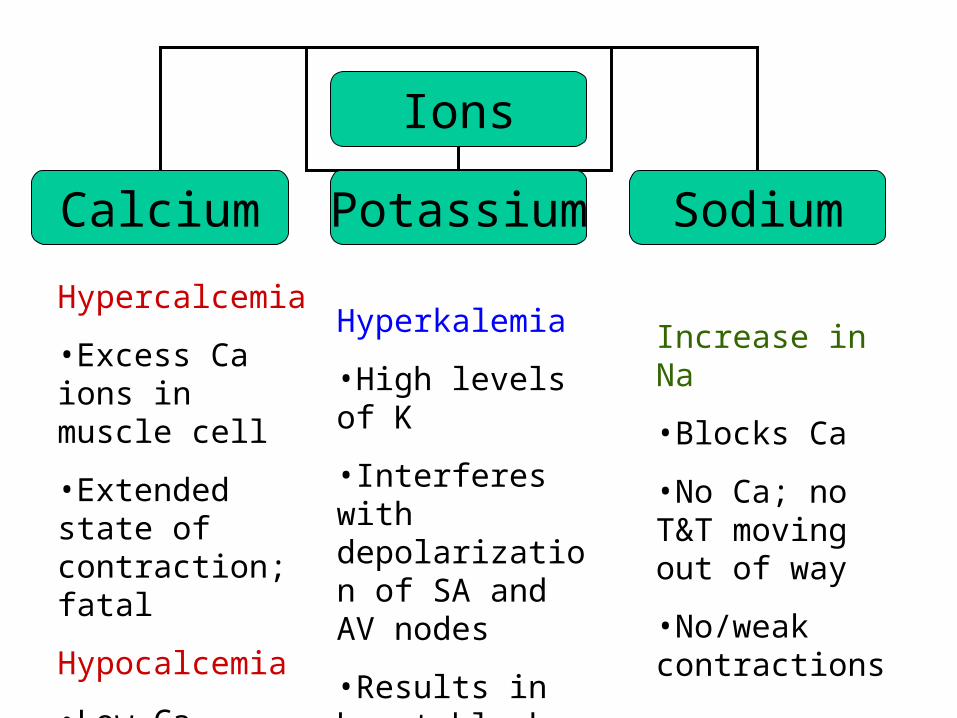
Ions
Calcium Potassium Sodium
Hypercalcemia
•Excess Ca ions in muscle cell
•Extended state of contraction; fatal
Hypocalcemia
•Low Ca levels; results in no/weak contractions
Hyperkalemia
•High levels of K
•Interferes with depolarization of SA and AV nodes
•Results in heart block
Increase in Na
•Blocks Ca
•No Ca; no T&T moving out of way
•No/weak contractions

Temperature
Hyperthermia Hypothermia
Temp > 98.6°F
•Increases HR and SV
•Increase CO
Temperature < 95° F
•Slows depolarization
•Slows contraction
•Decrease CO

Figure 18.22
Venousreturn
Contractility Sympatheticactivity
Parasympatheticactivity
EDV(preload)
Strokevolume
Heartrate
Cardiacoutput
ESV
Exercise (byskeletal muscle andrespiratory pumps;
see Chapter 19)
Heart rate(allows more
time forventricular
filling)
Bloodborneepinephrine,
thyroxine,excess Ca2+
Exercise,fright, anxiety
Initial stimulus
Result
Physiological response