Embed Size (px)
Citation preview

Career Development and College PreparationProgram
California Community Colleges Chancellor’s OfficeJack Scott, Chancellor
Prepared by the Technology, Research and Information Systems Division and the Office of Communications
APRIL 2 0 1 0

STATE OF CALIFORNIA JACK SCOTT, CHANCELLOR
CALIFORNIA COMMUNITY COLLEGES CHANCELLOR’S OFFICE 1102 Q STREET SACRAMENTO, CA 95811-6549 (916) 445-8752 http://www.cccco.edu
April 28, 2010
The Honorable Arnold Schwarzenegger
Governor of California
State Capitol
Sacramento, California 95814
Dear Governor Schwarzenegger:
I am pleased to present to you the Chancellor’s Office report on the analysis of career
development and college preparation (CDCP) courses in the California Community
Colleges.
In 2006, the state increased funding for noncredit community college courses and
created specific categories of CDCP courses. These special categories involved
enhanced funding for specific noncredit courses that community colleges must organize
into sequences leading to specialized noncredit certificates.
This report accounts for the expenditures of these funds and information about the
program’s performance.
In this supplemental report, we present results for the effects of CDCP on two
performance indicators: term-to-term persistence and annual wages. While it is still
early in the CDCP implementation to draw more than tentative conclusions about the
effects of enhanced funding for noncredit courses, some of our results indicate a positive
impact.
If you or your staff have any questions or would like a hard copy of the report, please
contact Morgan Lynn, executive vice chancellor for programs, at (916) 445-1774.
Again, it is my pleasure to provide you with this report.
Sincerely,
Jack Scott, Ph.D.
Chancellor
cc: Members of the California State Legislature

Career Development and College Preparation 2 0 0 9 | 1
Career Development and College Preparation
Executive Summary
The California Community Colleges serve more than 2.9 million students and is the largest system of higher education in the nation. The state’s 112 community colleges are charged with providing workforce training, basic skills education, and preparing students for transfer to four-year institutions. In 2006 Senate Bill 361, authored by Jack Scott, increased funding for all noncredit community college courses and created specific categories of career development and college preparation (CDCP) courses, sometimes referred to as “enhanced noncredit” courses. SB 361 also required accountability reporting on systemwide performance, covered in this report. It supplements the pilot college-level CDCP data in the ARCC report.
The 2009 CDCP report uses several “analog” cohorts of students who took courses that had been retroactively recoded as CDCP courses. These analog cohorts were necessary because enhanced funding for noncredit (i.e., CDCP) began in 2006-2007, but several years of data are required to study the effects of programs. This report presents the effects of CDCP on two performance indicators: term-to-term persistence and annual wages. While it is too early in the program’s implementation to draw firm conclusions about the effects of enhanced funding for noncredit courses, the data indicate a
Table of Contents
Executive Summary
Page 1
Introduction
Page 3
Key Findings
Page 5
Data and Report
Limitations
Page 7
Methodology
Page 9
Results
Page 11
Discussion and
Conclusions
Page 37
Acknowledgements
Page 41
Appendixes
Page 42

2 | California Community Colleges Chancellor’s Office
positive impact of CDCP on persistence and wages. The results are included in the report that follows.
Career Development and College Preparation 2 0 0 9 | 3
Introduction SB 361 directs that community colleges must organize their special category courses into sequences that lead to either of the following noncredit certificates:
1. Noncredit certificate of completion leading to improved employability or job opportunities, or
2. Noncredit certificate of competency in a recognized career field articulated with degree-applicable coursework, completion of an associate degree, or transfer to a baccalaureate institution.
The courses and their related sequences must be approved by the Chancellor’s Office. This report explores the effects of the CDCP courses in two topics of research (to the extent that the Chancellor’s Office Management Information System permits). These topics and research questions follow: CDCP Persistence (Term-to-Term)
1. What percentage of a cohort of first time students who take only CDCP courses (or CDCP plus other noncredit) in a given term return and enroll in courses in the subsequent term? The persistence sequence can be fall to fall, fall to spring, spring to fall, spring to spring.
2. Is there a threshold number of CDCP hours (positive attendance hours) in the first term that seems to lead to persistence? What is the relationship between hours attended in the first CDCP term and persistence?
3. When students do persist (or do not), what types of CDCP courses do they
take in their initial term(s)? For example, what percentages persisted when they started with CDCP courses/programs classified as:

4 | California Community Colleges Chancellor’s Office
a. ESL? b. workforce preparation? c. elementary and basic skills? d. short-term vocational?
4. What percentage of the cohort persists into credit courses, or credit plus
CDCP courses?
5. How well do students who persist fare in the subsequent term (e.g., positive attendance hours, units completed)?
Wages for CDCP Participants:
1. For what percentage of CDCP students do we have a wage data match (i.e., valid Social Security number and wage data reported to the California Employment Development Department)?
2. What are the overall effects of participation on wages?
3. What is the wage trend (pre-exit through to post exit) for students who
complete some threshold of CDCP hours?
4. What happened to wages for students taking courses “retro-coded” as CDCP (i.e., CDCP courses prior to enhanced funding) compared to those taking courses after enhanced noncredit funding was implemented?
5. What happens to wages for students in the various courses/programs
(e.g., short term vocational with high employment potential, CDCP ESL, etc.)?
6. What percentage of CDCP students moved from zero wages reported to
greater than zero wages?
Because the data reflect a new program, a measure of persistence indicates an effect that does not depend as much on elapsed time as do other measures of CDCP performance such as credit degree attainment, transfer to a four-year institution, becoming transfer prepared and so on.
Career Development and College Preparation 2 0 0 9 | 5
Key Findings A summary of the two performance indicators is presented below, followed by more detailed findings in each area. CDCP Term-to-Term Persistence
The percentage of students persisting to a subsequent term (e.g., fall to fall, fall to spring) ranged from 28% to 44% depending on the cohort.
The percentage of students persisting to credit was about 5% to 13% -- substantially less than the overall percentages of those persisting.
While the percentage of students persisting to credit was relatively small, those students who moved to credit achieved high success rates in their subsequent attempts at credit courses. More than 80% of students who attempted subsequent credit courses earned units in those courses.
Relatively high percentages of all students who persisted to a subsequent term took CDCP English as a second language (ESL) courses during their initial term.
Of those students who persisted to credit courses in a subsequent term, the highest percentages enrolled in CDCP Basic Skills courses during their initial term.
Wages of CDCP Participants
While the wage data analyses did not show dramatic effects of participation, the analyses provided evidence of upward trends in wages for most cohorts immediately following the initial CDCP term.

6 | California Community Colleges Chancellor’s Office
In all but one cohort, almost 30% of the students moved from zero reported wages in all years prior to their participation to some wages in years following enrollment.
It is still early in implementation, and the few years of post-CDCP wage data currently available do not allow further conclusions to be drawn about the effects of CDCP on wage trends.
Career Development and College Preparation 2 0 0 9 | 7
Data and Reporting Limitations
Several challenges were recognized when analyzing data for this report. These challenges are described below: 1. Any data matches requiring Social Security numbers (SSNs) will yield
incomplete data given that only about 40% of CDCP students report a SSN. This will especially affect any wage data that require matching students’ SSNs with the California Employment Development Department’s base wage file. Also, because measures of other program effects involve the “tracking” of individuals across time and location (i.e., across multiple community colleges), any problems that exist in college-generated student identifiers (the standard proxy for the SSN) will depress counts of successful outcomes.
2. The funding for CDCP programs began in Fiscal Year 2006-2007. Given the
start-up nature of the effort and the needs of the population served, it will probably take several years for the system to collect sufficient data that will allow us to analyze the effects in any meaningful, valid way.
3. Most of the students classified as participants for this report probably did not
experience the full effects of the effort. Our cohort participants took courses that had been retroactively coded as CDCP during a major data clean-up effort. However, most of them took courses prior to the distribution of enhanced funding for noncredit courses and prior to the course “sequencing” intended to lead to one of the two noncredit certificates.
4. Currently, the Chancellor’s Office Management Information System data on
program awards do not contain CDCP certificate data due to coding issues. This makes it more difficult to study the wage data for a CDCP “completers” cohort than it was to analyze wage data for completers of credit vocational awards (as shown in the 2007, 2008, and 2009 ARCC reports).
5. This report uses a measure of persistence largely as a short-term indicator of
student success in CDCP. Persistence in itself is not a core student outcome; it is viewed here as a critical element in the process for achieving student
8 | California Community Colleges Chancellor’s Office
success (progressing to college-level coursework or to work-related activities). Because persistence can act as a sort of “leading indicator” for eventual student success, and because policymakers need a relatively quick performance indicator, this report relies extensively upon persistence numbers.
Career Development and College Preparation 2 0 0 9 | 9
Methodology Term-to-Term Persistence for Students Who Begin in CDCP Courses
The Chancellor’s Office Management Information System staff searched systemwide to identify students taking courses for the first time at any California community college and taking only CDCP course(s) or CDCP and other noncredit courses during spring 2005 (Cohort 1), fall 2005 (Cohort 2), spring 2006 (Cohort 3), fall 2006 (Cohort 4), spring 2007 (Cohort 5), fall 2007 (Cohort 6), and spring 2008 (Cohort 7). Although funding began officially in February 2007 (spring term), colleges had been encouraged to recode relevant courses as CDCP retroactively, thus allowing us to study earlier cohorts (spring 2005, fall 2005, etc.) with longer academic histories. This recoding occurred as part of a major data clean-up effort - Curriculum Reporting for Community Colleges (CRCC) – initiated by the Chancellor’s Office Management Information System. Students who took at least one credit course and one or more CDCP courses during the qualifying term were excluded. The intention was to select only students starting out in CDCP or CDCP and other noncredit. This approach does eliminate coverage of outcomes for those students who take a CDCP course subsequent to a credit course. This exclusion should have little effect upon the performance indicators reported here because these indicators appear primarily as rates rather than as counts. Had we focused upon performance indicators that were counts (i.e., sums), then this exclusion would have created an undercount of the outcomes. Other data specifications include the following. Courses are designated as CDCP via a course control number and/or course identification number by the Chancellor’s Office Academic Affairs Division. Wage data requested from the department under the latest interagency agreement did not include SSNs for the fall 2007 and spring 2008 CDCP cohorts. When SSNs were available, Management Information System staff used the SSN to search the database systemwide for first-time students; otherwise staff used student identification numbers to search college wide. Where possible, students with prior enrollments outside the California Community College system were excluded.
10 | California Community Colleges Chancellor’s Office
Persistence was defined as enrollment in any California community college course in a subsequent term (e.g., fall to spring, fall to fall, spring to spring, spring to fall). The Management Information System data extraction for this indicator included cohort variables for type of initial CDCP course(s) (i.e., ESL, basic skills, short-term vocational, workforce preparation), and number of positive attendance hours reported for the initial course(s). The persistence variables included term(s) of subsequent course(s), course type (credit, noncredit), positive attendance hours, units attempted, units earned, and grade.
Wage Trends for Students Taking CDCP Courses
As with the persistence analysis, Chancellor’s Office Management Information System staff searched systemwide to identify students taking courses for the first time at any California community college and taking only CDCP course(s) or CDCP and other noncredit courses during spring 2005 (Cohort 1), fall 2005 (Cohort 2), spring 2006 (Cohort 3), fall 2006 (Cohort 4), spring 2007 (Cohort 5), fall 2007 (Cohort 6) and spring 2008 (Cohort 7). The CDCP cohort members with valid SSNs were matched to the Employment Development Department’s base wage file, even if zero wages were reported in a quarter, and their quarterly wage data were extracted for the most recent 40+ quarters available from the Employment Development Department. Available and sufficient wage data spanned the period from the first fiscal quarter of 1997 (January to March) through the third fiscal quarter of 2008 (July to September). Given that CDCP cohorts were identified from 2005 through 2008, the wage data for quarters after CDCP enrollment were limited. Calendar quarter wage data for CDCP students for academic “quarters” were recoded to more closely match the academic terms for which other CDCP data were reported. For example, wage data from fiscal quarters 3 and 4 in 2005 (i.e., July to September and October to December) and 1 and 2 in 2006 (January to March and April to June) became wage data for academic “quarters” 1 and 2 in 2005 (July to September and October to December) and 3 and 4 in 2006 (January to March and April to June). These quarters were summed to obtain wages for academic year 2005-2006.
Career Development and College Preparation 2 0 0 9 | 11
Results
Term-to-Term Persistence for Students who begin in CDCP Courses
Following are the research questions and results for the term-to-term persistence evaluation.
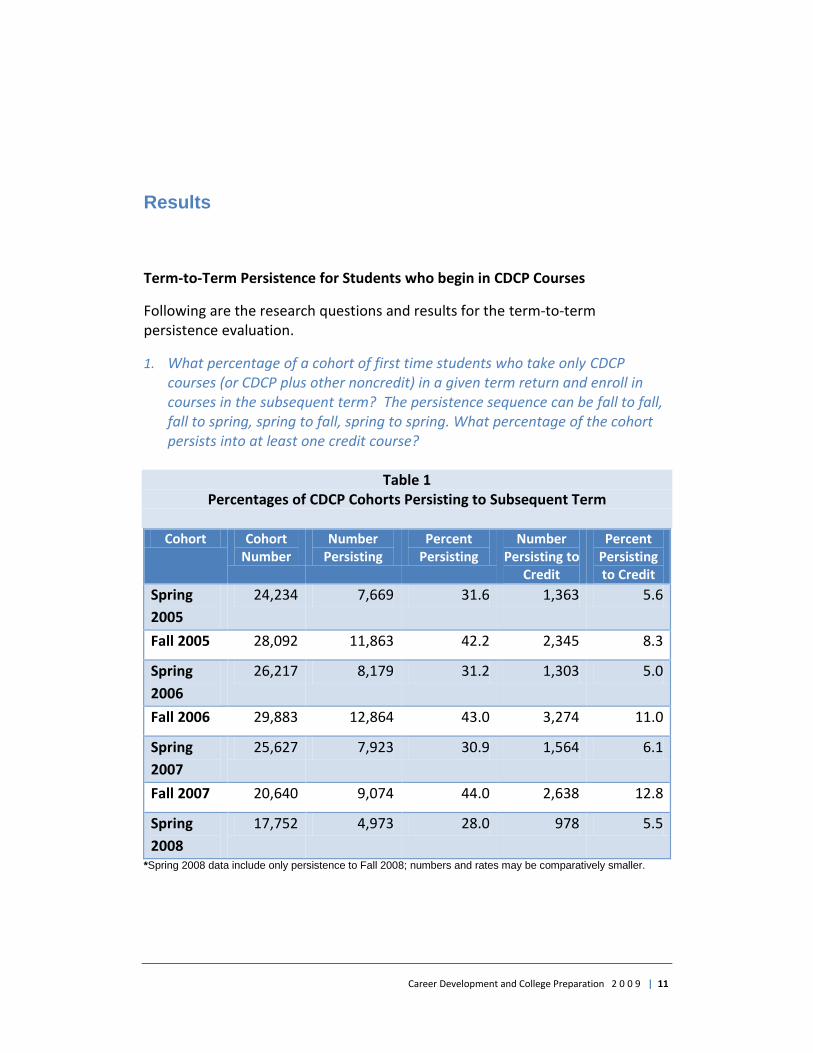
1. What percentage of a cohort of first time students who take only CDCP courses (or CDCP plus other noncredit) in a given term return and enroll in courses in the subsequent term? The persistence sequence can be fall to fall, fall to spring, spring to fall, spring to spring. What percentage of the cohort persists into at least one credit course?
Table 1 Percentages of CDCP Cohorts Persisting to Subsequent Term
Cohort Cohort
Number Number
Persisting Percent
Persisting Number
Persisting to Credit
Percent Persisting to Credit
Spring
2005
24,234 7,669 31.6 1,363 5.6
Fall 2005 28,092 11,863 42.2 2,345 8.3
Spring
2006
26,217 8,179 31.2 1,303 5.0
Fall 2006 29,883 12,864 43.0 3,274 11.0
Spring
2007
25,627 7,923 30.9 1,564 6.1
Fall 2007 20,640 9,074 44.0 2,638 12.8
Spring
2008
17,752 4,973 28.0 978 5.5
*Spring 2008 data include only persistence to Fall 2008; numbers and rates may be comparatively smaller.
12 | California Community Colleges Chancellor’s Office
Table 1 shows that about 28% to 44% of the cohort participants persist to the subsequent term. The percentage persisting to credit is substantially less than the overall percentage. Apparently, most of the persistence involves another noncredit course. There seems to be a pattern where cohorts who begin in the spring term have a relatively lower percentage of students persisting. This indicates that students who enter a CDCP cohort in a spring term probably differ in some ways from students who enter the cohort in a fall term. Further, the overall persistence rates for the three fall cohorts show a slight upward trend and the fall cohort rates for those persisting to credit show a definite, albeit moderate, upward trend.
Career Development and College Preparation 2 0 0 9 | 13
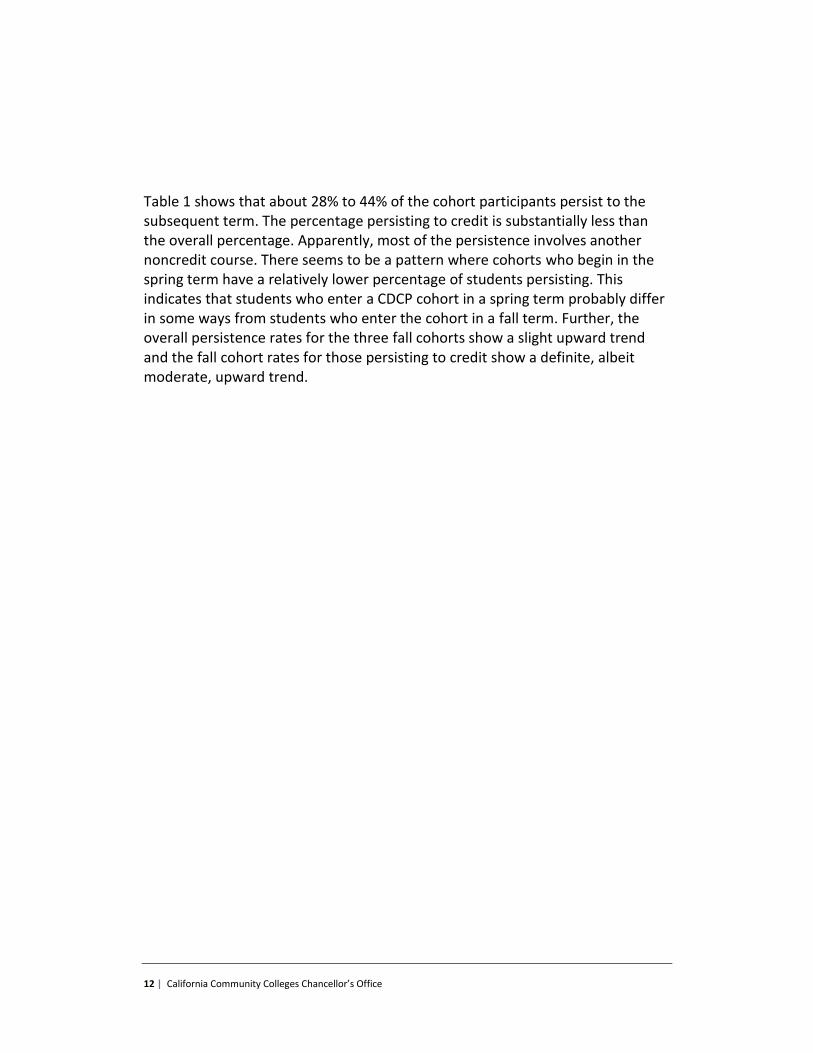
2. Is there a threshold number of CDCP hours (positive attendance hours) in the first term that seems to lead to persistence? What is the relationship between hours attended in first CDCP term and persistence? In response to concerns among state officials, the Chancellor’s Office explored the percentages for two separate groups—those with 0 to 7.9 hours compared to those with 8 or more hours in the first term.
Table 2 provides some general information about CDCP positive attendance hours completed in the initial term for each cohort.
Table 2 CDCP Positive Attendance Hours in First Term
Cohort Mean Median SD** Min Max
Spring 2005 53.7 25.0 103.3 0.10 4,651.0
Fall 2005 53.5 25.0 70.5 0.10 713.0
Spring 2006 52.9 25.5 68.5 0.10 700.0
Fall 2006 54.3 26.0 71.7 0.10 1,836.3
Spring 2007 52.1 26.0 66.6 0.10 746.0
Fall 2007 48.8 24.0 61.3 0.10 653.9
Spring 2008 45.2 21.0 56.2 0.10 662.0 *Spring 2008 data include only persistence to Fall 2008; numbers and rates may be comparatively smaller. **SD stands for standard deviation.
Table 2 indicates that a cutoff of 8 hours covers a very small part of the distribution of hours in the initial term. Note: The minimum and maximum values for the data here may also reflect reporting or data entry errors. Now, consider the percentages after we dichotomize threshold hours, as presented in Table 3.
14 | California Community Colleges Chancellor’s Office
Table 3
Percentage Persisting by Number of CDCP Hours Taken During Initial Term
Cohort Threshold CDCP Hours
Percent not Persisting
Percent Persisting to
Noncredit only
Percent Persisting to
Credit
Total Number
Spring 2005
0 to 7.9 82.5 12.2 5.3
5.3
6,138
6,138 8 or more 63.6 30.7 5.7
5.7
18,092
18,092 Fall 2005 0 to 7.9 73.4 15.9 10.7 6,882
6,882 8 or more 52.7 39.7 7.6 21,210
21,210 Spring 2006
0 to 7.9 81.9 13.3 4.8 6,689
6,689 8 or more 64.3 30.7 5.0 19,528
19,528 Fall 2006 0 to 7.9 68.5 15.1 16.4 7,459
7,459 8 or more 53.1 37.8 9.1 22,393
22,393 Spring 2007
0 to 7.9 81.1 12.6 6.3 6,578
6,578 8 or more 64.9 29.0 6.0 19,049
19,049 Fall 2007 0 to 7.9 65.8 14.0 20.2 5,594
5,594 8 or more 52.4 37.6 10.0 15,046
15,046 Spring 2008*
0 to 7.9 81.4 11.6 7.0 4,935
4,935 8 or more 68.4 26.7 4.9 12,817
12,817 *Spring 2008 data include only persistence to Fall 2008; numbers and rates may be comparatively smaller.
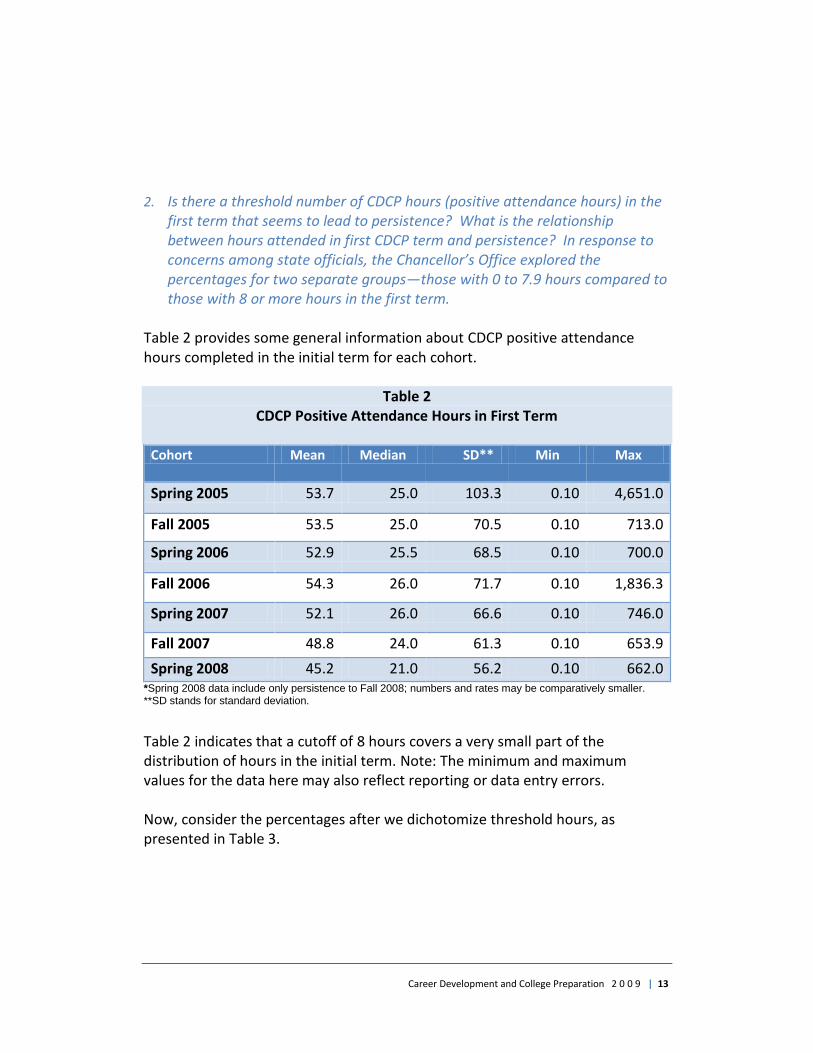
In general, larger percentages of students completing 8 or more CDCP hours persisted to the subsequent term. However, a pattern emerges when comparing fall and spring cohorts on persistence to credit. Whereas threshold CDCP hours do not appear to make much difference in persistence to credit for spring cohorts, for each of the fall cohorts the percentage of students taking less than 8 hours who persist to credit is consistently larger than credit persistence for those taking 8 or more hours. The data in Table 3 reinforce the data presented in Table 2. Students who accumulated less than 8 CDCP hours in their initial term constitute a small proportion of the entire population (usually around 25%), not just a small interval of the distribution of hours amassed.
Career Development and College Preparation 2 0 0 9 | 15
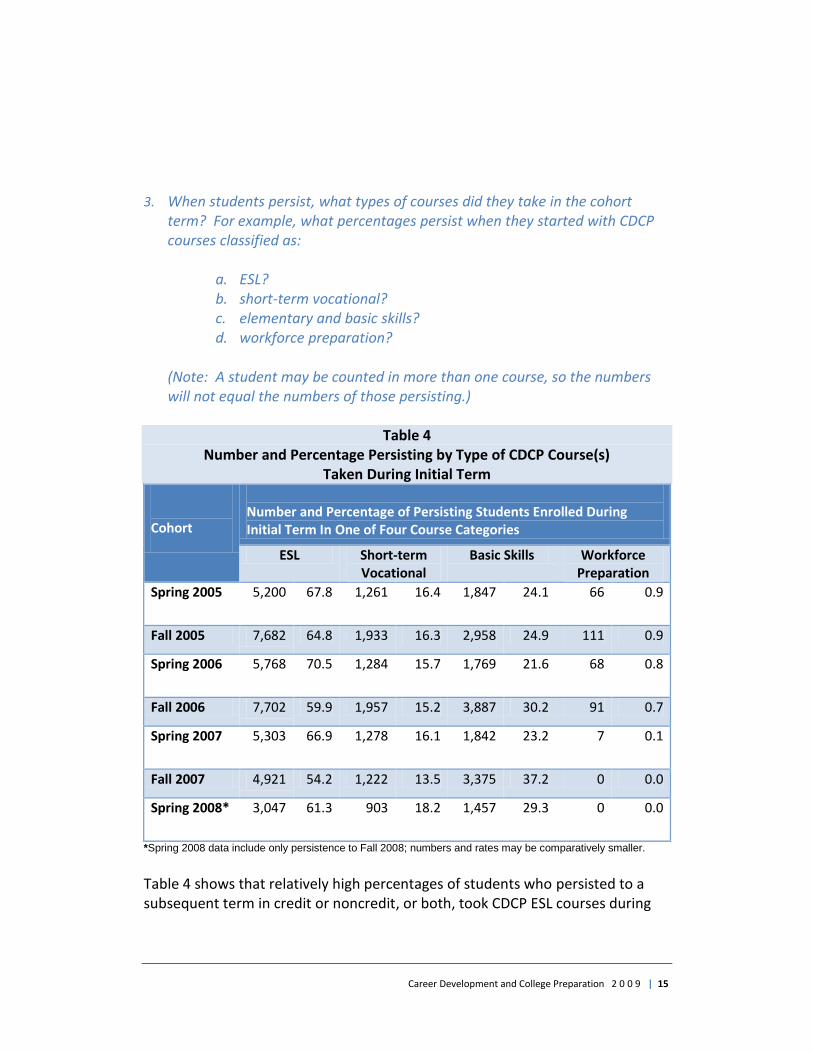
3. When students persist, what types of courses did they take in the cohort term? For example, what percentages persist when they started with CDCP courses classified as:
a. ESL? b. short-term vocational? c. elementary and basic skills? d. workforce preparation?
(Note: A student may be counted in more than one course, so the numbers will not equal the numbers of those persisting.)
Table 4 Number and Percentage Persisting by Type of CDCP Course(s)
Taken During Initial Term
Cohort
Number and Percentage of Persisting Students Enrolled During Initial Term In One of Four Course Categories
ESL Short-term Vocational
Basic Skills Workforce Preparation
Spring 2005 5,200 67.8 1,261 16.4 1,847 24.1 66 0.9
Fall 2005 7,682 64.8 1,933 16.3 2,958 24.9 111 0.9
Spring 2006 5,768 70.5 1,284 15.7 1,769 21.6 68 0.8
Fall 2006 7,702 59.9 1,957 15.2 3,887 30.2 91 0.7
Spring 2007 5,303 66.9 1,278 16.1 1,842 23.2 7 0.1
Fall 2007 4,921 54.2 1,222 13.5 3,375 37.2 0 0.0
Spring 2008* 3,047 61.3 903 18.2 1,457 29.3 0 0.0
*Spring 2008 data include only persistence to Fall 2008; numbers and rates may be comparatively smaller.
Table 4 shows that relatively high percentages of students who persisted to a subsequent term in credit or noncredit, or both, took CDCP ESL courses during
16 | California Community Colleges Chancellor’s Office
their initial term. This result could indicate several situations. It could signal that those who take ESL really have more preparation and incentive for taking a subsequent credit course. These may be more mature students or foreign students who attained better academic preparation based on a non-English language. It could also indicate that an ESL course really enables a student to pursue courses they truly wanted in the first place. One could also hypothesize that students who begin with an ESL course may have a higher motivation to continue onward or they may experience less restrictive economic and social barriers (such as family and job commitments). The low numbers and percentages persisting from CDCP Workforce Preparation courses could signal that colleges offered relatively few courses in this category. It might also indicate that students who took workforce preparation courses did not intend to persist, but rather took the course to meet a specific one-time need.
Career Development and College Preparation 2 0 0 9 | 17
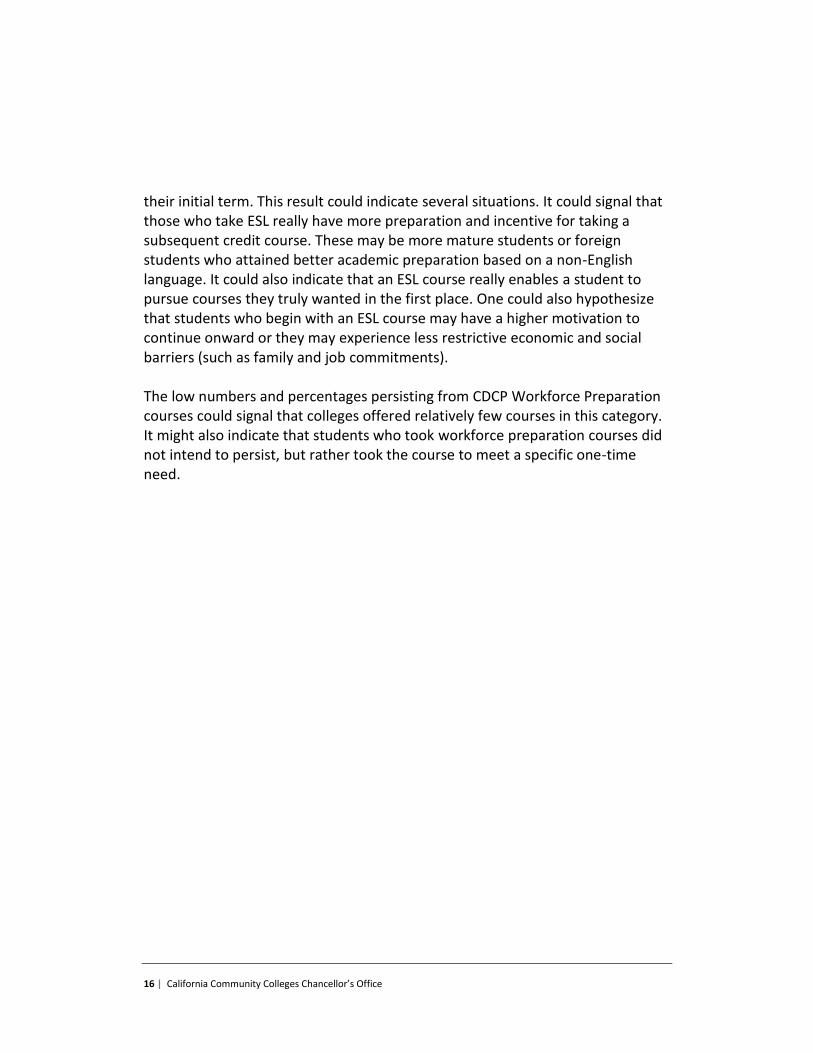
4. What percentage of the cohort persists into credit courses, or credit plus CDCP courses?
Table 5 Number and Percentage Persisting to Credit by Type of CDCP Course(s)
Taken during Initial Term Cohort Number and Percentage of Students Persisting to Credit and
Enrolled During Initial Term In One of Four Course Categories
ESL Short-term Vocational
Basic Skills Workforce Preparation
Spring 2005 577 42.3 195 14.3 715 52.5 5 0.4
Fall 2005 773 33.0 382 16.3 1,319 56.2 8 0.3
Spring 2006 540 41.4 224 17.2 649 49.8 7 0.5
Fall 2006 879 26.8 459 14.0 2,083 63.6 7 0.2
Spring 2007 664 42.5 277 17.7 724 46.3 1 0.1
Fall 2007 602 22.8 375 14.2 1733 65.7 0 0.0
Spring 2008* 289 29.6 245 25.1 484 49.5 0 0.0
*Spring 2008 data include only persistence to Fall 2008; numbers and rates may be comparatively smaller.
Table 5 shows that relatively high percentages of students who persisted to credit courses in a subsequent term took CDCP Basic Skills courses during their initial term. This could indicate several situations. It could signal that those who take basic skills have more incentive for taking a subsequent credit course, e.g., they plan to transfer to a four-year institution. It could also indicate that CDCP Basic Skills courses enable students to pursue courses that they truly wanted in the first place. The high credit persistence of basic skills students might also be attributed to the institutional effort placed on enabling these students to progress to credit courses. It is probably too early to attribute the results to CDCP programs, but this is a trend to watch in future reports.

18 | California Community Colleges Chancellor’s Office
Note that the persistence results for CDCP ESL students are similar to those reported and discussed for Table 4.
Career Development and College Preparation 2 0 0 9 | 19
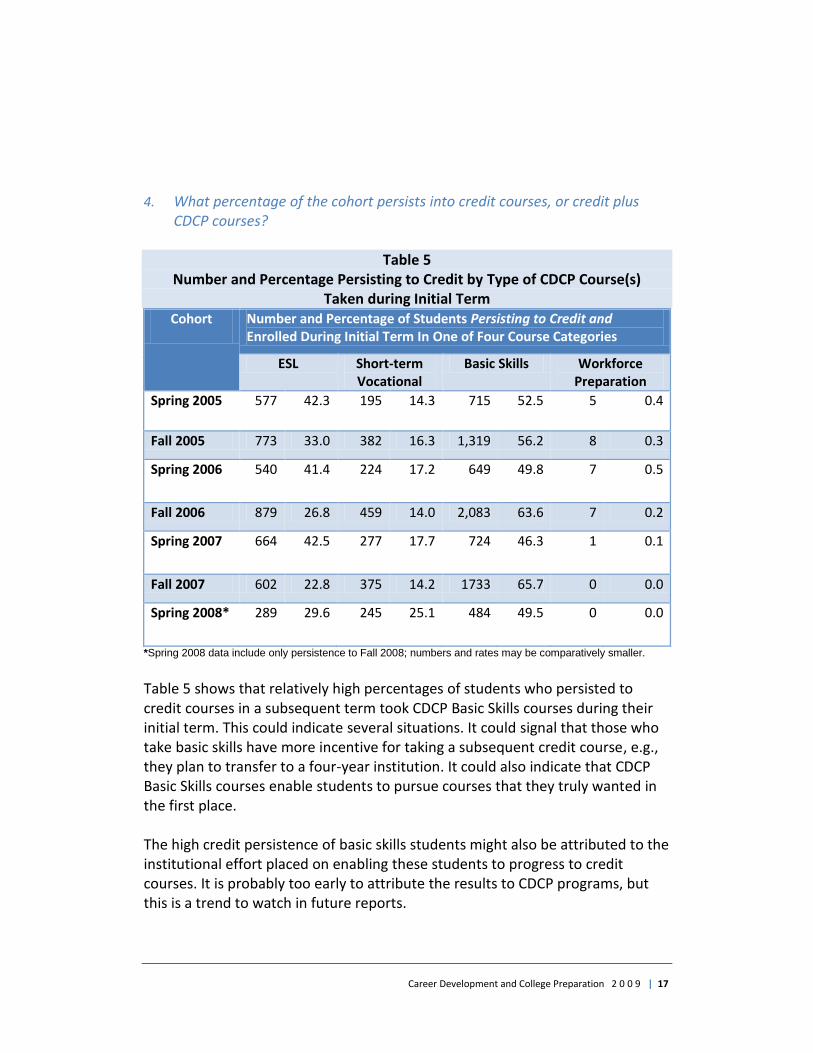
5. How well do persisting students do in their subsequent term (e.g., positive attendance hours, units attempted, and units completed)?
Table 6 Numbers and Percentages of CDCP Persisting Students
Who Attempted/Earned Credit Units in Subsequent Terms
Cohort Number
persisting
to
subsequent
term
Number
attempting
credit units in
subsequent
term
Percent of
“persisters”
attempting
credit units in
subsequent
term
Number
earning credit
units in
subsequent
term
Percent of
“attempters”
that earned
credit units in
subsequent
term
Spring 2005 7,669 1,363 17.8 1,148 84.2
Fall 2005 11,863 2,341 19.7 2,020 86.3
Spring 2006 8,179 1,302 15.9 1,084 83.3
Fall 2006 12,864 3,269 25.4 2,810 86.0
Spring 2007 7,923 1,563 19.7 1,306 83.6
Fall 2007 9,074 2,637 29.1 2,318 87.9
Spring 2008* 4,973 978 19.7 810 82.8
*Spring 2008 data include only persistence to Fall 2008; numbers and rates may be comparatively smaller.
While the percentages of CDCP students persisting to credit are relatively small (see Table 1), Table 6 indicates that students who progress to credit have high success rates (credit units earned) in their subsequent attempts at credit courses.
20 | California Community Colleges Chancellor’s Office
Table 7 Units Attempted and Units Earned in Subsequent (Persisting) Term
Cohort Units Attempted Units Earned
Mean Median SD Mean Median SD
Spring 2005 9.3 9.0 5.9 8.1 7.0 5.7
Fall 2005 9.7 9.5 5.3 8.4 8.0 5.1
Spring 2006 9.0 8.0 5.7 7.9 7.0 5.5
Fall 2006 9.6 10.0 4.8 8.0 7.0 4.8
Spring 2007 8.9 8.0 5.5 7.9 7.0 5.2
Fall 2007 9.6 10.0 4.6 8.0 7.5 4.5
Spring 2008* 8.7 8.3 5.2 7.6 7.0 4.7
*Spring 2008 data include only persistence to Fall 2008; numbers and rates may be comparatively smaller.
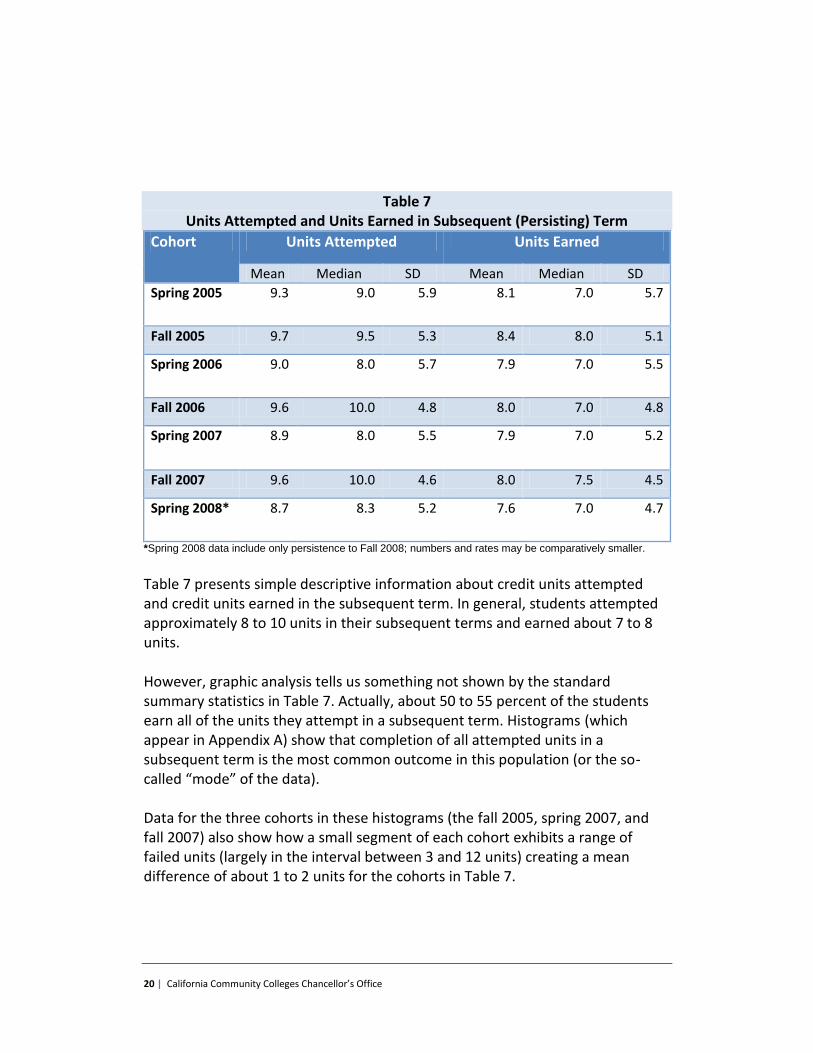
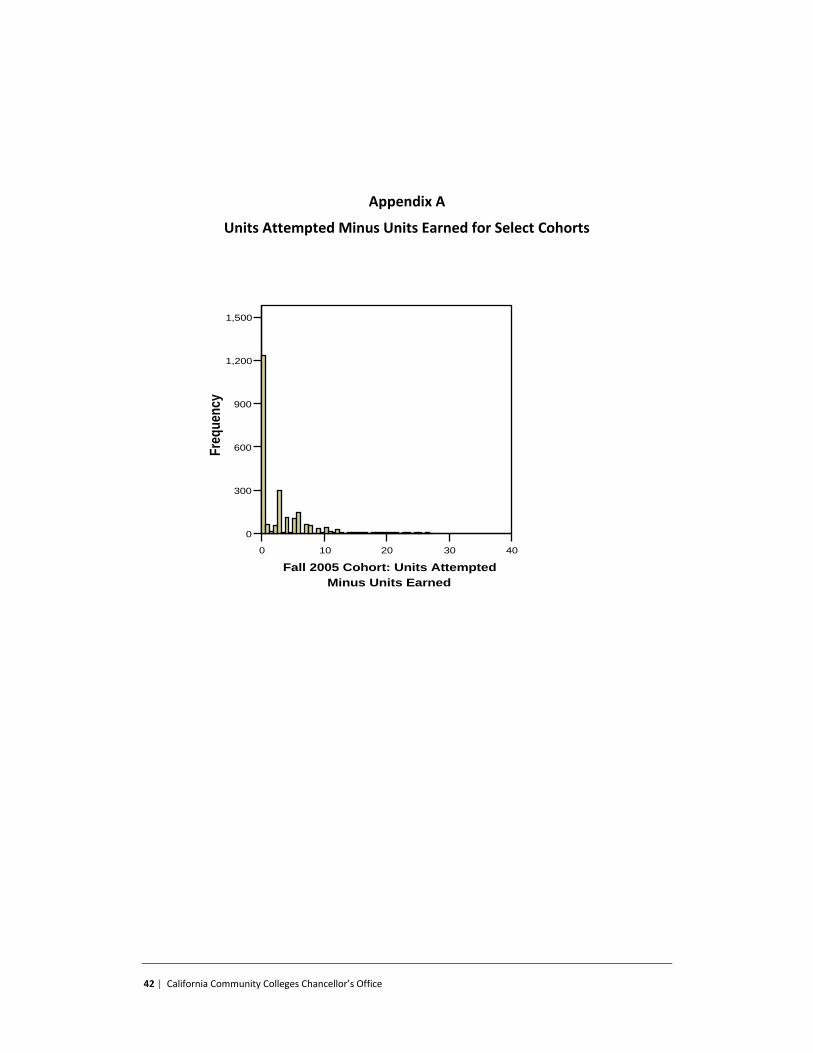
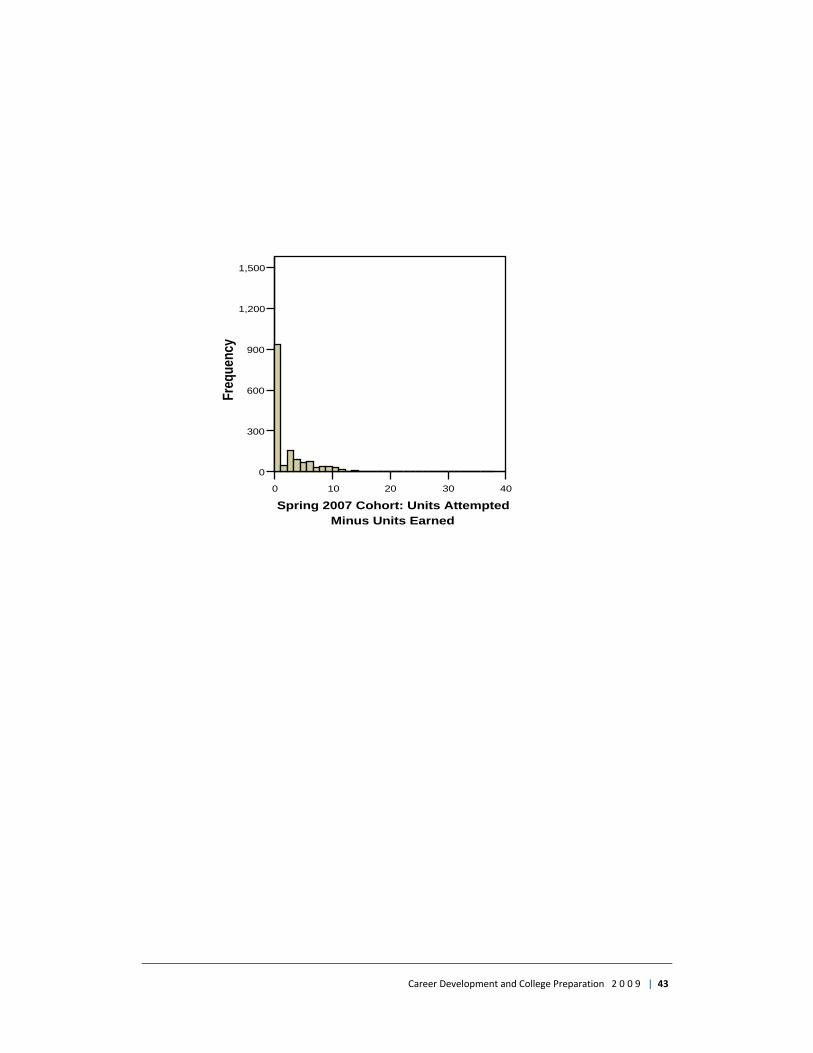
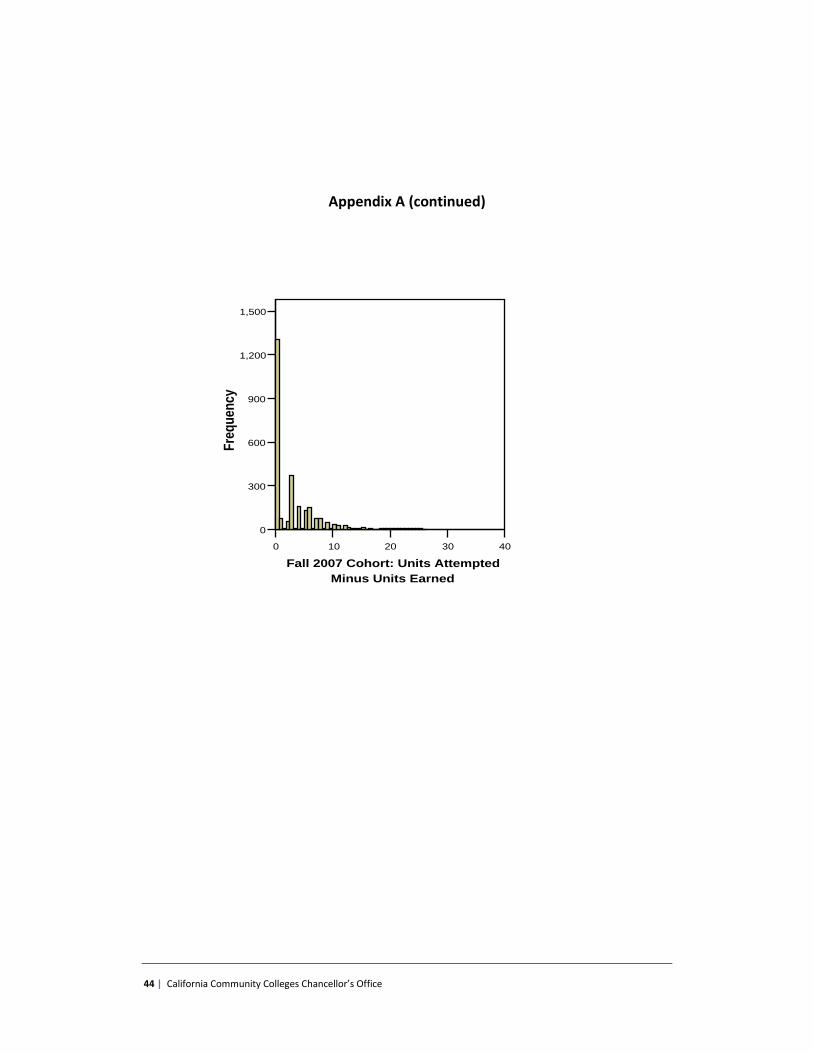
Table 7 presents simple descriptive information about credit units attempted and credit units earned in the subsequent term. In general, students attempted approximately 8 to 10 units in their subsequent terms and earned about 7 to 8 units. However, graphic analysis tells us something not shown by the standard summary statistics in Table 7. Actually, about 50 to 55 percent of the students earn all of the units they attempt in a subsequent term. Histograms (which appear in Appendix A) show that completion of all attempted units in a subsequent term is the most common outcome in this population (or the so-called “mode” of the data). Data for the three cohorts in these histograms (the fall 2005, spring 2007, and fall 2007) also show how a small segment of each cohort exhibits a range of failed units (largely in the interval between 3 and 12 units) creating a mean difference of about 1 to 2 units for the cohorts in Table 7.
Career Development and College Preparation 2 0 0 9 | 21
Table 8 Positive Attendance Hours Reported in Subsequent (Persisting) Term
Cohort Mean Median SD Number
Spring 2005 130.1 80.0 159.0 7,660
Fall 2005 129.9 84.0 149.0 11,851
Spring 2006 124.5 82.5 143.9 8,175
Fall 2006 130.6 92.0 136.5 12,848
Spring 2007 118.9 76.5 136.1 7,908
Fall 2007 133.8 97.8 130.6 9,053
Spring 2008* 138.3 100.0 145.9 4,870
*Spring 2008 data include only persistence to Fall 2008; numbers and rates may be comparatively smaller.
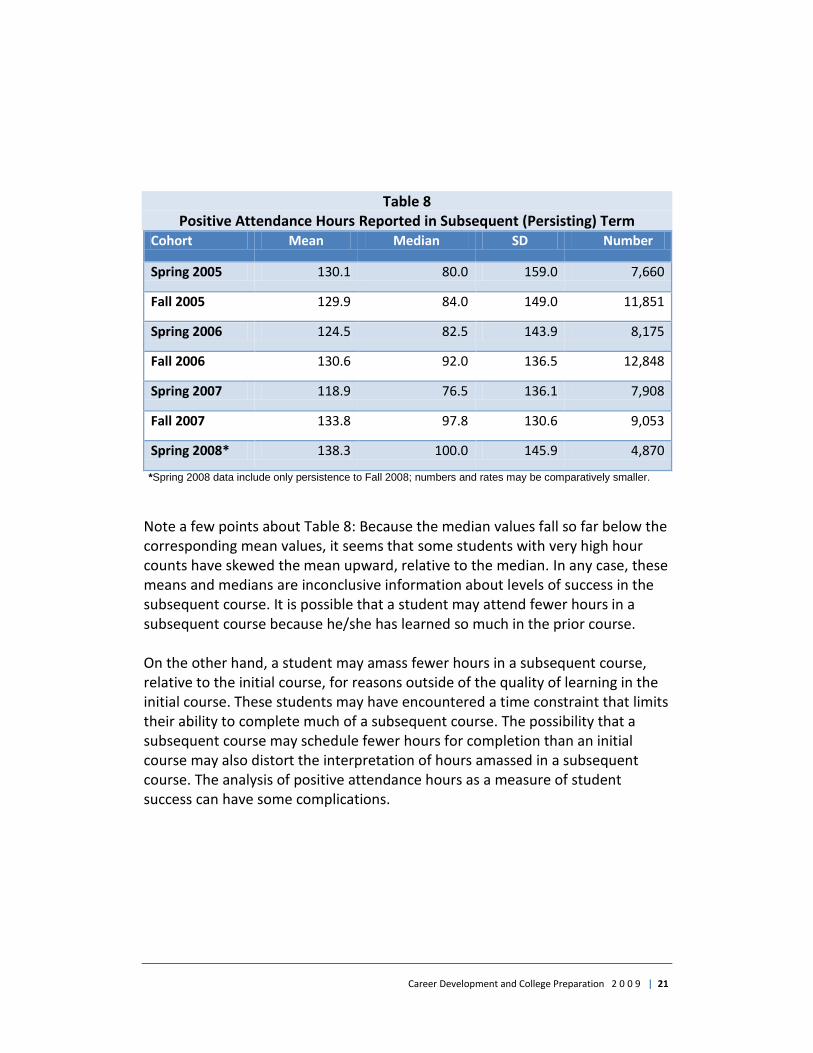
Note a few points about Table 8: Because the median values fall so far below the corresponding mean values, it seems that some students with very high hour counts have skewed the mean upward, relative to the median. In any case, these means and medians are inconclusive information about levels of success in the subsequent course. It is possible that a student may attend fewer hours in a subsequent course because he/she has learned so much in the prior course. On the other hand, a student may amass fewer hours in a subsequent course, relative to the initial course, for reasons outside of the quality of learning in the initial course. These students may have encountered a time constraint that limits their ability to complete much of a subsequent course. The possibility that a subsequent course may schedule fewer hours for completion than an initial course may also distort the interpretation of hours amassed in a subsequent course. The analysis of positive attendance hours as a measure of student success can have some complications.
22 | California Community Colleges Chancellor’s Office
Wage Trends for Students Taking CDCP Courses
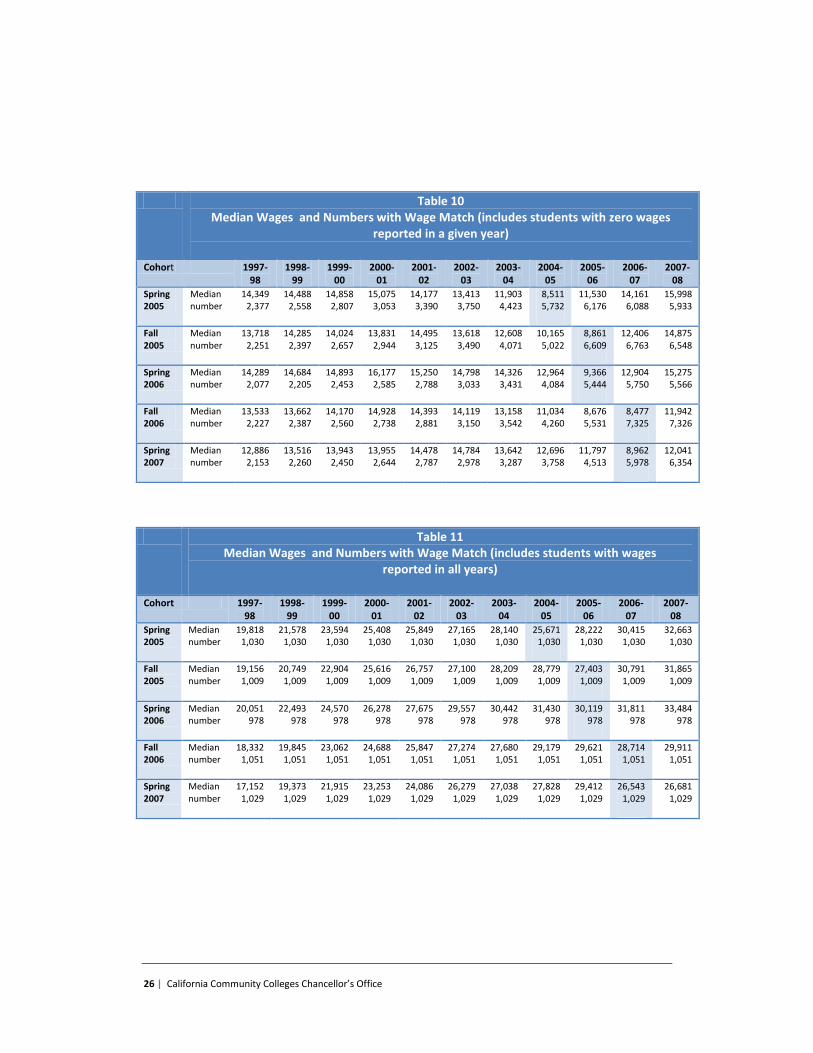
Following are the research questions and results for the effects of CDCP participation on wages. The analysis relies upon the rather basic model of pre- and post-treatment measures (wages before and wages after CDCP) to infer the program’s “effect” on student wages. Tables 10 and 11 specify the median wage data used to create most of the figures in this section. To avoid a lengthy report or extensive appendices, we omit data tables for each figure. Tables of the raw data used to create specific figures are available from the Chancellor’s Office Research and Planning Unit upon request.
Career Development and College Preparation 2 0 0 9 | 23
Following are the six research questions and results for the CDCP student wage data.
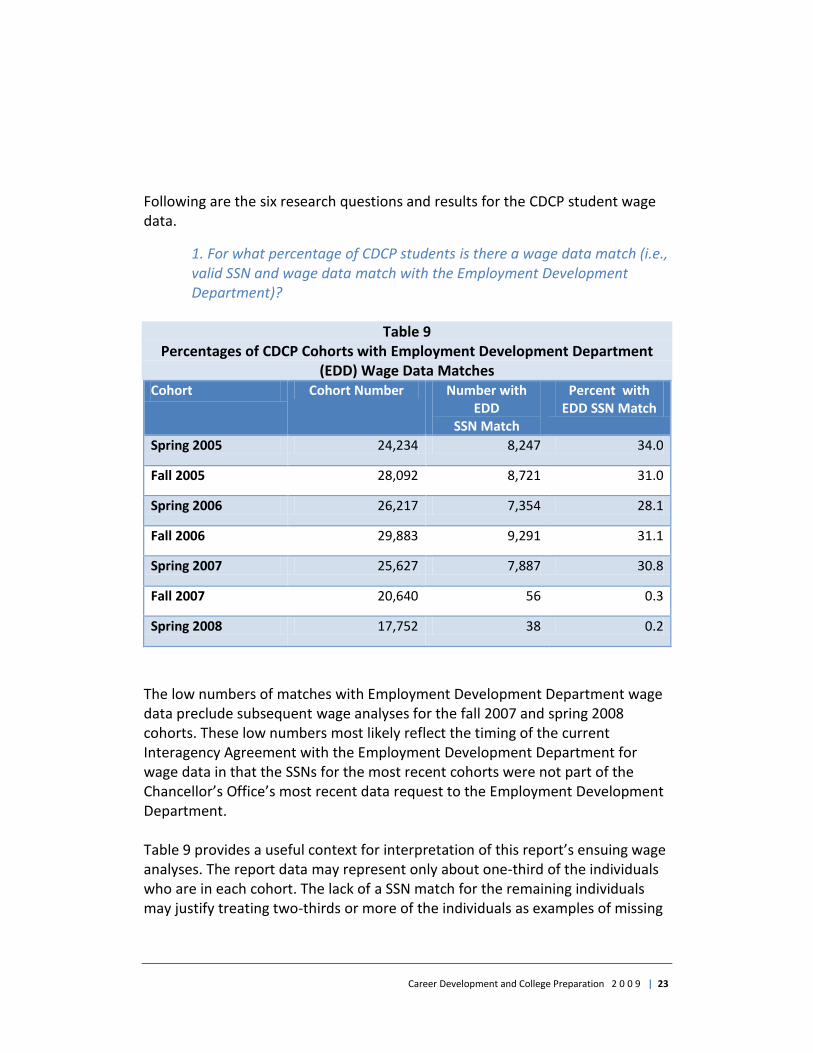
1. For what percentage of CDCP students is there a wage data match (i.e., valid SSN and wage data match with the Employment Development Department)?
Table 9
Percentages of CDCP Cohorts with Employment Development Department (EDD) Wage Data Matches
Cohort Cohort Number Number with EDD
SSN Match
Percent with EDD SSN Match
Spring 2005 24,234 8,247 34.0
Fall 2005 28,092 8,721 31.0
Spring 2006 26,217 7,354 28.1
Fall 2006 29,883 9,291 31.1
Spring 2007 25,627 7,887 30.8
Fall 2007 20,640 56 0.3
Spring 2008 17,752 38 0.2
The low numbers of matches with Employment Development Department wage data preclude subsequent wage analyses for the fall 2007 and spring 2008 cohorts. These low numbers most likely reflect the timing of the current Interagency Agreement with the Employment Development Department for wage data in that the SSNs for the most recent cohorts were not part of the Chancellor’s Office’s most recent data request to the Employment Development Department. Table 9 provides a useful context for interpretation of this report’s ensuing wage analyses. The report data may represent only about one-third of the individuals who are in each cohort. The lack of a SSN match for the remaining individuals may justify treating two-thirds or more of the individuals as examples of missing
24 | California Community Colleges Chancellor’s Office
data. That is, a very conservative interpretation of such missing data would argue that the report’s tables cannot apply to the majority of the students.
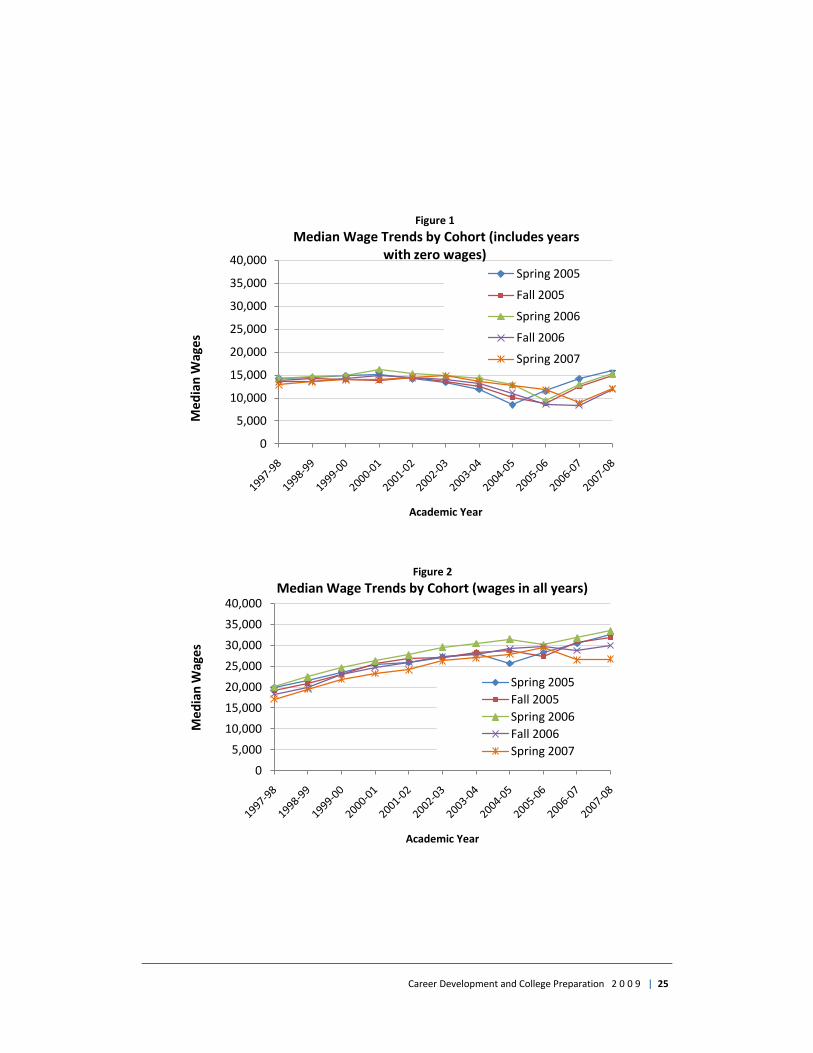
2. What are the overall effects of CDCP participation on wages? Figure 1 shows the annual median wage trends for all cohort members with a wage data match across an 11-year period for which the Employment Development Department provided data, even if zero wages were reported in some years. Median wages and numbers of students behind each annual data point for Figure 1 are presented in Table 10. Figure 2 displays the annual median wage trends for cohort members with a wage data match and greater than zero wages in all years. Median wages and numbers of students behind each annual data point for Figure 2 are presented in Table 11. The shaded cells in each table indicate the median wage in the academic year in which the students enrolled in their first CDCP courses.
Career Development and College Preparation 2 0 0 9 | 25
0
5,000
10,000
15,000
20,000
25,000
30,000
35,000
40,000
Me
dia
n W
age
s
Academic Year
Figure 1
Median Wage Trends by Cohort (includes years with zero wages)
Spring 2005
Fall 2005
Spring 2006
Fall 2006
Spring 2007
0
5,000
10,000
15,000
20,000
25,000
30,000
35,000
40,000
Me
dia
n W
ages
Academic Year
Figure 2
Median Wage Trends by Cohort (wages in all years)
Spring 2005
Fall 2005
Spring 2006
Fall 2006
Spring 2007
26 | California Community Colleges Chancellor’s Office
Table 10 Median Wages and Numbers with Wage Match (includes students with zero wages
reported in a given year)
Cohort 1997-
98 1998-
99 1999-
00 2000-
01 2001-
02 2002-
03 2003-
04 2004-
05 2005-
06 2006-
07 2007-
08
Spring 2005
Median number
14,349 2,377
14,488 2,558
14,858 2,807
15,075 3,053
14,177 3,390
13,413 3,750
11,903 4,423
8,511 5,732
11,530 6,176
14,161 6,088
15,998 5,933
Fall 2005
Median number
13,718 2,251
14,285 2,397
14,024 2,657
13,831 2,944
14,495 3,125
13,618 3,490
12,608 4,071
10,165 5,022
8,861 6,609
12,406 6,763
14,875 6,548
Spring 2006
Median number
14,289 2,077
14,684 2,205
14,893 2,453
16,177 2,585
15,250 2,788
14,798 3,033
14,326 3,431
12,964 4,084
9,366 5,444
12,904 5,750
15,275 5,566
Fall 2006
Median number
13,533 2,227
13,662 2,387
14,170 2,560
14,928 2,738
14,393 2,881
14,119 3,150
13,158 3,542
11,034 4,260
8,676 5,531
8,477 7,325
11,942 7,326
Spring 2007
Median number
12,886 2,153
13,516 2,260
13,943 2,450
13,955 2,644
14,478 2,787
14,784 2,978
13,642 3,287
12,696 3,758
11,797 4,513
8,962 5,978
12,041 6,354
Table 11 Median Wages and Numbers with Wage Match (includes students with wages
reported in all years)
Cohort 1997-
98 1998-
99 1999-
00 2000-
01 2001-
02 2002-
03 2003-
04 2004-
05 2005-
06 2006-
07 2007-
08
Spring 2005
Median number
19,818 1,030
21,578 1,030
23,594 1,030
25,408 1,030
25,849 1,030
27,165 1,030
28,140 1,030
25,671 1,030
28,222 1,030
30,415 1,030
32,663 1,030
Fall 2005
Median number
19,156 1,009
20,749 1,009
22,904 1,009
25,616 1,009
26,757 1,009
27,100 1,009
28,209 1,009
28,779 1,009
27,403 1,009
30,791 1,009
31,865 1,009
Spring 2006
Median number
20,051 978
22,493 978
24,570 978
26,278 978
27,675 978
29,557 978
30,442 978
31,430 978
30,119 978
31,811 978
33,484 978
Fall 2006
Median number
18,332 1,051
19,845 1,051
23,062 1,051
24,688 1,051
25,847 1,051
27,274 1,051
27,680 1,051
29,179 1,051
29,621 1,051
28,714 1,051
29,911 1,051
Spring 2007
Median number
17,152 1,029
19,373 1,029
21,915 1,029
23,253 1,029
24,086 1,029
26,279 1,029
27,038 1,029
27,828 1,029
29,412 1,029
26,543 1,029
26,681 1,029
Career Development and College Preparation 2 0 0 9 | 27
Trend lines in Figures 1 and 2 follow a similar pattern for all cohorts indicating no major differences in wage trends from cohort to cohort. The trend lines for each cohort in Figure 1 suggest that reported wages began a slight decline just before the academic year in which cohort members took their first CDCP course(s), then “bottomed out” in the academic year corresponding to the cohort term. For example, academic year 2005-2006 is the year in which the fall 2005 and spring 2006 cohorts took their initial CDCP course(s) and the trend line for each of those cohorts bottoms out in academic year 2005-2006. The trend lines appear to rebound upward after the cohort academic year. This rebound effect could reflect increased wages, more work hours, or both. However, incomplete data in the post-CDCP years make it difficult to interpret the upward trends. Such incomplete data pose the “censored data” problem for data analysts. Because the post-CDCP wage data are from fairly recent quarters, it is difficult to tell whether the upward trends will continue and to what extent post-CDCP wages might increase. Note: These data are referred to as “censored” because researchers must characterize observations that contain a time constraint as limited in their content. That is, the observed students have not had an adequate span of time in which to exhibit the intended program effect (wage change). For more information, see Singer, J.D. and Willett, J.B. (2003). Applied Longitudinal Data Analysis. Oxford University Press: New York. Although caution must be used when interpreting trends shown in Figure 1, the downward slopes just prior to the CDCP enrollment years could indicate declines in reported wages (e.g., because of fewer hours worked or perhaps job loss) that might prompt enrollment in community college courses. While only first-time California Community Colleges students were included in the cohorts, the declines might also signal some sort of academic enrollment prior to the initial term (e.g., noncredit courses, enrollment at other institutions) that resulted in a wage decline. Recall that trend lines in Figure 2 reflect median wages for students who had wages reported in all years under consideration, which indicates that these students were employed at least part time during all reported years prior to their CDCP enrollments. From academic year 1997-98 onward the trend lines tend to
28 | California Community Colleges Chancellor’s Office
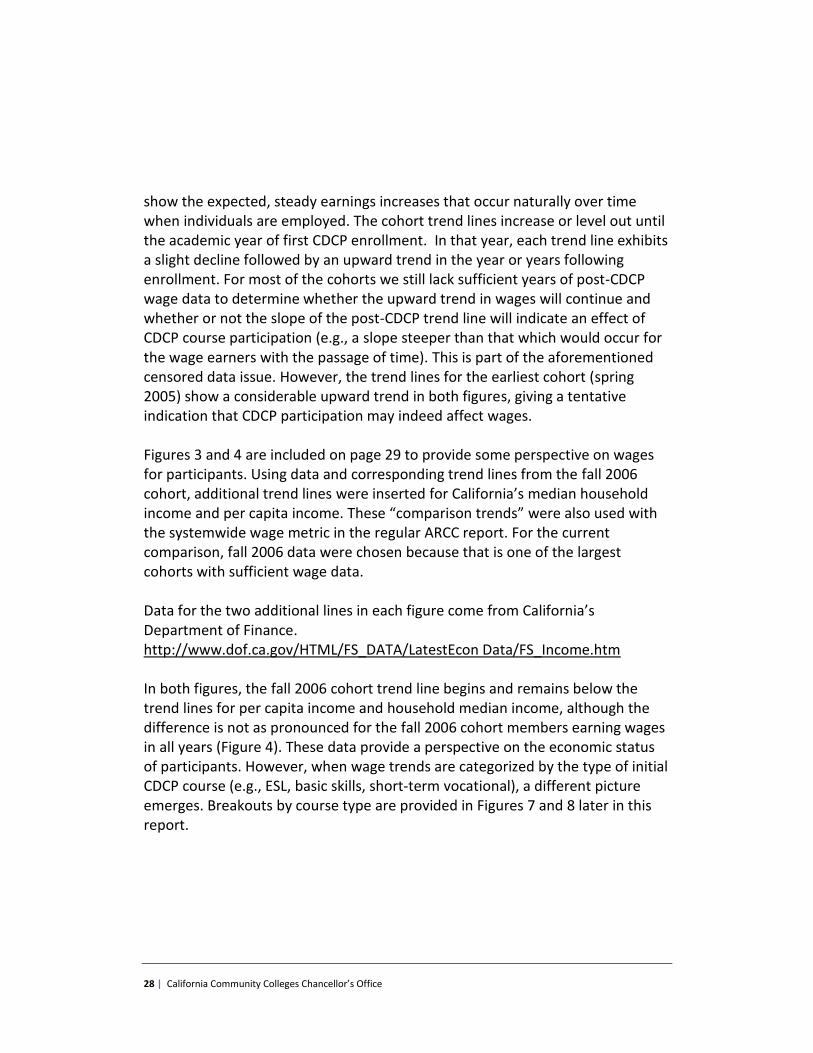
show the expected, steady earnings increases that occur naturally over time when individuals are employed. The cohort trend lines increase or level out until the academic year of first CDCP enrollment. In that year, each trend line exhibits a slight decline followed by an upward trend in the year or years following enrollment. For most of the cohorts we still lack sufficient years of post-CDCP wage data to determine whether the upward trend in wages will continue and whether or not the slope of the post-CDCP trend line will indicate an effect of CDCP course participation (e.g., a slope steeper than that which would occur for the wage earners with the passage of time). This is part of the aforementioned censored data issue. However, the trend lines for the earliest cohort (spring 2005) show a considerable upward trend in both figures, giving a tentative indication that CDCP participation may indeed affect wages. Figures 3 and 4 are included on page 29 to provide some perspective on wages for participants. Using data and corresponding trend lines from the fall 2006 cohort, additional trend lines were inserted for California’s median household income and per capita income. These “comparison trends” were also used with the systemwide wage metric in the regular ARCC report. For the current comparison, fall 2006 data were chosen because that is one of the largest cohorts with sufficient wage data. Data for the two additional lines in each figure come from California’s Department of Finance. http://www.dof.ca.gov/HTML/FS_DATA/LatestEcon Data/FS_Income.htm In both figures, the fall 2006 cohort trend line begins and remains below the trend lines for per capita income and household median income, although the difference is not as pronounced for the fall 2006 cohort members earning wages in all years (Figure 4). These data provide a perspective on the economic status of participants. However, when wage trends are categorized by the type of initial CDCP course (e.g., ESL, basic skills, short-term vocational), a different picture emerges. Breakouts by course type are provided in Figures 7 and 8 later in this report.
Career Development and College Preparation 2 0 0 9 | 29
0
10,000
20,000
30,000
40,000
50,000
60,000
Wag
es
Academic Year
Figure 3Fall 2006 CDCP Cohort Wages and Comparison Trends
(includes years with zero wages)
CDCP Median Fall 2006
CA Per Capita
CA Median Household
0
10,000
20,000
30,000
40,000
50,000
60,000
Wag
es
Academic Year
Figure 4Fall 2006 CDCP Cohort Wages and Comparison Trends
(wages in all years)
CDCP Median Fall 2006
CA Per Capita
CA Median Household
30 | California Community Colleges Chancellor’s Office
3. What is the wage trend (pre-completion/post completion) for students who complete some threshold of CDCP hours?
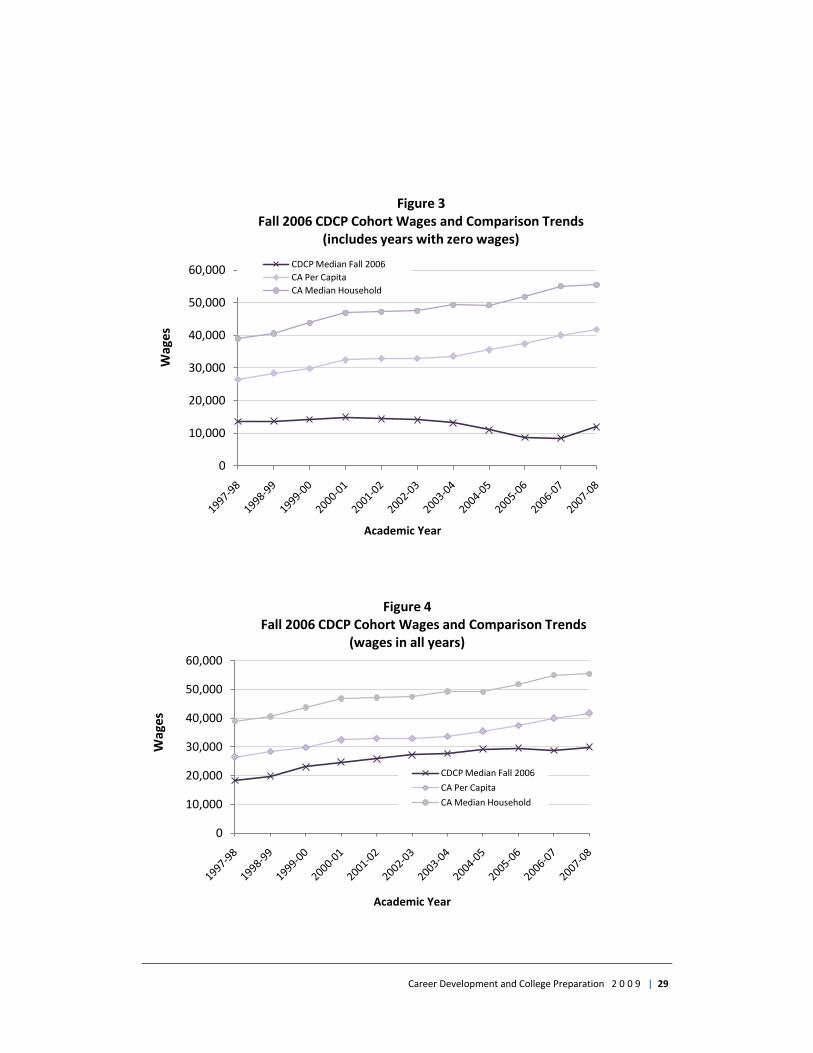
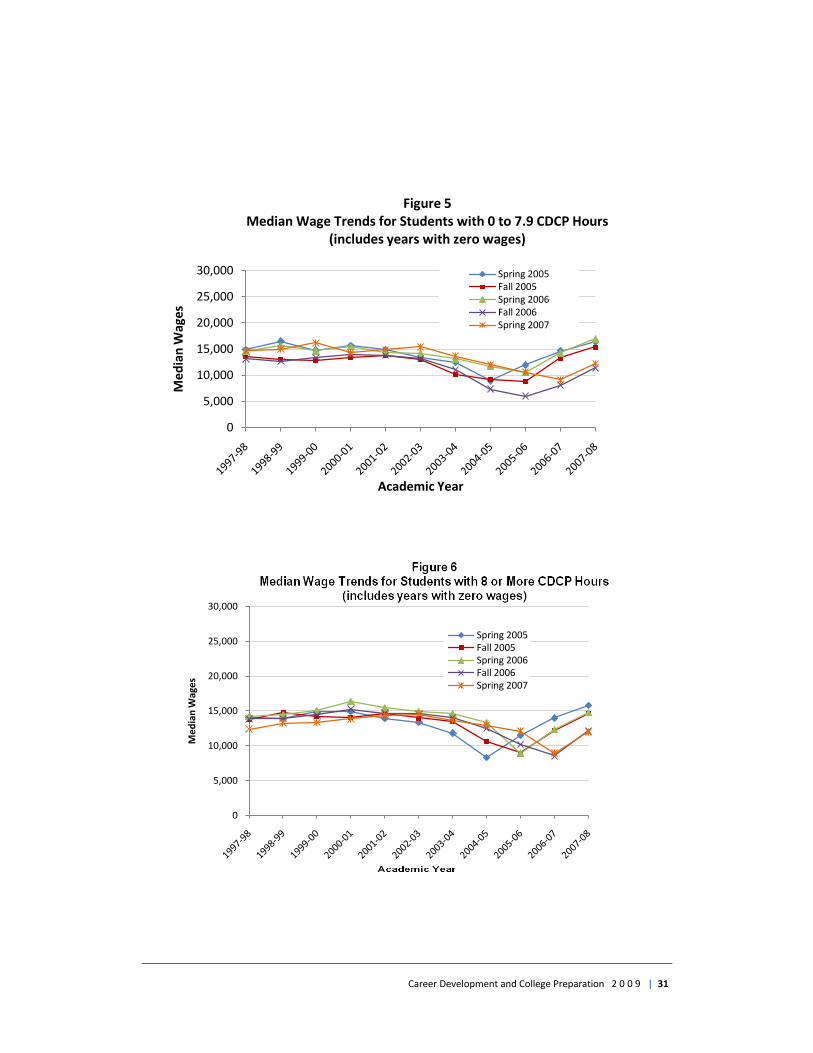
Wage trends for all cohort members (i.e., including those with zero wages reported in some years) are presented in Figures 5 and 6. Figure 5 shows the trends for those with 0 to 7.9 CDCP positive attendance hours , while Figure 6 shows the trends for students with 8 or more CDCP positive attendance hours. Students taking 0 to 7.9 CDCP hours (Figure 5) tended to have median wage trends similar to those for students taking 8 or more CDCP hours (Figure 6), with the exception of the fall 2006 cohort where the median wages for students taking fewer hours were considerably lower than for those taking 8 or more hours. Note that the wage data for students taking fewer hours were slightly more volatile, possibly due to fewer numbers of students in this group across all cohorts. When the CDCP analysis began in 2008, the wage data were catogorized by threshold hours to determine if there was a logical “cutoff” point that indicated how CDCP hours affected wages. The trend lines in Figures 5 and 6 provide little rationale for this cutoff. However, threshold hours may still affect persistence, as indicated by the fall term persistence patterns seen in Table 3. Therefore, data should continue to be analyzed by threshold hours in subsequent reports and perhaps conduct more in-depth analyses, resources permitting. Future analyses to explore threshold hours should include more than two categories. What is clear in Figures 5 and 6 is the “rebound” effect of participation where the post-CDCP trend lines appear to slope more steeply upward than the pre-CDCP trend lines. In the absence of more post-CDCP data points one cannot definitively conclude a program effect. However, these trends will be of interest in future analyses.
Career Development and College Preparation 2 0 0 9 | 31
0
5,000
10,000
15,000
20,000
25,000
30,000
Me
dia
n W
age
s
Academic Year
Figure 5Median Wage Trends for Students with 0 to 7.9 CDCP Hours
(includes years with zero wages)
Spring 2005Fall 2005Spring 2006Fall 2006Spring 2007
0
5,000
10,000
15,000
20,000
25,000
30,000
Me
dia
n W
age
s
Spring 2005Fall 2005Spring 2006Fall 2006Spring 2007

32 | California Community Colleges Chancellor’s Office
4. What happened to wages for students taking courses “retro-coded” as CDCP (i.e., CDCP courses prior to enhanced funding) compared to those taking courses after funding was implemented?
While the current data are still insufficient to address this question, these data should be available via future Employment Development Department matches and should then allow a comparison specified in Question 4.
5. What happened to wages for students in the various CDCP courses/programs (e.g., short-term vocational with high employment potential, CDCP ESL, etc.)?
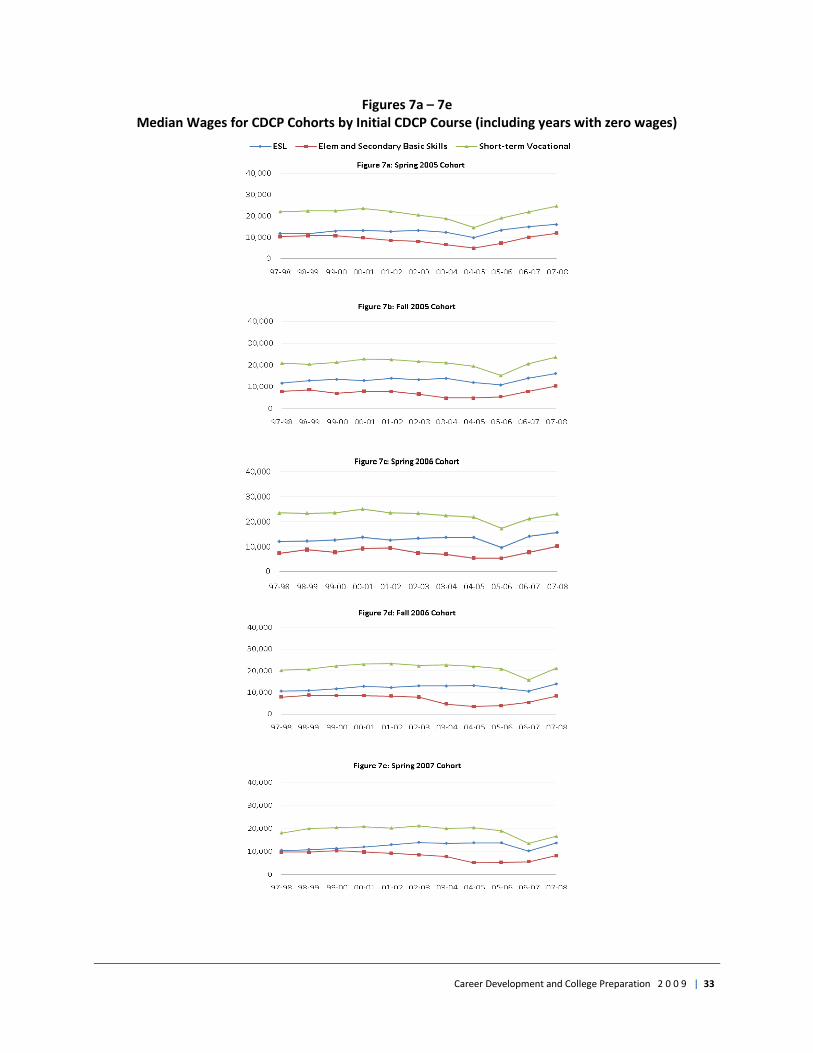
Figures 7a to 7e show the median wage trends by type of initial CDCP course in which the student enrolled for the five cohorts with sufficient data for analysis. The legend at the top of the page indicates the type of initial course: ESL, elementary and secondary basic skills, or short-term vocational. The median wage trends shown in Figures 7a through 7e include students who may have had zero wages reported in one or more academic years. While the trend lines in Figures 7a to 7e tend to follow similar patterns over time, students who took at least one short-term vocational course as their initial course(s) clearly had higher wages before and after participation than students taking basic skills or ESL as their initial CDCP course. Students taking at least one ESL CDCP course tended to have slightly higher wages than those enrolling in basic skills CDCP courses.
Career Development and College Preparation 2 0 0 9 | 33
Figures 7a – 7e Median Wages for CDCP Cohorts by Initial CDCP Course (including years with zero wages)
34 | California Community Colleges Chancellor’s Office
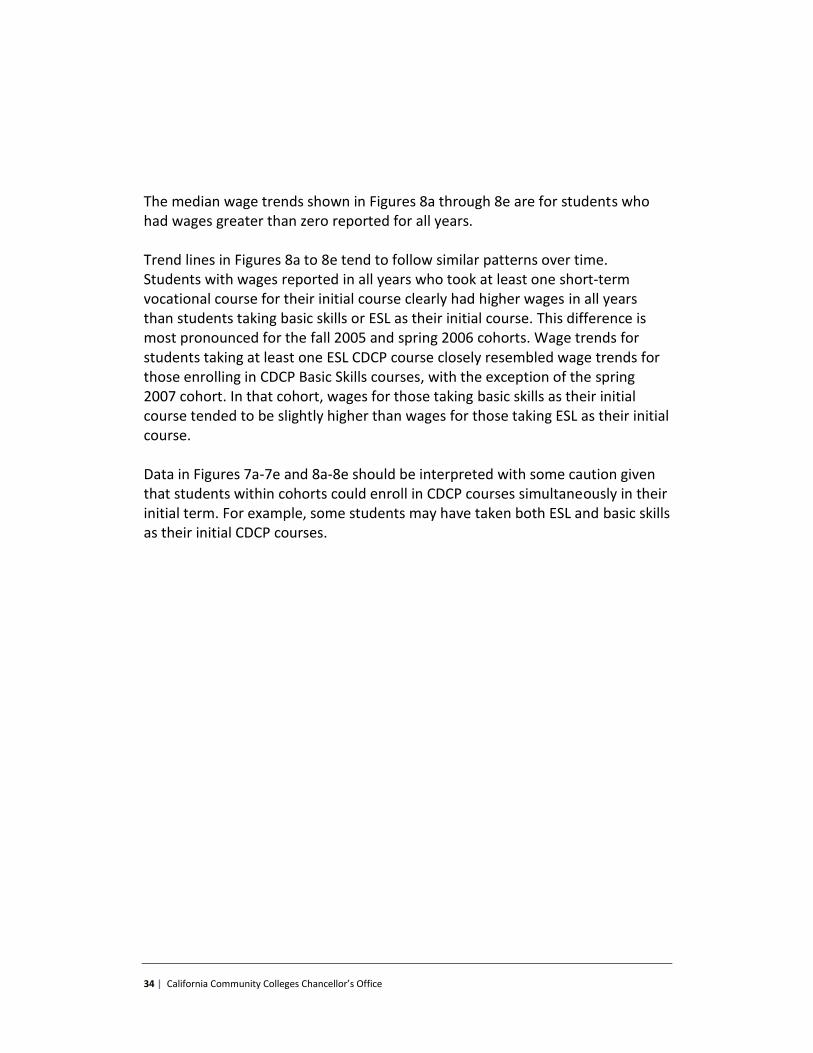
The median wage trends shown in Figures 8a through 8e are for students who had wages greater than zero reported for all years. Trend lines in Figures 8a to 8e tend to follow similar patterns over time. Students with wages reported in all years who took at least one short-term vocational course for their initial course clearly had higher wages in all years than students taking basic skills or ESL as their initial course. This difference is most pronounced for the fall 2005 and spring 2006 cohorts. Wage trends for students taking at least one ESL CDCP course closely resembled wage trends for those enrolling in CDCP Basic Skills courses, with the exception of the spring 2007 cohort. In that cohort, wages for those taking basic skills as their initial course tended to be slightly higher than wages for those taking ESL as their initial course. Data in Figures 7a-7e and 8a-8e should be interpreted with some caution given that students within cohorts could enroll in CDCP courses simultaneously in their initial term. For example, some students may have taken both ESL and basic skills as their initial CDCP courses.
Career Development and College Preparation 2 0 0 9 | 35
Figures 8a – 8e
Median Wages for CDCP Cohorts by Initial CDCP Course (wages in all years)
36 | California Community Colleges Chancellor’s Office
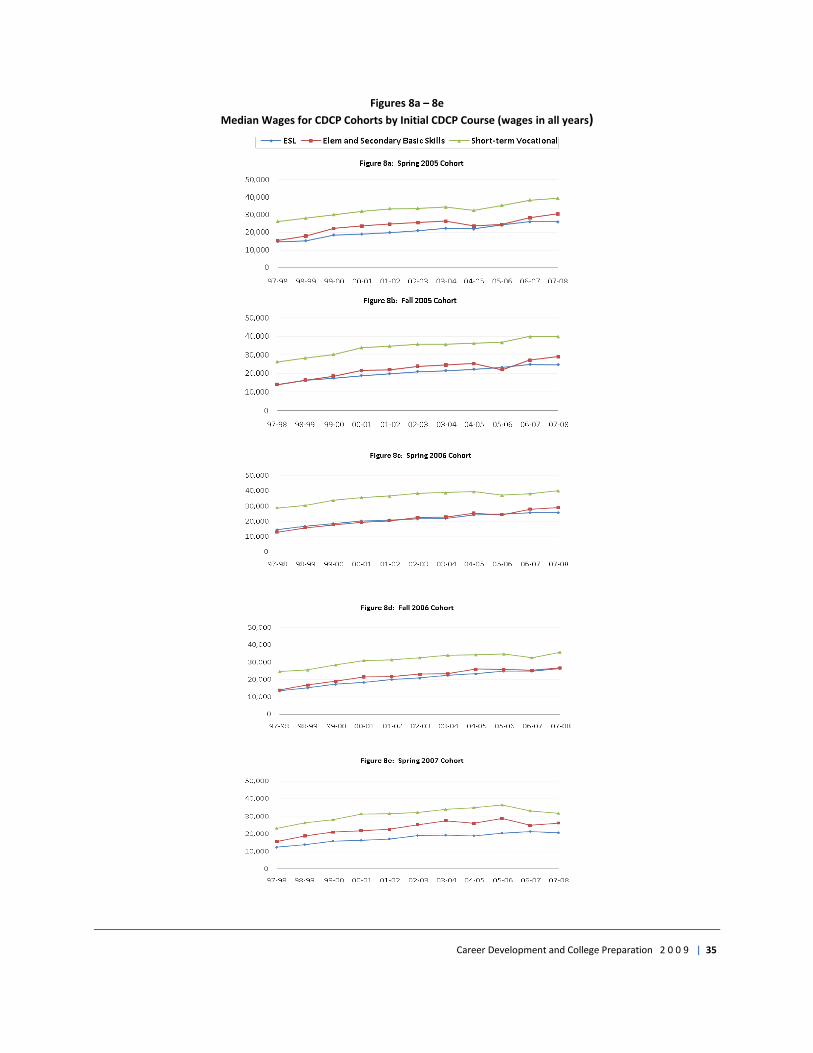
6. What percentage of CDCP students moved from zero wages reported to greater than zero wages?
Table 12
Percentages of Cohort Members with Zero reported Wages Before CDCP Participation and
Greater than Zero Wages following CDCP Participation Cohort/Term Number with
EDD SSN Match
Number moving from zero annual wages before CDCP to GT zero after
CDCP
Percent moving from zero annual wages to
GT zero after CDCP
Spring 2005 8,247 2,708 32.8
Fall 2005 8,721 2,560 29.4
Spring 2006 7,354 2,239 30.4
Fall 2006 9,291 2,494 26.8
Spring 2007 7,887 737 9.3
Within each cohort, about 26% to 30% of the students moved from zero reported wages in all years prior to their participation to wages reported in years following CDCP enrollment. The spring 2007 cohort presents an exception given that there are fewer years of post-CDCP data to draw upon. Keep in mind that cohort members who are self-employed would also have no wages reported to the Employment Development Department (and no Employment Development Department wage match), so the percentages shown in Table 12 may actually underestimate the percentages of students who began or increased earnings following CDCP participation.
Career Development and College Preparation 2 0 0 9 | 37
Discussion and Conclusions Given the limitations of the CDCP data listed earlier in this report, conclusions about the effects of the program on persistence and wages are tentative. Further, this was primarily a descriptive study of a program in its early stages of implementation so more complex analyses (e.g., comparison groups, significance tests) were not attempted at this time. For the CDCP persistence outcome measure, the following conclusions are made from the term-to-term persistence presentations on pages 11-21.
The percentage of students persisting ranged from 28% to 44% depending on the cohort.
Across cohorts with complete data, the percentage of students persisting to credit was around 5% to 13% -- substantially less than the overall percentages of those persisting.
In general, slightly higher percentages of those taking 8 or more CDCP
hours persisted, especially to noncredit.
Relatively high percentages of students who persisted in noncredit or credit to a following term took one or more CDCP ESL courses during their initial term; usually more than 60% of those persisting took an ESL course in their cohort term.
When persistence to credit was analyzed, relatively high percentages of persisting students took a CDCP Basic Skills course during their initial term.
While the percentage of students persisting to credit was relatively small, students who moved to credit achieved high success rates in their subsequent attempts at credit courses. Over 80% of CDCP students who attempted subsequent credit courses earned units in those courses.
38 | California Community Colleges Chancellor’s Office
For the CDCP wage outcome measure, the following general conclusions are indicated from the wage trends data beginning on page 23.
Employment Development Department matches for wage data occurred for about 28 to 34% of the students in the spring 2005 through spring 2007 cohorts.
Regarding the overall effects of CDCP participation on wages, it’s important to note at the outset that reported wages for our CDCP participants appear to be relatively low when we use California’s Per Capita Income trend as a “comparison.”
For the wage trend analysis we examined wage data under two
conditions: median wages for all cohort members even if they had no reported wages in some of the pre-CDCP and post-CDCP years and median wages for cohort members with reported wages in all years. The latter condition was selected to reflect CDCP participants with continuous employment (i.e., in the workforce) with full-time or part-time jobs.
The wage trends for the cohorts show a slight “drop” in median wages in
the year(s) just before the academic year in which the participants took their initial CDCP course.
A median wage “rebound” tended to follow the wage decline described in the previous paragraph.
Students taking 0 to 7.9 CDCP hours tended to have median wage trends similar to those for students taking 8 or more CDCP hours.
Students taking short-term vocational courses had higher median wages across all academic years compared to those taking basic skills or ESL courses.
Each course type (ESL, basic skills, short-term vocational) showed a slight
wage decline just prior to and including the cohort year and a rebound following enrollment.
Career Development and College Preparation 2 0 0 9 | 39
So, what do these results tell us about the effects of enhanced funding for noncredit courses in terms of wages and persistence? As previously mentioned, CDCP was implemented recently (2006-07), and the data used in this report serve primarily as “analog data” for CDCP participation. Courses that had been “retro-coded” as CDCP via a major data improvement effort by the community colleges were used. In addition, most of the cohort members took their CDCP courses prior to the distribution of enhanced funding for noncredit courses and prior to the course “sequencing” intended to lead to one of the two noncredit certificates. If there is a CDCP program effect based on course sequencing and achievement of noncredit certificates of completion or competency, these students did not experience that effect in full. There are, however, some tentative indications that CDCP-coded courses positively affect persistence, especially for students whose first courses were classified as ESL or basic skills. Further, while the percentages of students persisting to credit courses were low, the “persisters” proved quite successful in their credit courses. The wage data analyses do not show any dramatic effects of CDCP participation, but there was evidence of an upward “bump” or “rebound” in wages following the cohort years which is encouraging. Without more post-CDCP wage data one cannot draw definitive conclusions. Resources permitting, future evaluations of the effects of CDCP courses should include comparisons with outcomes for students taking noncredit courses that are not part of the CDCP sequences as well as comparable population groups that do not take any California Community Colleges courses, noncredit or otherwise. Wage data for several years beyond actual implementation of the program should also be analyzed. Because both the wages and the use of CDCP could have a geographic element in them, another study may help test for a possible locational dimension in CDCP effects. Finally, while beyond the scope of this supplemental report, other researchers may want to study the ways that colleges implement and deliver their CDCP programs. Areas for examination include the numbers and sequences of courses leading to CDCP certificate attainment and corresponding effects on outcomes.
40 | California Community Colleges Chancellor’s Office
Researchers might want to examine whether CDCP courses differ from regular noncredit courses in content or delivery as well as explore the effects of enhanced funding on access to courses (e.g., providing more courses and sections). If sufficient resources are available, future evaluations should focus on any additional efforts to deliver new “enhanced noncredit” services to meet SB 361’s requirements for helping students transition to degree-applicable coursework or improve their employability and job opportunities. The possible analyses of CDCP effects could extend well beyond the options mentioned above if stakeholders wish to do so. In this sense, any future analysis would benefit from the development of a so-called “logic model” that often guides program evaluation strategies. For more information on logic models in evaluation, see Reisman, Jane, Ph.D. & Clegg, Judith (2000). Outcomes for Success! Seattle, Washington: Organizational Research Services, Inc. & Clegg and Associates, Inc.
Career Development and College Preparation 2 0 0 9 | 41
Acknowledgements Chancellor Jack Scott would like to acknowledge and thank those who have made significant contributions to this report.
ARCC TECHNICAL ADVISORY GROUP The alphabetical list below represents the active participants in 2008 and their affiliations at that time.
Michelle Barton, Palomar College Steve Boilard, Legislative Analyst’s Office (California)
Gari Browning, College of the Desert Jim Fillpot, Chaffey College
Janet Fulks, Bakersfield College Anna Garza, North Orange Community College District
Craig Hayward, Cabrillo College Robert Johnstone, Foothill College
Edward Karpp, Glendale Community College Jonathan Lee, California Department of Finance
Jean-Marie McKinney, California Department of Finance Wim McSpadden, Butte-Glenn Community College District
Kenneth Meehan, Fullerton College Bill Scroggins, College of the Sequoias
Paul Steenhausen, Legislative Analyst’s Office (California) Thomas Todd, California Department of Finance
CHANCELLOR’S OFFICE Technology, Research, and Information Systems Division
Patrick Perry, vice chancellor for technology, research and information systems Willard Hom, director, research, analysis and accountability
Myrna Huffman, director, information systems LeAnn Fong-Batkin, policy specialist
Catharine Liddicoat, specialist, information systems Tonia Lu, specialist, information systems
Tom Nobert, specialist, information systems Alice van Ommeren, specialist, information systems
Academic Affairs Division
LeBaron Woodyard, dean, faculty/staff minimum qualifications Juan Cruz, specialist, credit and noncredit basic skills and ESL Vicki Warner, specialist, academic planning and development
Finance and Facilities Division
Erik Skinner, vice chancellor, college finance and facilities planning division
Office of Communications Terri M. Carbaugh, vice chancellor, communications
Phawnda Moore, associate editor of publications
42 | California Community Colleges Chancellor’s Office
Appendix A
Units Attempted Minus Units Earned for Select Cohorts
0 10 20 30 40
Fall 2005 Cohort: Units Attempted
Minus Units Earned
0
300
600
900
1,200
1,500
Fre
qu
ency
Career Development and College Preparation 2 0 0 9 | 43
0 10 20 30 40
Spring 2007 Cohort: Units Attempted
Minus Units Earned
0
300
600
900
1,200
1,500
Fre
qu
ency
44 | California Community Colleges Chancellor’s Office
Appendix A (continued)
0 10 20 30 40
Fall 2007 Cohort: Units Attempted
Minus Units Earned
0
300
600
900
1,200
1,500
Fre
qu
ency