Embed Size (px)
Citation preview

Rt Hon Professor the Lord KakkarThrombosis Research Institute andUniversity College London UK
Cancer Associated Thrombosis: Burden of disease

Disclosures
Grants and personal fees from Bayer Healthcare Personal fees from: Boehringer-Ingelheim Pharma, Daiichi Sankyo Europe,
Sanofi SA, Janssen Pharma

My talk today
Incidence• Medical oncology• Surgical oncology
Recurrent VTE Mortality
4
Risk for VTE varies with natural history of cancer
Rao et al., in Cancer-Associated Thrombosis. (Khorana and Francis, Eds) 2007
5
0.00.51.01.52.02.53.03.54.04.55.05.56.06.57.0
1995 1996 1997 1998 1999 2000 2001 2002 2003
Rat
e of
VTE
(%)
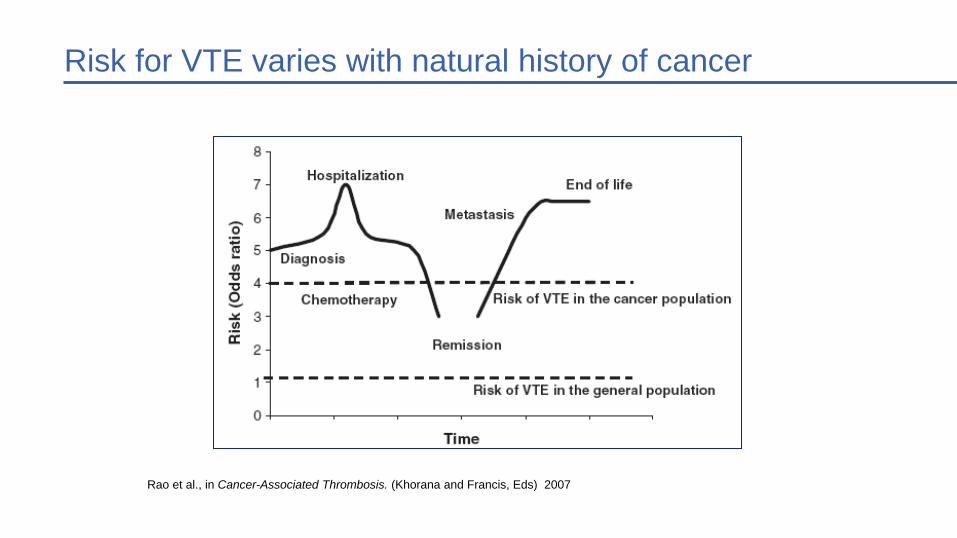
P<0.0001
Trends in VTE in hospitalized cancer patients
Khorana AA et al. Cancer. 2007.
VTE- patients on chemotherapyVTE-all patientsDVT-all patientsPE-all patients
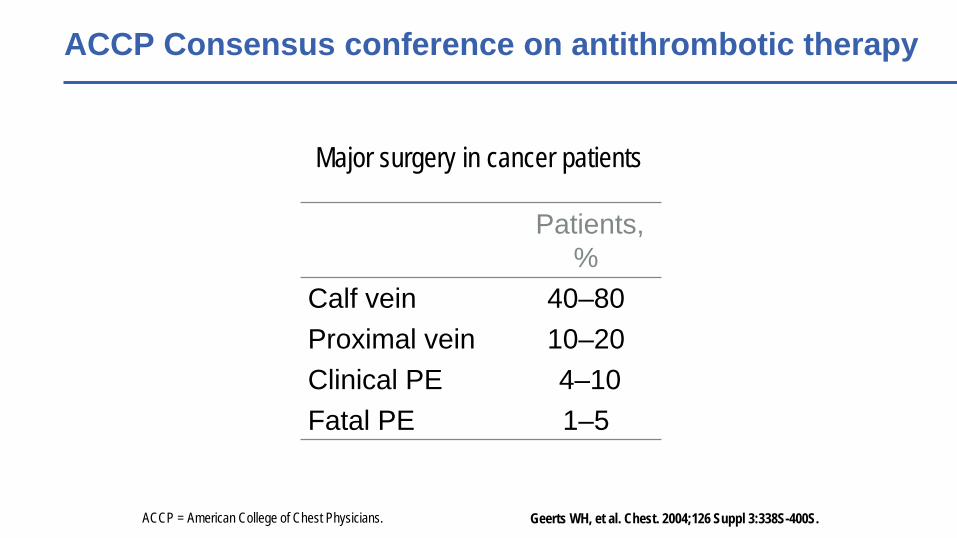
Major surgery in cancer patients
Patients, %
Calf vein 40–80Proximal vein 10–20Clinical PE 4–10Fatal PE 1–5
ACCP = American College of Chest Physicians.
ACCP Consensus conference on antithrombotic therapy
Geerts WH, et al. Chest. 2004;126 Suppl 3:338S-400S.
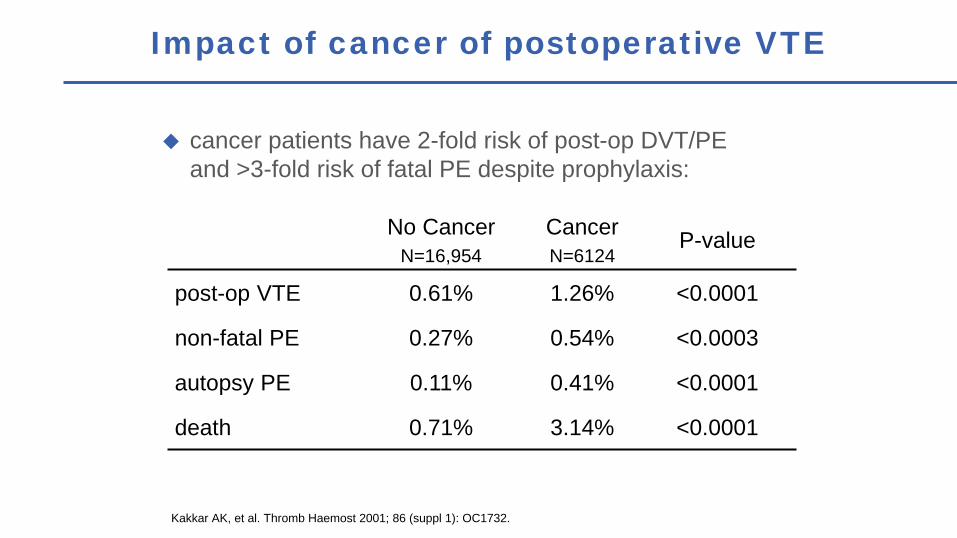
cancer patients have 2-fold risk of post-op DVT/PE and >3-fold risk of fatal PE despite prophylaxis:
Kakkar AK, et al. Thromb Haemost 2001; 86 (suppl 1): OC1732.
Impact of cancer of postoperative VTE
No CancerN=16,954
CancerN=6124
P-value
post-op VTE 0.61% 1.26% <0.0001
non-fatal PE 0.27% 0.54% <0.0003
autopsy PE 0.11% 0.41% <0.0001
death 0.71% 3.14% <0.0001
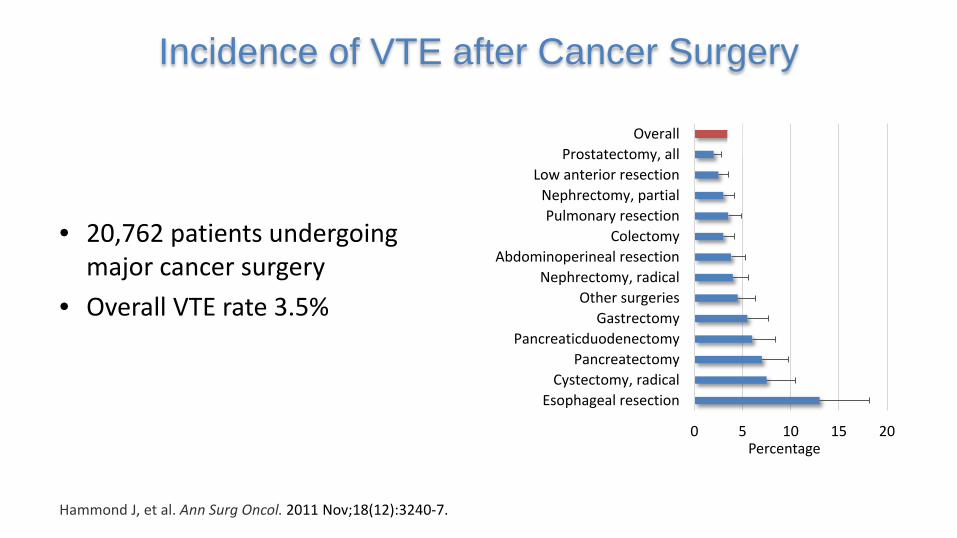
• 20,762 patients undergoing major cancer surgery
• Overall VTE rate 3.5%
Incidence of VTE after Cancer Surgery
Hammond J, et al. Ann Surg Oncol. 2011 Nov;18(12):3240-7.
0 5 10 15 20
Esophageal resectionCystectomy, radical
PancreatectomyPancreaticduodenectomy
GastrectomyOther surgeries
Nephrectomy, radicalAbdominoperineal resection
ColectomyPulmonary resection
Nephrectomy, partialLow anterior resection
Prostatectomy, allOverall
Percentage
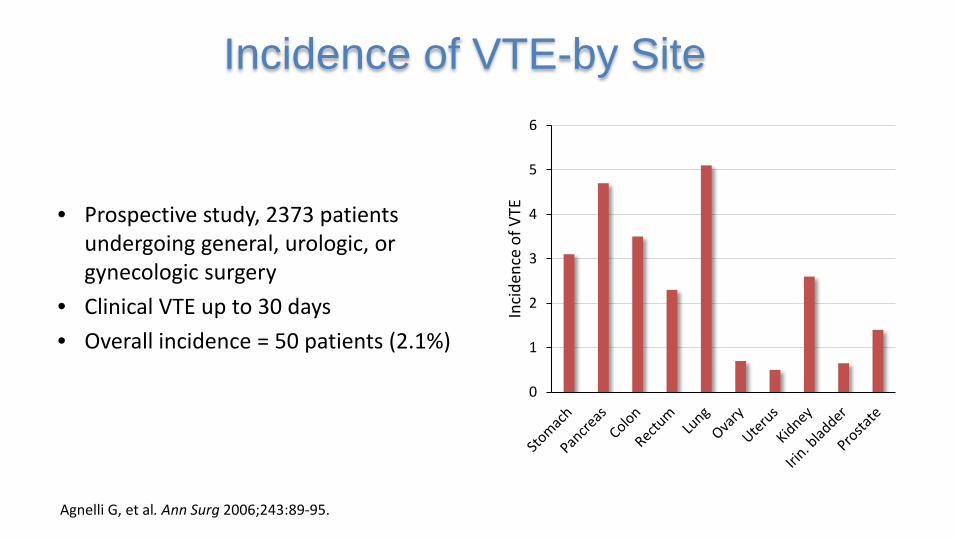
Incidence of VTE-by Site
Agnelli G, et al. Ann Surg 2006;243:89-95.
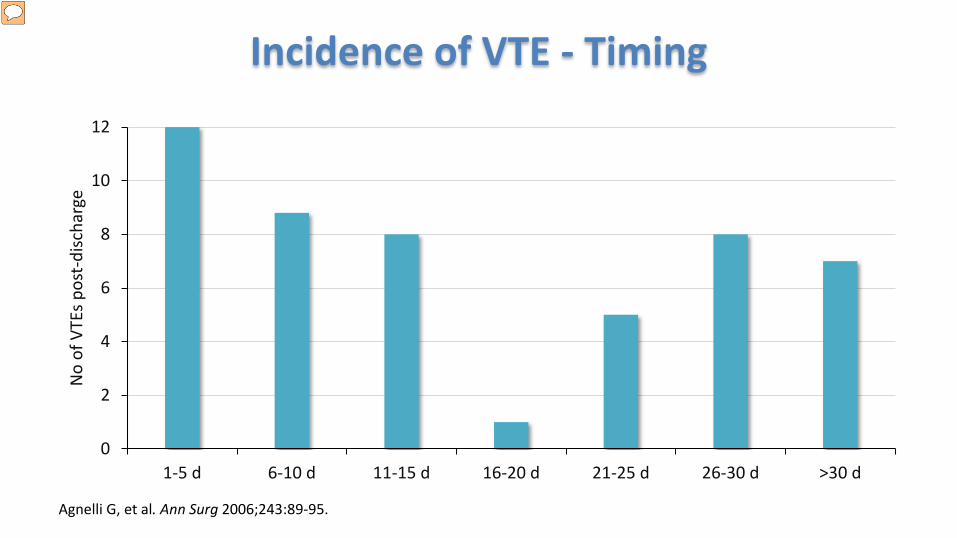
• Prospective study, 2373 patients undergoing general, urologic, or gynecologic surgery
• Clinical VTE up to 30 days• Overall incidence = 50 patients (2.1%)
0
1
2
3
4
5
6
Inci
denc
e of
VTE
0
2
4
6
8
10
12
1-5 d 6-10 d 11-15 d 16-20 d 21-25 d 26-30 d >30 d
No
of V
TEs p
ost-
disc
harg
eIncidence of VTE - Timing
Agnelli G, et al. Ann Surg 2006;243:89-95.
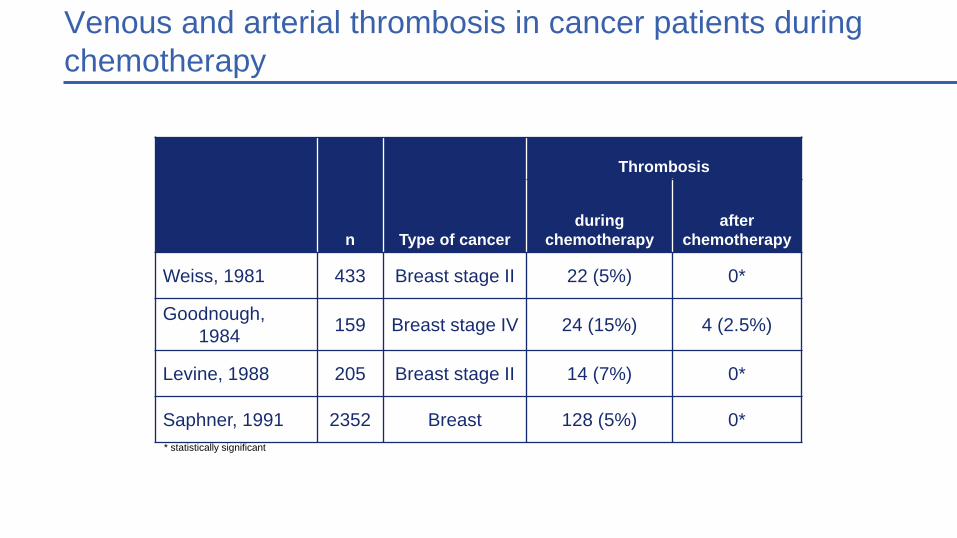
11Venous and arterial thrombosis in cancer patients during chemotherapy
n Type of cancer
Thrombosis
during chemotherapy
after chemotherapy
Weiss, 1981 433 Breast stage II 22 (5%) 0*
Goodnough, 1984 159 Breast stage IV 24 (15%) 4 (2.5%)
Levine, 1988 205 Breast stage II 14 (7%) 0*
Saphner, 1991 2352 Breast 128 (5%) 0** statistically significant
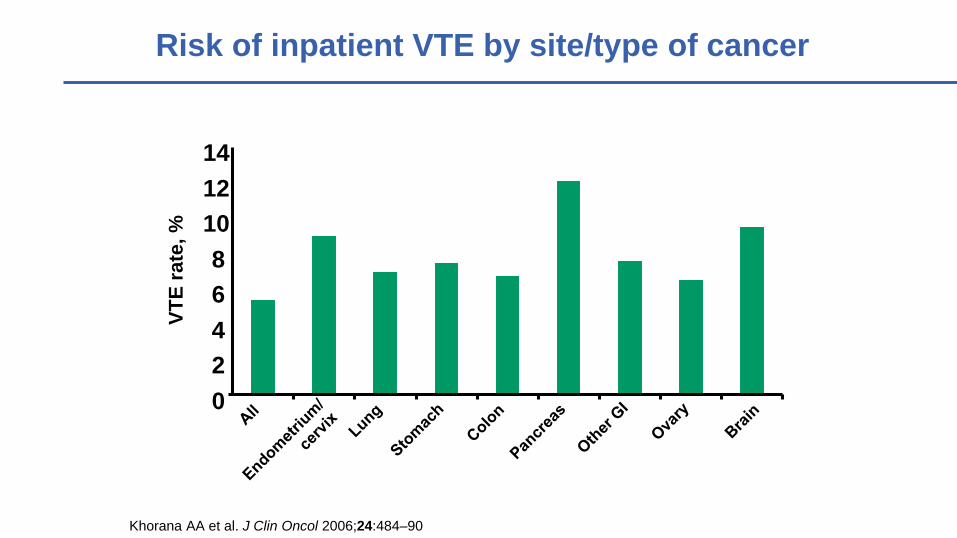
Risk of inpatient VTE by site/type of cancer
02468
101214
Khorana AA et al. J Clin Oncol 2006;24:484–90
VTE
rate
, %
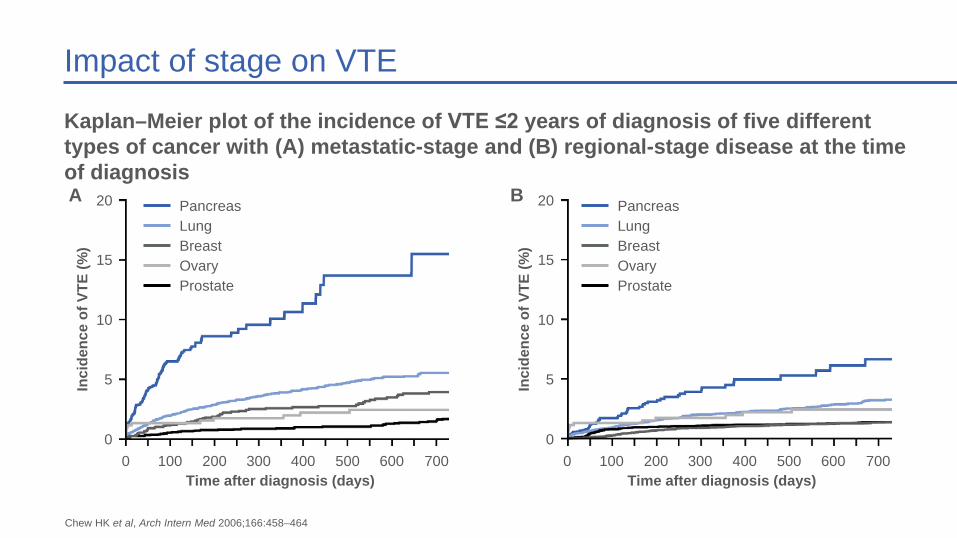
Impact of stage on VTE
Kaplan–Meier plot of the incidence of VTE ≤2 years of diagnosis of five different types of cancer with (A) metastatic-stage and (B) regional-stage disease at the time of diagnosis
Chew HK et al, Arch Intern Med 2006;166:458–464
20
15
10
5
00 100 200 300 400 500 600 700
Inci
denc
e of
VTE
(%)
Time after diagnosis (days)
A PancreasLungBreastOvaryProstate
20
15
10
5
00 100 200 300 400 500 600 700
Inci
denc
e of
VTE
(%)
Time after diagnosis (days)
B PancreasLungBreastOvaryProstate
14
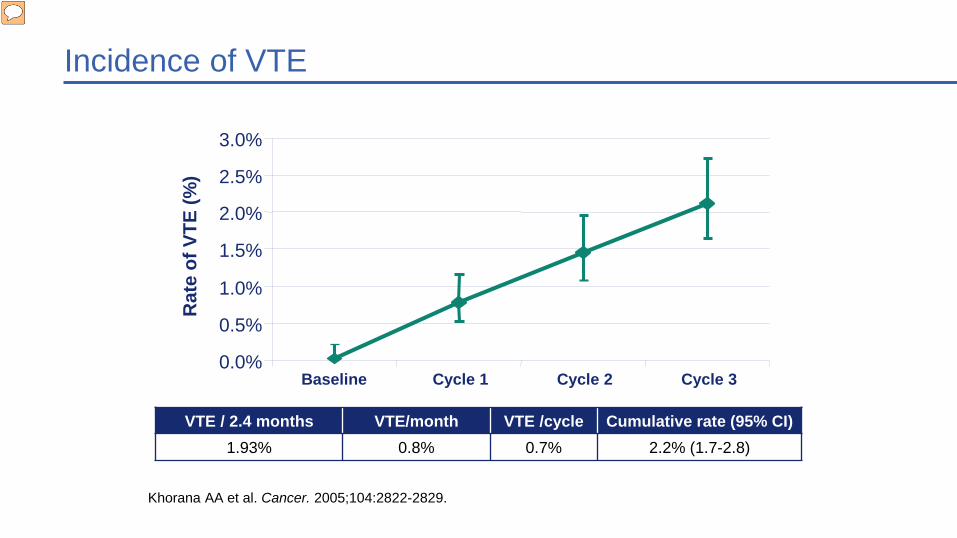
Incidence of VTE
VTE / 2.4 months VTE/month VTE /cycle Cumulative rate (95% CI)1.93% 0.8% 0.7% 2.2% (1.7-2.8)
0.0%
0.5%
1.0%
1.5%
2.0%
2.5%
3.0%
Baseline Cycle 1 Cycle 2 Cycle 3
Rat
e of
VTE
(%)
Khorana AA et al. Cancer. 2005;104:2822-2829.
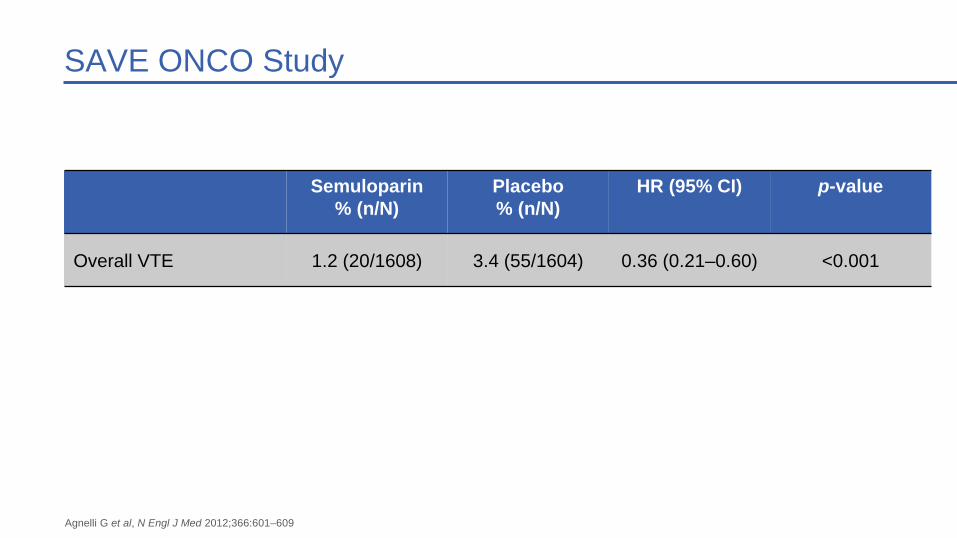
SAVE ONCO Study
Semuloparin % (n/N)
Placebo% (n/N)
HR (95% CI) p-value
Overall VTE 1.2 (20/1608) 3.4 (55/1604) 0.36 (0.21–0.60) <0.001
Agnelli G et al, N Engl J Med 2012;366:601–609
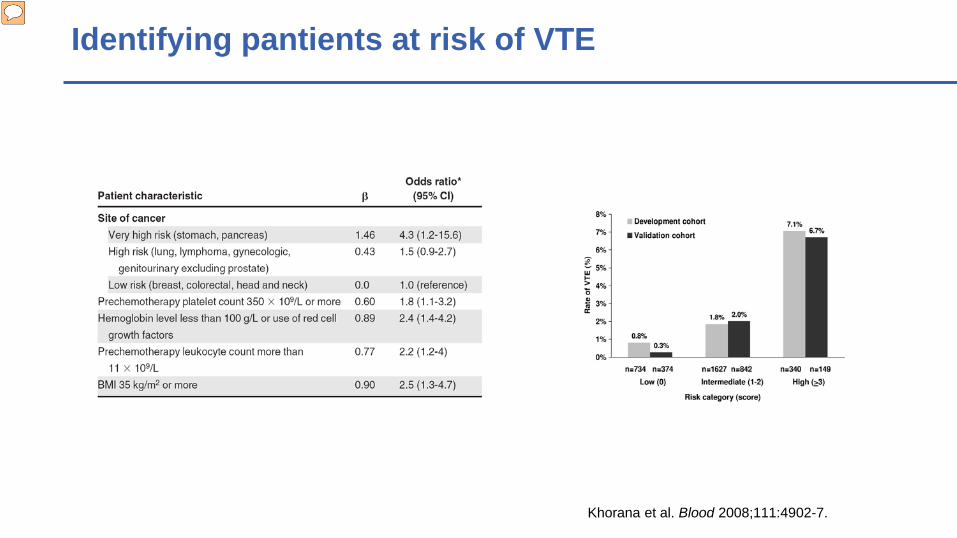
Khorana et al. Blood 2008;111:4902-7.
Identifying pantients at risk of VTE
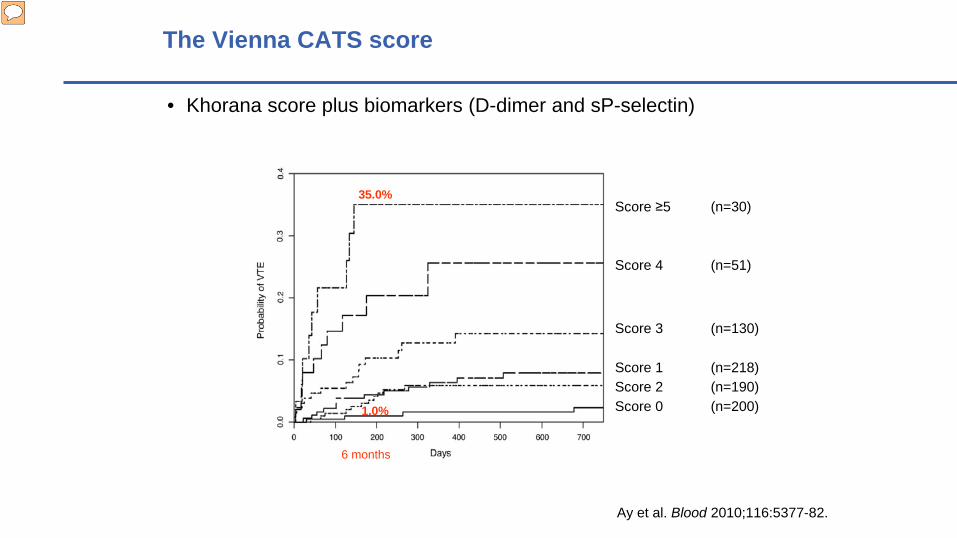
The Vienna CATS score
• Khorana score plus biomarkers (D-dimer and sP-selectin)
Ay et al. Blood 2010;116:5377-82.
Score ≥5 (n=30)
Score 4 (n=51)
Score 3 (n=130)
Score 1 (n=218)Score 2 (n=190)Score 0 (n=200)
35.0%
1.0%
6 months
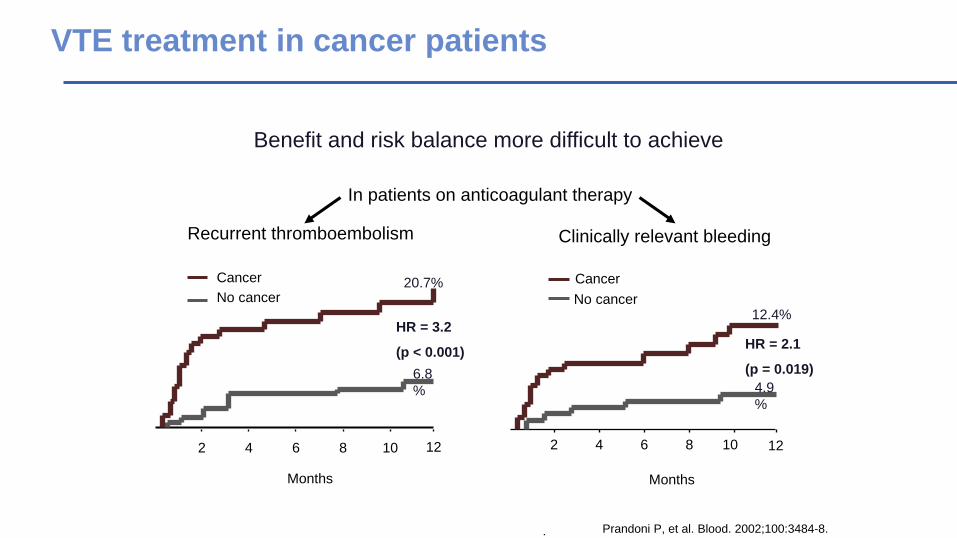
Recurrent thromboembolism Clinically relevant bleeding
.
Benefit and risk balance more difficult to achieve
In patients on anticoagulant therapy
2 4 6 8 10 12
CancerNo cancer
Months
HR = 2.1
(p = 0.019)
2 4 6 8 10 12
Cancer
Months
HR = 3.2
(p < 0.001)
No cancer20.7%
12.4%
4.9%
6.8%
VTE treatment in cancer patients
Prandoni P, et al. Blood. 2002;100:3484-8.
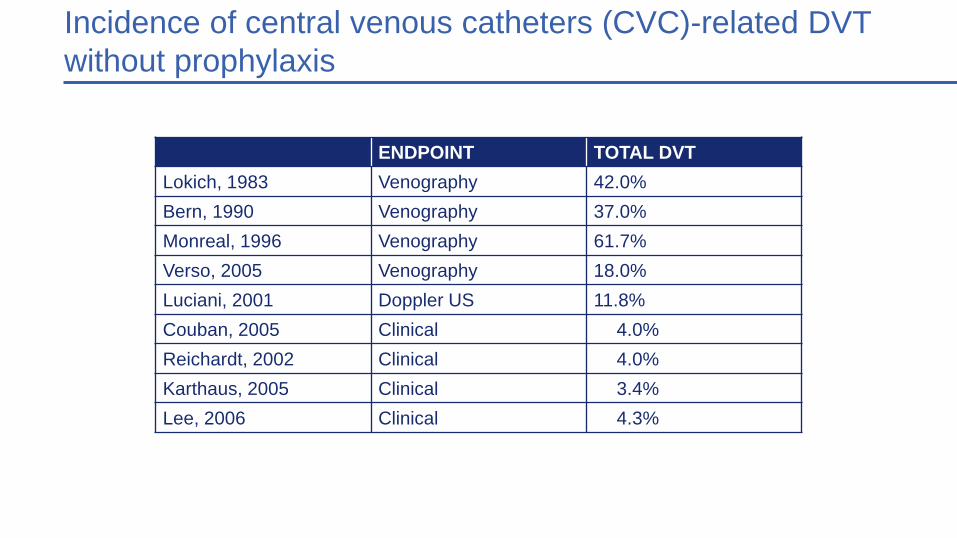
19Incidence of central venous catheters (CVC)-related DVT without prophylaxis
ENDPOINT TOTAL DVTLokich, 1983 Venography 42.0%Bern, 1990 Venography 37.0%Monreal, 1996 Venography 61.7%Verso, 2005 Venography 18.0%Luciani, 2001 Doppler US 11.8%Couban, 2005 Clinical 4.0%Reichardt, 2002 Clinical 4.0%Karthaus, 2005 Clinical 3.4%Lee, 2006 Clinical 4.3%

Risk of fatal PE or fatal bleeding in the RIETE registry1
1.4%
0.3%
2.6%
1.0%
0.0
0.5
1.0
1.5
2.0
2.5
3.0
Fatal PE Fatal bleeding
Higher rates of fatal PE and fatal bleeding in patients with cancer
1. Monreal M et al. J Thromb Haemost 2006;4:1950–1956
Perc
enta
ge o
f pat
ient
s (%
) No cancerCancer
p<0.001
p<0.001
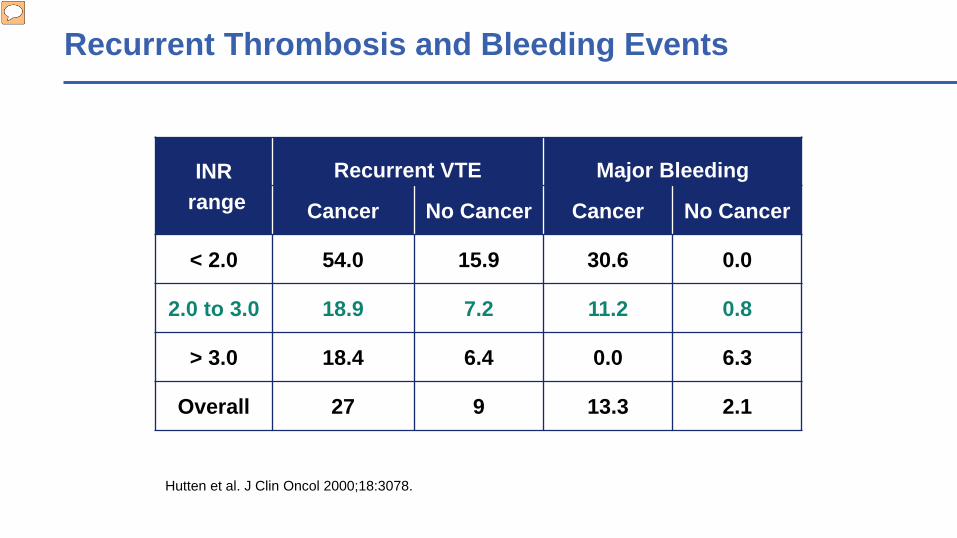
INRrange
Recurrent VTE Major Bleeding
Cancer No Cancer Cancer No Cancer
< 2.0 54.0 15.9 30.6 0.0
2.0 to 3.0 18.9 7.2 11.2 0.8
> 3.0 18.4 6.4 0.0 6.3
Overall 27 9 13.3 2.1
Recurrent Thrombosis and Bleeding Events
Hutten et al. J Clin Oncol 2000;18:3078.
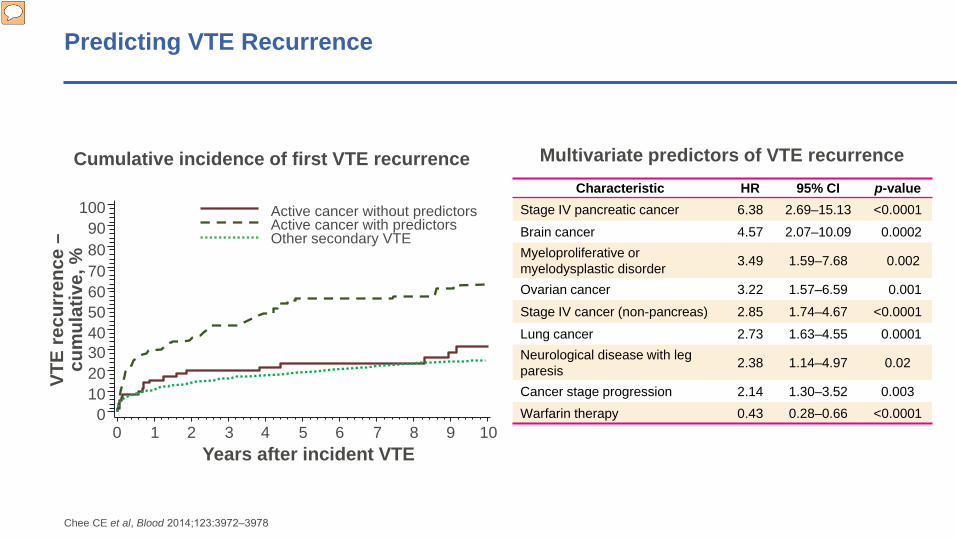
Predicting VTE Recurrence
Characteristic HR 95% CI p-valueStage IV pancreatic cancer 6.38 2.69–15.13 <0.0001Brain cancer 4.57 2.07–10.09 0.0002Myeloproliferative or myelodysplastic disorder 3.49 1.59–7.68 0.002
Ovarian cancer 3.22 1.57–6.59 0.001Stage IV cancer (non-pancreas) 2.85 1.74–4.67 <0.0001Lung cancer 2.73 1.63–4.55 0.0001Neurological disease with leg paresis 2.38 1.14–4.97 0.02
Cancer stage progression 2.14 1.30–3.52 0.003Warfarin therapy 0.43 0.28–0.66 <0.0001
Multivariate predictors of VTE recurrenceCumulative incidence of first VTE recurrence
70
VTE
recu
rren
ce –
cum
ulat
ive,
%
1009080
6050403020100
0 1 2 3 4 5 6 7 8 9 10Years after incident VTE
Active cancer without predictors Active cancer with predictors Other secondary VTE
Chee CE et al, Blood 2014;123:3972‒3978
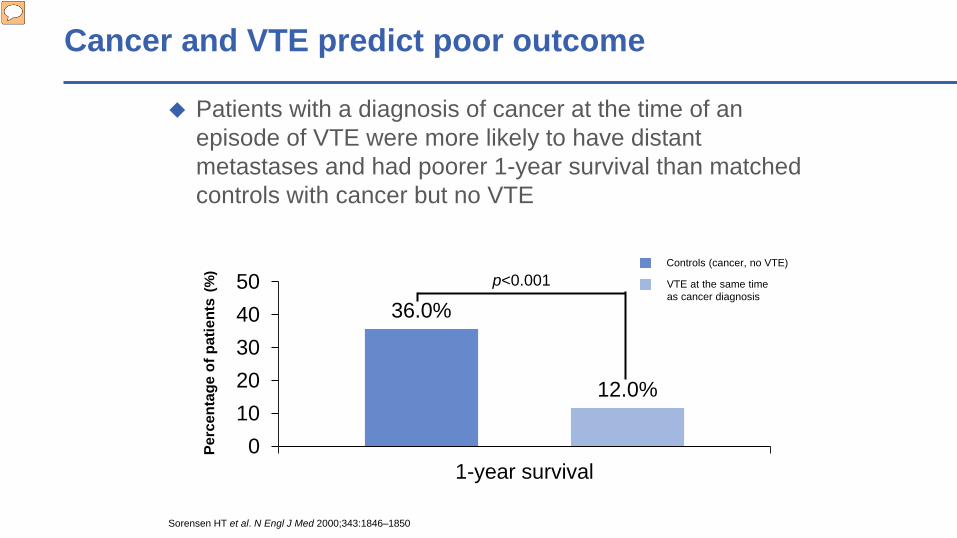
Cancer and VTE predict poor outcome
36.0%
12.0%
01020304050
1-year survival
Perc
enta
ge o
f pat
ient
s(%
)
Patients with a diagnosis of cancer at the time of an episode of VTE were more likely to have distant metastases and had poorer 1-year survival than matched controls with cancer but no VTE
1-year survival in patients with cancer and VTE versus matched controls
Sorensen HT et al. N Engl J Med 2000;343:1846–1850
p<0.001Controls (cancer, no VTE)
VTE at the same time as cancer diagnosis

Concurrent VTE and cancer increases the risk of death
Probability of death within 183 days of initial hospital admissionPr
obab
ility
of d
eath
1.00
0.80
0.60
0.40
0.20
0.00
0 40 80 120 180
Number of days
Malignant disease alone
DVT/PE and malignant disease
Levitan et al Medicine 1999
25
02468
10121416
Non-cancer Cancer
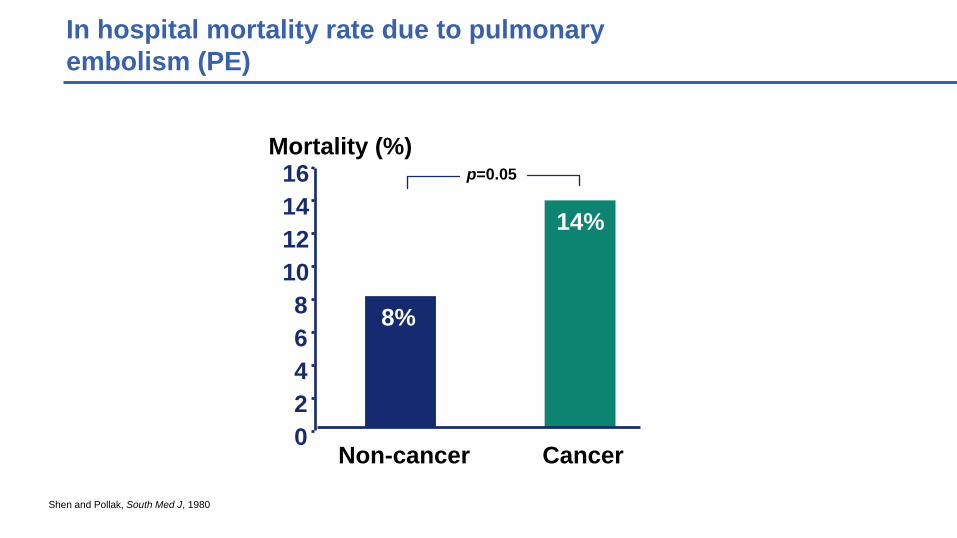
p=0.05Mortality (%)
Shen and Pollak, South Med J, 1980
8%
14%
In hospital mortality rate due to pulmonaryembolism (PE)

VTE and in-patient mortality
7.9810.59
8.67
14.85 16.13 16.41
0
2
4
6
8
10
12
14
16
18
20
All (n=66,016)
Non-metastatic cancer (n=20,591)
Metastatic cancer (n=17,360)
Mor
talit
y, %
Khorana AA et al. J Clin Oncol 2006;24:484–90
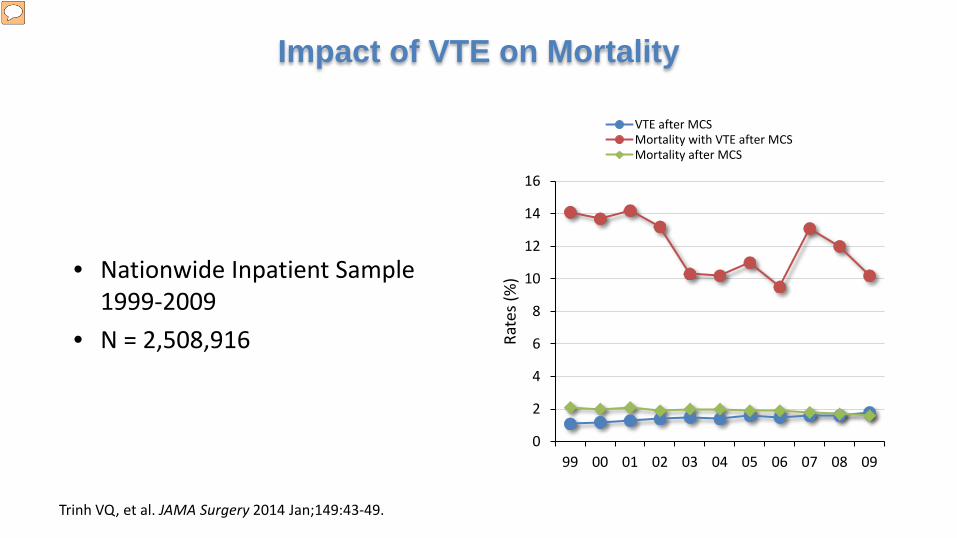
• Nationwide Inpatient Sample 1999-2009
• N = 2,508,916
Impact of VTE on Mortality
0
2
4
6
8
10
12
14
16
99 00 01 02 03 04 05 06 07 08 09
Rate
s (%
)
VTE after MCSMortality with VTE after MCSMortality after MCS
Trinh VQ, et al. JAMA Surgery 2014 Jan;149:43-49.
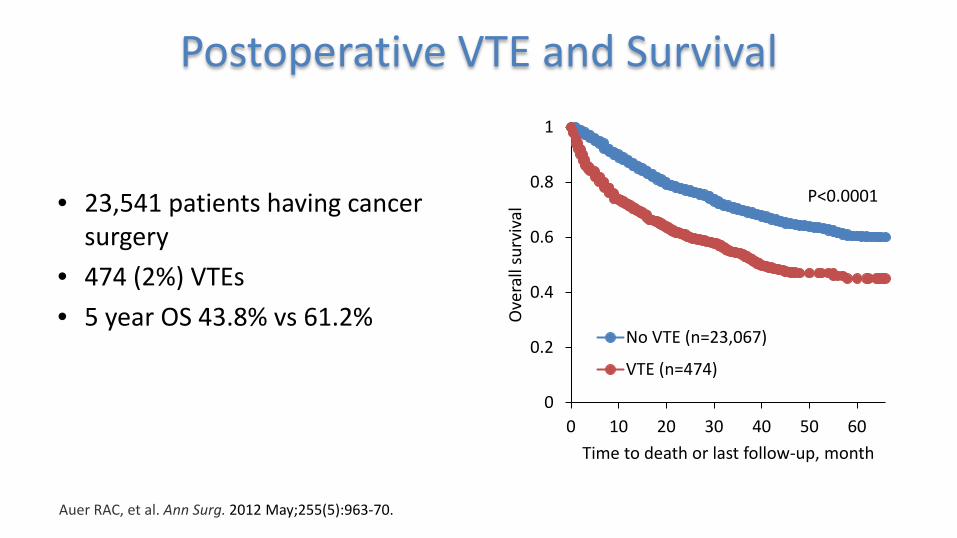
• 23,541 patients having cancer surgery
• 474 (2%) VTEs• 5 year OS 43.8% vs 61.2%
Postoperative VTE and Survival
Auer RAC, et al. Ann Surg. 2012 May;255(5):963-70.
0
0.2
0.4
0.6
0.8
1
0 10 20 30 40 50 60
Ove
rall
surv
ival
Time to death or last follow-up, month
No VTE (n=23,067)
VTE (n=474)
P<0.0001
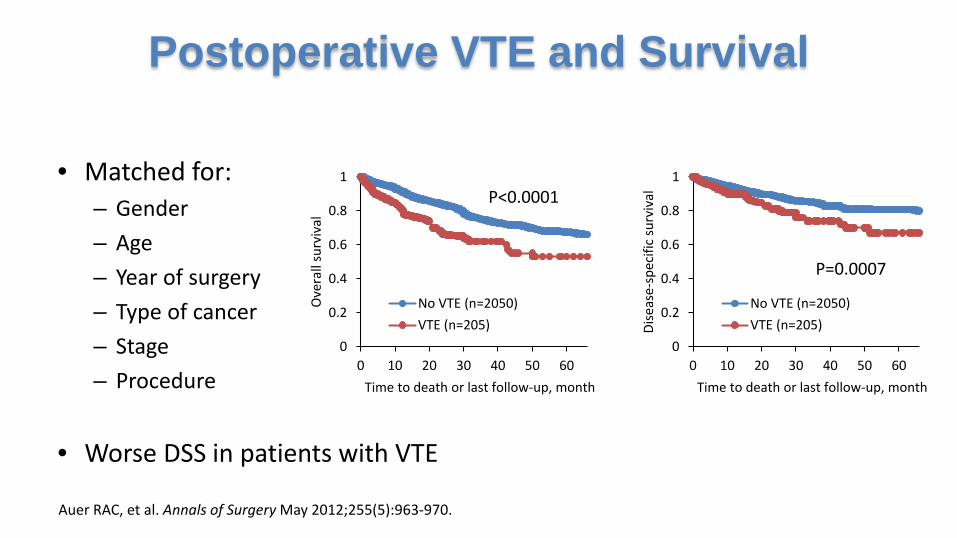
• Matched for:– Gender– Age– Year of surgery– Type of cancer– Stage– Procedure
• Worse DSS in patients with VTE
Postoperative VTE and Survival
Auer RAC, et al. Annals of Surgery May 2012;255(5):963-970.
0
0.2
0.4
0.6
0.8
1
0 10 20 30 40 50 60
Ove
rall
surv
ival
Time to death or last follow-up, month
No VTE (n=2050)VTE (n=205)
0
0.2
0.4
0.6
0.8
1
0 10 20 30 40 50 60
Dise
ase-
spec
ific
surv
ival
Time to death or last follow-up, month
No VTE (n=2050)VTE (n=205)
P<0.0001
P=0.0007
1.2 1.60.6 0.2
2
3.62.8
0.11.5
0.1
8 8.1
2
0
14.3 13.8
6.87.7
5.6
11.1
0
2
4
6
8
10
12
14
16
% o
f pat
ient
s-M
orta
lity
No VTE
VTE
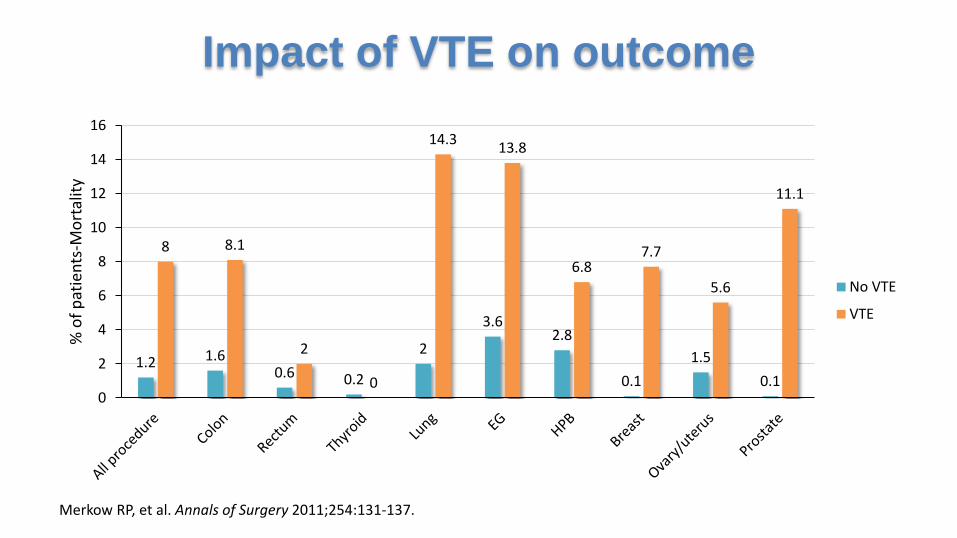
Impact of VTE on outcome
Merkow RP, et al. Annals of Surgery 2011;254:131-137.
Conclusion
Cancer is an important risk factor for VTE Impact on medical and surgical cancer patients Attended by higher risk for bleeding and recurrence Impacts mortality