Embed Size (px)
Citation preview
280
Charles University Center for Economic Research and Graduate Education
Academy of Sciences of the Czech Republic Economics Institute
José NogueraRowena A. Pecchenino
CAN A CARTEL FUEL THE ENGINEOF ECONOMIC DEVELOPMENT?
CERGE-EI
WORKING PAPER SERIES (ISSN 1211-3298) Electronic Version
Working Paper Series 280 (ISSN 1211-3298)
Can a Cartel Fuel the Engine
of Economic Development?
José Noguera
Rowena A. Pecchenino
CERGE-EI
Prague, December 2005

ISBN 80-7343-076-2 (Univerzita Karlova v Praze, CERGE) ISBN 80-7344-065-2 (Národohospodářský ústav AV ČR, Praha)
1
Can a Cartel Fuel the Engine
of Economic Development? OPEC and the macroeconomics of oil
José Noguera*
Rowena A. Pecchenino**
August 2005
Abstract
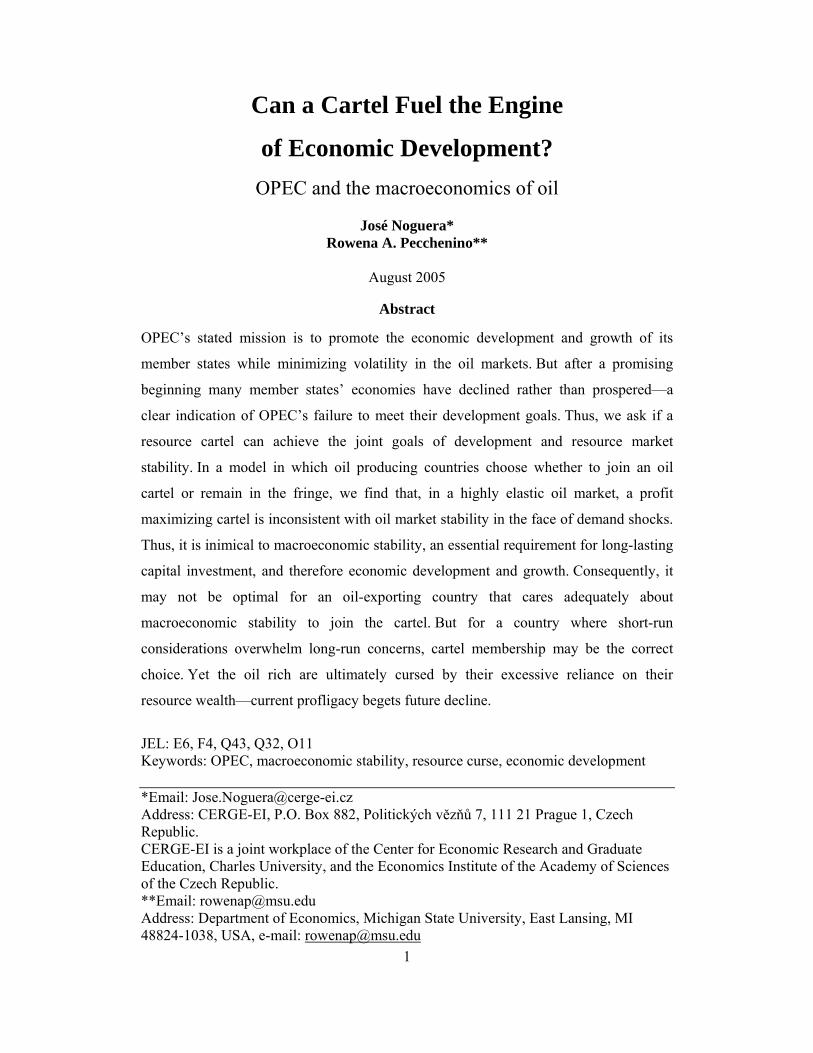
OPEC’s stated mission is to promote the economic development and growth of its
member states while minimizing volatility in the oil markets. But after a promising
beginning many member states’ economies have declined rather than prospered—a
clear indication of OPEC’s failure to meet their development goals. Thus, we ask if a
resource cartel can achieve the joint goals of development and resource market
stability. In a model in which oil producing countries choose whether to join an oil
cartel or remain in the fringe, we find that, in a highly elastic oil market, a profit
maximizing cartel is inconsistent with oil market stability in the face of demand shocks.
Thus, it is inimical to macroeconomic stability, an essential requirement for long-lasting
capital investment, and therefore economic development and growth. Consequently, it
may not be optimal for an oil-exporting country that cares adequately about
macroeconomic stability to join the cartel. But for a country where short-run
considerations overwhelm long-run concerns, cartel membership may be the correct
choice. Yet the oil rich are ultimately cursed by their excessive reliance on their
resource wealth—current profligacy begets future decline.
JEL: E6, F4, Q43, Q32, O11 Keywords: OPEC, macroeconomic stability, resource curse, economic development *Email: [email protected] Address: CERGE-EI, P.O. Box 882, Politických vězňů 7, 111 21 Prague 1, Czech Republic. CERGE-EI is a joint workplace of the Center for Economic Research and Graduate Education, Charles University, and the Economics Institute of the Academy of Sciences of the Czech Republic. **Email: [email protected] Address: Department of Economics, Michigan State University, East Lansing, MI 48824-1038, USA, e-mail: [email protected]
2
Abstrakt
Misí OPECu je prosazovat a podporovat ekonomický vývoj a růst svých členských států
a minimalizovat volatilitu na trhu ropných produktů. Po slibném začátku mnoho
ekonomik členských států výkonnostně pokleslo spíše než prosperovalo, což je
znamením selhání OPECu při plnění svých cílů. Z tohoto důvodu se ptáme jestli
surovinový kartel může dosáhnout dvou společných cílů ekonomického vývoje a
stability trhu zdrojů. V modelu, ve kterém země produkující ropu vybírají zda se přidají
k ropnému kartelu či nikoli zjišťujeme, že na vysoce elastickém trhu ropy je kartel
maximalizující zisk a vystavený poptávkovým šokům neslučitelný s tržní stabilitou.
Proto je tento škodlivý pro makroekonomickou stabilitu jakožto základní požadavek pro
dlouhotrvající kapitálové investice a tedy i ekonomický rozvoj a růst. Následně by pro
zemi exportující ropu a přiměřeně se zaměřující na makroekonomickou stabilitu
nemuselo být výhodné připojovat se ke kartelu. Na druhou stranu pro zemi, kde
krátkodobé úvahy převáží nad těmi dlouhodobými, může být členství v kartelu dobrou
volbou. Přesto jsou státy bohaté na ropu nakonec negativně ovlivněny svým přehnaným
spoléháním se na své nerostné bohatství - současná rozmařilost působí budoucí
ekonomický pokles.
3
INTRODUCTION
“OPEC is an international Organization of eleven developing countries which are heavily reliant on oil revenues as their main source of income. Membership is open to any country which is a substantial net exporter of oil and which shares the ideals of the Organization.”
“Since oil revenues are so vital for the economic development of these nations, they aim to bring stability and harmony to the oil market by adjusting their oil output to help ensure a balance between supply and demand.”
OPEC
OPEC was formed to promote economic development in its member countries and to
minimize the volatility of oil markets. To accomplish these combined goals, the cartel
uses its market power to sustain a high, stable price of oil to generate high, stable
income for its members. Yet, the recent experience of most OPEC countries has not
been one of relative prosperity but rather one of relative decline (Cordesman, 1999).
In this paper we ask a straightforward question—is it possible for OPEC to
achieve its stated goals? That is, can the cartel provide an economic environment
conducive to development and growth? Since the oil sector represents an important
share of income for oil exporting, developing countries, instability in the oil market also
means macroeconomic instability for those countries; thus, has OPEC been a useful tool
to achieve oil market, and thus macroeconomic, stability? If the answer to these two
questions is no, what is the rationale for OPEC to continue to exist? In other words, can
oil exporting developing countries do better in terms of development by joining an oil
cartel? If so, since all substantial oil exporters can choose to join, why do some
important exporting countries like Mexico, Oman, Angola and, perhaps, Russia, whose
production and development levels are similar to other countries in OPEC, choose to
4
stay in the fringe? What induces countries like Ecuador to enter and then leave shortly
thereafter? Why do Mexico, Russia, Egypt and Kazakhstan find membership
inconsistent with their domestic macroeconomic policies if membership is, indeed,
intended to jointly promote stability and economic development?
There are two important features of the international oil market worthy of
mention. First, the OPEC cartel meets twice a year, in March and September, and in
extraordinary sessions whenever it considers such sessions necessary. In those meetings,
the cartel analyzes the state of the international oil market, and sets quotas for its
member states (see www.opec.com). Thus, OPEC tries to move (preempt) the market
rather than be moved by it. OPEC’s production represents about 40% of total world oil
production. Among non-OPEC producers, Russia’s production is 12% of the world
production, and no other country produces even 5% of the total. This means that the
international oil market operates as a Stackleberg oligopoly where the OPEC cartel
plays the role of the leader. Another important feature that distinguishes the oil cartel
from most (if not all) other cartels is that governments, and not firms, make the decision
about joining the cartel.
Taking these features as assumptions, we answer the above questions in the
context of a simple model in which oil producing countries choose either to join OPEC
or remain part of the fringe. Equilibrium is stable and thus the cartel members have no
temptation to cheat. OPEC acts as a Stackleberg leader, and reacts to market shocks by
setting the output quotas for its members. We find that if oil producing countries only
care about high oil sector profits, then joining the cartel is the optimal strategy. But
countries in the cartel will have more volatile oil production than those in the fringe and
thus, higher macroeconomic instability. Therefore, if these same governments care
5
about macroeconomic stability as well as oil sector profits, then the choice to join the
cartel will depend on the intensity of this preference: the more a producer cares about
macroeconomic stability, the less inclined it is to be a cartel member. Thus, if an oil
producing country cares about both oil industry profits and macroeconomic stability, the
goal of macroeconomic stability may be inconsistent with cartel membership.
The paper proceeds as follows. We first provide a brief discussion of the
economic performance of the OPEC member states, and examine OPEC’s ability to
influence the oil market. We then examine how OPEC’s objectives—as specified in its
mission statement—could be operationalized, write down a model of the cartel and
analyze its behavior. Finally, we summarize and interpret our results.
I. The OPEC Economies
OPEC was established in 1960 to take sovereign control over oil resources, and to
ensure that the interests of oil producing countries would be well represented in the
world markets. The founding members of OPEC felt that their economies were at the
mercy of the oil companies, and that they were not being adequately compensated for
the oil the companies were extracting, exporting, and refining. By design, OPEC was to
establish orderly oil markets, stable prices, and promote the economic development of
its member states. OPEC’s mission differentiates it from a narrowly defined cartel under
which joint profits are maximized. That OPEC does not behave strictly like a narrowly
defined cartel has been found by Griffin (1985), Griffin and Xiong (1997), and Loderer
(1985), among others. Their results could be explained, in part, by OPEC’s broader
goals.
6
In comparison with other developing economies, the immensely oil rich
economies have underperformed. Their economies are characterized by very high
population growth rates and high rates of oil dependence both in terms of personal
income and public finance. High extraction rates have led to falling oil reserves. In
many OPEC member countries, investment, even in the oil sector, is low. Cordesman
(1999) argues that many oil states do not even have the resources to develop their own
oil and gas reserves. Yet because of the high level of oil dependence, the oil sector must
perform well both to maintain current and ensure future living standards (Morrison,
2004). But, oil sector and overall economic productivity in the OPEC economies has
declined, and today less rather than more is being produced with the same resources.
This economic decline has been interpreted by some as evidence that the OPEC
economies have been victims of the resource curse (Auty, 2001; Eastwood and
Venables 1982; Gylfason, 2001; Rodriguez and Sachs, 1999; Sachs and Warner, 2001;
Stevens, 2004), the apparently anomalous empirical finding that many resource rich
countries under-perform their resource poor peers. The reasons given for the curse are
many: decline in the terms of trade, revenue volatility, the Dutch disease, crowding out,
government mismanagement, rent seeking, corruption, etc. But, the end result is the
same—relative poverty in the midst of plenty.
We suggest, in contrast, that some of the blame for the economic decline may lie
in the cartel rather than in the resources it allocates. While OPEC, at least in principle,
adjusts supply to maintain targeted (nominal) oil prices to maximize oil firm profits, it
has not been able to control the market adequately to ensure a steady stream of oil
derived revenues: it has been unable to provide for both consumption today and
investment to ensure consumption tomorrow. For example, Venezuela’s public sector
7
oil revenues were 27 percent of GDP in 1996 but only 12.5 percent in 1998 (Barnett and
Ossowski, 2003). The orderly market, the supposed empirical manifestation of a profit
oriented pricing policy, is claimed to be a reality (Jalali-Naini and Asali, 2004), but the
implied real benefits to OPEC members are more like fiction. The tension is this: In a
highly price-elastic oil market, if OPEC adjusts output to sustain high oil prices, cartel
members will receive a short-term windfall gain. But the effect of this course of action
is short-run macroeconomic fluctuations and world economic slowdown, and thus
diminished rather than enhanced long-run macroeconomic growth prospects. This is as
true today as it was in the 1970s. When OPEC was founded in the early 1960s, the oil
market was quite stable and the cartel strategy could work. Yet, with the high oil market
volatility from the 1970s on, the dual OPEC goals of long-term growth and
development may not be achievable by a profit-oriented pricing policy.
II. Market Equilibrium When Stability Does Not Matter
Assumptions
There is a continuum of petroleum producing countries distributed along the interval
( )1, N .1 These oil industries are controlled by their governments.
There is a cartel of oil producers which governments can freely choose to join.
Assume nc countries belong to the cartel while nf = N – nc do not and remain in the
fringe. Since oil output in each country is determined by the number of wells drilled
and the amount of oil underground, it is reasonable to assume that each country’s
petroleum industry exhibits constant returns to scale technology and has the same cost
1 We assume the continuum modeling for analytical ease. This formulation enables us to avoid concentrating attention on corner solutions that have no economic interest.
8
function, ( )tixCC = , where xti is country i’s petroleum production at period t. This
means that oil production has constant marginal costs. Oil prices are set according to the
demand function ( ) ttt QfP ε+= , where 0'<f and 0'' >f , Qt denotes the world oil
production and εt is a random term whose expected value is zero and variance is equal
to 2εσ . The profit function for the petroleum industry at time t in country i is
( )tititti xCxP −=π , ( )Ni ,1∈ . Suppose, initially, that profits are the only concern; thus,
the country’s maximization problem is
(1) Max ( )∑
∞
=
π+0 11
ttitr
.
Assume that shocks are known before oil producers make output decisions, however,
future shocks are unknown.
The Fringe
Firm f in the fringe takes the output of all other petroleum producers as given and
maximizes (1) to determine its own output. The first order condition for a country in the
fringe is
(2) ( ) ( ) ( ) 0'' **** =−+ε+ tftfttt xCxQfQf ,
where the superscript “*” denotes the optimum choice. The second-order condition is:
(3) ( ) ( ) ( ) 0'''''2 **** <−+ tftftt xCxQfQf (to be maximum).
Solving (2), we obtain the follower’s reaction function (country f) to the cartel’s move:
(4) ( )ttf
tf Kx εφ= ,** ,
where ∑=
=cn
ctct xK
1
** is the cartel’s oil production in period t. Using (2), we obtain the
partial derivative of xtf with respect to tK and denote it by fcφ , that is,
9
(5) ( ) ( )
( ) ( ) ( )****
***
'''''2'''
tfttft
ttft
t
ffc xCQfxQf
QfxQfK −+
+−=
∂φ∂
=φ .
From (3), the denominator is negative, thus
0<φ fc if and only if ( ) ( ) 0''' *** <+ tft QfxQf .
When reaction functions are upward sloping, 0>φ fc , there is a situation in which
followers copy or undercut the leader like, for example, entrants undercutting the price
of the incumbent in the contestable market literature (Baumol, 1982) or followers in the
development stage that invest more than the leader and are thus more likely to collect a
patent in a research and development game (Reinganum, 1985). On the other hand,
when reaction functions are downward sloping, 0<φ fc , the leader makes a preemptive
move, like an incumbent firm that invests in excess supply (Spence, 1979; Dixit, 1980).
OPEC’s operating procedure, semiannual plus extraordinary meetings, is to preempt the
market.
The Cartel
For the sake of simplicity, assume that countries on the interval (1, nc] are in the cartel
and countries on the interval (nc, N] are in the fringe. The leader takes into account the
follower’s reaction function (4), so it chooses xti for each cartel member to maximize
( )∑ ∫∞
= = ⎥⎥⎦
⎤
⎢⎢⎣
⎡−+=
ts
n
cscssss
siti xCKKQfEV
1
)(εβ .
Since ffss nKQ φ+= , the first order condition for every country c in the cartel is:
(6) ( ) ( ) ( ) ( ) 0''1 **** =−φ++ε+ tctfcfttt xCQfnKQf .
Since all countries are equal except for their membership in the cartel, we may consider
symmetric equilibria, so xtc is the same for every cartel member and xtf is the same for
every country in the fringe.
10
Theorem 1: Suppose that the slope of the reaction function fcφ is continuous, monotonic
and well-defined for 1 < nc ≤ N; then there is a Nash equilibrium with cartel size equal
to *cn and the number of countries in the fringe equal to **
cf nNn −= such that
( )**
*1cc
cfc nNn
n−
−=φ . In that Nash equilibrium, each country in the cartel produces the same
amount of oil and obtains the same profit as a country in the fringe, ***fc xxx == . That
is, fc xx ≥ if and only if fc π≥π .
Proof: See Appendix
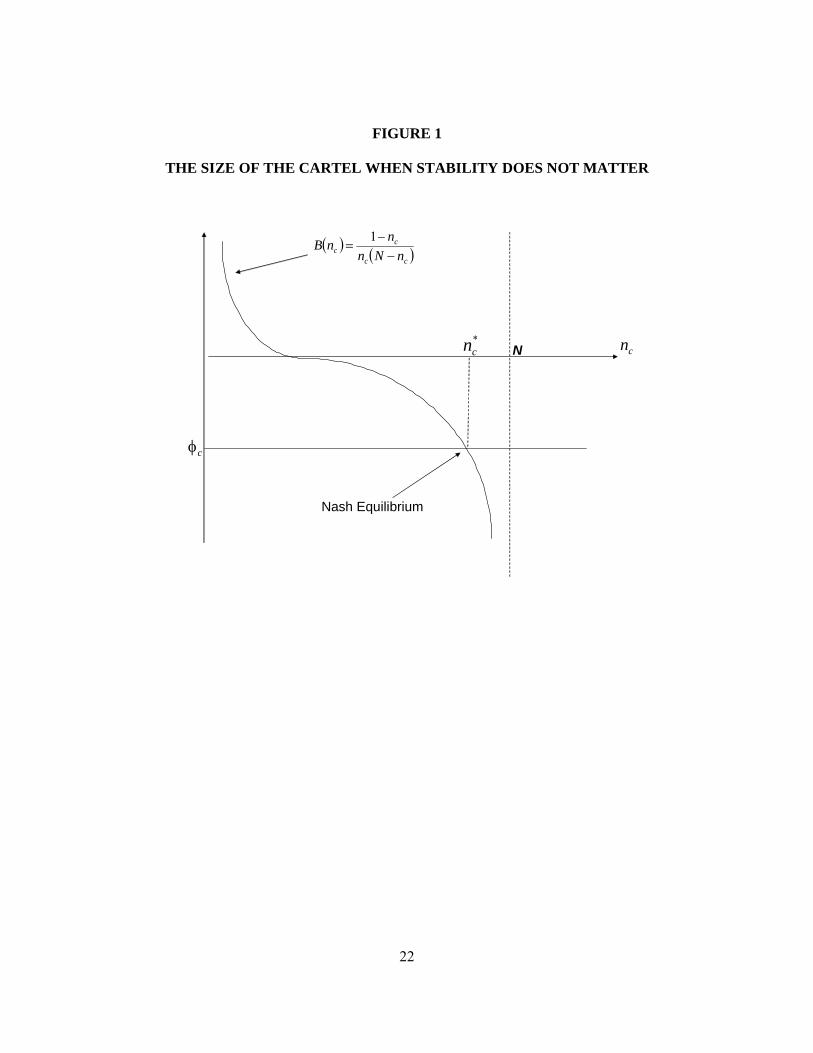
To illustrate the theorem, consider Figure 1, where for the sake of simplicity, we have
assumed that fcφ is constant. Although the assumption made in Theorem 1 about
fcφ is
more general, it is noteworthy that fcφ is constant if the demand function is linear and
oil exploitation technology is constant returns to scale.
Define ( ) ( )cc
cc nNn
nnB−
−=
1
and *cn as the size of the cartel such that ( ) f
ccnB φ=*.
If the cartel size is greater than *cn , the cartel’s market power is strong but each
cartel member produces **fc xx < . Once the cartel sets the quotas to target some price
level, it is optimal for cartel members to cheat, that is, to imitate producers in the fringe
and thus increase their production. The cartel’s market power weakens and cheating
countries do not benefit from belonging to the cartel. If cartel members are subject to
some cost, like bargaining costs or moral punishments, they are better off if they quit.
On the other hand, if the cartel size is less than *cn , then **
fc xx > and profits are higher
for cartel members. Producers in the fringe will find it optimal to join the cartel to gain
from its market power. A Nash equilibrium is reached once the cartel has reached its
11
optimal size *cn where cartel members have no incentive to cheat since equilibrium
output and profit is the same for countries both in the cartel and the fringe. Therefore,
the cartel solution is stable.
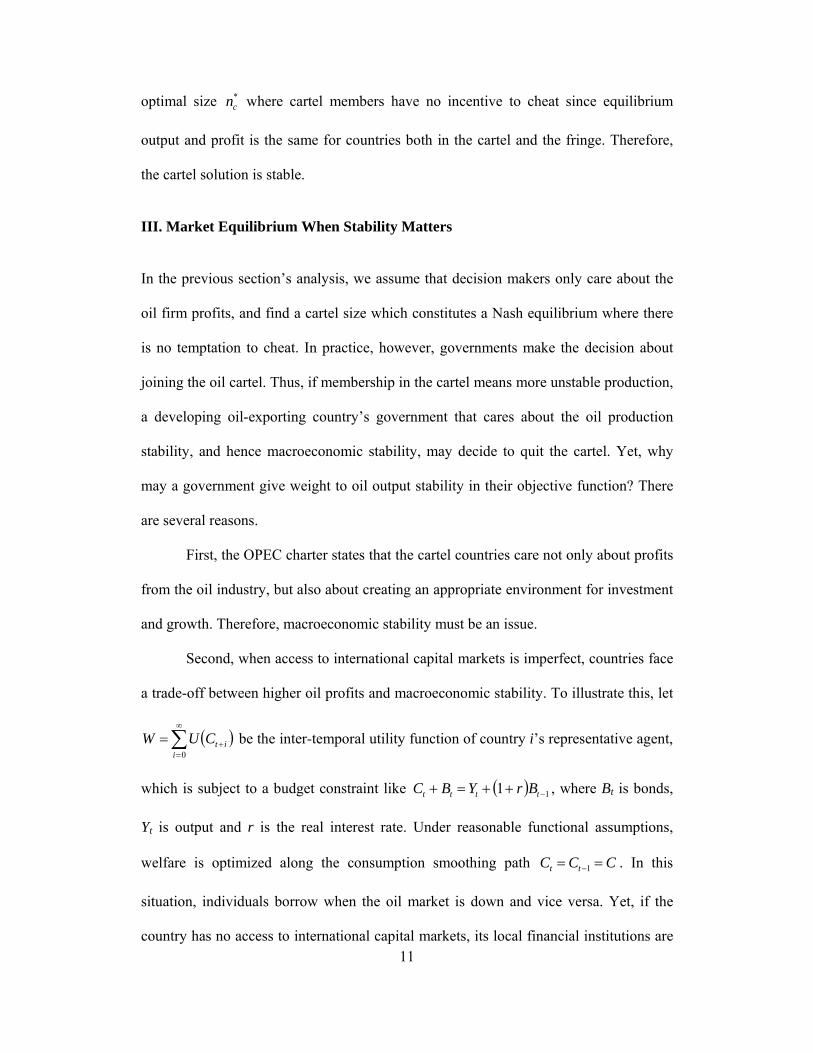
III. Market Equilibrium When Stability Matters
In the previous section’s analysis, we assume that decision makers only care about the
oil firm profits, and find a cartel size which constitutes a Nash equilibrium where there
is no temptation to cheat. In practice, however, governments make the decision about
joining the oil cartel. Thus, if membership in the cartel means more unstable production,
a developing oil-exporting country’s government that cares about the oil production
stability, and hence macroeconomic stability, may decide to quit the cartel. Yet, why
may a government give weight to oil output stability in their objective function? There
are several reasons.
First, the OPEC charter states that the cartel countries care not only about profits
from the oil industry, but also about creating an appropriate environment for investment
and growth. Therefore, macroeconomic stability must be an issue.
Second, when access to international capital markets is imperfect, countries face
a trade-off between higher oil profits and macroeconomic stability. To illustrate this, let
( )∑∞
=+=
0iitCUW be the inter-temporal utility function of country i’s representative agent,
which is subject to a budget constraint like ( ) 11 −++=+ tttt BrYBC , where Bt is bonds,
Yt is output and r is the real interest rate. Under reasonable functional assumptions,
welfare is optimized along the consumption smoothing path CCC tt == −1 . In this
situation, individuals borrow when the oil market is down and vice versa. Yet, if the
country has no access to international capital markets, its local financial institutions are
12
weak, and/or it suffers from strong political business cycle problems, which is the usual
case in emerging markets (Jeanne 2003, Litan et al. 2003 and Sy 2003), the
consumption smoothing path may not be feasible anymore, and the solution to the
maximization problem becomes tt YC = , that is, consumption follows the cycle.
Therefore, although joining the cartel may provide a higher average income to the
typical oil exporting country, it may also generate more macroeconomic instability,
which diminishes welfare. Therefore, the government faces a trade-off between having
higher income and macroeconomic stability.
Third, for the typical oil-exporting developing country, stability in the number of
barrels produced also provides more stability to the oil industry's local suppliers making
investment in those related sectors less risky, and thus helping the development of areas
in which the country should have natural comparative advantages. Finally, every time
the oil industry (plus its multiplier effect) adjusts output, it lays off workers. Thus, a
government that cares about employment stability should worry about stabilizing the
number of barrels it produces.
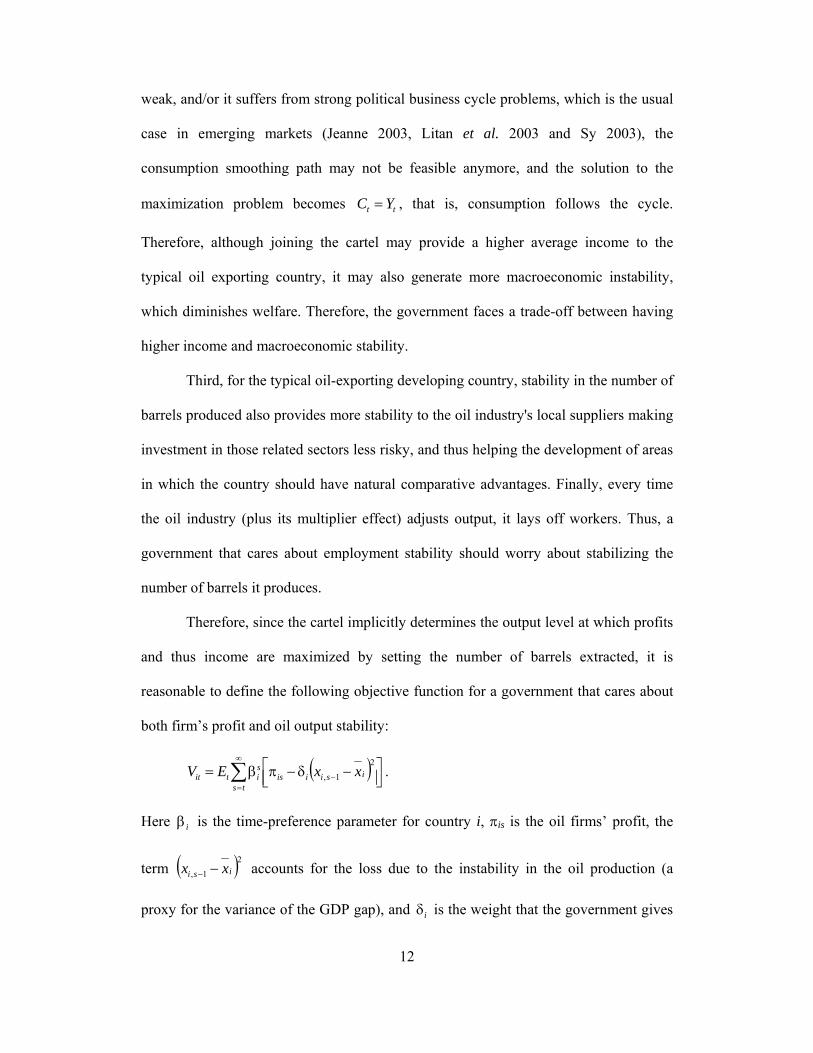
Therefore, since the cartel implicitly determines the output level at which profits
and thus income are maximized by setting the number of barrels extracted, it is
reasonable to define the following objective function for a government that cares about
both firm’s profit and oil output stability:
( )∑∞
=− ⎥⎦
⎤⎢⎣⎡ −δ−πβ=
tsisiiis
sitit xxEV
2
1, .
Here iβ is the time-preference parameter for country i, πis is the oil firms’ profit, the
term ( )21, isi xx −− accounts for the loss due to the instability in the oil production (a
proxy for the variance of the GDP gap), and iδ is the weight that the government gives
13
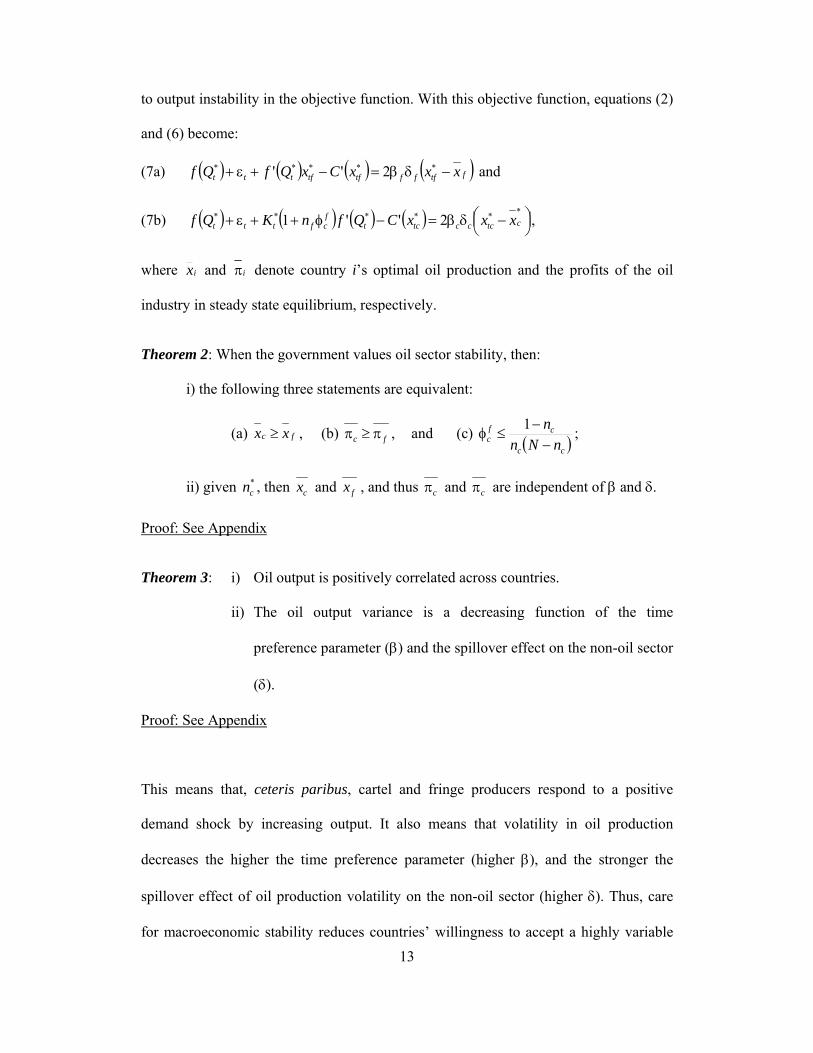
to output instability in the objective function. With this objective function, equations (2)
and (6) become:
(7a) ( ) ( ) ( ) ( )ftffftftfttt xxxCxQfQf −δβ=−+ε+ ***** 2'' and
(7b) ( ) ( ) ( ) ( ) ⎟⎠⎞⎜
⎝⎛ −δβ=−φ++ε+
****** 2''1 ctccctctfcfttt xxxCQfnKQf ,
where ix and iπ denote country i’s optimal oil production and the profits of the oil
industry in steady state equilibrium, respectively.
Theorem 2: When the government values oil sector stability, then:
i) the following three statements are equivalent:
(a) fc xx ≥ , (b) fc π≥π , and (c) ( )cc
cfc nNn
n−
−≤φ
1 ;
ii) given *cn , then cx and fx , and thus cπ and cπ are independent of β and δ.
Proof: See Appendix
Theorem 3: i) Oil output is positively correlated across countries.
ii) The oil output variance is a decreasing function of the time
preference parameter (β) and the spillover effect on the non-oil sector
(δ).
Proof: See Appendix
This means that, ceteris paribus, cartel and fringe producers respond to a positive
demand shock by increasing output. It also means that volatility in oil production
decreases the higher the time preference parameter (higher β), and the stronger the
spillover effect of oil production volatility on the non-oil sector (higher δ). Thus, care
for macroeconomic stability reduces countries’ willingness to accept a highly variable
14
production quota. These facts may induce governments to change their decision about
joining the cartel.
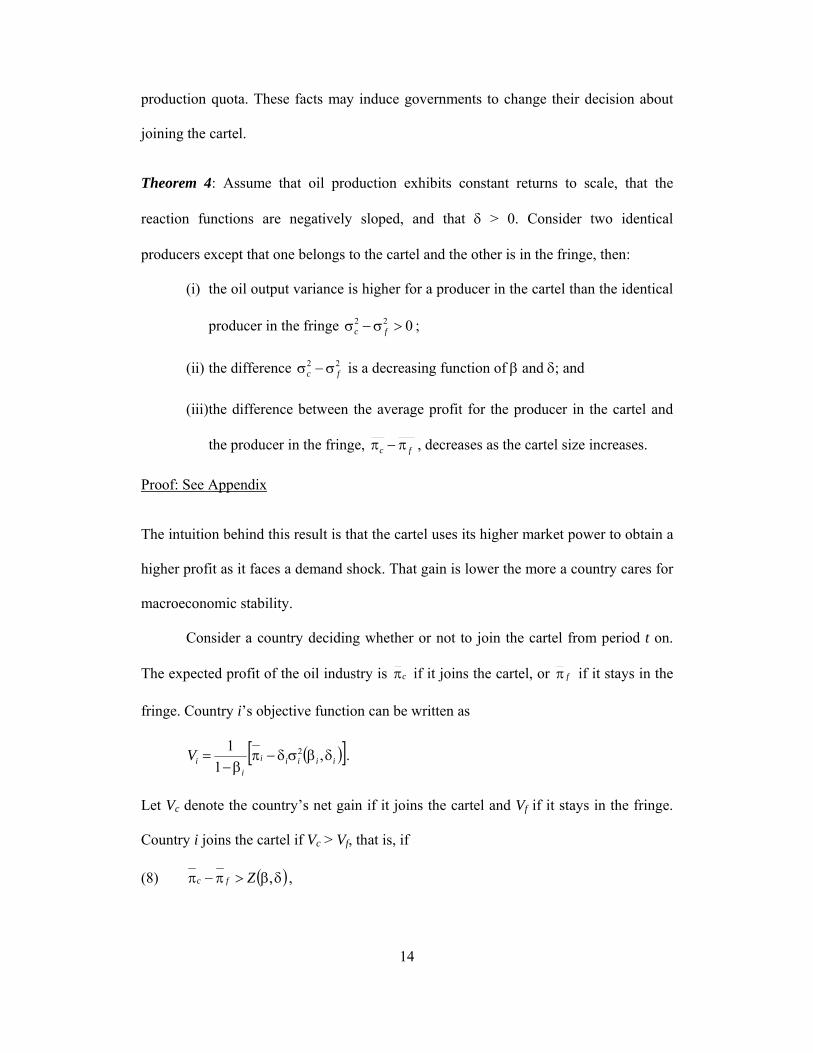
Theorem 4: Assume that oil production exhibits constant returns to scale, that the
reaction functions are negatively sloped, and that δ > 0. Consider two identical
producers except that one belongs to the cartel and the other is in the fringe, then:
(i) the oil output variance is higher for a producer in the cartel than the identical
producer in the fringe 022 >σ−σ fc ;
(ii) the difference 22fc σ−σ is a decreasing function of β and δ; and
(iii)the difference between the average profit for the producer in the cartel and
the producer in the fringe, fc π−π , decreases as the cartel size increases.
Proof: See Appendix
The intuition behind this result is that the cartel uses its higher market power to obtain a
higher profit as it faces a demand shock. That gain is lower the more a country cares for
macroeconomic stability.
Consider a country deciding whether or not to join the cartel from period t on.
The expected profit of the oil industry is cπ if it joins the cartel, or fπ if it stays in the
fringe. Country i’s objective function can be written as
( )[ ]iiiii
iiV δβσδ−π
β−= ,
11 2 .
Let Vc denote the country’s net gain if it joins the cartel and Vf if it stays in the fringe.
Country i joins the cartel if Vc > Vf, that is, if
(8) ( )δβ>π−π ,Zfc ,
15
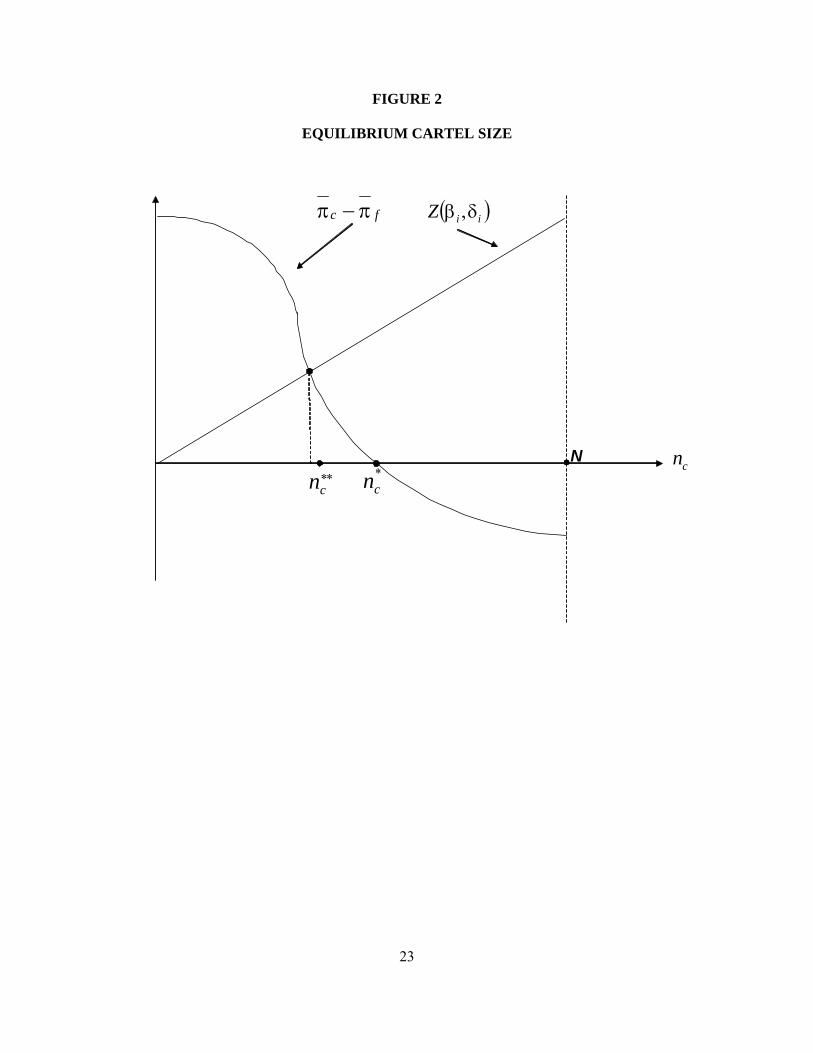
where ( ) ( ) ( )[ ]δβσ−δβσδ=δβ ,,, 22fcZ . The term ( )fc π−π measures the gain in expected
profits and ( )δβ,Z measures the loss due in macroeconomic instability if the country is
in the cartel instead of in the fringe. From Theorem 4, the difference ( )fc π−π is a
decreasing function of nc that cuts the axis at *cc nn = , as shown in Figure 2. The number
of countries that join the cartel depends on the countries’ distribution across the
parameters β and δ.
To get some insights, define the index set for the N countries in such a way that
( )iiZ δβ , is a continuous increasing function of ( )Ni ,0∈ . From Figure 2, we observe
that inequality (8) holds for the first **cn countries; those with **
cni < join the cartel, and
the other ****cf nNn −= remain in the fringe. From Theorem 4(ii), ( ) 0, ≥δβZ , and thus
there exists an equilibrium in which some producers join the cartel and some others
decide to stay in the fringe. If δ = 0, then ( ) 0, =δβZ and equilibrium is reached when
the cartel size equals *cn as in Theorem 1. Yet, if δ > 0, equilibrium is reached for a
cartel size equal to **cn smaller than *
cn , that is, the cartel size is smaller when some
countries care for macroeconomic stabilization than in the special case when
stabilization does not matter.
The dynamic of the cartel in this model can be seen as a repeated game, where
players are free to choose the strategy of whether or not to join the cartel; they are free
to “cheat” and condition (8) defines equilibrium. Consider a country that joins the
cartel, so (8) holds. If the country imitates the fringe’s behavior, it is not punished, but
its loss in terms of profits is too high since it does not maximize (1) and thus it will be
worse off: the cartel is internally stable. Similarly, a country in the fringe will not want
to imitate a country in the cartel since the cost in macroeconomic instability is too high.
16
Therefore, a country joins the cartel if it is committed to keep its quota, and thus the
cartel solution defined by (8) is a stable equilibrium.2
What are the features of those countries that join the cartel? Given δ, from
Theorem 4(ii), 22fc σ−σ is a decreasing function of time-preference factor β. Therefore,
countries with a low time-preference factor β, which have a strong preference for
current consumption and low investment-output ratios, give little importance to future
losses due to macroeconomic instability, and so ( )δβ,Z is small. For them, inequality
(8) holds. They are likely to join the cartel.
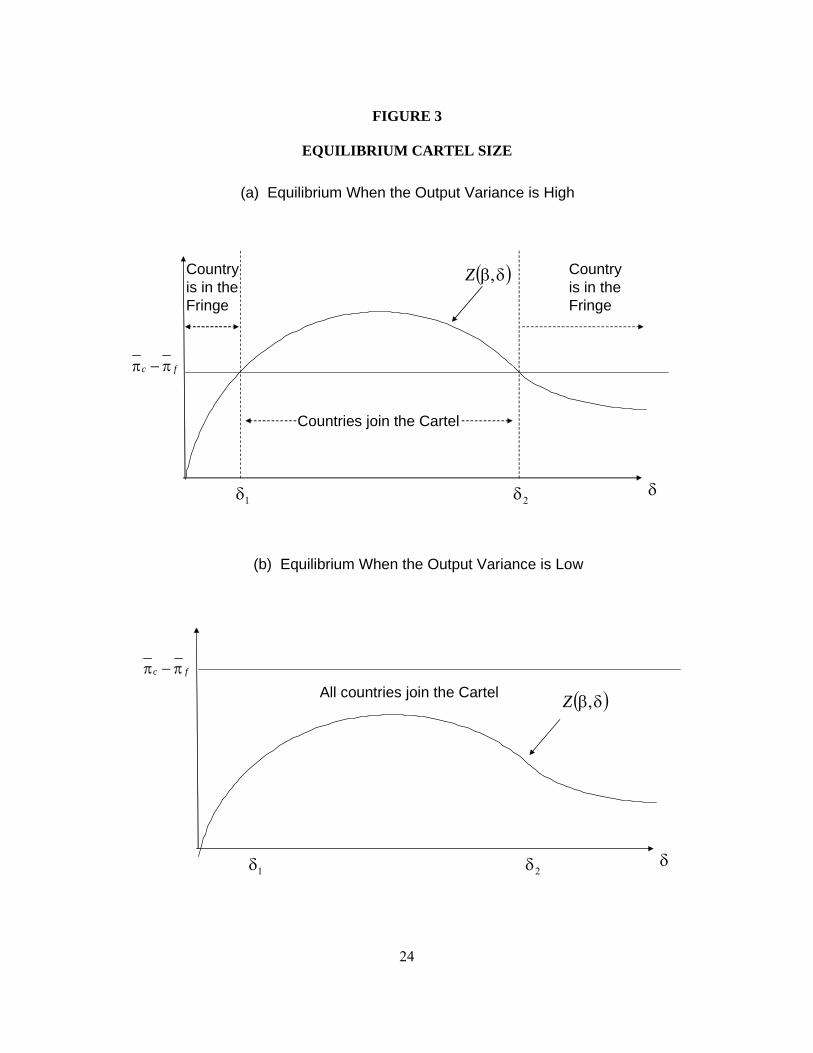
The analysis of the parameter δ requires a more detailed analysis. Given β, since
22fc σ−σ is a decreasing function of δ, ( )δβ,Z has the shape shown in Figure 3(a). Thus,
countries with either low δ ( )1δ< or very high δ ( )2δ> join the cartel. If δ is low, either
the impact of oil output instability on the non-oil sector is low or the non-oil sector is
rather small. This could be the case in countries whose non-oil sector is highly rural.
These countries put a priority on the well-being of their oil industry and join the cartel.
On the other hand, countries with a very high δ have much to lose from spillover effects
that instability in oil production cause in the non-oil sector, and will join the cartel only
if their quota is insensitive to demand shocks, diminishing the instability effect.
Finally, let us consider the effect of market volatility on the cartel size. It is
apparent that ( )δβ,Z is a decreasing function of the variance of ε; thus, if the oil market
is very unstable, the variance of ε is big, and equilibrium will be as shown in Figure
3(a), where some countries find it beneficial to join the cartel and others do not. Yet, if
2 Here we follow the definition of a stable cartel as suggested in D’Aspremont et al. (1983), Donsimoni et al. (1986), Jacquemin and Slade (1989) and Marette and Crespi (2003).
17
market volatility is low and the variance of ε is too small, ( )δβ,Z will be as shown in
Figure 3(b), and all countries join the cartel.
IV. Conclusions
A distinguishing feature of the international oil market is that the decision about joining
the OPEC cartel is not taken by firms, but by governments that take macroeconomic
considerations, namely development and stabilization, into account. This essay studies
the issue of whether the cartel has been a useful tool for those purposes in the context of
a Stackleberg type model in which oil exporting, developing countries decide whether
or not to join the cartel. The model leads to four important conclusions. The first is that
countries with a strong preference for current consumption join the cartel. The reasons
for this preference may vary across countries: in Kuwait, for instance, it may be due to
the high population growth rate (4.9% annually during the last 10 years), while in Iraq it
may have been due to the need for current income to finance several wars during
Saddam’s regime. A strong preference for current consumption (low β) is reflected in
relatively low investment/output ratios and poor economic performance in terms of long
term per capita output growth. This could account for the economic performance in
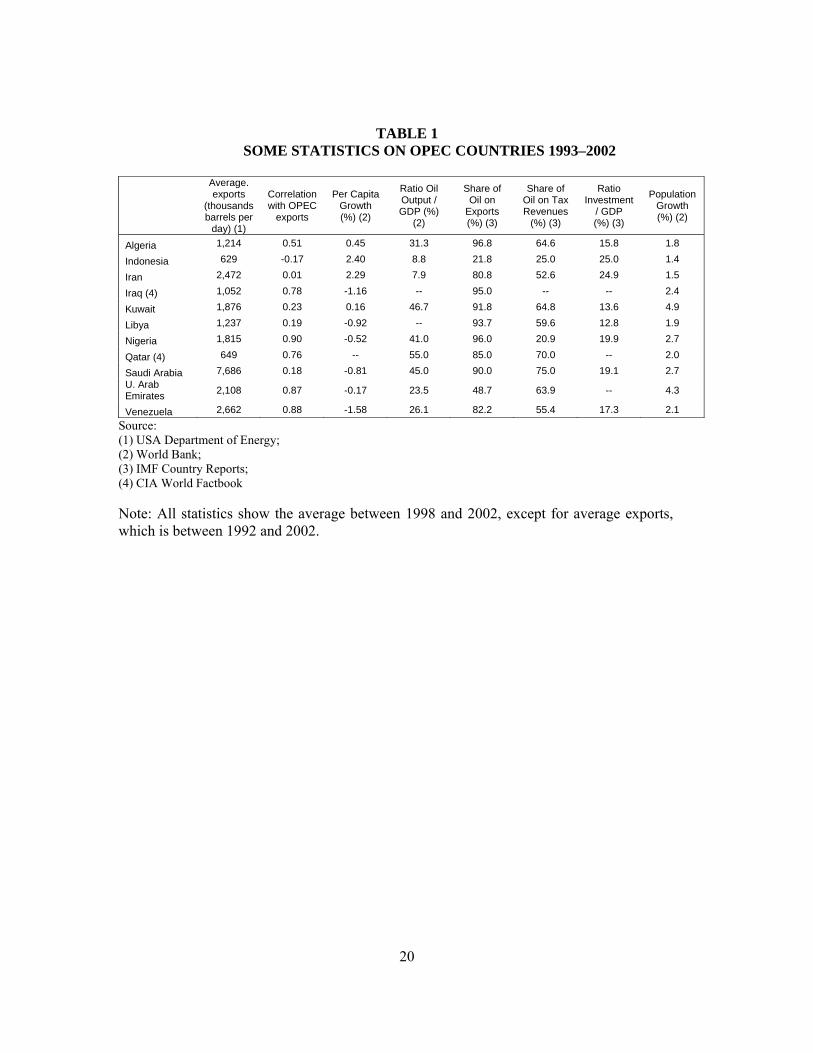
countries (see Table 1) like Kuwait, Iraq, Libya, Nigeria, Saudi Arabia or Venezuela,
whose investment/output ratios have been less than 20% during the last decade. The
decision to join the cartel and the exigencies of cartel, as opposed to macroeconomic,
stability has cursed rather than blessed them.
Second, countries whose non-oil sectors either show low vulnerability to the
variance in oil production or are small relative to the oil sector will also join the cartel.
This would be the case, for example, for countries with a large rural sector, such as Iran
18
where the agricultural sector represents over 20% of the GDP. Yet not only countries
with low vulnerability to the oil output variance will join the cartel. There is a third
reason. Since the oil-output variance is a source of macroeconomic instability, countries
with very large non-oil sectors or that are highly vulnerable to the oil output variance
(high δ) are better off enjoying cartel prices and at the same time having low oil-output
variances. Therefore, if their quotas exhibit low variances, it would be beneficial for
them to join the cartel. This could explain Indonesia’s, and to a lesser extent Iran’s,
OPEC membership, since their oil production to GDP ratios are small and the
correlations between their oil production and the cartel’s are rather low. Finally, we
conclude that all oil exporting countries would find it beneficial to join the cartel if the
volatility of the oil market were low. This could explain why, for example, when OPEC
was set up in the early 1960s, all important oil exporters at that time joined the cartel,
and why many of these countries enjoyed high growth rates during the 1960s. The case
of Venezuela exemplifies this. After enjoying an average growth rate above 5% per year
between 1945 and 1973, one of the highest growth rates in the world, its average growth
rate from 1978 on, just after the oil market volatility became a serious concern for
producing countries, has been close to zero.
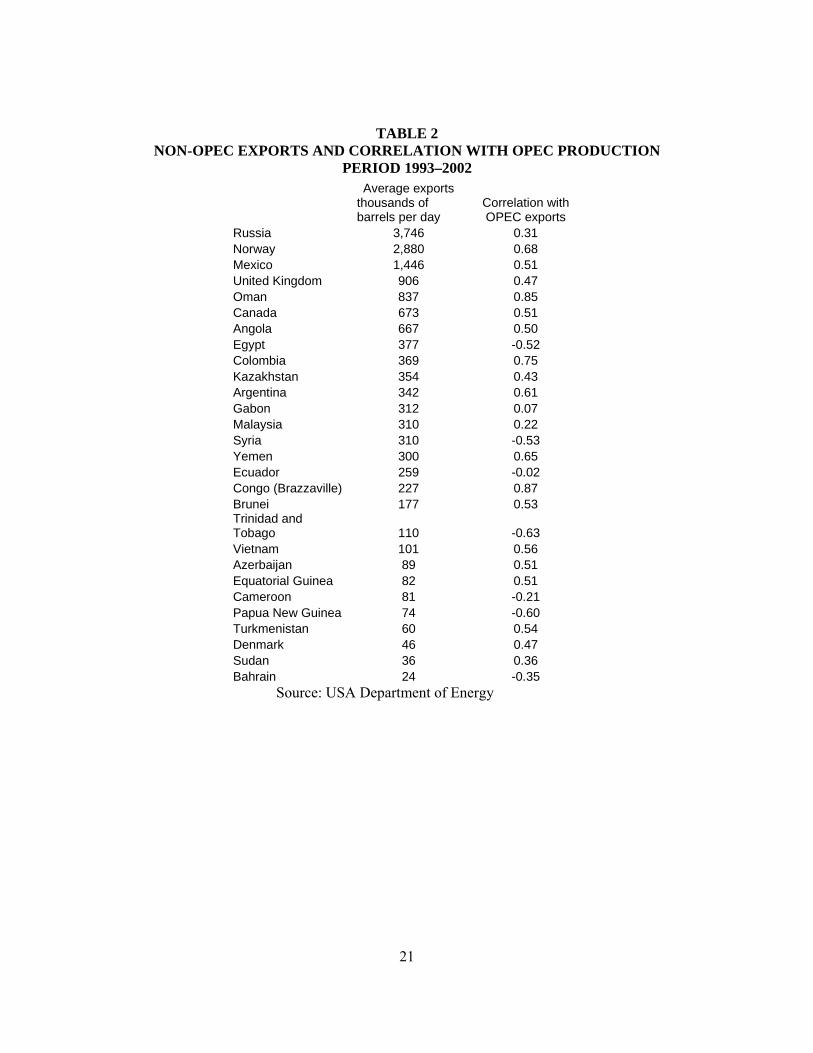
What about the countries in the fringe? A glance at Table 2 shows that all
producers whose oil exports are less than 600 thousand barrels per day are in the fringe.
However, except for Denmark, oil production is still an important share of their GDPs.
Thus, they can take advantage of oil industry windfalls generated by the cartel’s
leadership role without being members of the cartel. But, this is at the recognized cost
of letting their non-oil sector suffer the swings of the oil market. This could be also the
19
case for Russia, Mexico and Angola, whose oil output variances are moderately
correlated with OPEC.
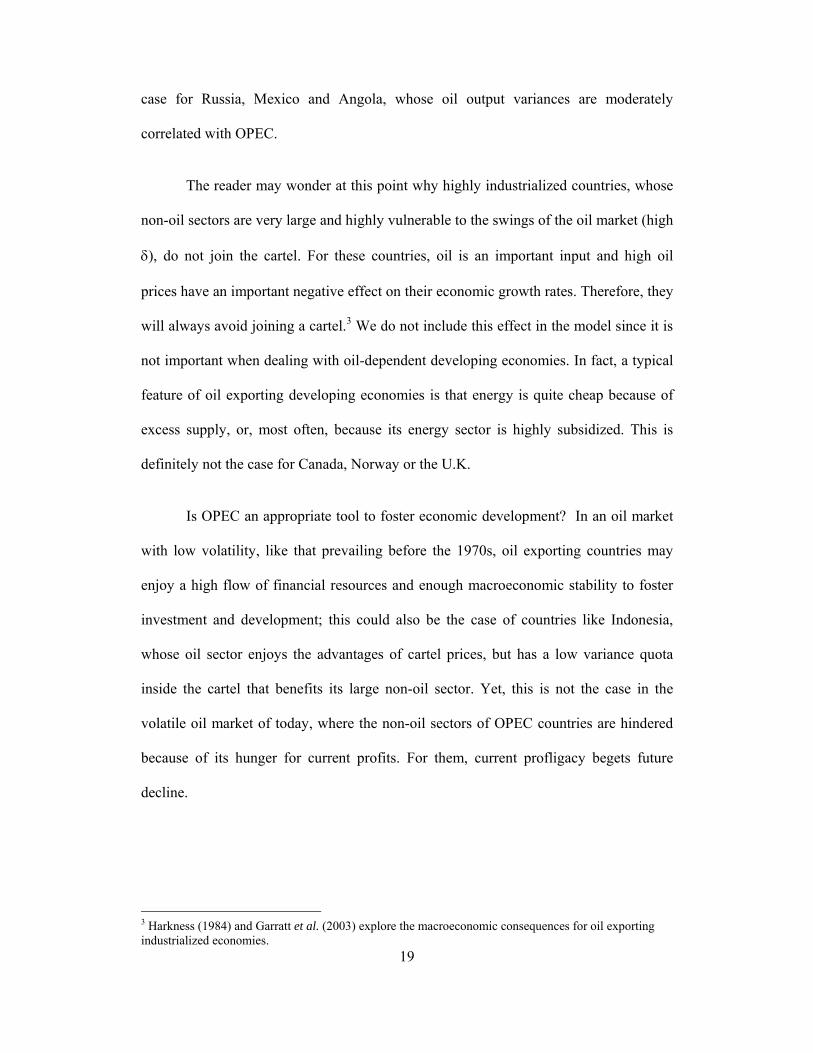
The reader may wonder at this point why highly industrialized countries, whose
non-oil sectors are very large and highly vulnerable to the swings of the oil market (high
δ), do not join the cartel. For these countries, oil is an important input and high oil
prices have an important negative effect on their economic growth rates. Therefore, they
will always avoid joining a cartel.3 We do not include this effect in the model since it is
not important when dealing with oil-dependent developing economies. In fact, a typical
feature of oil exporting developing economies is that energy is quite cheap because of
excess supply, or, most often, because its energy sector is highly subsidized. This is
definitely not the case for Canada, Norway or the U.K.
Is OPEC an appropriate tool to foster economic development? In an oil market
with low volatility, like that prevailing before the 1970s, oil exporting countries may
enjoy a high flow of financial resources and enough macroeconomic stability to foster
investment and development; this could also be the case of countries like Indonesia,
whose oil sector enjoys the advantages of cartel prices, but has a low variance quota
inside the cartel that benefits its large non-oil sector. Yet, this is not the case in the
volatile oil market of today, where the non-oil sectors of OPEC countries are hindered
because of its hunger for current profits. For them, current profligacy begets future
decline.
3 Harkness (1984) and Garratt et al. (2003) explore the macroeconomic consequences for oil exporting industrialized economies.
20
TABLE 1 SOME STATISTICS ON OPEC COUNTRIES 1993–2002
Average. exports
(thousands barrels per
day) (1)
Correlation with OPEC
exports
Per Capita Growth (%) (2)
Ratio Oil Output / GDP (%)
(2)
Share of Oil on
Exports (%) (3)
Share of Oil on Tax Revenues
(%) (3)
Ratio Investment
/ GDP (%) (3)
Population Growth (%) (2)
Algeria 1,214 0.51 0.45 31.3 96.8 64.6 15.8 1.8
Indonesia 629 -0.17 2.40 8.8 21.8 25.0 25.0 1.4
Iran 2,472 0.01 2.29 7.9 80.8 52.6 24.9 1.5
Iraq (4) 1,052 0.78 -1.16 -- 95.0 -- -- 2.4
Kuwait 1,876 0.23 0.16 46.7 91.8 64.8 13.6 4.9
Libya 1,237 0.19 -0.92 -- 93.7 59.6 12.8 1.9
Nigeria 1,815 0.90 -0.52 41.0 96.0 20.9 19.9 2.7
Qatar (4) 649 0.76 -- 55.0 85.0 70.0 -- 2.0
Saudi Arabia 7,686 0.18 -0.81 45.0 90.0 75.0 19.1 2.7 U. Arab Emirates 2,108 0.87 -0.17 23.5 48.7 63.9 -- 4.3
Venezuela 2,662 0.88 -1.58 26.1 82.2 55.4 17.3 2.1 Source: (1) USA Department of Energy; (2) World Bank; (3) IMF Country Reports; (4) CIA World Factbook Note: All statistics show the average between 1998 and 2002, except for average exports, which is between 1992 and 2002.
21
TABLE 2 NON-OPEC EXPORTS AND CORRELATION WITH OPEC PRODUCTION
PERIOD 1993–2002
Average exports thousands of barrels per day
Correlation with OPEC exports
Russia 3,746 0.31 Norway 2,880 0.68 Mexico 1,446 0.51 United Kingdom 906 0.47 Oman 837 0.85 Canada 673 0.51 Angola 667 0.50 Egypt 377 -0.52 Colombia 369 0.75 Kazakhstan 354 0.43 Argentina 342 0.61 Gabon 312 0.07 Malaysia 310 0.22 Syria 310 -0.53 Yemen 300 0.65 Ecuador 259 -0.02 Congo (Brazzaville) 227 0.87 Brunei 177 0.53 Trinidad and Tobago 110 -0.63 Vietnam 101 0.56 Azerbaijan 89 0.51 Equatorial Guinea 82 0.51 Cameroon 81 -0.21 Papua New Guinea 74 -0.60 Turkmenistan 60 0.54 Denmark 46 0.47 Sudan 36 0.36 Bahrain 24 -0.35
Source: USA Department of Energy
22
FIGURE 1
THE SIZE OF THE CARTEL WHEN STABILITY DOES NOT MATTER
N cn*cn
cφ
( ) ( )cc
cc nNn
nnB−
−=
1
Nash Equilibrium
23
FIGURE 2
EQUILIBRIUM CARTEL SIZE
Ncn
**cn
( )iiZ δβ ,fc π−π
*cn
24
FIGURE 3
EQUILIBRIUM CARTEL SIZE
( )δβ,Z
δ
fc π−π
1δ 2δ
Countries join the Cartel
Countryis in the Fringe
Countryis in the Fringe
(a) Equilibrium When the Output Variance is High
( )δβ,Z
δ
fc π−π
1δ 2δ
All countries join the Cartel
(b) Equilibrium When the Output Variance is Low
25
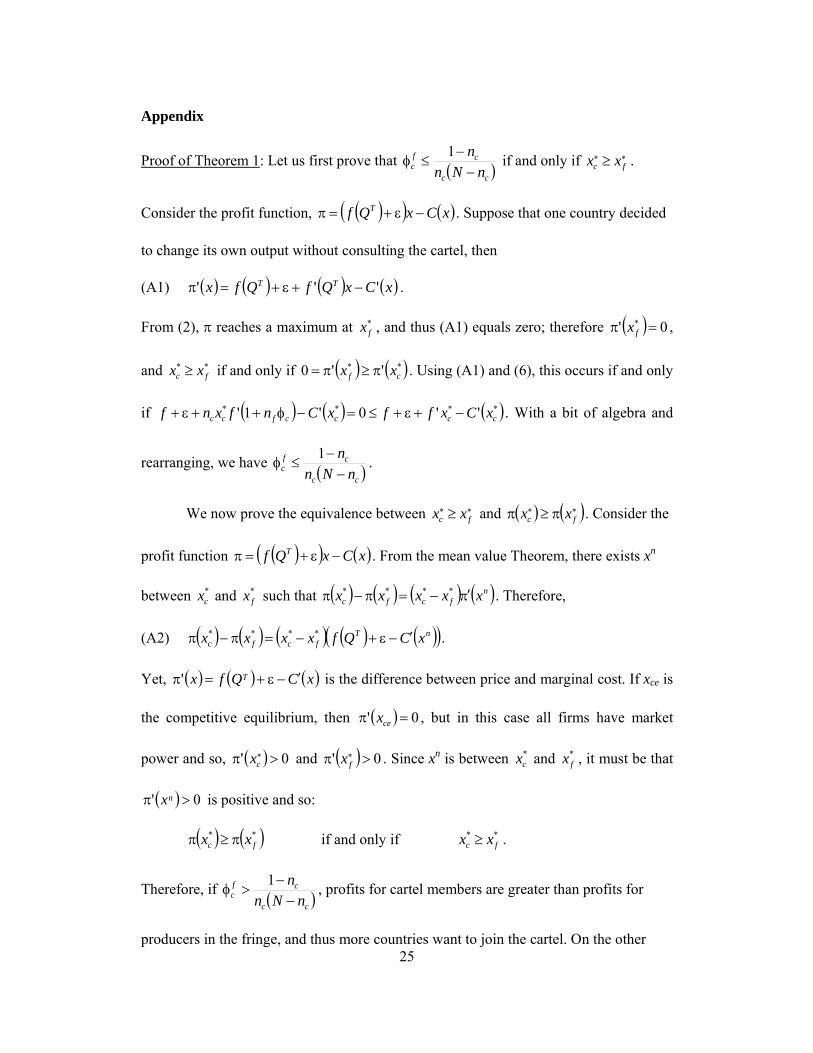
Appendix
Proof of Theorem 1: Let us first prove that ( )cc
cfc nNn
n−
−≤φ
1 if and only if **fc xx ≥ .
Consider the profit function, ( )( ) ( )xCxQf T −ε+=π . Suppose that one country decided
to change its own output without consulting the cartel, then
(A1) ( ) ( ) ( ) ( )xCxQfQfx TT ''' −+ε+=π .
From (2), π reaches a maximum at *fx , and thus (A1) equals zero; therefore ( ) 0' * =π fx ,
and **fc xx ≥ if and only if ( ) ( )** ''0 cf xx π≥π= . Using (A1) and (6), this occurs if and only
if ( ) ( ) ( )**** ''0'1' ccccfcc xCxffxCnfxnf −+ε+≤=−φ++ε+ . With a bit of algebra and
rearranging, we have ( )cc
cfc nNn
n−
−≤φ
1 .
We now prove the equivalence between **fc xx ≥ and ( ) ( )**
fc xx π≥π . Consider the
profit function ( )( ) ( )xCxQf T −ε+=π . From the mean value Theorem, there exists xn
between *cx and *
fx such that ( ) ( ) ( ) ( )nfcfc xxxxx π′−=π−π **** . Therefore,
(A2) ( ) ( ) ( ) ( ) ( )( )nTfcfc xCQfxxxx ′−ε+−=π−π **** .
Yet, ( ) ( ) ( )xCQfx T ′−ε+=π' is the difference between price and marginal cost. If xce is
the competitive equilibrium, then ( ) 0' =π cex , but in this case all firms have market
power and so, ( ) 0' * >π cx and ( ) 0' * >π fx . Since xn is between *cx and *
fx , it must be that
( ) 0' >π nx is positive and so:
( ) ( )**fc xx π≥π if and only if **
fc xx ≥ .
Therefore, if ( )cc
cfc nNn
n−
−>φ
1 , profits for cartel members are greater than profits for
producers in the fringe, and thus more countries want to join the cartel. On the other
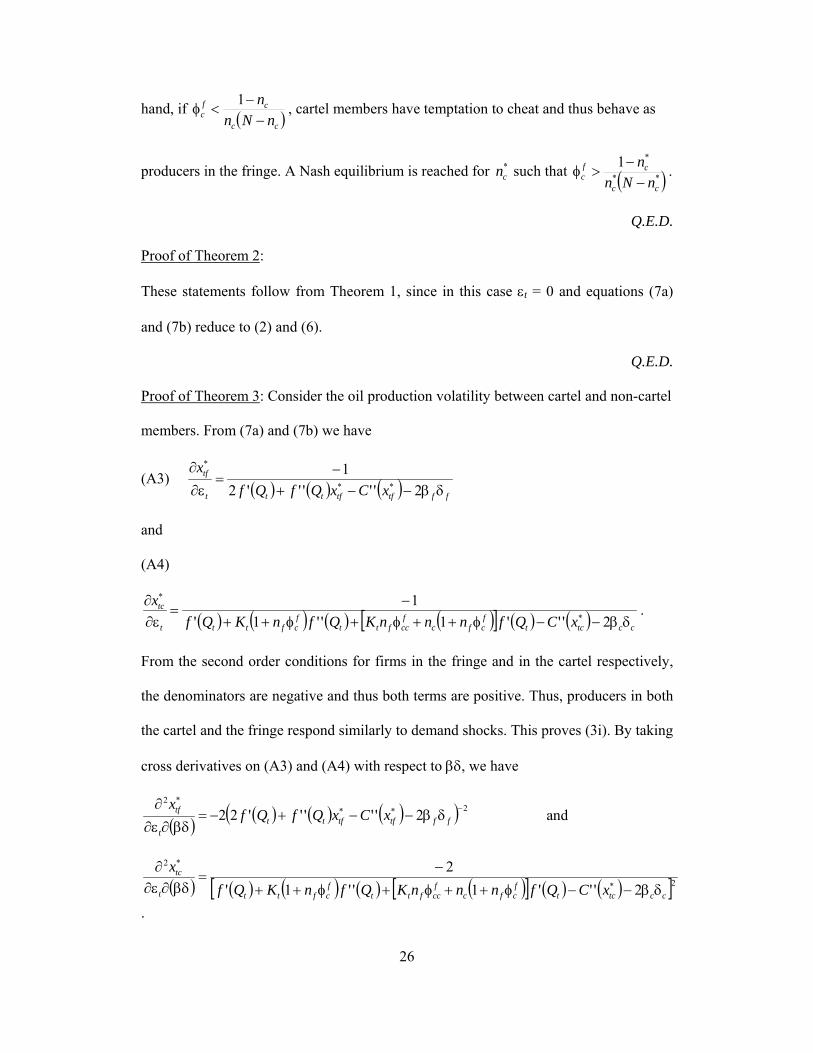
26
hand, if ( )cc
cfc nNn
n−
−<φ
1 , cartel members have temptation to cheat and thus behave as
producers in the fringe. A Nash equilibrium is reached for *cn such that ( )**
*1
cc
cfc nNn
n−
−>φ .
Q.E.D.
Proof of Theorem 2:
These statements follow from Theorem 1, since in this case εt = 0 and equations (7a)
and (7b) reduce to (2) and (6).
Q.E.D.
Proof of Theorem 3: Consider the oil production volatility between cartel and non-cartel
members. From (7a) and (7b) we have
(A3) ( ) ( ) ( ) fftftfttt
tf
xCxQfQfx
δβ−−+−
=ε∂
∂
2'''''21
**
*
and
(A4)
( ) ( ) ( ) ( )[ ] ( ) ( ) cctctfcfc
fccftt
fcfttt
tc
xCQfnnnKQfnKQfx
δβ−−φ++φ+φ++−
=ε∂
∂2'''1''1'
1*
*
.
From the second order conditions for firms in the fringe and in the cartel respectively,
the denominators are negative and thus both terms are positive. Thus, producers in both
the cartel and the fringe respond similarly to demand shocks. This proves (3i). By taking
cross derivatives on (A3) and (A4) with respect to βδ, we have
( ) ( ) ( ) ( )( ) 2***2
2'''''22 −δβ−−+−=βδ∂ε∂
∂fftftftt
t
tf xCxQfQfx
and
( ) ( ) ( ) ( ) ( )[ ] ( ) ( )[ ]2*
*2
2'''1''1'2
cctctfcfc
fccftt
fcfttt
tc
xCQfnnnKQfnKQfx
δβ−−φ++φ+φ++
−=
βδ∂ε∂∂
.
27
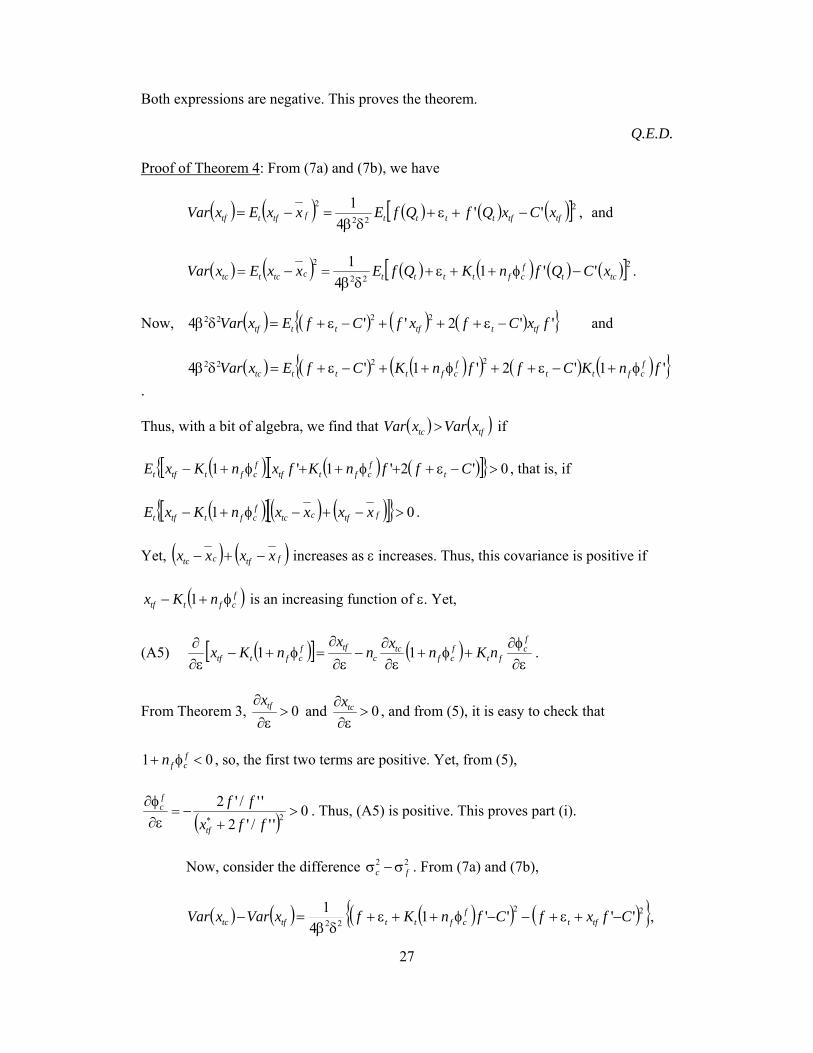
Both expressions are negative. This proves the theorem.
Q.E.D.
Proof of Theorem 4: From (7a) and (7b), we have
( ) ( ) ( ) ( ) ( )[ ]222
2''
41
tftfttttftfttf xCxQfQfExxExVar −+ε+δβ
=−= , and
( ) ( ) ( ) ( ) ( ) ( )[ ]222
2''1
41
tctfcfttttctcttc xCQfnKQfExxExVar −φ++ε+
δβ=−= .
Now, ( ) ( ) ( ) ( ){ }''2''4 2222 fxCfxfCfExVar tfttftttf −ε+++−ε+=δβ and
( ) ( ) ( )( ) ( ) ( ){ }'1'2'1'4 2222 fnKCffnKCfExVar fcftt
fcfttttc φ+−ε++φ++−ε+=δβ
.
Thus, with a bit of algebra, we find that ( ) ( )tftc xVarxVar > if
( )[ ] ( ) ( )[ ]{ } 0'2'1'1 >−ε++φ++φ+− CffnKfxnKxE tfcfttf
fcfttft , that is, if
( )[ ]( ) ( )[ ]{ } 01 >−+−φ+− ftfctcfcfttft xxxxnKxE .
Yet, ( ) ( )ftfctc xxxx −+− increases as ε increases. Thus, this covariance is positive if
( )fcfttf nKx φ+− 1 is an increasing function of ε. Yet,
(A5) ( )[ ] ( )ε∂φ∂
+φ+ε∂
∂−
ε∂∂
=φ+−ε∂∂ f
cft
fcf
tcc
tffcfttf nKnxn
xnKx 11 .
From Theorem 3, 0>ε∂
∂ tfx and 0>
ε∂∂ tcx , and from (5), it is easy to check that
01 <φ+ fcfn , so, the first two terms are positive. Yet, from (5),
( ) 0''/'2
''/'22*>
+−=
ε∂φ∂
ffxff
tf
fc . Thus, (A5) is positive. This proves part (i).
Now, consider the difference 22fc σ−σ . From (7a) and (7b),
( ) ( ) ( )( ) ( ){ }22
22 ''''14
1 CfxfCfnKfxVarxVar tftfcftttftc −+ε+−−φ++ε+
δβ=− ,
28
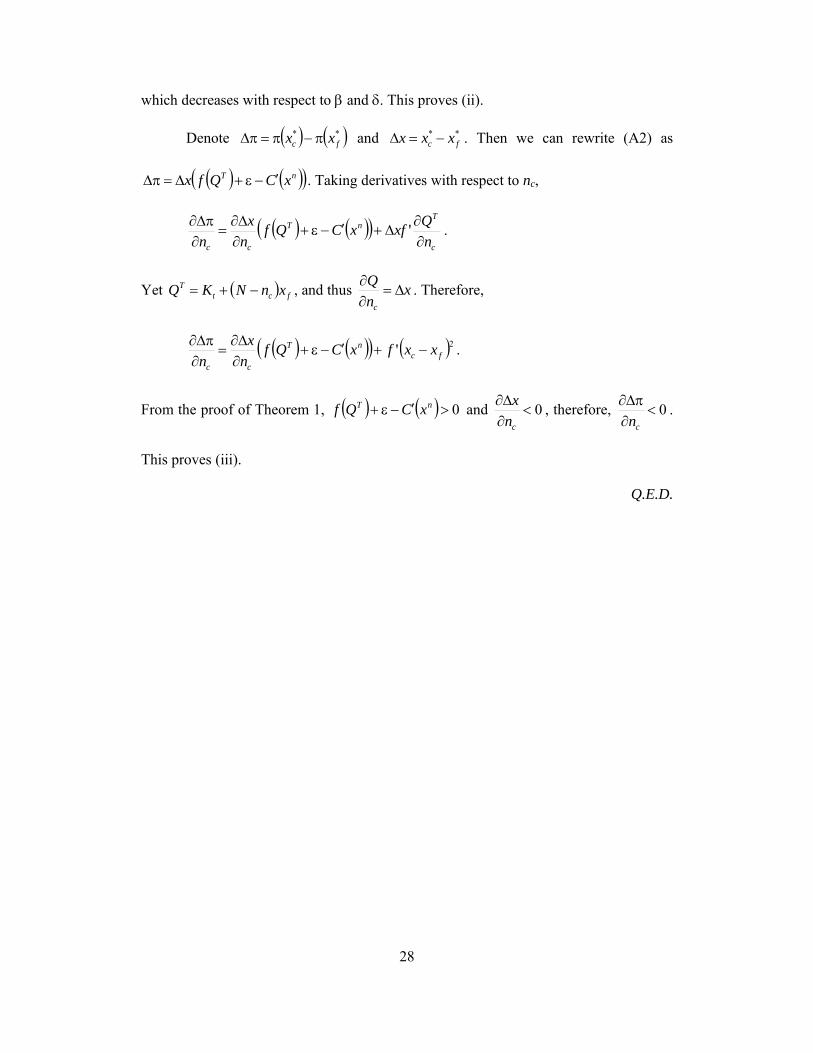
which decreases with respect to β and δ. This proves (ii).
Denote ( ) ( )**fc xx π−π=π∆ and **
fc xxx −=∆ . Then we can rewrite (A2) as
( ) ( )( )nT xCQfx ′−ε+∆=π∆ . Taking derivatives with respect to nc,
( ) ( )( )c
TnT
cc nQxfxCQf
nx
n ∂∂
∆+′−ε+∂∆∂
=∂π∆∂ ' .
Yet ( ) fctT xnNKQ −+= , and thus x
nQ
c
∆=∂∂ . Therefore,
( ) ( )( ) ( )2' fcnT
cc
xxfxCQfnx
n−+′−ε+
∂∆∂
=∂π∆∂ .
From the proof of Theorem 1, ( ) ( ) 0>′−ε+ nT xCQf and 0<∂∆∂
cnx , therefore, 0<
∂π∆∂
cn.
This proves (iii).
Q.E.D.
29
References Auty, Richard M., 2001, “The political economy of resource-driven growth,” European Economic Review 45, 839-46. Barnett, Steven and Rolando Ossowski, 2003, “What goes up…,” Finance and Development 40, 36-39. Baumol, William J., 1982, “Contestable markets: An uprising in the theory of industry structure,” American Economic Review 72, 1-15. Cordesman, Anthony H., 1999, “Stability and instability in the Gulf,” CSIS working paper (April). D’Aspremont, Claude, Alexis Jacquemin, Jean Jaskold Gabszewicz and John A. Weymark, 1983, “On the stability of collusive price leadership,” Canadian Journal of Economics February, 17-25. Dixit, Avinash K., 1980, “The role of investment in entry deterrence,” The Economic Journal 90, 95-106. Donsimoni, Marie-Paule, Nicholas S. Economides and H. M. Polemarchakis, 1986, “Stable cartels,” International Economic Review June, 317-27. Eastwood, R. K., and A.J. Venables, 1982, “The macroeconomic implications of a resource discovery in an open-economy,” The Economic Journal 92 (366), 285-299. Garrat, Anthony, Kevin Lee, M. Hashem Pesaran and Yongcheol Shin, 2002, “A long-run structural macroeconometric model of the UK,” The Economic Journal 113 (487), 412-455. Griffin James M., 1985, “OPEC behavior: A test of alternative hypotheses,” American Economics Review 75, 954-63. Griffin, James M. and Weiwen Xiong, 1997, “The incentive to cheat: An empirical analysis of OPEC,” Journal of Law and Economics 40, 289-316. Gylfason, Thorvaldur, 2001, “Natural resources, education, and economic development,” European Economic Review 25, 847-59. Harkness, Jon, 1984, “Optimal oil pricing in a small open economy: A macroeconomic perspective,” Canadian Journal of Economics 17, 762-73. Jacquemin, Alexis and Margaret E. Slade, 1989, “Cartels, collusions and horizontal mergers,” in the Handbook of Industrial Organization, Volume I, Chapter 7, Richard Schmalensee and Robert Willig, editors, North Holland, Amsterdam. Jalali-Naini, Ahmad R., and Mehdi Asali, 2004, “Cyclical behaviour and shock-persistence: crude oil prices,” OPEC Review 28, 107-131.
30
Jeanne, Olivier D, 2003, “Why do emerging economies borrow in foreign currency?” IMF Working Papers 03/177,. Litan, Robert E., Michael Pomerleano and Vasudevan Sundarajan, 2003, “The future of domestic capital markets in developing countries,” World Bank/IMF/Brookings Emerging Markets Series. Washington, D.C.: Brookings Institution, 532. Loderer, Claudio, 1985, “A test of the OPEC cartel hypothesis: 1974-1983,” Journal of Finance 40, 991-1006. Marette, Stephan and John M. Crespi, 2003, “Can quality certification lead to stable cartels?” Review of Industrial Organization 23, 43-64. Morrison, Kevin, 2004, “Pressures at home prey on the minds of OPEC ministers,” Financial Times, Thursday, July 8. Reinganum, Jennifer F., 1985, “A two stage model of research and development with endogenous second mover advantages,” International Journal of Industrial Organization 3, 275-292. Rodriguez, Francisco and Jeffrey D. Sachs, 1999, “Why do resource-abundant economies grow more slowly?” Journal of Economic Growth 4, 277-303. Sachs, Jeffrey D., and Andrew M. Warner, 2001, “The curse of natural resources,” European Economic Review 45, 827-38. Sy, Amadou, 2003, “Rating the rating agencies: Anticipating currency crises or debt crises,” IMF Working Papers 03/122. Spence, Michael, 1979, “Investment strategy and growth in a new market,” Bell Journal of Economics Spring 10, 1-19. Stevens, Paul, 2003, “Resource impact – curse or blessing? A literature survey,” Journal of Energy Literature 9, 3-42.
Individual researchers, as well as the on-line and printed versions of the CERGE-EI Working Papers (including their dissemination) were supported from the following institutional grants:
• Economic Aspects of EU and EMU Entry [Ekonomické aspekty vstupu do Evropské unie a Evropské měnové unie], No. AVOZ70850503, (2005-2010);
• Economic Impact of European Integration on the Czech Republic [Ekonomické dopady evropské integrace na ČR], No. MSM0021620846, (2005-2011);
Specific research support and/or other grants the researchers/publications benefited from are acknowledged at the beginning of the Paper. (c) José Noguera, Rowena A. Pecchenino, 2005 All rights reserved. No part of this publication may be reproduced, stored in a retrieval system or transmitted in any form or by any means, electronic, mechanical or photocopying, recording, or otherwise without the prior permission of the publisher. Published by Charles University in Prague, Center for Economic Research and Graduate Education (CERGE) and Economics Institute (EI), Academy of Sciences of the Czech Republic CERGE-EI, Politických vězňů 7, 111 21 Prague 1, tel.: +420 224 005 153, Czech Republic. Printed by CERGE-EI, Prague Subscription: CERGE-EI homepage: http://www.cerge-ei.cz Editors: Directors of CERGE and EI Managing editors: Deputy Directors for Research of CERGE and EI ISSN 1211-3298 ISBN 80-7343-076-2 (Univerzita Karlova v Praze, CERGE) ISBN 80-7344-065-2 (Národohospodářský ústav AV ČR, Praha)