Embed Size (px)
Citation preview
Which Firms Benefit More
from Financial Development?
Jan Bena and Štěpán JurajdaLSE CERGE-EI
Solstrand, NorwayMay 2007
MOTIVATION
There is positive cross-country correlation between financial developmentand economic activity (Goldsmith, 1969; King & Levine, 1993) and severalpossible causal channels underlying it, running both ways.
One channel supported both theoretically and empirically
FINANCIAL DEVELOPMENT Overcomes market frictions (asymmetric information or moral hazard) Lowers external finance costs (constraints) Leads to more use of external finance and higher corporate growth
Finance theory:External finance costs arise as a consequence of market frictions (asymmetric information).
Survey evidence: Small and young firms report to be constrained in access to external finance.
PROPOSAL
•Take company size and age as an effective proxy for the extent of information asymmetry firms face (Berger et al., 2001, 2002).
•Small and young firms should benefit disproportionately from financial system becoming more efficient ( = financial development).
We ask whether this is the case.
•Relevance: WB, EU or EBRD spend $s to support SME growth.
•Rajan & Zingales (1998) asked about the difference in the finance-growth effect across industries. We apply their strategy at firm-level.
THE RAJAN & ZINGALES IDENTIFICATION STRATEGY
1. External finance more costly than internal.
2. US measure of industry external finance dependence (EFD) describes industry external finance need in all countries (Zimbabwe).
3. Regress industry-country growth on- Country and industry fixed effects- An interaction term EFDINDUSTRY * Financial_DevelopmentCOUNTRY
to ask whether industries in more need of external finance grow faster in financially more developed countries conditional on all (potentially unobservable) country- and industry-specific factors affecting growth.
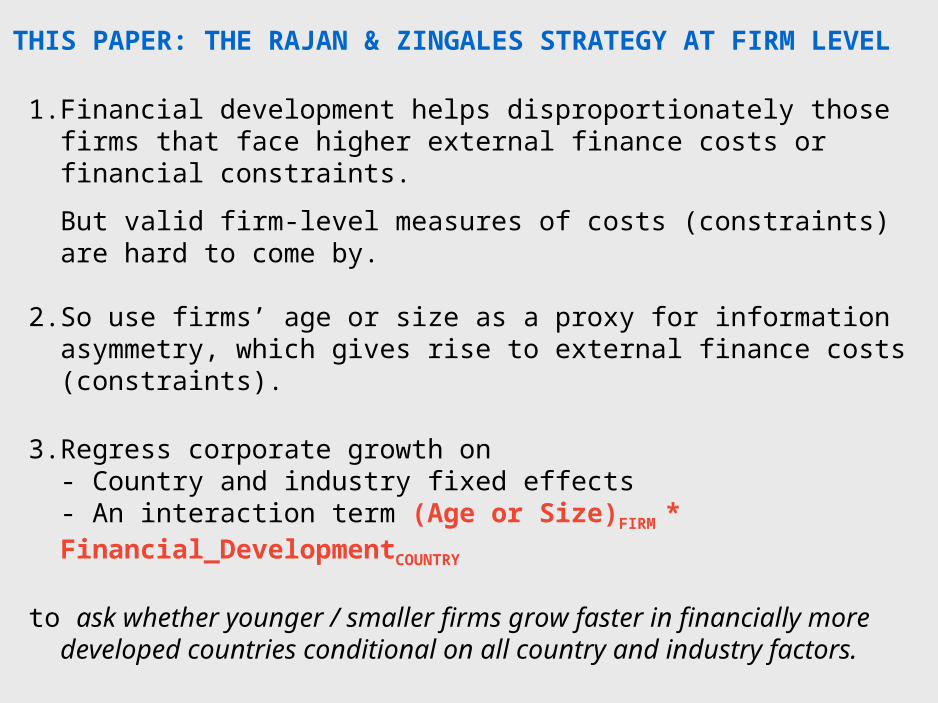
THIS PAPER: THE RAJAN & ZINGALES STRATEGY AT FIRM LEVEL
1. Financial development helps disproportionately those firms that face higher external finance costs or financial constraints.
But valid firm-level measures of costs (constraints) are hard to come by.
2. So use firms’ age or size as a proxy for information asymmetry, which gives rise to external finance costs (constraints).
3. Regress corporate growth on- Country and industry fixed effects- An interaction term (Age or Size)FIRM * Financial_DevelopmentCOUNTRY
to ask whether younger / smaller firms grow faster in financially more developed countries conditional on all country and industry factors.
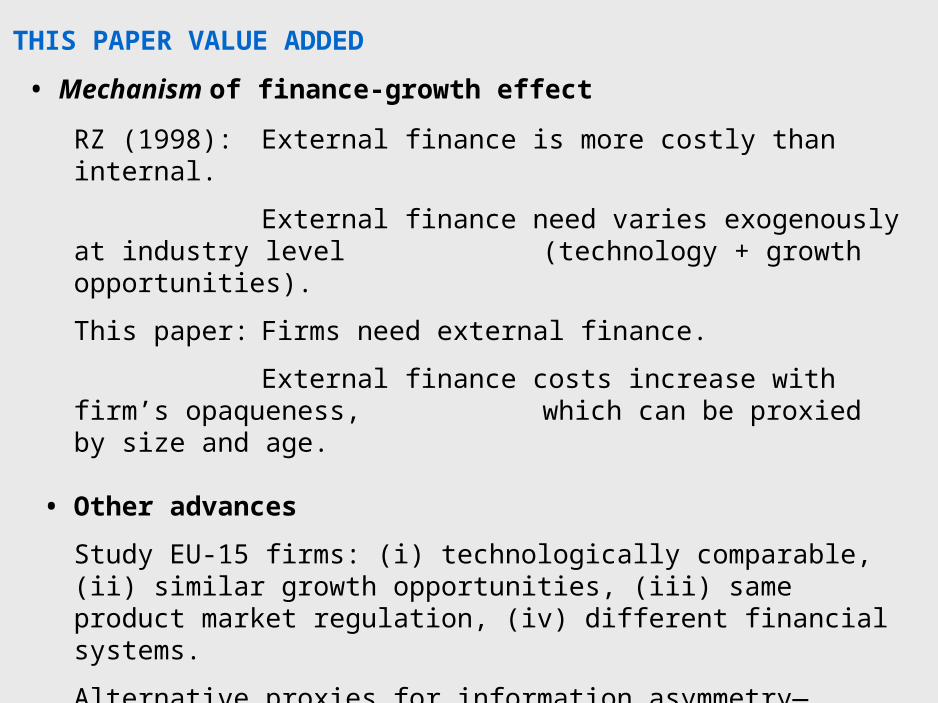
THIS PAPER VALUE ADDED
• Mechanism of finance-growth effect
RZ (1998): External finance is more costly than internal.
External finance need varies exogenously at industry level (technology + growth opportunities).
This paper: Firms need external finance.
External finance costs increase with firm’s opaqueness, which can be proxied by size and age.
• Other advances
Study EU-15 firms: (i) technologically comparable, (ii) similar growth opportunities, (iii) same product market regulation, (iv) different financial systems.
Alternative proxies for information asymmetry—absolute or relative—to allow for different screening techniques of financial intermediaries.
Compare results based on alternative sources of variation.
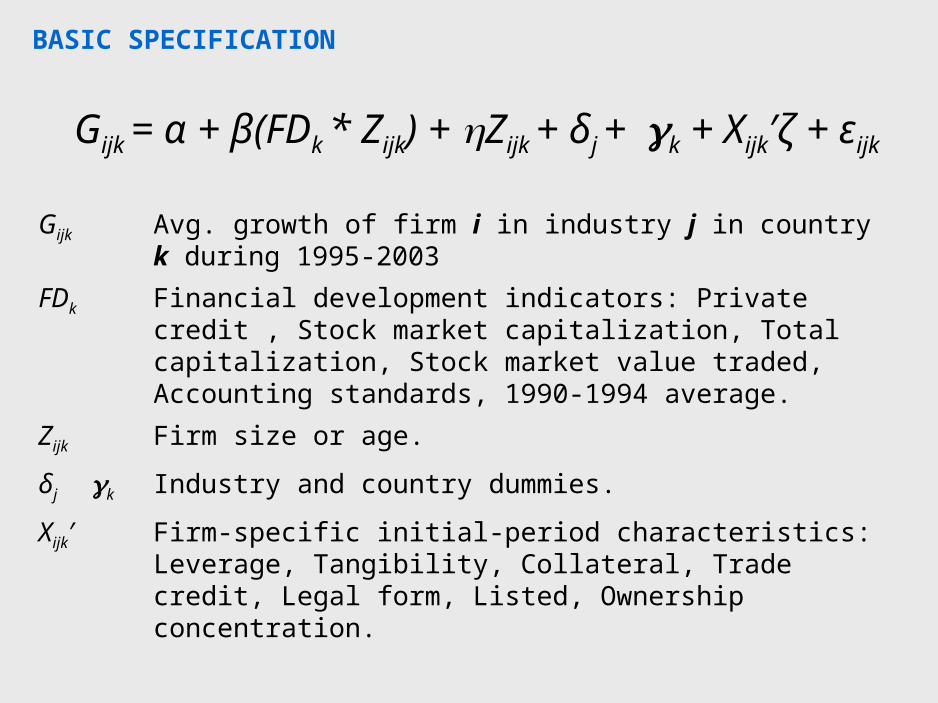
BASIC SPECIFICATION
Gijk = α + β(FDk * Zijk) + Zijk + δj +k + Xijk′ζ + εijk
Gijk Avg. growth of firm i in industry j in country k during 1995-2003
FDk Financial development indicators: Private credit , Stock market capitalization, Total capitalization, Stock market value traded, Accounting standards, 1990-1994 average.
Zijk Firm size or age.
δj k Industry and country dummies.
Xijk′ Firm-specific initial-period characteristics: Leverage, Tangibility, Collateral, Trade credit, Legal form, Listed, Ownership concentration.
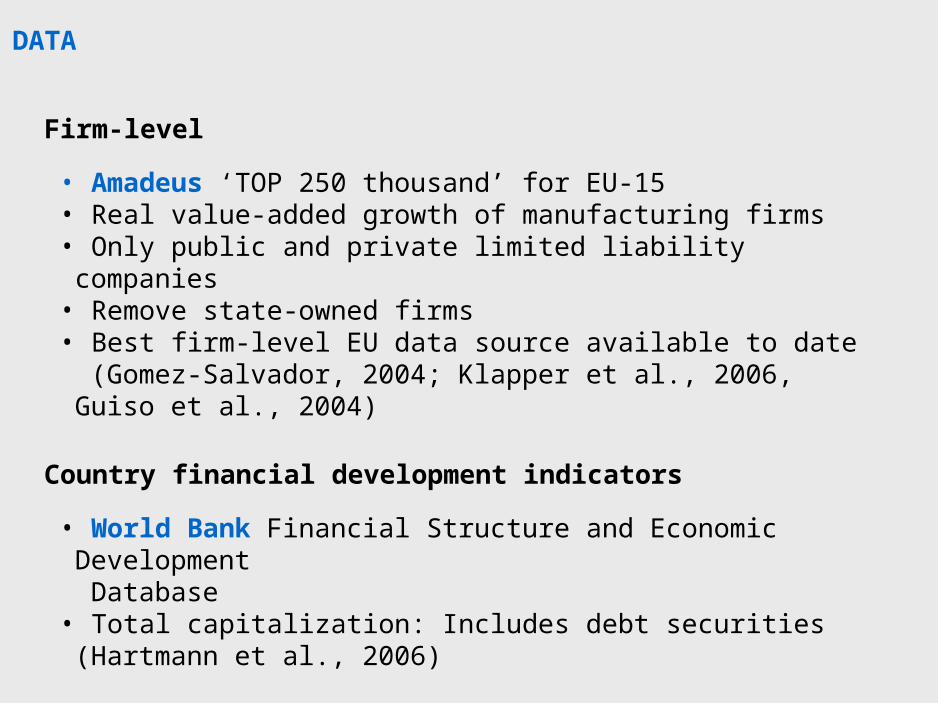
DATA
Firm-level
• Amadeus ‘TOP 250 thousand’ for EU-15• Real value-added growth of manufacturing firms• Only public and private limited liability companies• Remove state-owned firms• Best firm-level EU data source available to date
(Gomez-Salvador, 2004; Klapper et al., 2006, Guiso et al., 2004)
Country financial development indicators
• World Bank Financial Structure and Economic Development Database• Total capitalization: Includes debt securities (Hartmann et al., 2006)
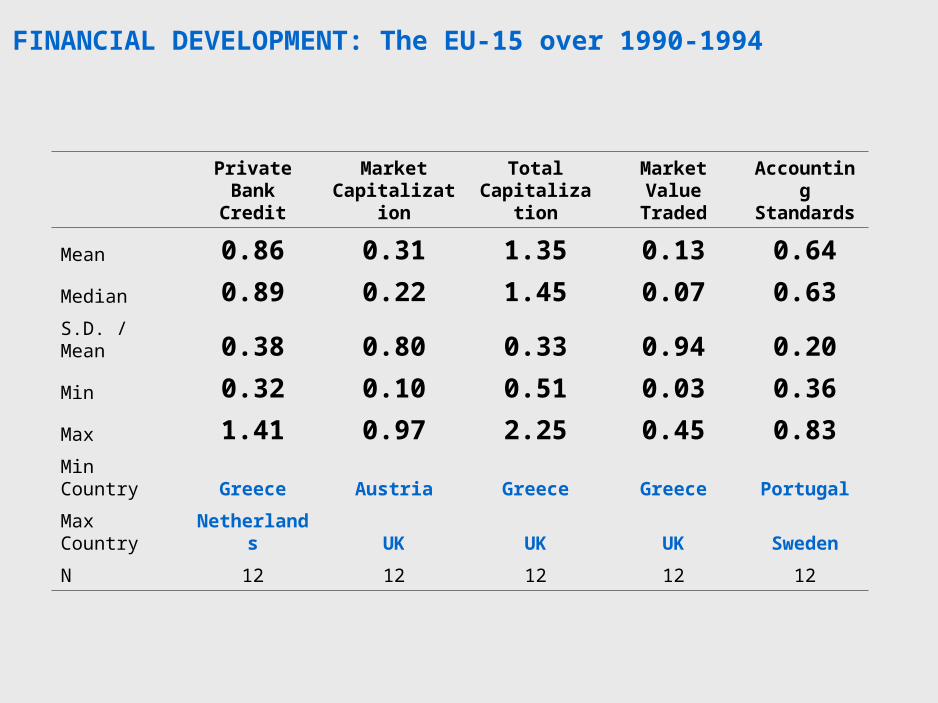
FINANCIAL DEVELOPMENT: The EU-15 over 1990-1994
Private Bank
CreditMarket
Capitalization
Total Capitalizatio
n
Market Value Traded
Accounting Standards
Mean 0.86 0.31 1.35 0.13 0.64
Median 0.89 0.22 1.45 0.07 0.63
S.D. / Mean 0.38 0.80 0.33 0.94 0.20
Min 0.32 0.10 0.51 0.03 0.36
Max 1.41 0.97 2.25 0.45 0.83Min Country Greece Austria Greece Greece Portugal
Max Country Netherlands UK UK UK Sweden
N 12 12 12 12 12
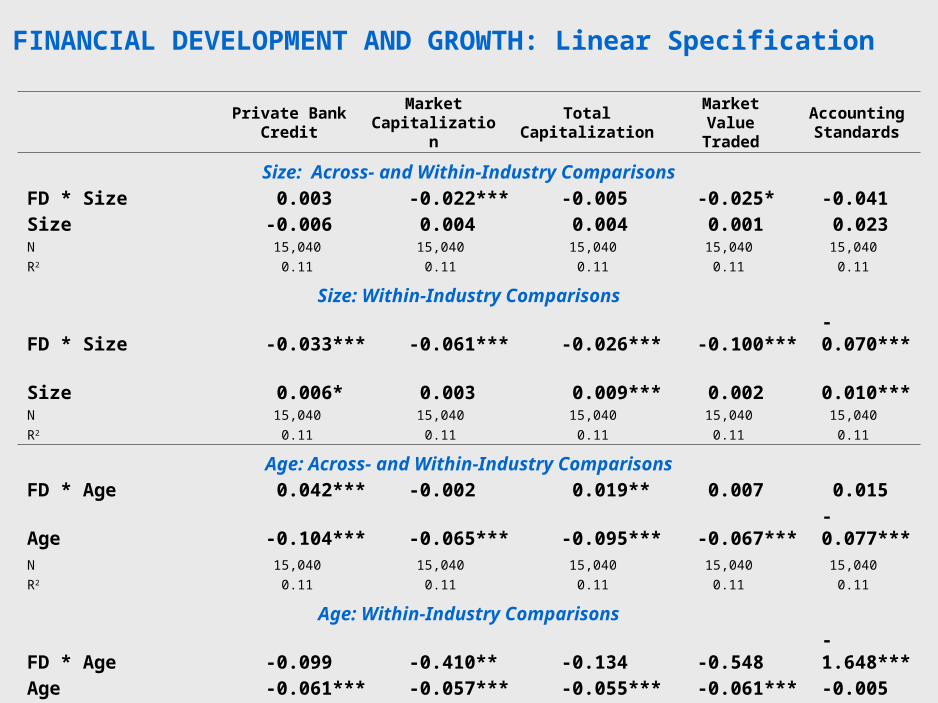
FINANCIAL DEVELOPMENT AND GROWTH: Linear Specification
Private Bank
CreditMarket
CapitalizationTotal
CapitalizationMarket Value
TradedAccounting Standards
Size: Across- and Within-Industry Comparisons
FD * Size 0.003 -0.022*** -0.005 -0.025* -0.041
Size -0.006 0.004 0.004 0.001 0.023N 15,040 15,040 15,040 15,040 15,040
R2 0.11 0.11 0.11 0.11 0.11
Size: Within-Industry Comparisons
FD * Size -0.033*** -0.061*** -0.026*** -0.100*** -0.070***
Size 0.006* 0.003 0.009*** 0.002 0.010***N 15,040 15,040 15,040 15,040 15,040
R2 0.11 0.11 0.11 0.11 0.11
Age: Across- and Within-Industry Comparisons
FD * Age 0.042*** -0.002 0.019** 0.007 0.015
Age -0.104*** -0.065*** -0.095*** -0.067*** -0.077***N 15,040 15,040 15,040 15,040 15,040
R2 0.11 0.11 0.11 0.11 0.11
Age: Within-Industry Comparisons
FD * Age -0.099 -0.410** -0.134 -0.548 -1.648***
Age -0.061*** -0.057*** -0.055*** -0.061*** -0.005N 15,040 15,040 15,040 15,040 15,040
R2 0.11 0.11 0.11 0.11 0.11
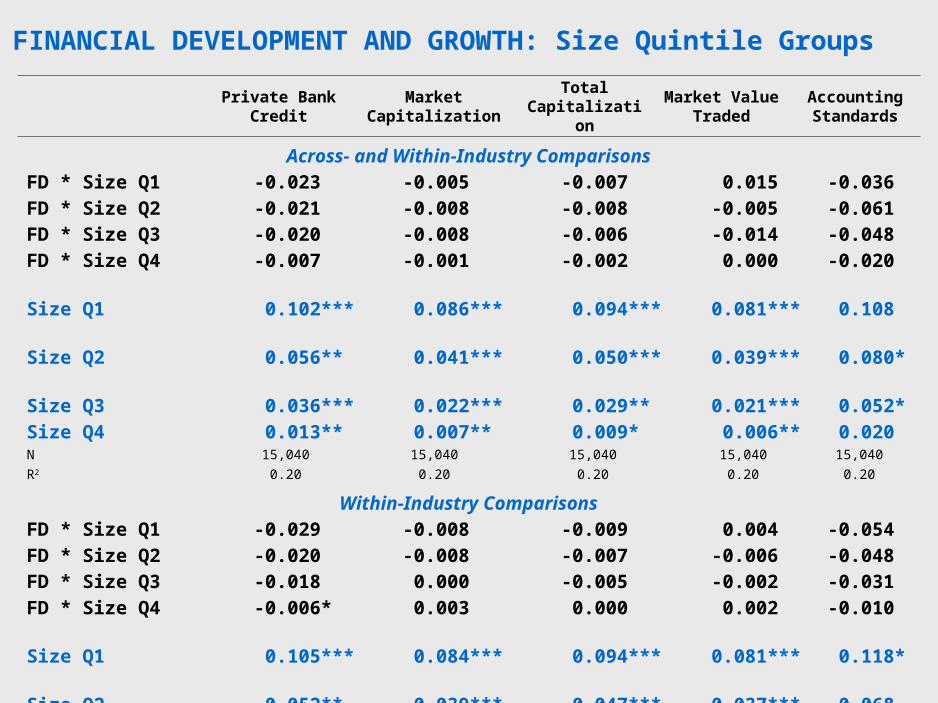
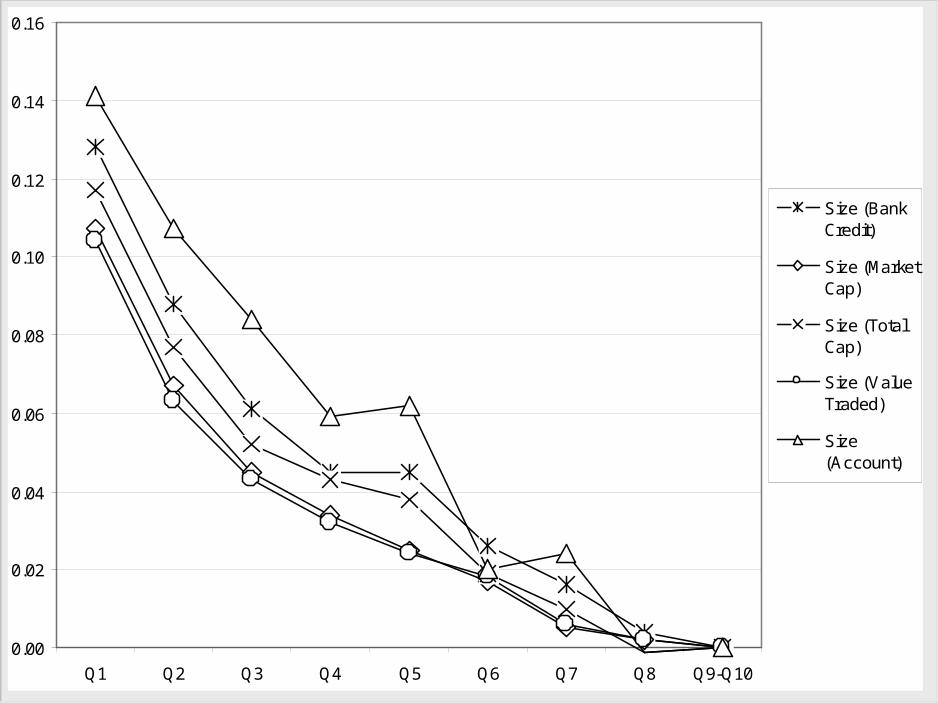
FINANCIAL DEVELOPMENT AND GROWTH: Size Quintile Groups
Private Bank
CreditMarket
CapitalizationTotal
CapitalizationMarket Value
TradedAccounting Standards
Across- and Within-Industry Comparisons
FD * Size Q1 -0.023 -0.005 -0.007 0.015 -0.036
FD * Size Q2 -0.021 -0.008 -0.008 -0.005 -0.061
FD * Size Q3 -0.020 -0.008 -0.006 -0.014 -0.048
FD * Size Q4 -0.007 -0.001 -0.002 0.000 -0.020
Size Q1 0.102*** 0.086*** 0.094*** 0.081*** 0.108
Size Q2 0.056** 0.041*** 0.050*** 0.039*** 0.080*
Size Q3 0.036*** 0.022*** 0.029** 0.021*** 0.052*
Size Q4 0.013** 0.007** 0.009* 0.006** 0.020N 15,040 15,040 15,040 15,040 15,040
R2 0.20 0.20 0.20 0.20 0.20
Within-Industry Comparisons
FD * Size Q1 -0.029 -0.008 -0.009 0.004 -0.054
FD * Size Q2 -0.020 -0.008 -0.007 -0.006 -0.048
FD * Size Q3 -0.018 0.000 -0.005 -0.002 -0.031
FD * Size Q4 -0.006* 0.003 0.000 0.002 -0.010
Size Q1 0.105*** 0.084*** 0.094*** 0.081*** 0.118*
Size Q2 0.052** 0.039*** 0.047*** 0.037*** 0.068
Size Q3 0.035*** 0.021*** 0.028** 0.021*** 0.041*
Size Q4 0.010*** 0.004** 0.005 0.004** 0.012N 15,040 15,040 15,040 15,040 15,040
R2 0.20 0.20 0.20 0.20 0.20
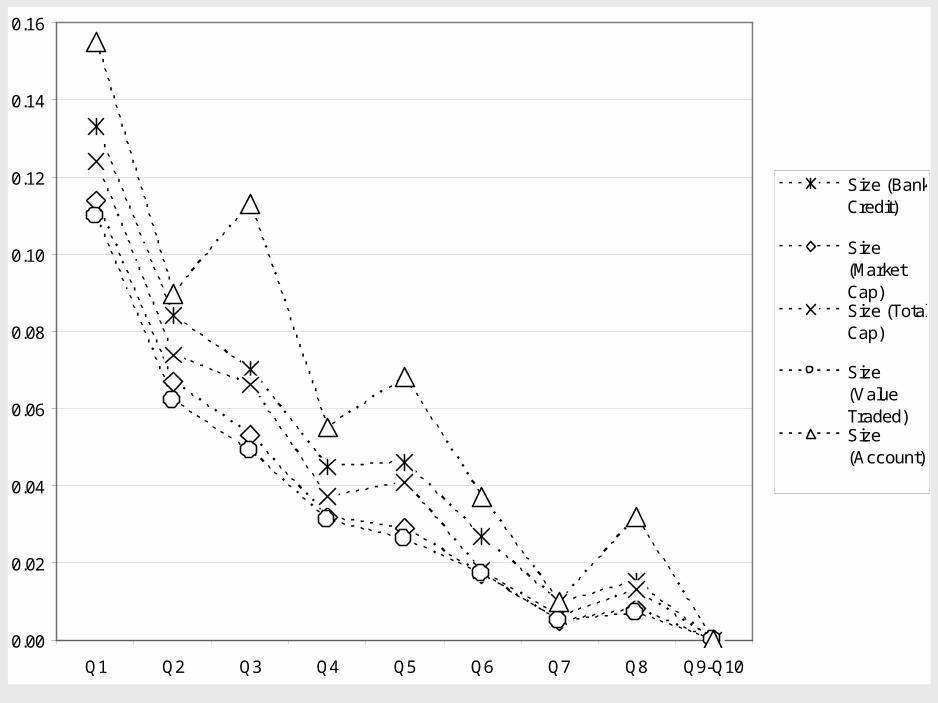
0.00
0.02
0.04
0.06
0.08
0.10
0.12
0.14
0.16
Q1 Q2 Q3 Q4 Q5 Q6 Q7 Q8 Q9-Q10
Size (BankCredit)
Size(MarketCap)Size (TotalCap)
Size(ValueTraded)Size(Account)
0.00
0.02
0.04
0.06
0.08
0.10
0.12
0.14
0.16
Q1 Q2 Q3 Q4 Q5 Q6 Q7 Q8 Q9-Q10
Size (BankCredit)
Size (MarketCap)
Size (TotalCap)
Size (ValueTraded)
Size(Account)
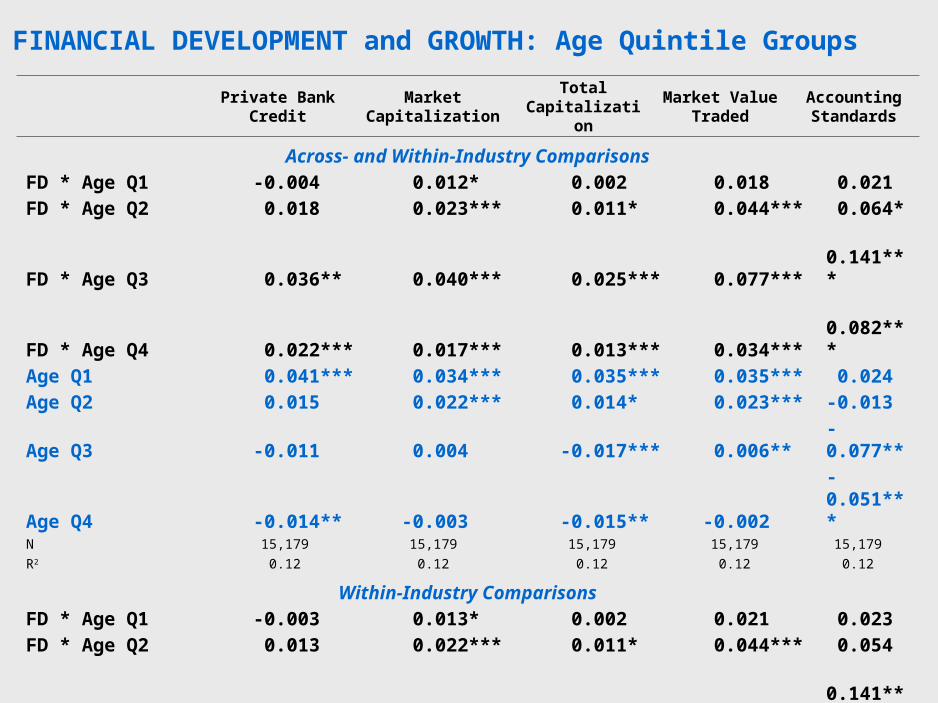
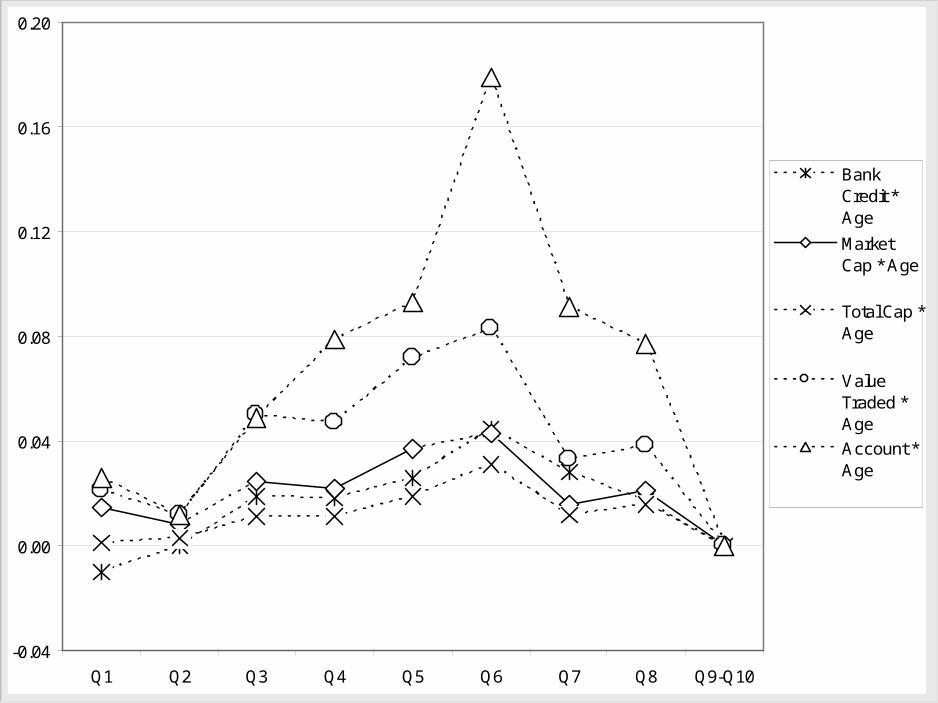
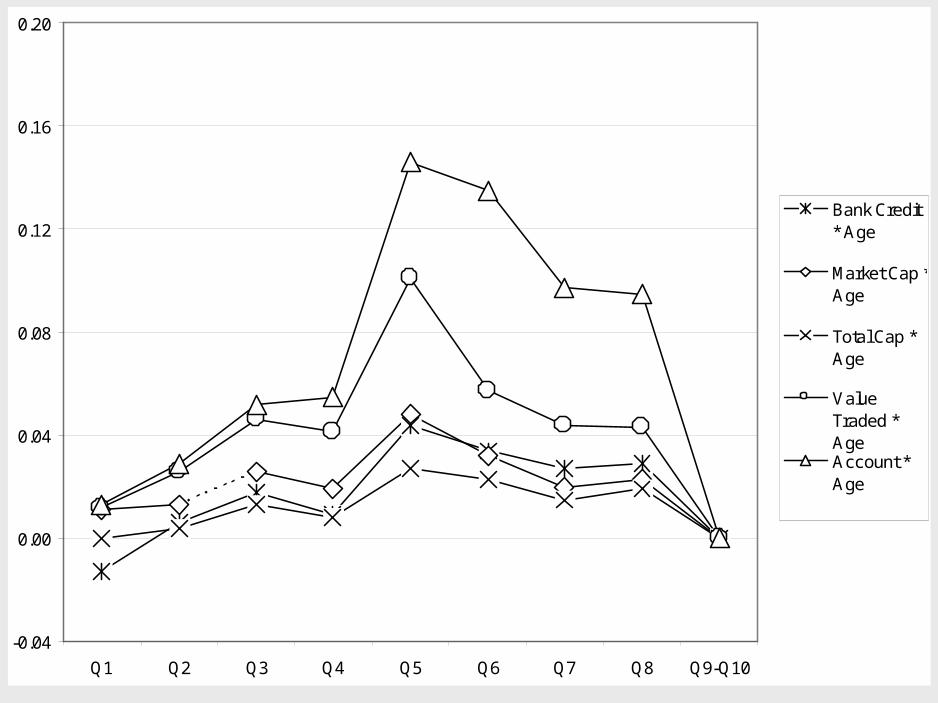
FINANCIAL DEVELOPMENT and GROWTH: Age Quintile Groups
Private Bank
CreditMarket
CapitalizationTotal
CapitalizationMarket Value
TradedAccounting Standards
Across- and Within-Industry Comparisons
FD * Age Q1 -0.004 0.012* 0.002 0.018 0.021
FD * Age Q2 0.018 0.023*** 0.011* 0.044*** 0.064*
FD * Age Q3 0.036** 0.040*** 0.025*** 0.077*** 0.141***
FD * Age Q4 0.022*** 0.017*** 0.013*** 0.034*** 0.082***
Age Q1 0.041*** 0.034*** 0.035*** 0.035*** 0.024
Age Q2 0.015 0.022*** 0.014* 0.023*** -0.013
Age Q3 -0.011 0.004 -0.017*** 0.006** -0.077**
Age Q4 -0.014** -0.003 -0.015** -0.002 -0.051***N 15,179 15,179 15,179 15,179 15,179
R2 0.12 0.12 0.12 0.12 0.12
Within-Industry Comparisons
FD * Age Q1 -0.003 0.013* 0.002 0.021 0.023
FD * Age Q2 0.013 0.022*** 0.011* 0.044*** 0.054
FD * Age Q3 0.040*** 0.041*** 0.025*** 0.081*** 0.141***
FD * Age Q4 0.027*** 0.021*** 0.016*** 0.043*** 0.093***
Age Q1 0.041*** 0.035*** 0.036*** 0.036*** 0.024
Age Q2 0.020* 0.023*** 0.015 0.024*** -0.006
Age Q3 -0.011 0.006 -0.015** 0.008** -0.074**
Age Q4 -0.016** -0.001 -0.017** 0.000 -0.056***N 15,179 15,179 15,179 15,179 15,179
R2 0.12 0.12 0.12 0.12 0.12
-0.04
0.00
0.04
0.08
0.12
0.16
0.20
Q1 Q2 Q3 Q4 Q5 Q6 Q7 Q8 Q9-Q10
BankCredit *Age
MarketCap * Age
Total Cap *Age
ValueTraded *Age
Account *Age
-0.04
0.00
0.04
0.08
0.12
0.16
0.20
Q1 Q2 Q3 Q4 Q5 Q6 Q7 Q8 Q9-Q10
Bank Credit* Age
Market Cap *Age
Total Cap *Age
ValueTraded *AgeAccount *Age
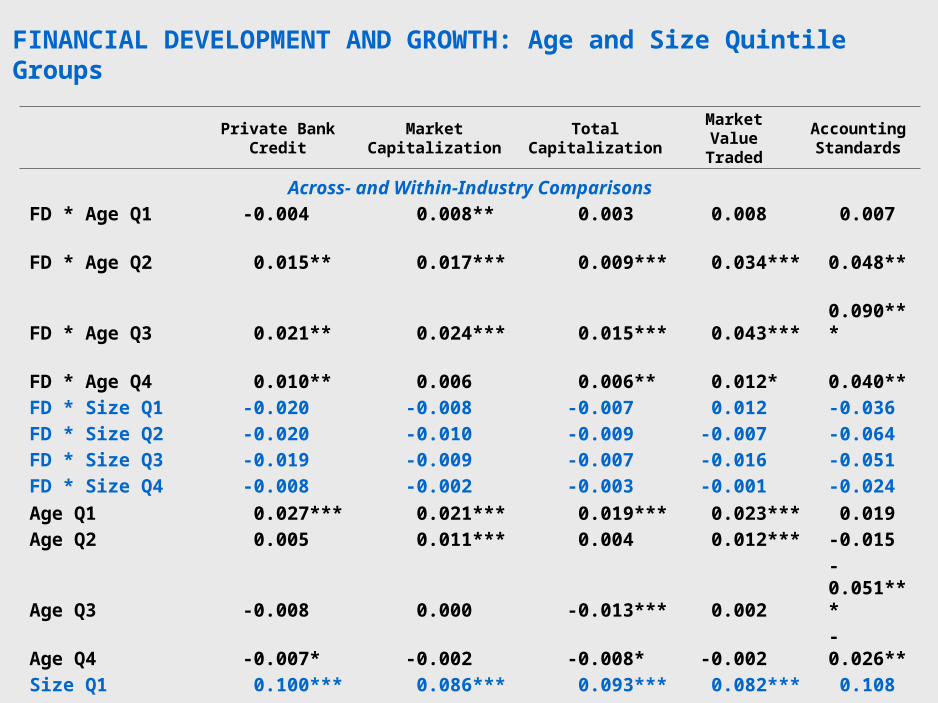
FINANCIAL DEVELOPMENT AND GROWTH: Age and Size Quintile Groups
Private Bank
CreditMarket
CapitalizationTotal
CapitalizationMarket Value
TradedAccounting Standards
Across- and Within-Industry Comparisons
FD * Age Q1 -0.004 0.008** 0.003 0.008 0.007
FD * Age Q2 0.015** 0.017*** 0.009*** 0.034*** 0.048**
FD * Age Q3 0.021** 0.024*** 0.015*** 0.043*** 0.090***
FD * Age Q4 0.010** 0.006 0.006** 0.012* 0.040**
FD * Size Q1 -0.020 -0.008 -0.007 0.012 -0.036
FD * Size Q2 -0.020 -0.010 -0.009 -0.007 -0.064
FD * Size Q3 -0.019 -0.009 -0.007 -0.016 -0.051
FD * Size Q4 -0.008 -0.002 -0.003 -0.001 -0.024
Age Q1 0.027*** 0.021*** 0.019*** 0.023*** 0.019
Age Q2 0.005 0.011*** 0.004 0.012*** -0.015
Age Q3 -0.008 0.000 -0.013*** 0.002 -0.051***
Age Q4 -0.007* -0.002 -0.008* -0.002 -0.026**
Size Q1 0.100*** 0.086*** 0.093*** 0.082*** 0.108
Size Q2 0.056** 0.043*** 0.052*** 0.041*** 0.083*
Size Q3 0.036*** 0.024*** 0.030** 0.023*** 0.055**
Size Q4 0.014** 0.008*** 0.012** 0.007** 0.024N 15,179 15,179 15,179 15,179 15,179
R2 0.21 0.21 0.21 0.21 0.21
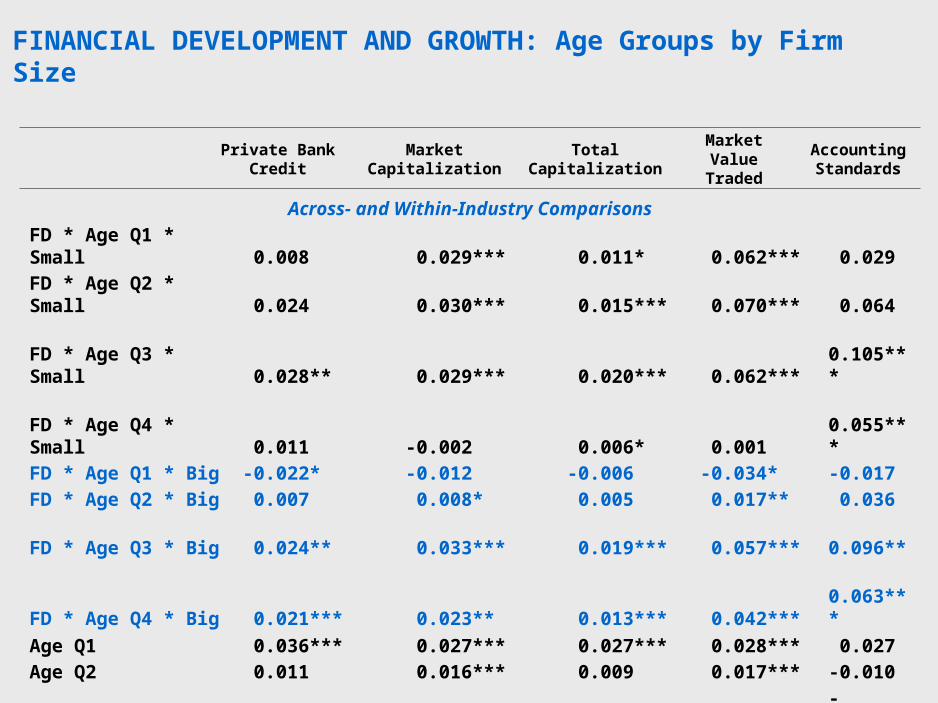
FINANCIAL DEVELOPMENT AND GROWTH: Age Groups by Firm Size
Private Bank
CreditMarket
CapitalizationTotal
CapitalizationMarket Value
TradedAccounting Standards
Across- and Within-Industry Comparisons
FD * Age Q1 * Small 0.008 0.029*** 0.011* 0.062*** 0.029
FD * Age Q2 * Small 0.024 0.030*** 0.015*** 0.070*** 0.064
FD * Age Q3 * Small 0.028** 0.029*** 0.020*** 0.062*** 0.105***
FD * Age Q4 * Small 0.011 -0.002 0.006* 0.001 0.055***
FD * Age Q1 * Big -0.022* -0.012 -0.006 -0.034* -0.017
FD * Age Q2 * Big 0.007 0.008* 0.005 0.017** 0.036
FD * Age Q3 * Big 0.024** 0.033*** 0.019*** 0.057*** 0.096**
FD * Age Q4 * Big 0.021*** 0.023** 0.013*** 0.042*** 0.063***
Age Q1 0.036*** 0.027*** 0.027*** 0.028*** 0.027
Age Q2 0.011 0.016*** 0.009 0.017*** -0.010
Age Q3 -0.009 0.000 -0.015*** 0.002 -0.055**
Age Q4 -0.012** -0.004 -0.013** -0.003 -0.038***
Big -0.037*** -0.041*** -0.037*** -0.040*** -0.034***N 15,179 15,179 15,179 15,179 15,179
R2 0.17 0.17 0.17 0.17 0.17
UNDERSTANDING THE RESULTS FOR THE YOUNGEST FIRMS
• If startups in low FD economies expect that in their early years it may be hard to raise external finance, then
they ought to get endowed with an unusually high amount of initial equity at incorporation.
• Our regression asks whether
equity endowment differs for otherwise similar newly incorporated companies across low/high FD.
• In accord with the hypothesis, we find that
conditional on the effect FD has on equity endowment of all firms, the age gradient of equity endowment is higher for low FD levels.
WITHIN- OR ACROSS-INDUSTRY COMPARISONS?
Firm-level analysis improves upon the industry-level
• Measure size (age) and growth precisely• No need for RZ-style assumptions• Use new sources of variation
• Compare results based on within- and across-industry size variation to discern the importance of firm-level unobservables.
• Measure growth of only firms of the industry-induced size.
• Discuss issues of firm survival and entry.
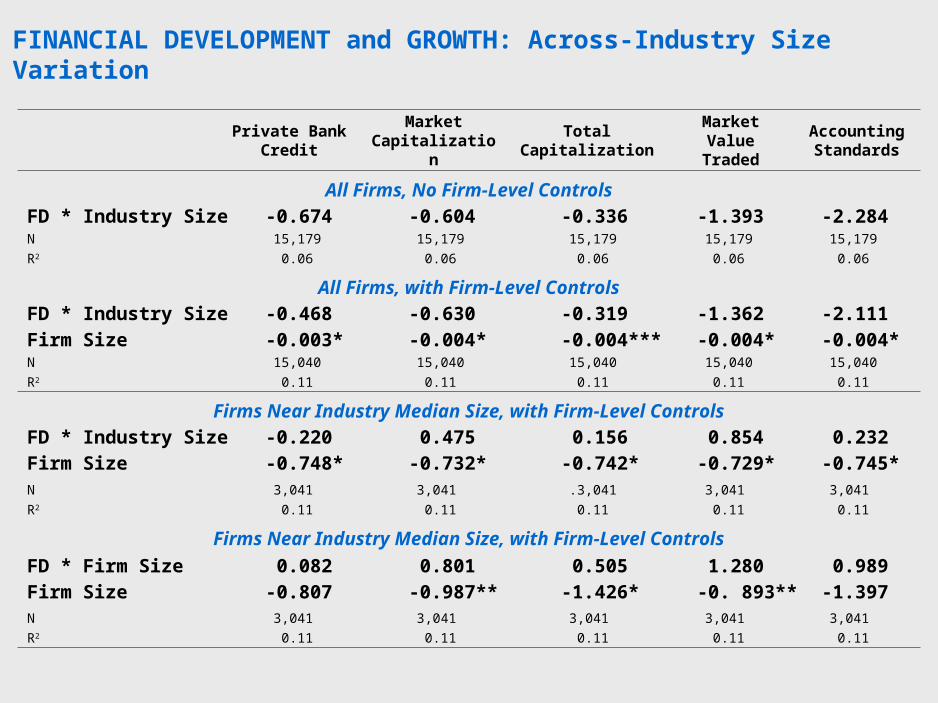
FINANCIAL DEVELOPMENT and GROWTH: Across-Industry Size Variation
Private Bank
CreditMarket
CapitalizationTotal
CapitalizationMarket Value
TradedAccounting Standards
All Firms, No Firm-Level Controls
FD * Industry Size -0.674 -0.604 -0.336 -1.393 -2.284N 15,179 15,179 15,179 15,179 15,179
R2 0.06 0.06 0.06 0.06 0.06
All Firms, with Firm-Level Controls
FD * Industry Size -0.468 -0.630 -0.319 -1.362 -2.111
Firm Size -0.003* -0.004* -0.004*** -0.004* -0.004*N 15,040 15,040 15,040 15,040 15,040
R2 0.11 0.11 0.11 0.11 0.11
Firms Near Industry Median Size, with Firm-Level Controls
FD * Industry Size -0.220 0.475 0.156 0.854 0.232
Firm Size -0.748* -0.732* -0.742* -0.729* -0.745*N 3,041 3,041 .3,041 3,041 3,041
R2 0.11 0.11 0.11 0.11 0.11
Firms Near Industry Median Size, with Firm-Level Controls
FD * Firm Size 0.082 0.801 0.505 1.280 0.989
Firm Size -0.807 -0.987** -1.426* -0. 893** -1.397N 3,041 3,041 3,041 3,041 3,041
R2 0.11 0.11 0.11 0.11 0.11
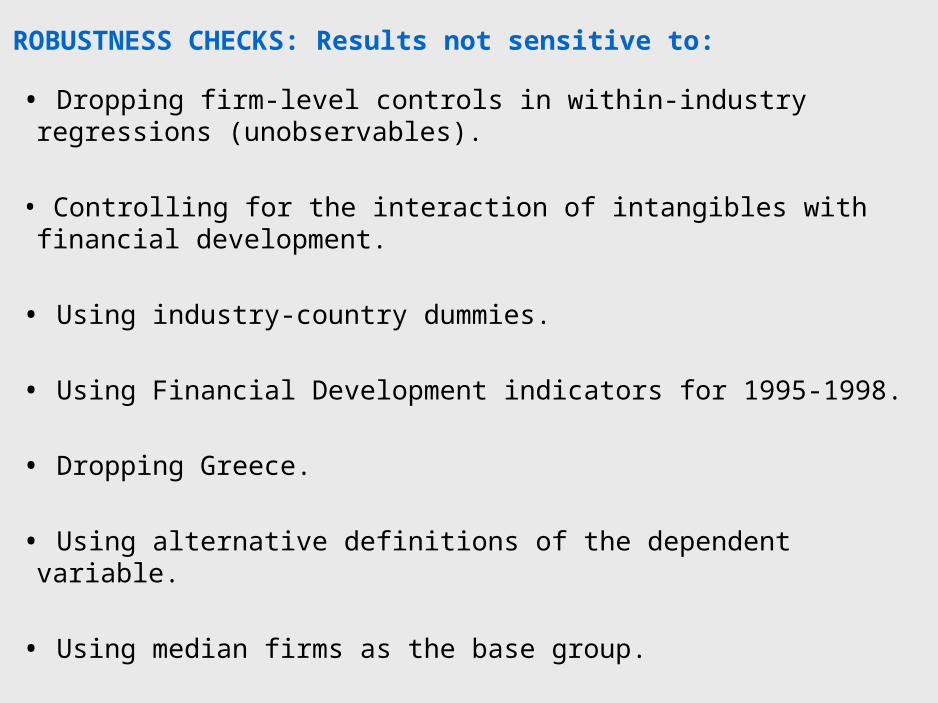
ROBUSTNESS CHECKS: Results not sensitive to:
• Dropping firm-level controls in within-industry regressions (unobservables).
• Controlling for the interaction of intangibles with financial development.
• Using industry-country dummies.
• Using Financial Development indicators for 1995-1998.
• Dropping Greece.
• Using alternative definitions of the dependent variable.
• Using median firms as the base group.
• Using median regression (with bootstrapped standard errors).
• Using two-stage estimation methods instead of clustering.
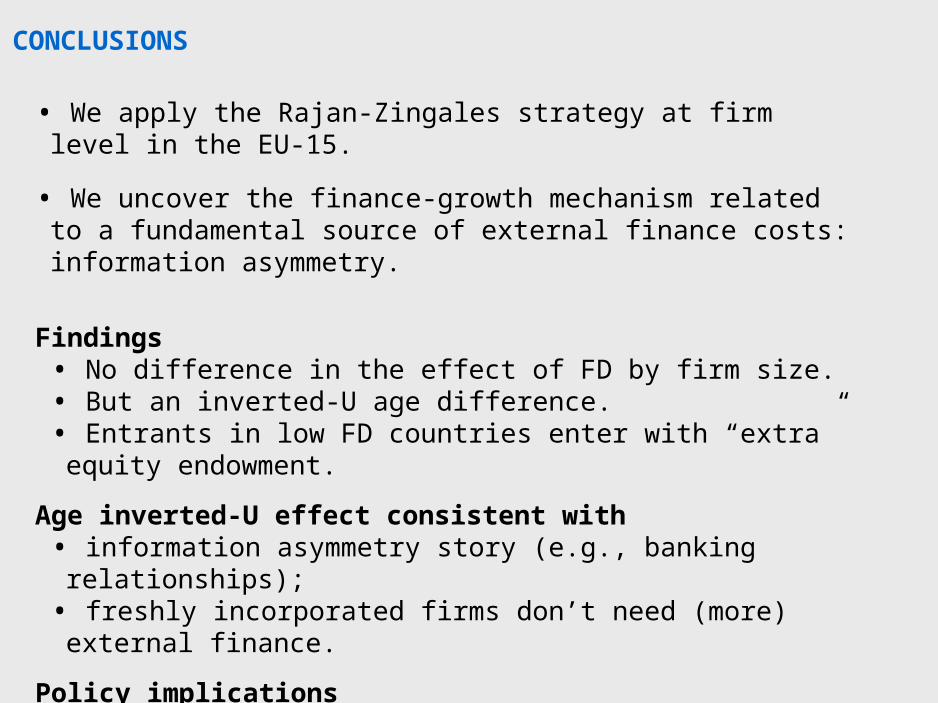
CONCLUSIONS
• We apply the Rajan-Zingales strategy at firm level in the EU-15.
• We uncover the finance-growth mechanism related to a fundamental source of external finance costs: information asymmetry.
Findings• No difference in the effect of FD by firm size.• But an inverted-U age difference.• Entrants in low FD countries enter with “extra” equity endowment.
Age inverted-U effect consistent with• information asymmetry story (e.g., banking relationships);• freshly incorporated firms don’t need (more) external finance.
Policy implications• Smaller companies do not have unusual growth opportunities that
are not realized because of financial markets. • Support young firms! Especially if they are small.
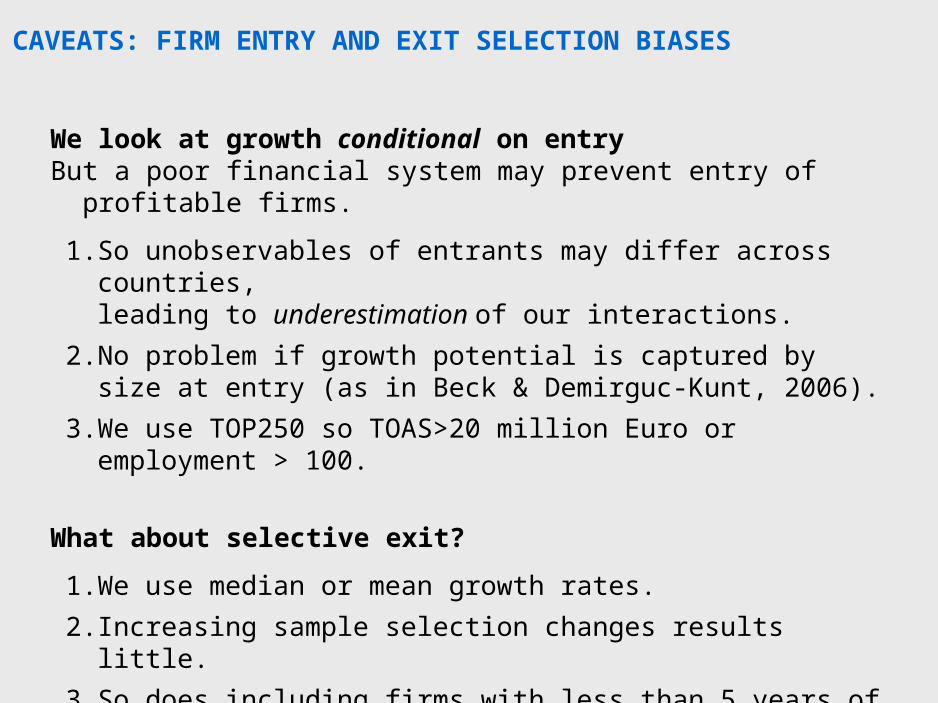
CAVEATS: FIRM ENTRY AND EXIT SELECTION BIASES
We look at growth conditional on entryBut a poor financial system may prevent entry of profitable firms.
1. So unobservables of entrants may differ across countries,leading to underestimation of our interactions.
2. No problem if growth potential is captured by size at entry (as in Beck & Demirguc-Kunt, 2006).
3. We use TOP250 so TOAS>20 million Euro or employment > 100.
What about selective exit?
1. We use median or mean growth rates.
2. Increasing sample selection changes results little.
3. So does including firms with less than 5 years of data.
0
.05
.1
.15
.2
10%20%
30%40%
50%60%
70%80%
90%
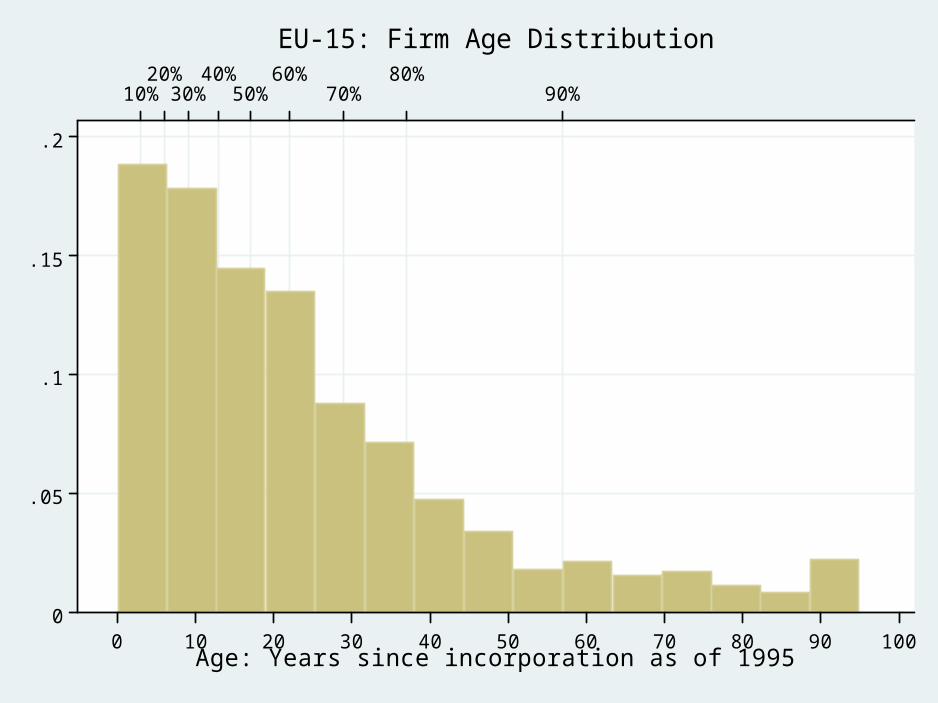
0 10 20 30 40 50 60 70 80 90 100Age: Years since incorporation as of 1995
EU-15: Firm Age Distribution
0
.1
.2
.3
.4
0
.1
.2
.3
.4
0
.1
.2
.3
.4
102030
4050
6070
8090 10
2030
4050
6070
8090 10
2030
4050
6070
8090 10
2030
4050
6070
8090
0 10 20 30 40 50 60 70 80 90 100 0 10 20 30 40 50 60 70 80 90 100 0 10 20 30 40 50 60 70 80 90 100 0 10 20 30 40 50 60 70 80 90100
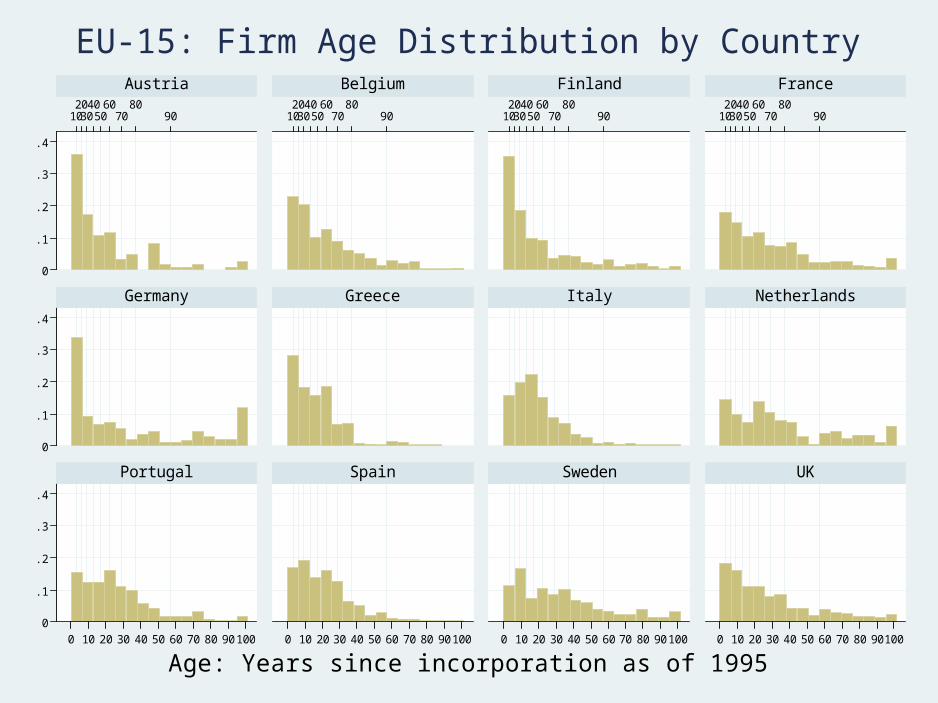
Austria Belgium Finland France
Germany Greece Italy Netherlands
Portugal Spain Sweden UK
Age: Years since incorporation as of 1995
EU-15: Firm Age Distribution by Country
0
.05
.1
.15
.2
.25
10%20%
30%40%
50%60%
70%80%
90%
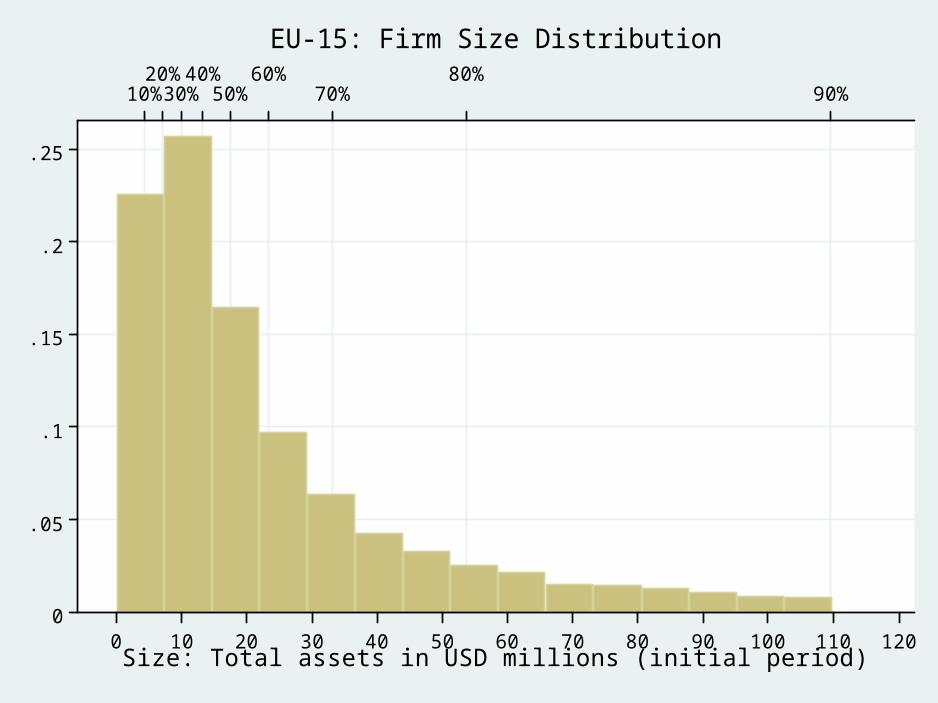
0 10 20 30 40 50 60 70 80 90 100 110 120Size: Total assets in USD millions (initial period)
EU-15: Firm Size Distribution
0
.1
.2
.3
.4
0
.1
.2
.3
.4
0
.1
.2
.3
.4
1020304050
6070
8090 10
203040
5060
7080
90 10203040
5060
7080
90 1020304050
6070
8090
0 10 20 30 40 50 60 70 80 90100 0 10 20 30 40 50 60 70 80 90100 0 10 20 30 40 50 60 70 80 90100 0 10 20 30 40 50 60 70 80 90100
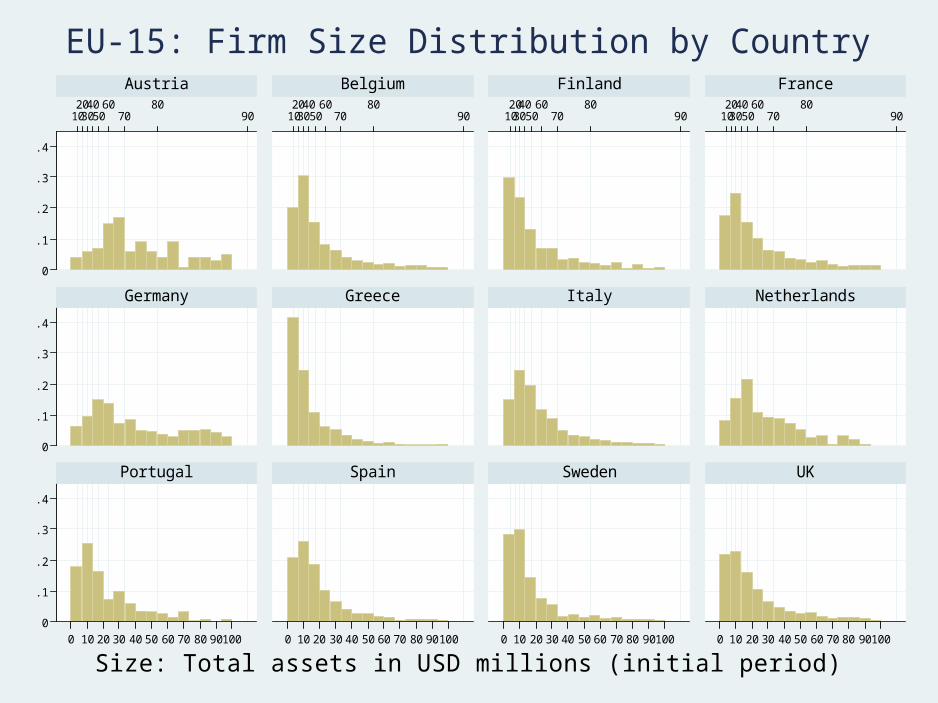
Austria Belgium Finland France
Germany Greece Italy Netherlands
Portugal Spain Sweden UK
Size: Total assets in USD millions (initial period)
EU-15: Firm Size Distribution by Country
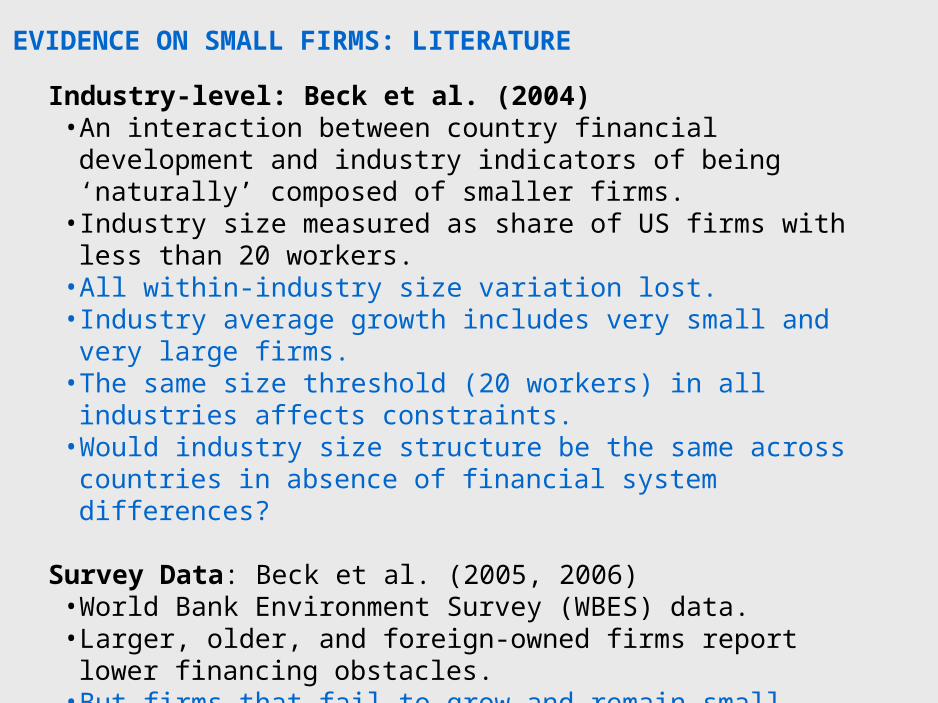
EVIDENCE ON SMALL FIRMS: LITERATURE
Industry-level: Beck et al. (2004) • An interaction between country financial development and industry
indicators of being ‘naturally’ composed of smaller firms.• Industry size measured as share of US firms with less than 20
workers.• All within-industry size variation lost.• Industry average growth includes very small and very large firms.• The same size threshold (20 workers) in all industries affects
constraints.•Would industry size structure be the same across countries in
absence of financial system differences?
Survey Data: Beck et al. (2005, 2006)•World Bank Environment Survey (WBES) data. • Larger, older, and foreign-owned firms report lower financing
obstacles.• But firms that fail to grow and remain small (e.g., because of
management failure) may blame financial intermediaries.
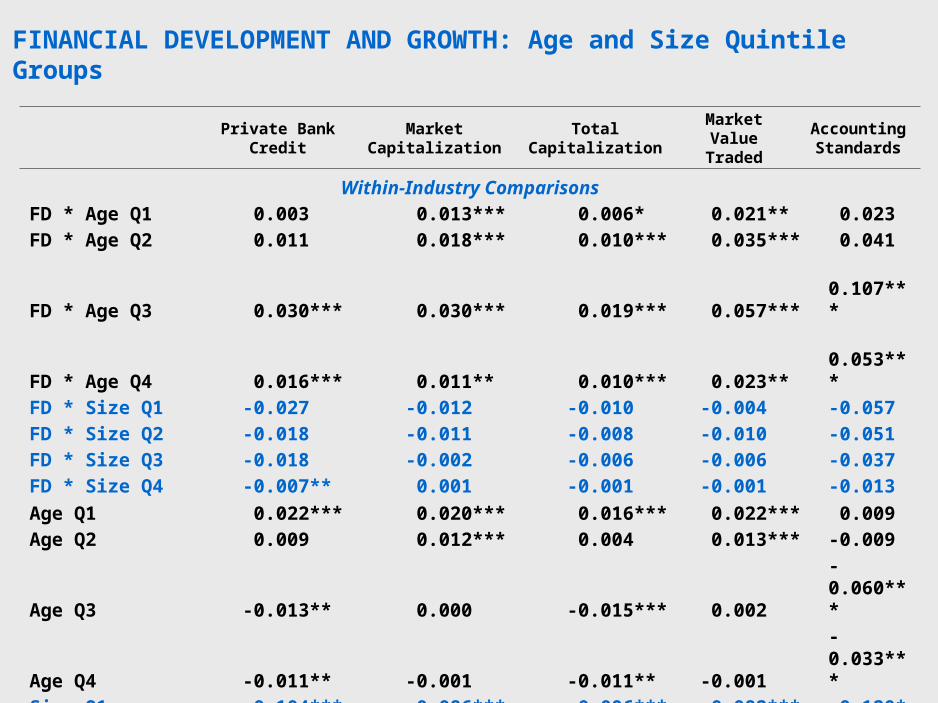
FINANCIAL DEVELOPMENT AND GROWTH: Age and Size Quintile Groups
Private Bank
CreditMarket
CapitalizationTotal
CapitalizationMarket Value
TradedAccounting Standards
Within-Industry Comparisons
FD * Age Q1 0.003 0.013*** 0.006* 0.021** 0.023
FD * Age Q2 0.011 0.018*** 0.010*** 0.035*** 0.041
FD * Age Q3 0.030*** 0.030*** 0.019*** 0.057*** 0.107***
FD * Age Q4 0.016*** 0.011** 0.010*** 0.023** 0.053***
FD * Size Q1 -0.027 -0.012 -0.010 -0.004 -0.057
FD * Size Q2 -0.018 -0.011 -0.008 -0.010 -0.051
FD * Size Q3 -0.018 -0.002 -0.006 -0.006 -0.037
FD * Size Q4 -0.007** 0.001 -0.001 -0.001 -0.013
Age Q1 0.022*** 0.020*** 0.016*** 0.022*** 0.009
Age Q2 0.009 0.012*** 0.004 0.013*** -0.009
Age Q3 -0.013** 0.000 -0.015*** 0.002 -0.060***
Age Q4 -0.011** -0.001 -0.011** -0.001 -0.033***
Size Q1 0.104*** 0.086*** 0.096*** 0.082*** 0.120*
Size Q2 0.052*** 0.040*** 0.048*** 0.038*** 0.070*
Size Q3 0.036*** 0.022*** 0.030** 0.022*** 0.046*
Size Q4 0.012*** 0.005*** 0.007** 0.005** 0.014N 15,179 15,179 15,179 15,179 15,179
R2 0.21 0.21 0.21 0.21 0.21
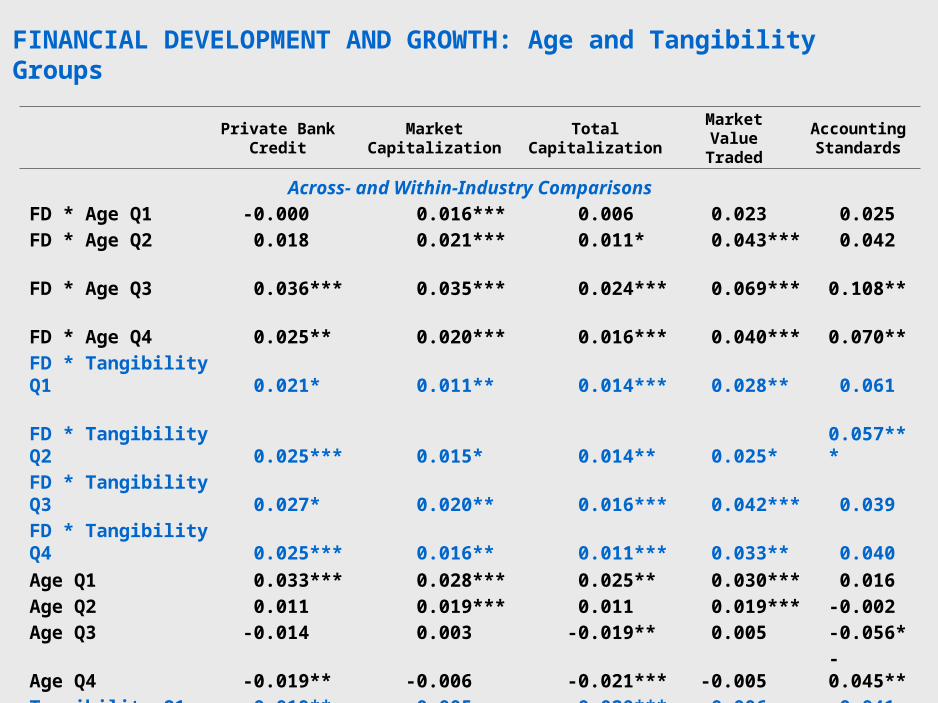
FINANCIAL DEVELOPMENT AND GROWTH: Age and Tangibility Groups
Private Bank
CreditMarket
CapitalizationTotal
CapitalizationMarket Value
TradedAccounting Standards
Across- and Within-Industry Comparisons
FD * Age Q1 -0.000 0.016*** 0.006 0.023 0.025
FD * Age Q2 0.018 0.021*** 0.011* 0.043*** 0.042
FD * Age Q3 0.036*** 0.035*** 0.024*** 0.069*** 0.108**
FD * Age Q4 0.025** 0.020*** 0.016*** 0.040*** 0.070**
FD * Tangibility Q1 0.021* 0.011** 0.014*** 0.028** 0.061
FD * Tangibility Q2 0.025*** 0.015* 0.014** 0.025* 0.057***
FD * Tangibility Q3 0.027* 0.020** 0.016*** 0.042*** 0.039
FD * Tangibility Q4 0.025*** 0.016** 0.011*** 0.033** 0.040
Age Q1 0.033*** 0.028*** 0.025** 0.030*** 0.016
Age Q2 0.011 0.019*** 0.011 0.019*** -0.002
Age Q3 -0.014 0.003 -0.019** 0.005 -0.056*
Age Q4 -0.019** -0.006 -0.021*** -0.005 -0.045**
Tangibility Q1 -0.019** -0.005 -0.020*** -0.006 -0.041
Tangibility Q2 -0.032*** -0.017** -0.031*** -0.016** -0.049***
Tangibility Q3 -0.033** -0.018** -0.034*** -0.017** -0.037
Tangibility Q4 -0.029*** -0.014** -0.025*** -0.014** -0.035N 16,770 16,770 16,768 16,770 16,768
R2 0.10 0.10 0.10 0.10 0.10
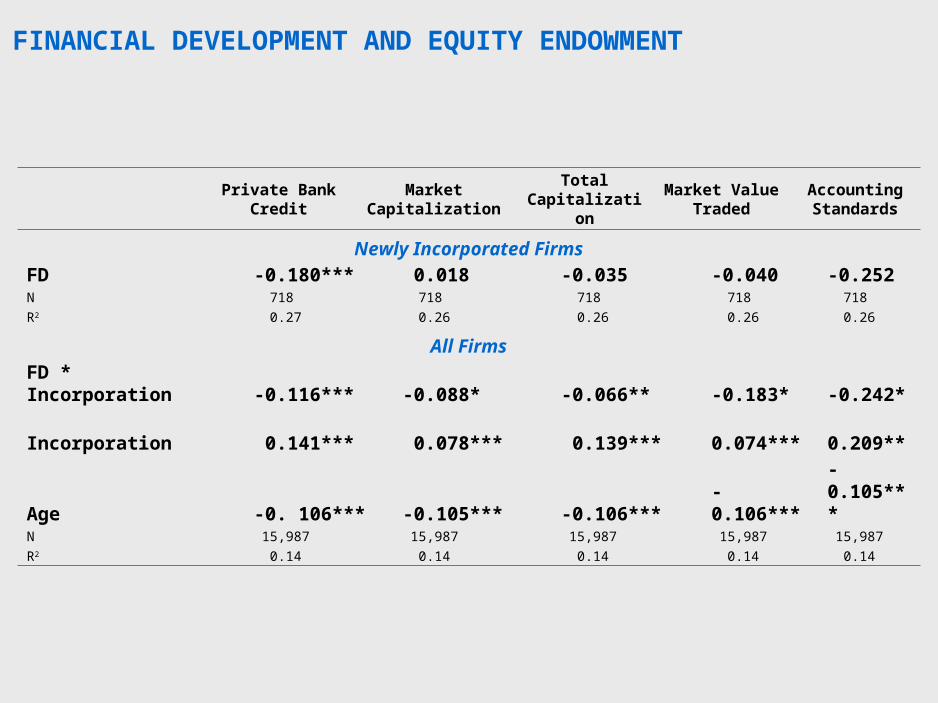
FINANCIAL DEVELOPMENT AND EQUITY ENDOWMENT
Private Bank
CreditMarket
CapitalizationTotal
CapitalizationMarket Value
TradedAccounting Standards
Newly Incorporated Firms
FD -0.180*** 0.018 -0.035 -0.040 -0.252N 718 718 718 718 718
R2 0.27 0.26 0.26 0.26 0.26
All Firms
FD * Incorporation -0.116*** -0.088* -0.066** -0.183* -0.242*
Incorporation 0.141*** 0.078*** 0.139*** 0.074*** 0.209**
Age -0. 106*** -0.105*** -0.106*** -0.106*** -0.105***N 15,987 15,987 15,987 15,987 15,987
R2 0.14 0.14 0.14 0.14 0.14