Embed Size (px)
DESCRIPTION
Three-Dimensional Water Vapor and Cloud Variations Associated with the MJO during Northern Hemisphere Winter. By: David S. Myers and Duane E. Waliser Presented by: Emily M. Riley 24 April 2007. Outline. Motivation Data and Methodology Digression to examine weighting function Results - PowerPoint PPT Presentation
Citation preview
Three-Dimensional Water Vapor and Cloud Variations Associated with the MJO during Northern Hemisphere
Winter
Three-Dimensional Water Vapor and Cloud Variations Associated with the MJO during Northern Hemisphere
Winter
By: David S. Myers and Duane E. Waliser
Presented by: Emily M. Riley
24 April 2007
OutlineOutline
• Motivation
• Data and Methodology
• Digression to examine weighting function
• Results
• Summary
MotivationMotivation
• Improve GCMs simulation of the MJO• How?
• Characterize typical co-evolution of the moisture, rainfall, and cloud field associated with various phases of the MJO
• Why?• Most studies focus on moisture through the interaction of
dynamics with convection• Understand role of hydrological cycle with tropical
dynamics, particularly within intraseasonal variations (e.g. the MJO)
DataData
• Moisture profiles from TOVS Pathfinder-A• High-Resolution IR Sounder 2 (HRIS2)• Microwave Sounding Unit (MSU)• Stratospheric Sounding Unit (SSU)• Resolution:
• 5-day avgs• 1° X 1°• Standard pressure heights
DataData
• Clouds from ISCCP• 2.5° X 2.5°• July 1983 - February 1994
• Precipitation from CMAP• 1979 - 1999
Methodology Methodology
• TOVS soundings calculate relative & specific humidity
• Precipitation based indexing scheme:• EOF trickery with filtered rainfall data from
CMAP averaged from 10°N - 10°S to capture MJO events
• Leading EOF explains 39% of the intraseasonal variance, which apparently is good…
A picture shows it better!A picture shows it better!
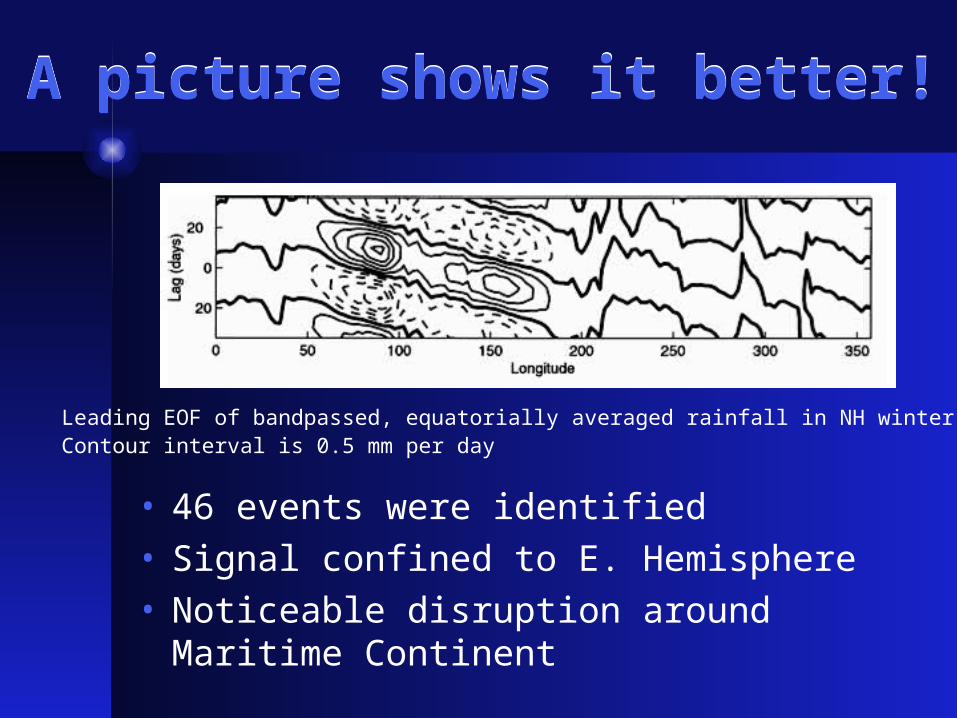
• 46 events were identified• Signal confined to E. Hemisphere• Noticeable disruption around Maritime Continent
Leading EOF of bandpassed, equatorially averaged rainfall in NH winter. Contour interval is 0.5 mm per day
Great, but how does TOVS measure moisture?
Great, but how does TOVS measure moisture?
Recall Temperature profiles and the weighting function (Petty, 8.3.2)
• Consider a satellite able to measure radiant intensities for a series of closely spaced wavelengths, located on the edge of a strong absorption line for constituent X.
• Each channel measures thermal emission from a different level.
• Wavelengths closer to the center of the absorption band will peak at higher heights
• Intensity of emission is determined by temperature within layer
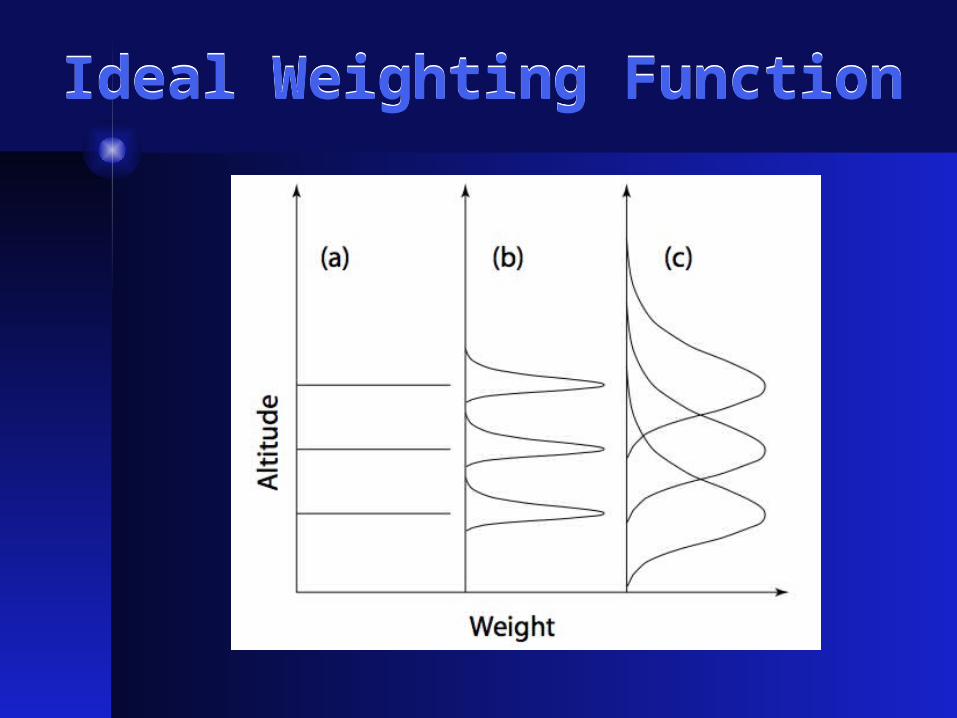
Ideal Weighting FunctionIdeal Weighting Function
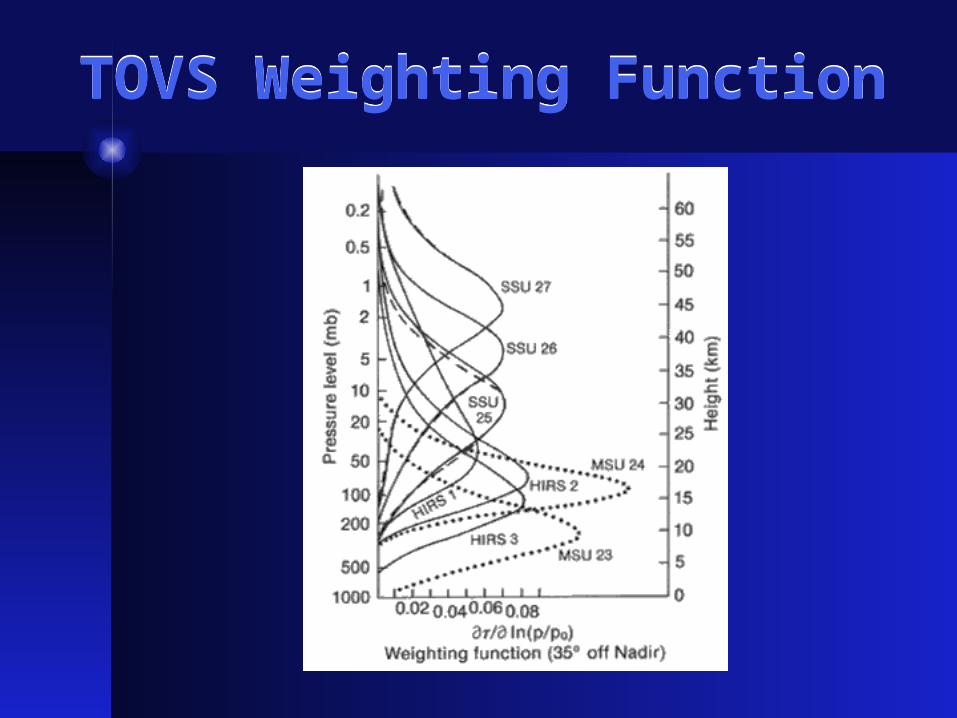
TOVS Weighting FunctionTOVS Weighting Function
Results: How good is the TOVS data?
Results: How good is the TOVS data?
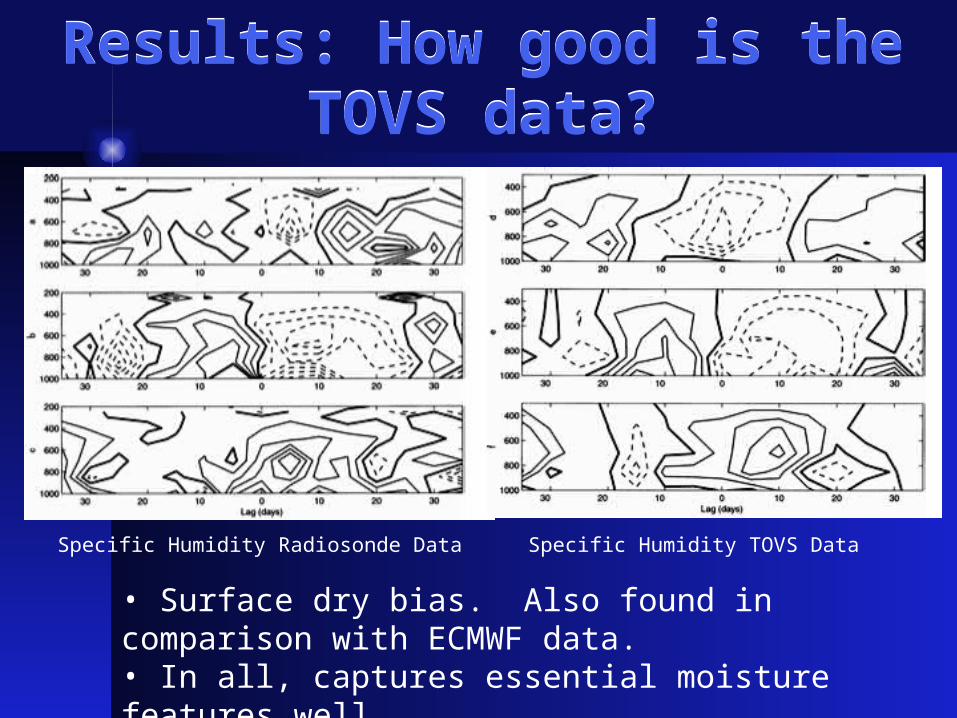
Specific Humidity Radiosonde Data Specific Humidity TOVS Data
• Surface dry bias. Also found in comparison with ECMWF data.• In all, captures essential moisture features well

Results: Evolution of composite MJO humidity variations
Results: Evolution of composite MJO humidity variations
500-mb composite specific humidity anomalies

Results: Evolution of composite MJO humidity variations
Results: Evolution of composite MJO humidity variations
surface
700-mb
500-mb
300-mb
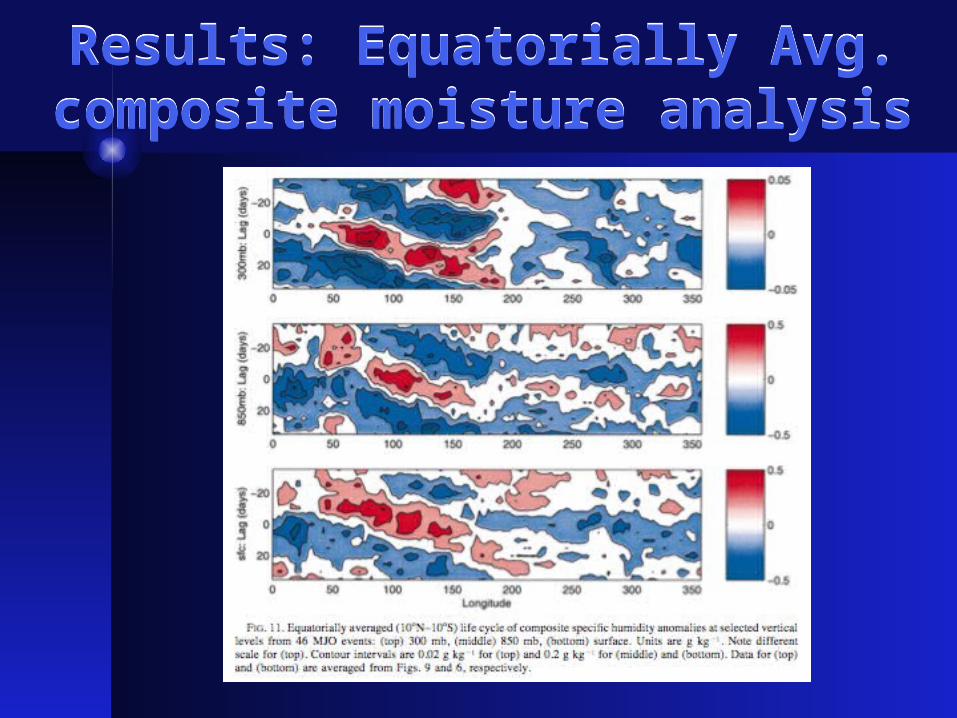
Results: Equatorially Avg. composite moisture analysis
Results: Equatorially Avg. composite moisture analysis
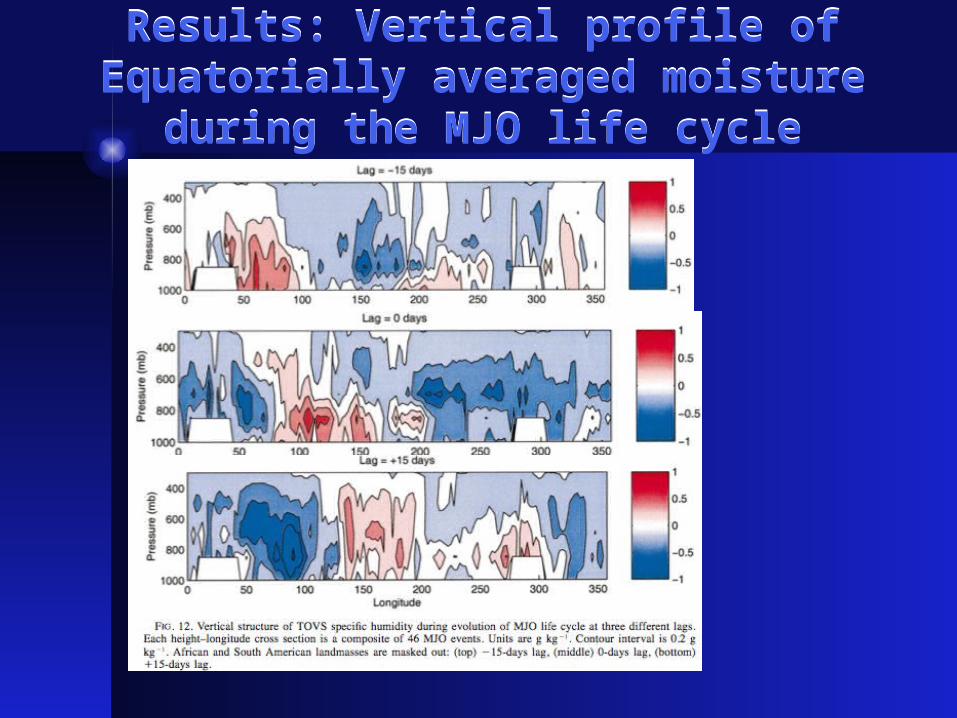
Results: Vertical profile of Equatorially averaged moisture during the MJO life cycle
Results: Vertical profile of Equatorially averaged moisture during the MJO life cycle
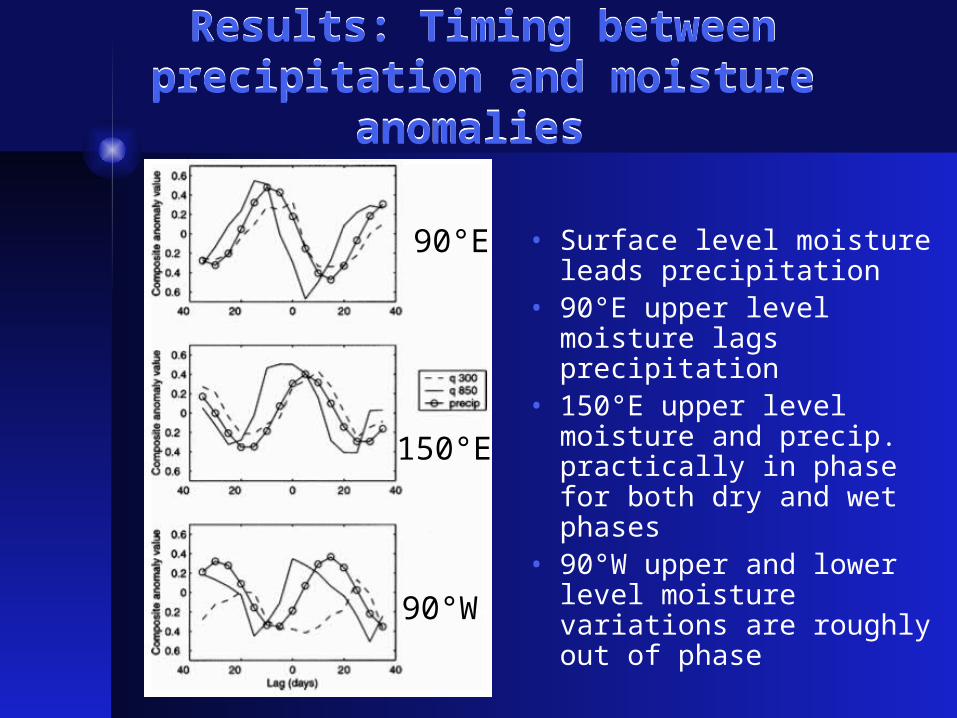
Results: Timing between precipitation and moisture anomalies
Results: Timing between precipitation and moisture anomalies
• Surface level moisture leads precipitation
• 90°E upper level moisture lags precipitation
• 150°E upper level moisture and precip. practically in phase for both dry and wet phases
• 90°W upper and lower level moisture variations are roughly out of phase
90°E
150°E
90°W
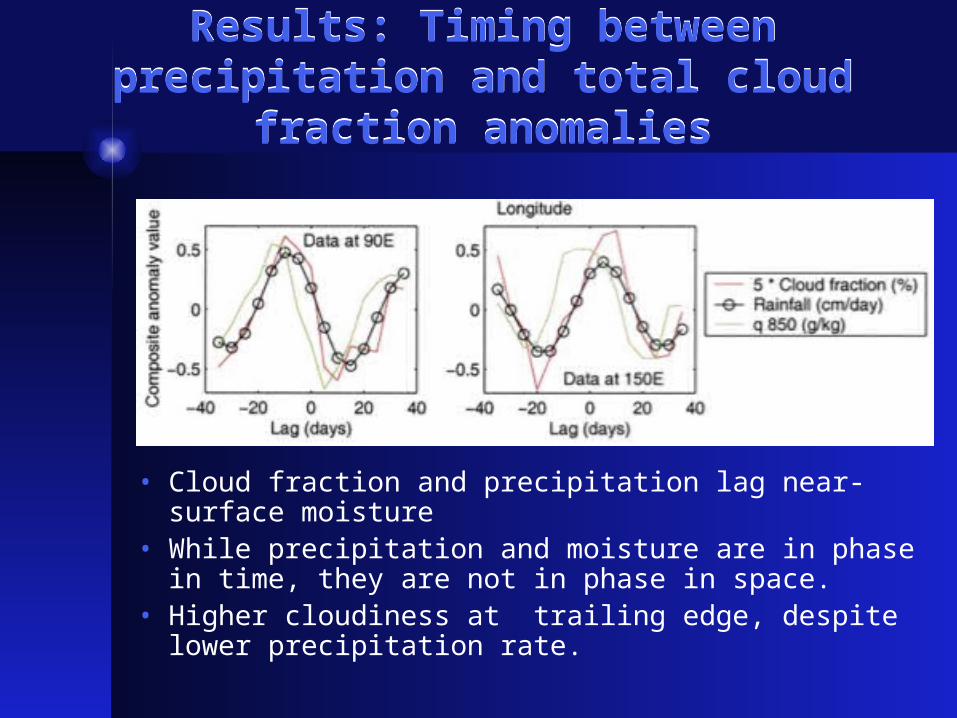
Results: Timing between precipitation and total cloud fraction anomalies
Results: Timing between precipitation and total cloud fraction anomalies
• Cloud fraction and precipitation lag near-surface moisture• While precipitation and moisture are in phase in time, they
are not in phase in space.• Higher cloudiness at trailing edge, despite lower
precipitation rate.
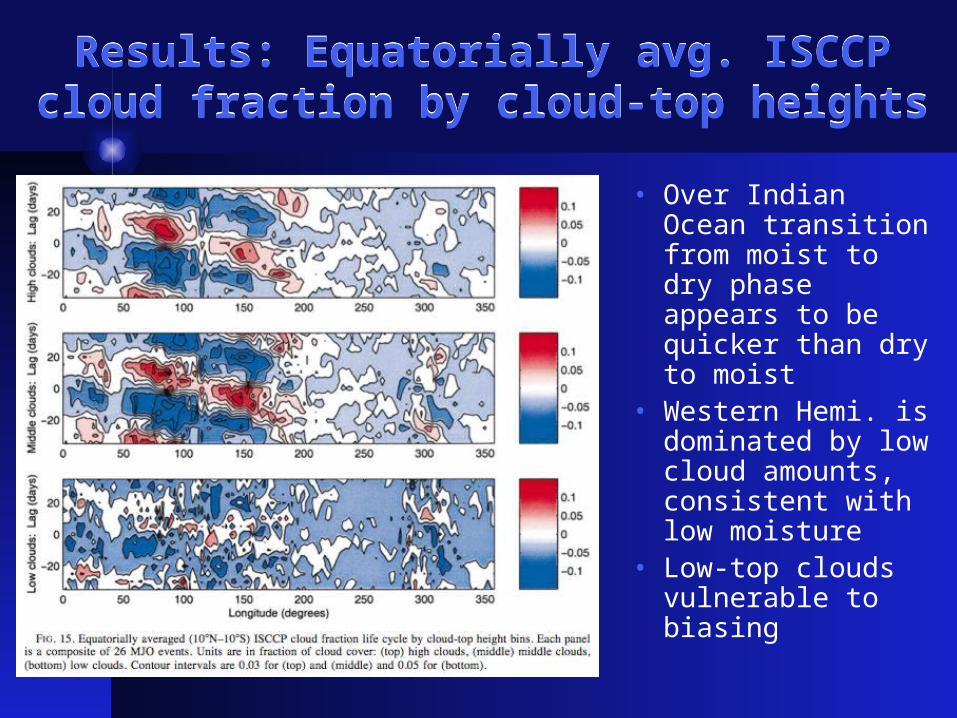
Results: Equatorially avg. ISCCP cloud fraction by cloud-top heights
Results: Equatorially avg. ISCCP cloud fraction by cloud-top heights
• Over Indian Ocean transition from moist to dry phase appears to be quicker than dry to moist
• Western Hemi. is dominated by low cloud amounts, consistent with low moisture
• Low-top clouds vulnerable to biasing
SummarySummary
• Clear westward tilt with height of the moisture maximum across the Indian Ocean, which become almost vertical in W. Pacific
• Near surface (upper-level) moisture leads (lags) precipitation
• Higher cloudiness at the western (trailing) edges of precip. Maximum
• Dry anomalies dominate over moist anomalies