Embed Size (px)
Citation preview

Duane E. Waliser1, Baijun Tian12, and Xianan Jiang12
1Jet Propulsion Laboratory, California Institute of Technology, Pasadena, CA2 Joint Institute for Regional Earth System Science and Engineering,
University of California, Los Angeles, CA
Vertical Structure And Processes Revealed With Recent Satellite Data
Vertical Structure And Processes Revealed With Recent Satellite Data
BIRS, 2009
Figures: E. Maloney, PMEL/TAO, M. Wheeler, J. Lin, D. WaliserFigures: E. Maloney, PMEL/TAO, M. Wheeler, J. Lin, D. Waliser
Kelvin WavesRossby Waves
MJOs
• The MJO is the dominant form of intraseasonal variability in the Tropics, with impacts a wide range of phenomena.
• Our weather & climate models have a relatively poor representation
• Aspects of Vertical Structure – which may be important to initiation/maintenance – have been difficult to evaluate via observations.
• Space-based observations now make it possible to examine aspects of vertical structure of the MJO hydrological cycle.
MotivationMotivation
Question?Question?
Using space-based observations, what can be said about the hydrological cycle of the MJO?

Hydrological DataHydrological Data CMAP Rainfall :
global, 2.5°x2.5° lat-long, pentad, 01/01/1979-02/22/2007. Xie and Arkin (1997)
TRMM 3B42 Rainfall:40S-40N, 0.25° x 0.25°, 3-hourly, 01/01/1998-06/30/2007. Huffman et al. (2007)
AIRS H2OVapMMR & TotH2OVap V4, L3, global, 1.0° x 1.0°, 2Xdaily, 09/01/2002-04/30/2007. Chahine et al. (2006)
QuikSCAT & TMI Moisture Transport 40S-40N, 0.25° x 0.25°, 2Xdaily, 08/1999-12/31/2005. Liu and Tang (2005)
OAFlux Evaporation 65S-65N, 1.0° x 1.0°, daily, 01/01/1981-12/31/2002. Yu and Weller (2007)
SSMI Total Column H2O Vapor & Total Cloud Liquid H2O V6, DMSP F13, global, 0.25° x 0.25°, 2Xdaily, 01/01/1996-06/30/2007. Wentz (1997), Wentz and Spencer (1998)
MLS Ice Water Content 80S-80N, 4° x 8° lat-long, 2Xdaily, 08/26/2004-02/22/2007. Wu et al. (2006)
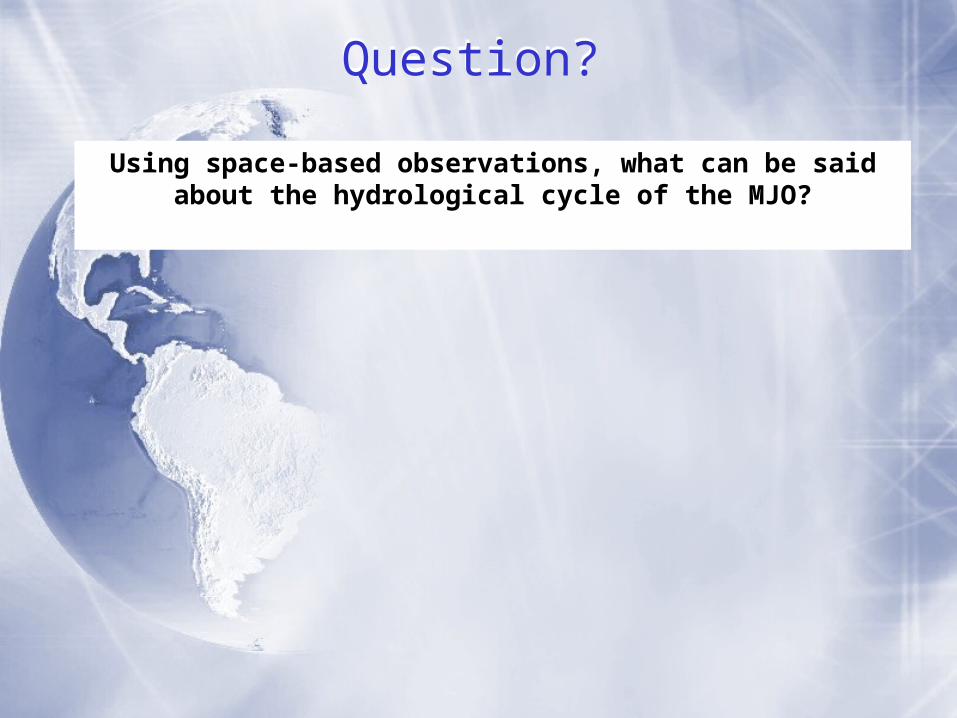
Spatial-temporal Pattern of the 1st
EEOF Mode of Rainfall Anomaly
Spatial-temporal Pattern of the 1st
EEOF Mode of Rainfall Anomaly
MJO Event Selection
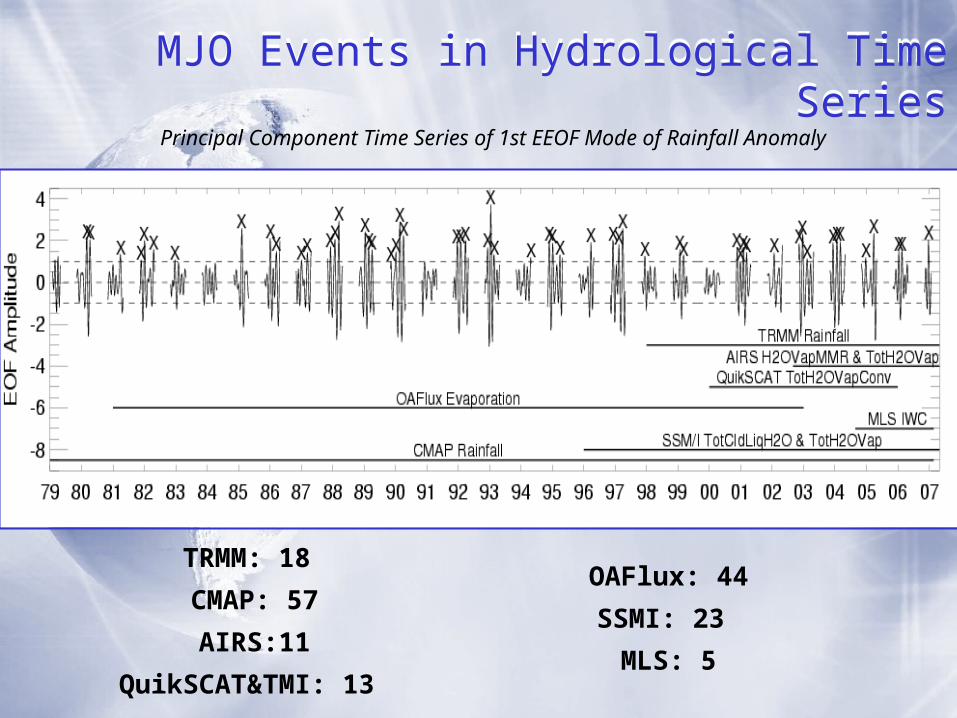
MJO Events in Hydrological Time SeriesMJO Events in Hydrological Time Series
TRMM: 18
CMAP: 57
AIRS:11
QuikSCAT&TMI: 13
OAFlux: 44
SSMI: 23
MLS: 5
Principal Component Time Series of 1st EEOF Mode of Rainfall Anomaly

Rainfall Pattern & Data Sensitivity
Rainfall Pattern & Data Sensitivity

Rainfall & Moisture ConvergenceRainfall & Moisture Convergence
-20 Days
-10 Days
0 Days
+10 Days
+20 Days
Rainfall and Total Column Moisture
Convergence tend to be Correlated throughout Tropics - except maybe
over S. America
-20 Days
-10 Days
0 Days
+10 Days
+20 Days
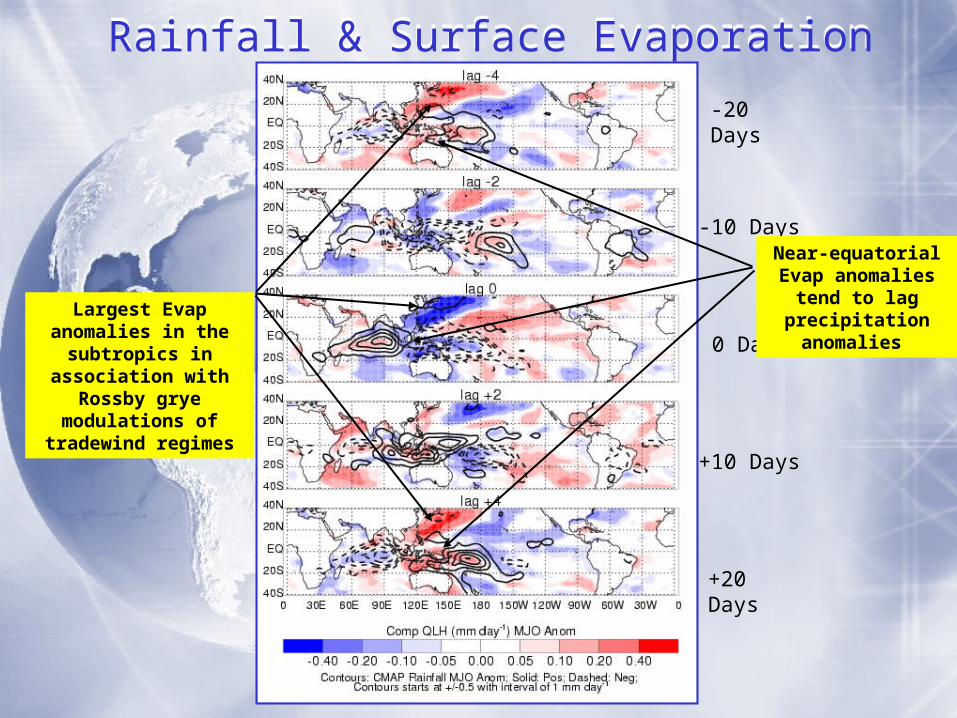
Rainfall & Surface EvaporationRainfall & Surface Evaporation
Largest Evap anomalies in the subtropics in
association with Rossby grye modulations of tradewind regimes
Near-equatorial Evap anomalies tend to lag
precipitation anomalies
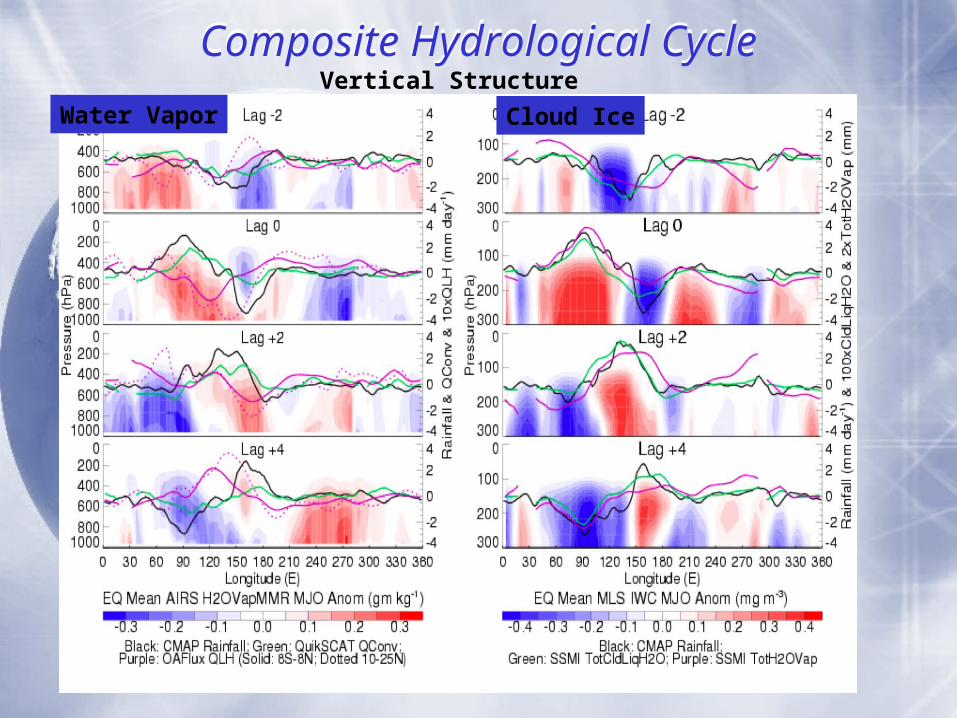
Composite Hydrological CycleComposite Hydrological CycleVertical Structure
Water Vapor Cloud Ice

-0.5 mg/m3
+3 mm/day
600 hPa
900 hPa
300 hPa
-3 mm/day
-0.3 gm/kg
~ 45 days
Surface
Upper Troposphere - See Other Diagram
+0.3 gm/kg
+0.1 gm/kg
+0.5 mg/m3
-3 mm/day +3 mm/day
+2 mm-2 mm
-0.03 mm +0.03 mm
MJO Hydrological Cycle - Troposphere
-0.1 gm/kg
-0.2 mm/day +0.2 mm/day
ColumnIntegrated
Values
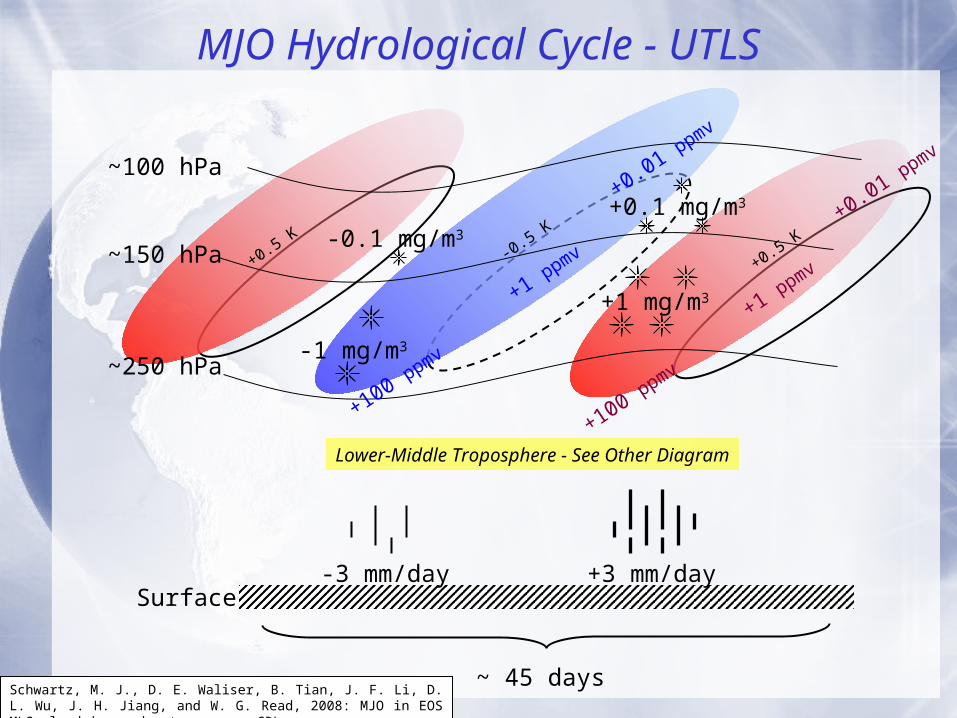
+1 mg/m3
+0.1 mg/m3
+3 mm/day
-1 mg/m3
-0.1 mg/m3
~150 hPa
~250 hPa
~100 hPa
-3 mm/day
+100 ppmv
+0.01 ppmv
+1 ppmv
+100 ppmv
+0.01 ppmv
+1 ppmv
~ 45 days
+0.5 K+0.5 K
-0.5 K
Surface
Lower-Middle Troposphere - See Other Diagram
MJO Hydrological Cycle - UTLS
Schwartz, M. J., D. E. Waliser, B. Tian, J. F. Li, D. L. Wu, J. H. Jiang, and W. G. Read, 2008: MJO in EOS MLS cloud ice and water vapor. GRL.
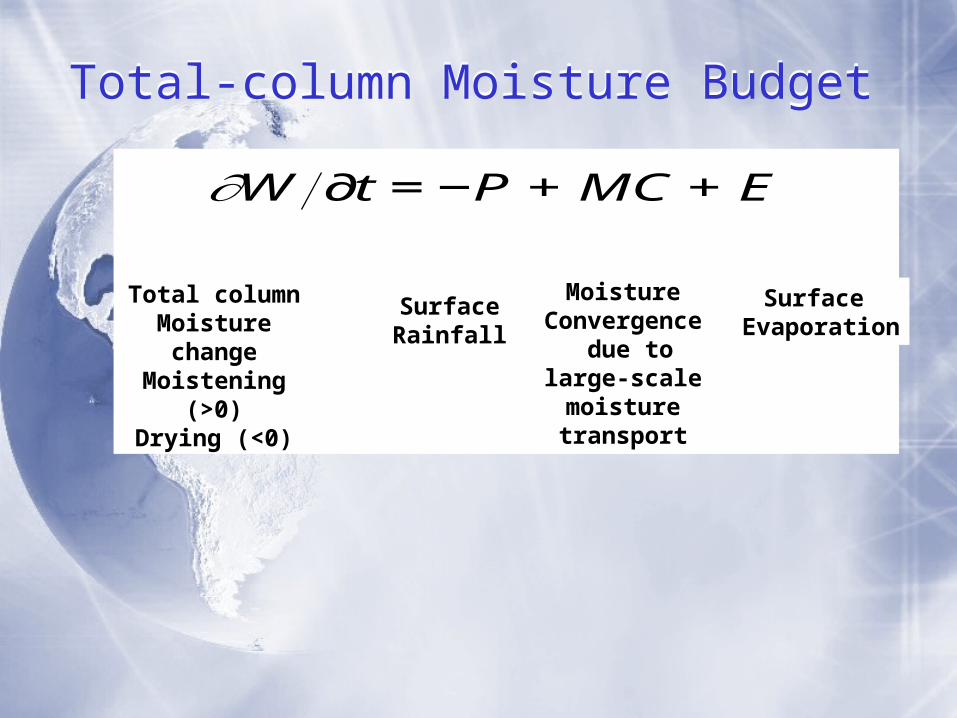
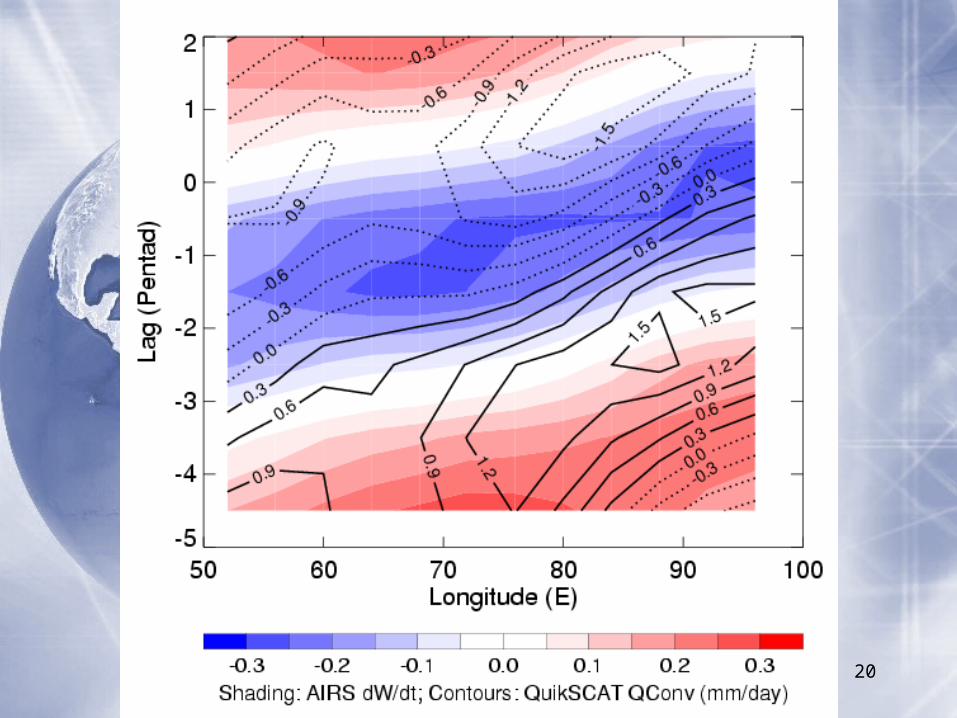
Total-column Moisture BudgetTotal-column Moisture Budget
€
∂W ∂t = −P + MC + E
Surface Rainfall
Surface Evaporation
Moisture Convergence due to large-
scale moisture transport
Total column Moisture change
Moistening (>0)Drying (<0)
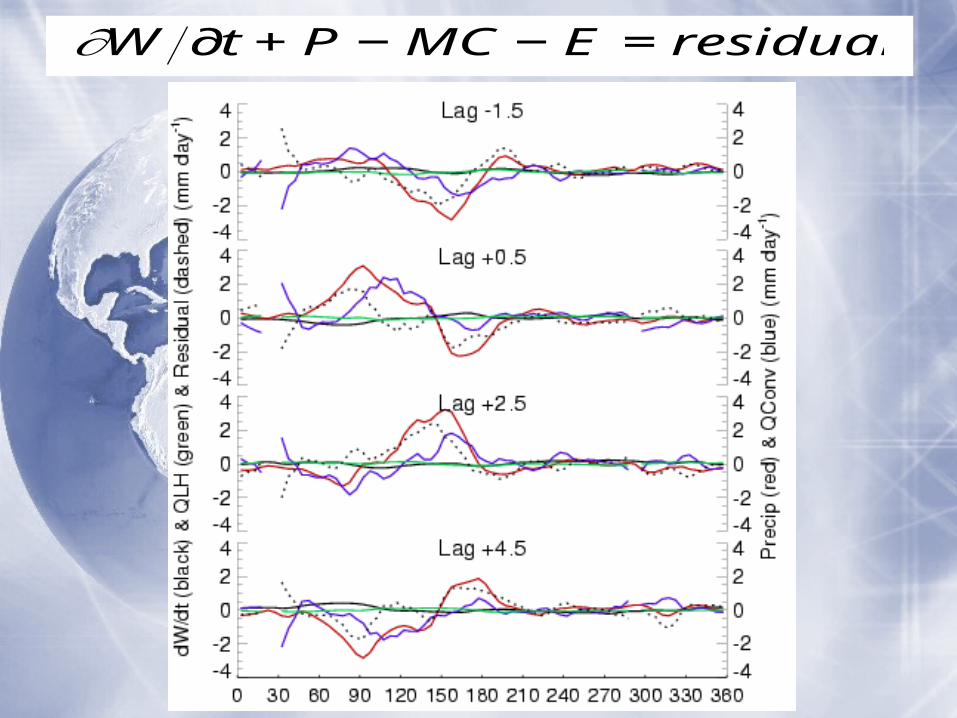
€
∂W ∂t + P −MC − E = residual

Summary: ISummary: I
• Satellite Observations are now able to provide an estimate of the chief components of the Hydrological Cycle Associated with the MJO, in some cases with vertical structure information.
• However, calcululations of the Residual Term of the column-integrated values indicates closing the budget with current generation of satellite retrievals is difficult.
• Within the levels of uncertainty, Future plans involve applying the observed Hydrological Cycle of the MJO as a means to diagnose, evaluate and validate GCM simulations of the MJO or Evaluate Theoretical considerations.

Question?Question?
What Physical or Dynamical Mechanism is Responsible for the Lower-tropospheric Moisture
Preconditioning of the MJO?
17
18

19
20
21
22
23

24

25
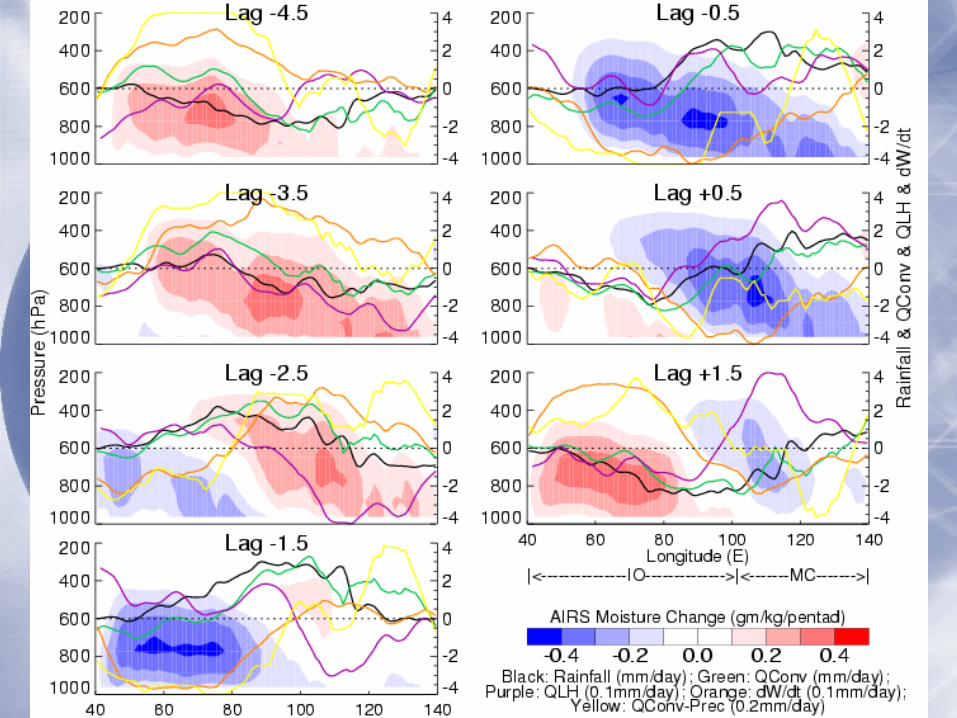
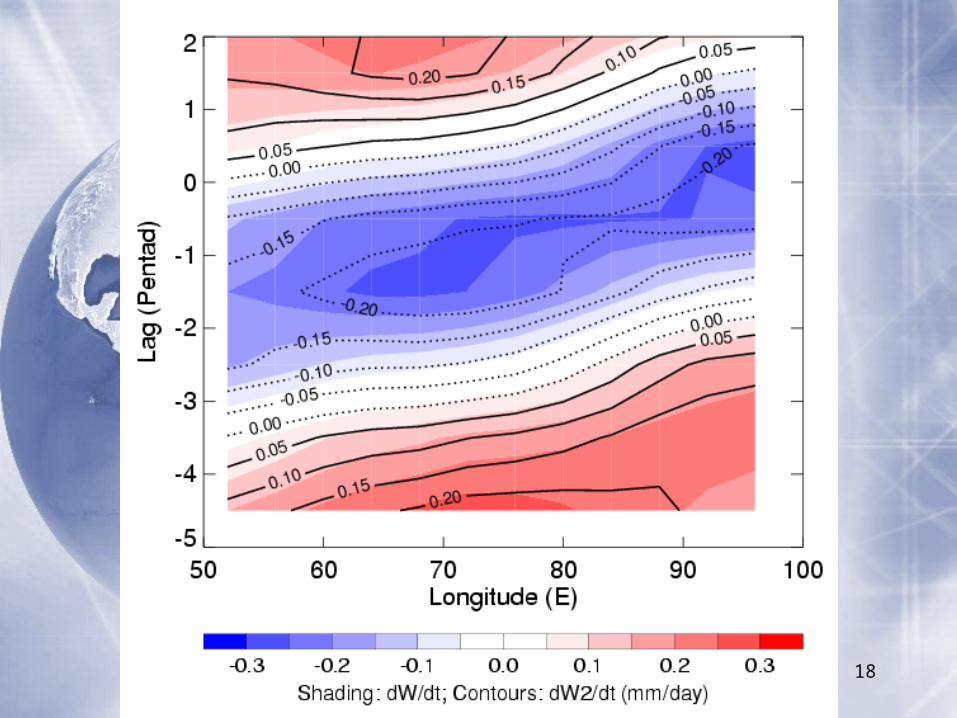
Summary: IISummary: II significant moisture anomalies are located in the lower troposphere with maxima around 700 hPa during the transition phase; total-column and lower-tropospheric moisture change anomalies are positively correlated.
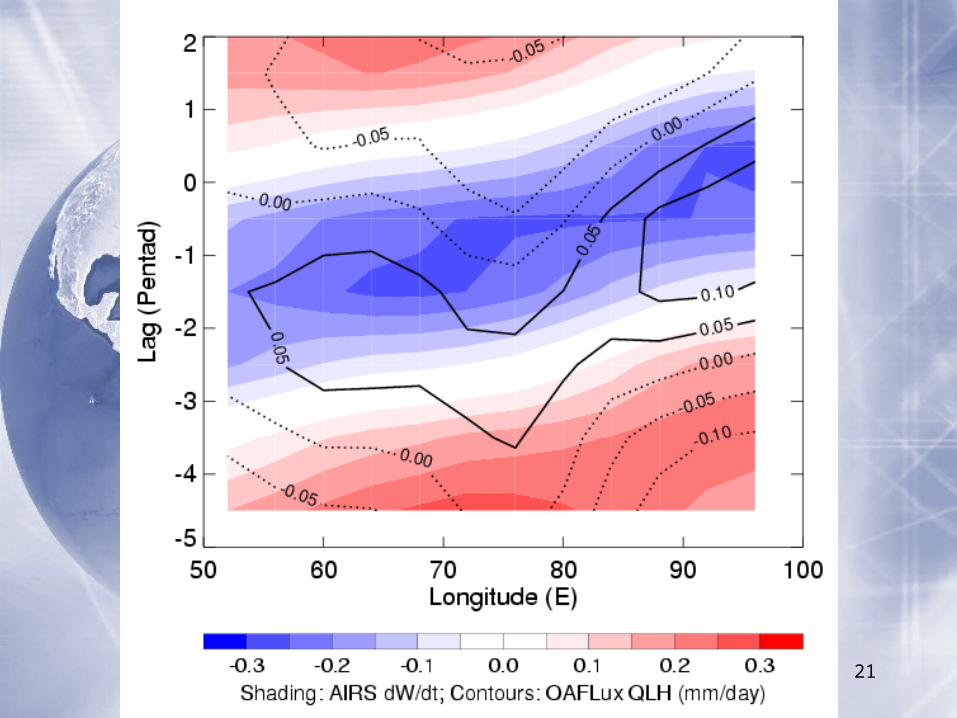
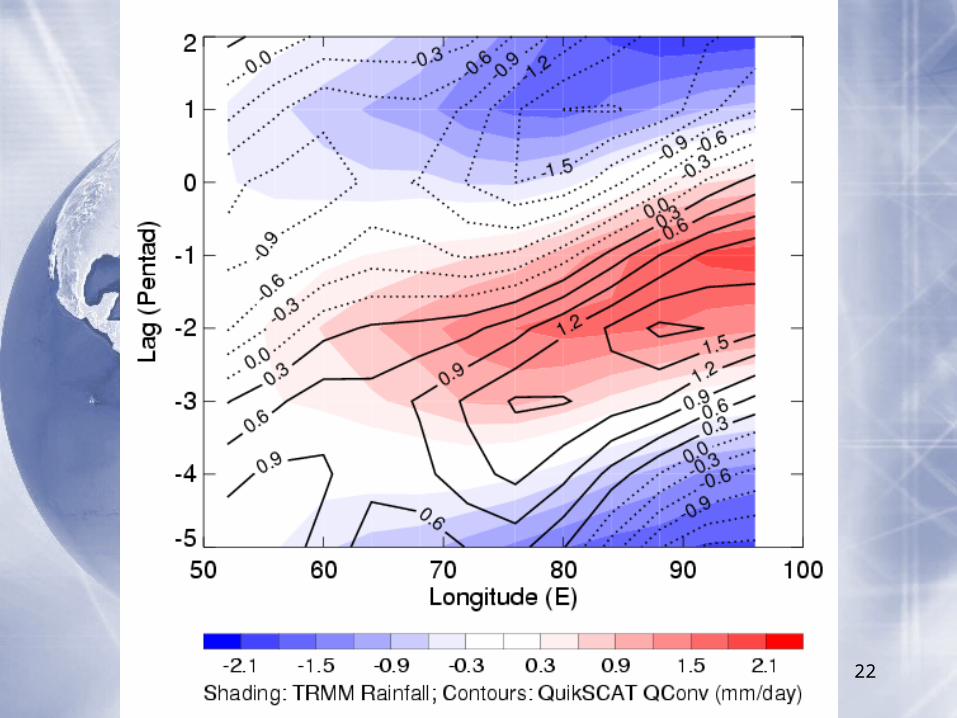
moisture change anomalies are positively correlated with moisture convergence anomalies but negatively correlated with rainfall and surface evaporation anomalies.
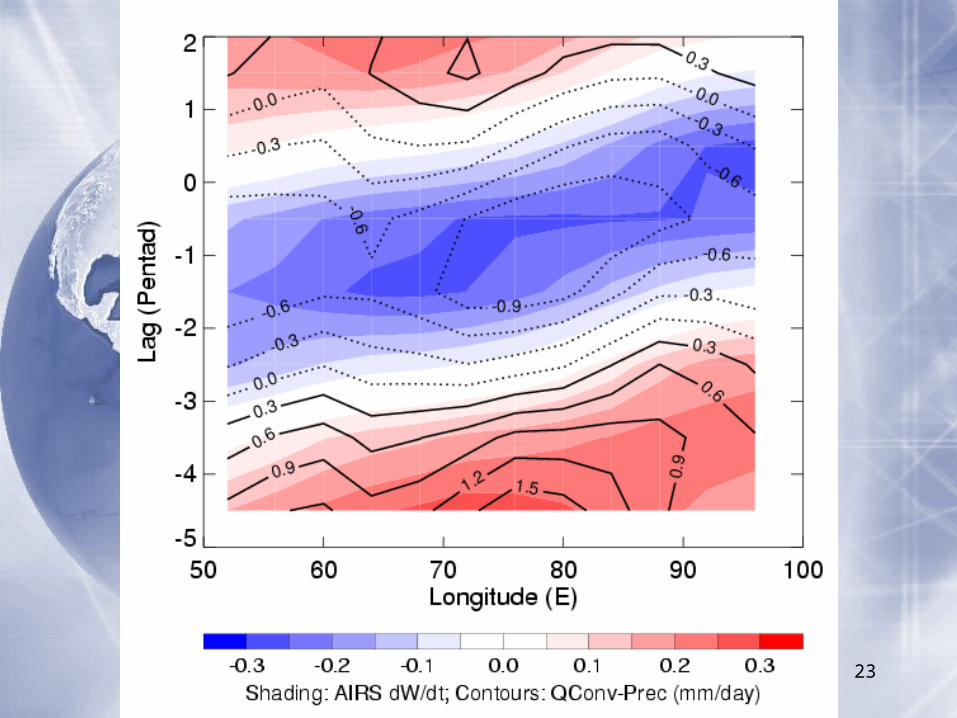
moisture change anomaly is highly & positively correlated with the difference between moisture convergence and rainfall anomalies.
implication: lower-tropospheric moisture preconditioning of the MJO is due to the small difference between moisture convergence and rainfall anomalies instead of surface evaporation anomaly.
Question?Question?
What types of clouds and cloud processes play a role in the moist pre-conditioning?
Considered w.r.t. to boreal summer.

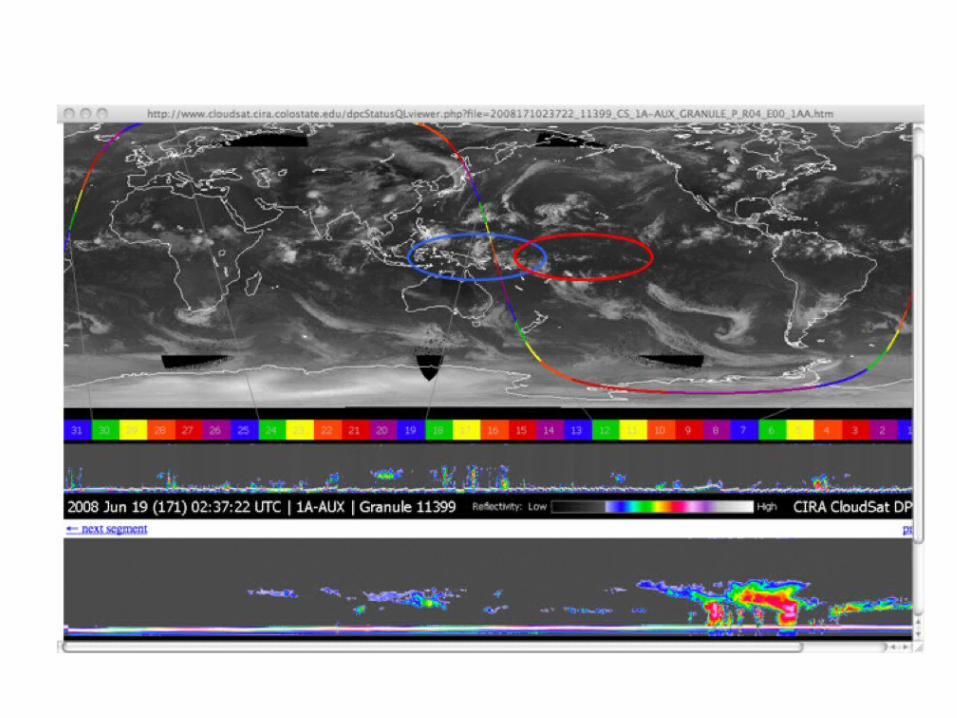
Dataset
Cloudsat (Jun– Sep 2006, 2007)Horizontal resolution: 1x1 degs
Variables:Cloud liquid water content (LWC) Ice water content (IWC)
Cloud typesHigh: CirrusMiddle: Altocumulus (Ac), Altostratus (As)Low: Stratocumulus (Sc), Stratus (St), Nimbostratus (Ns)Vertical: Cumulus (Cu)
GPCP rainfall (1997-2007):horizontal resolution: 1x1 deg., 20-70-day band-pass filtered

Hovmöller diagram of GPCP precipitation (20-70-day filtered; 75-95oE)
Time series of EEOF1 of 1-D 20-70d filtered GPCP rainfall (5oS~25oN, averaged over 75-95oE sector) for MJJAS, 1996-2007.
The EEOF1&2 basically captures northward propagation of the BSISO.
20072006•
•
• • •• •
2006 2007
(mm/day)
-10day
-5
0
5
10
15
20
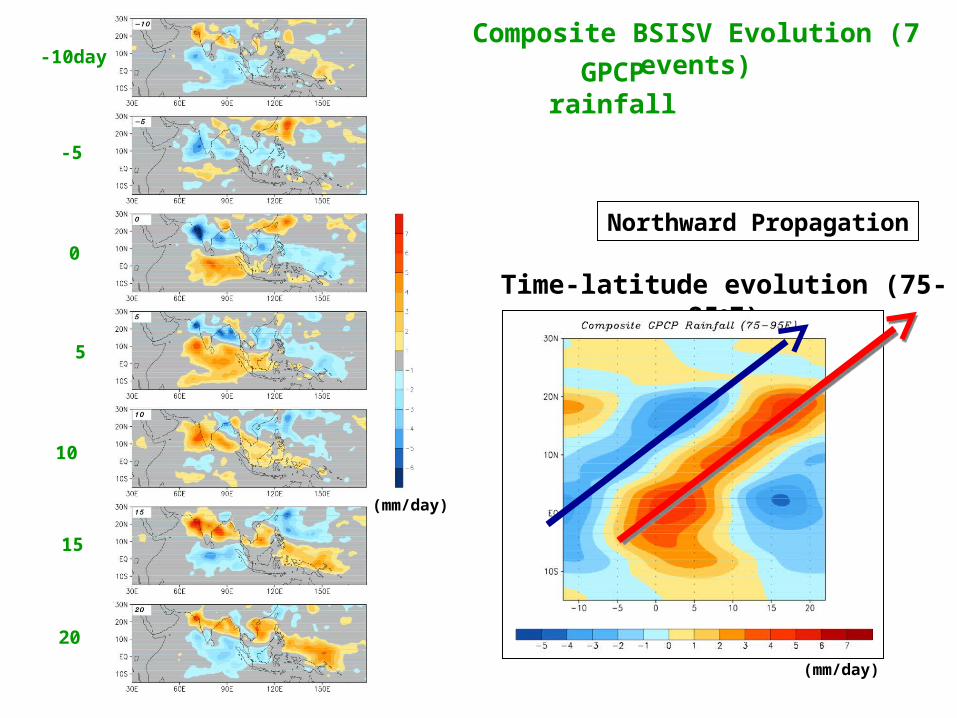
Time-latitude evolution (75-85oE)
Composite BSISV Evolution (7 events)
GPCP rainfall
(mm/day)
(mm/day)
Northward Propagation
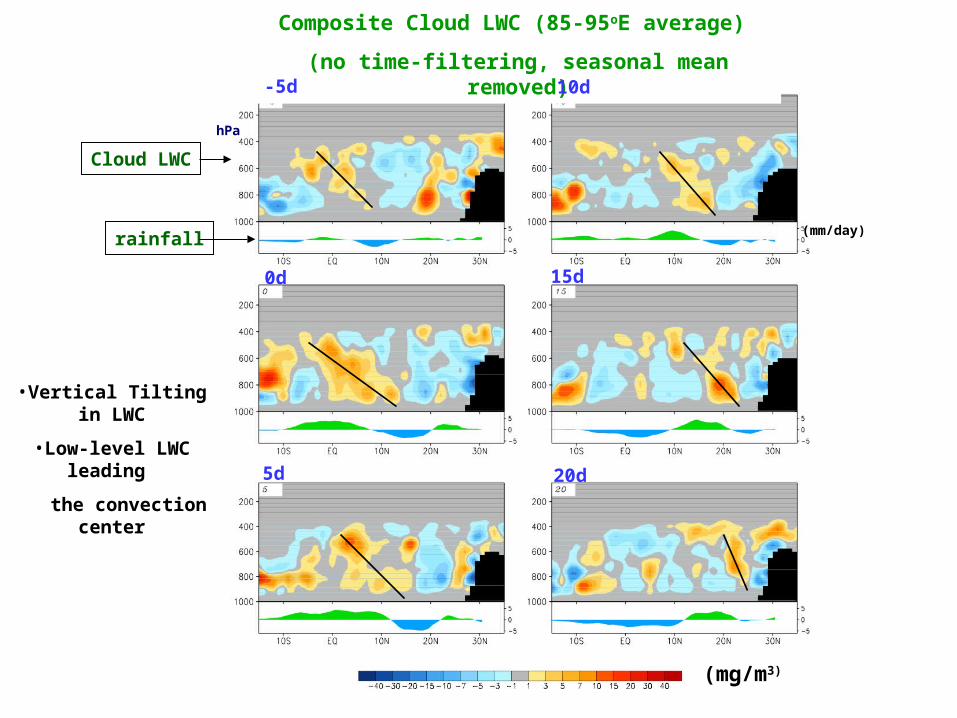
•Vertical Tilting in LWC
•Low-level LWC leading
the convection center
Composite Cloud LWC (85-95oE average)
(no time-filtering, seasonal mean removed)
(mg/m3)
hPa
(mm/day)
Cloud LWC
rainfall
-5d
0d
5d
10d
15d
20d

•IWC generally in phase with convection
Composite
Cloud IWC (mg/m3)
(85-95oE)
-5d
0d
5d
10d
15d
20d
hPa

•LWC variation associated with BSISV mainly related to
non-precipitating and drizzling mid-low clouds;
•Altocumulus cloud are crucial for mid-level LWC
variation;
•Stratocumulus cloud important in the low-level
with contribution from cumulus.
LWC by Cloud Types
Sc+Cu
AC
Total Non-precip Conditions
Total Precipitating Conditions
AC
Sc
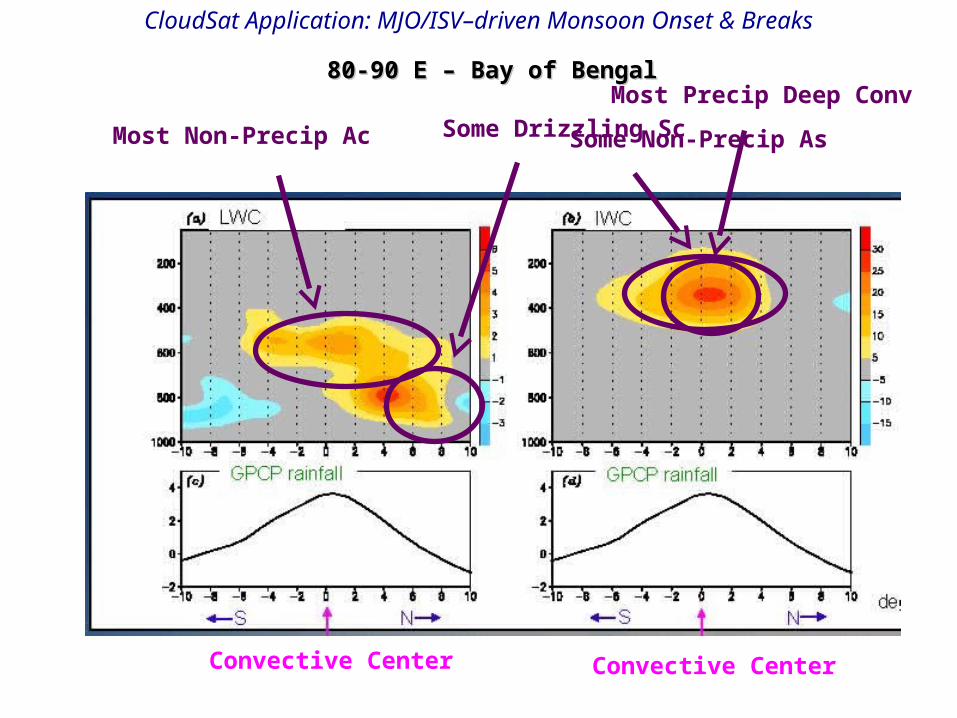
80-90 E – Bay of Bengal80-90 E – Bay of Bengal
CloudSat Application: MJO/ISV–driven Monsoon Onset & Breaks
Convective Center Convective Center
Some Drizzling ScMost Non-Precip Ac Some Non-Precip As
Most Precip Deep Conv

Summary: III
• During the northward propagation of the BS MJO, the cloud ice water
content (IWC) in upper troposphere tends to be in phase with
convection.
• A marked vertical tilting is discerned in cloud liquid water content (LWC)
with respect to the convection center. Increased LWC leads the
convection, particularly in the lower troposphere.
• IWC variability is largely associated with deep convective clouds; while
LWC is mainly linked to non-precipitating Altocumulus at mid-level and
drizzling Stratocumulus cloud at low-level; with the latter two appearing
to play a role in pre-conditioning for the northward propagation.

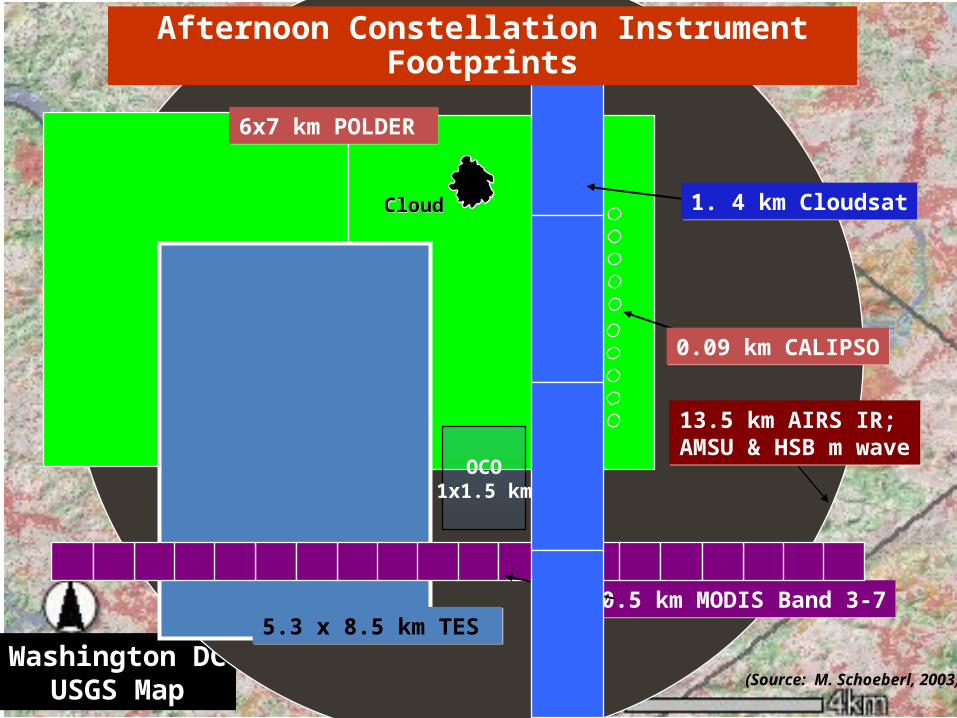
Washington DCUSGS Map
13.5 km AIRS IR; AMSU & HSB m wave
13.5 km AIRS IR; AMSU & HSB m wave
6x7 km POLDER 6x7 km POLDER
5.3 x 8.5 km TES 5.3 x 8.5 km TES
CloudCloud
0.5 km MODIS Band 3-70.5 km MODIS Band 3-7
0.09 km CALIPSO0.09 km CALIPSO
1. 4 km Cloudsat1. 4 km Cloudsat
OCO1x1.5 km
Afternoon Constellation Instrument Footprints
(Source: M. Schoeberl, 2003)
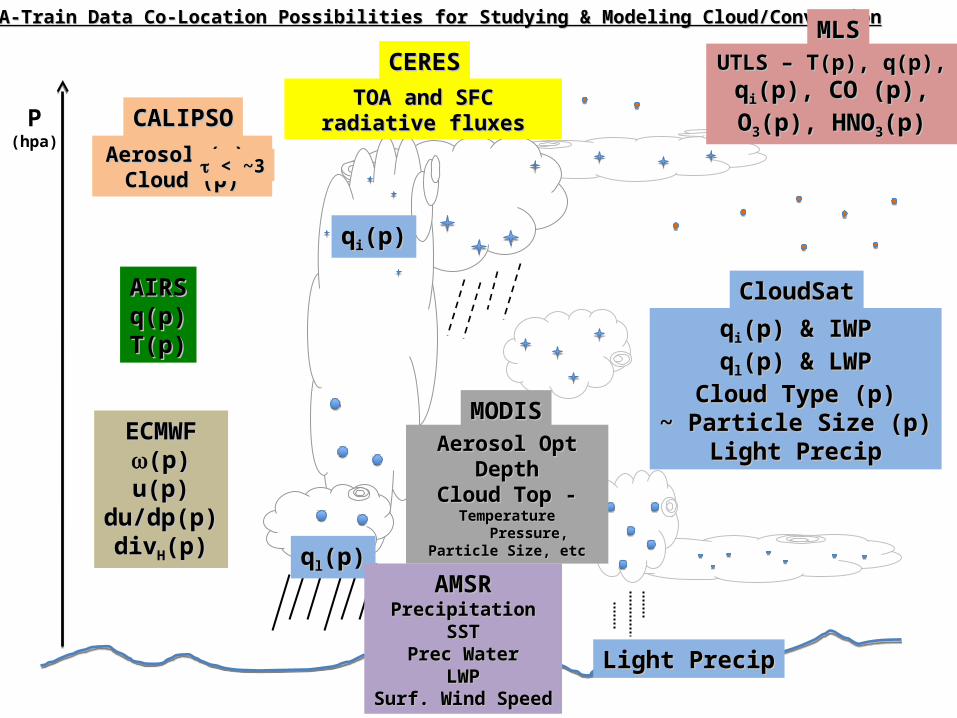
YOTC: A-Train Data Co-Location Possibilities for Studying & Modeling Cloud/ConvectionYOTC: A-Train Data Co-Location Possibilities for Studying & Modeling Cloud/Convection
P(hpa)
qqii(p)(p)
qqll(p)(p)AMSRAMSR
PrecipitationPrecipitationSSTSST
Prec WaterPrec WaterLWPLWP
Surf. Wind SpeedSurf. Wind Speed
AIRSAIRSq(p)q(p)T(p)T(p)
ECMWFECMWF(p)(p)u(p)u(p)
du/dp(p)du/dp(p)divdivHH(p)(p)
qqii(p) & IWP(p) & IWP
qqll(p) & LWP(p) & LWP
Cloud Type (p)Cloud Type (p)~ Particle Size (p)~ Particle Size (p)
Light PrecipLight Precip
Light PrecipLight Precip
CloudSatCloudSat
Aerosol Opt DepthAerosol Opt DepthCloud Top - Cloud Top -
TemperatureTemperature Pressure, Particle Size, Pressure, Particle Size,
etcetc
MODISMODIS
Aerosol (p) Aerosol (p) Cloud (p)Cloud (p)
CALIPSOCALIPSO
< ~3< ~3
UTLS – T(p), q(p), UTLS – T(p), q(p), qqii(p), (p),
CO (p), OCO (p), O33(p), (p),
HNOHNO33(p)(p)
MLSMLS
TOA and SFC radiative TOA and SFC radiative fluxesfluxes
CERESCERES