Embed Size (px)
Citation preview
Tropical Mid-Tropospheric CO2 Variability driven by the Madden-Julian Oscillation
King-Fai Li1, Baijun Tian2, Duane E. Waliser2, Yuk L. Yung1
1 California Institute of Technology, Pasadena2 Jet Propulsion Laboratory, Pasadena
Special Thanks to Dr. Peter Bechtold (ECMWF)Li et al. (2010), PNAS 107, 19171

Motivation
Chahine et al. [2008]
AIRS CO2 (~5 km) reveals influences from circulations Surface sources appearing in mid-troposphere
Convection and stratosphere-troposphere exchangeJet-streams, synoptic weather systems
How does tropical dynamics matter? [A54D-02: ENSO]
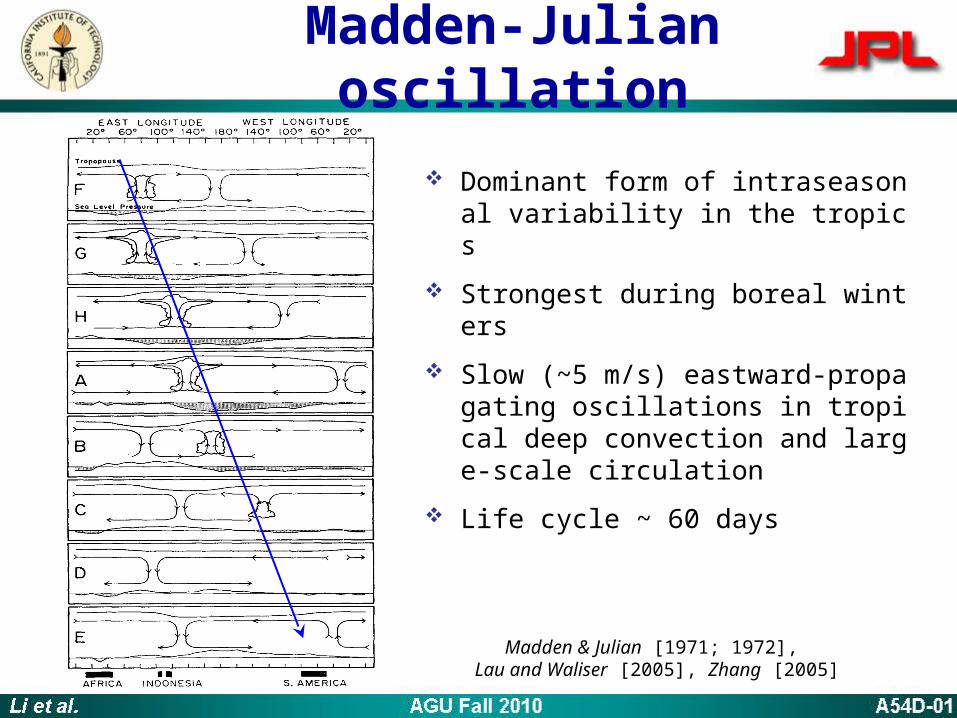
Dominant form of intraseasonal variability in the tropics
Strongest during boreal winters Slow (~5 m/s) eastward-propagatin
g oscillations in tropical deep convection and large-scale circulation
Life cycle ~ 60 days
Madden & Julian [1971; 1972], Lau and Waliser [2005], Zhang [2005]
Madden-Julian oscillation

Retrieved from 690 – 725 cm-1
2.5°×2° gridded Level 3 Cloud-cleared Nov 2002 – Feb 2010 Sensitivity peak at 5 – 10 km Accurate to 1 – 2 ppmv
AIRS CO2
Chahine et al. [2008]
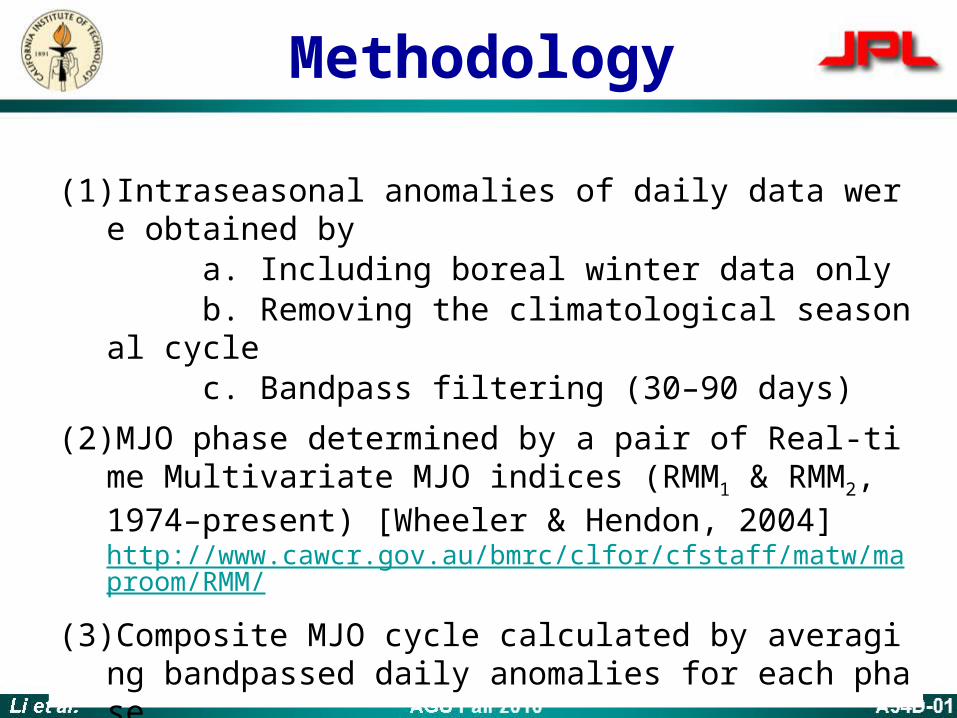
(1) Intraseasonal anomalies of daily data were obtained by a. Including boreal winter data onlyb. Removing the climatological seasonal cyclec. Bandpass filtering (30–90 days)
(2) MJO phase determined by a pair of Real-time Multivariate MJO indices (RMM1 & RMM2, 1974–present) [Wheeler & Hendon, 2004] http://www.cawcr.gov.au/bmrc/clfor/cfstaff/matw/maproom/RMM/
(3) Composite MJO cycle calculated by averaging bandpassed daily anomalies for each phase
Methodology
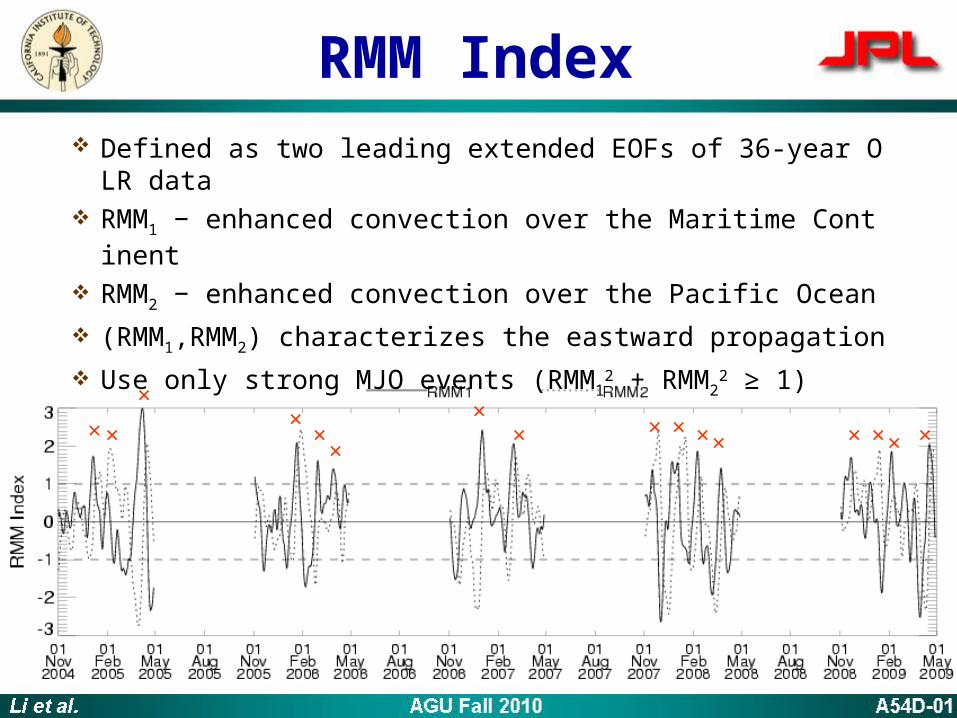
Defined as two leading extended EOFs of 36-year OLR data RMM1 − enhanced convection over the Maritime Continent RMM2 − enhanced convection over the Pacific Ocean (RMM1,RMM2) characterizes the eastward propagation Use only strong MJO events (RMM1
2 + RMM22 ≥ 1)
× ×
×× ×
× × × ×× × ×× ×××
RMM Index
Li et al., PNAS, 2010
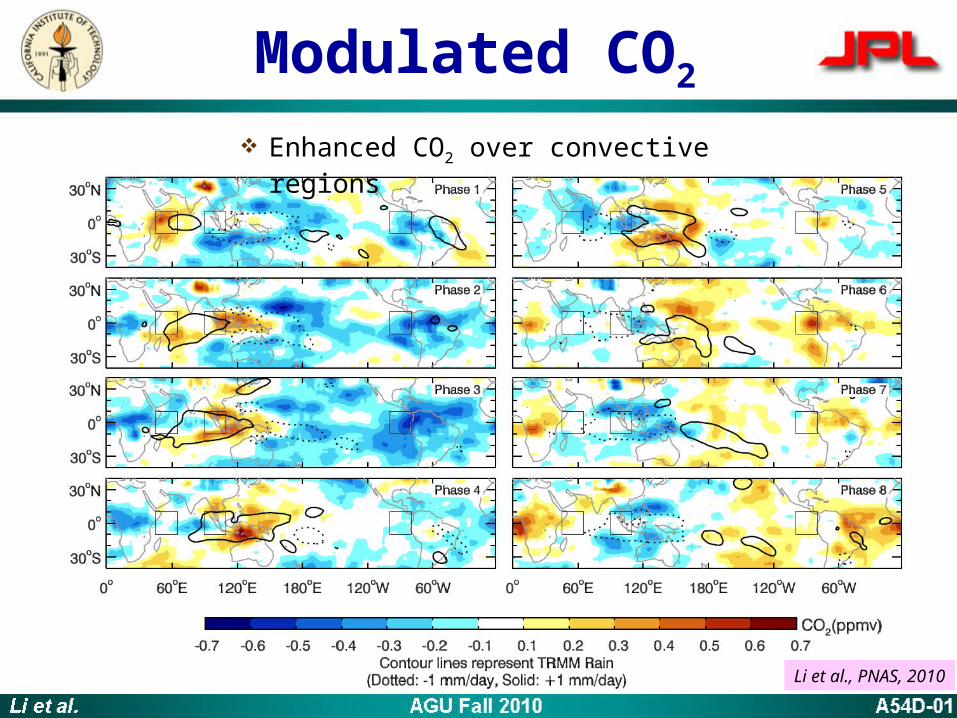
Modulated CO2
Enhanced CO2 over convective regions

Small Bias due to H2O Absorption
MJO of H2O at 600 hPa ≈ 1.4 g/kg [Tian et al., 2006] Potential Bias in CO2 ≈ 1.4 0.13 < 0.2 ppmv
Observations between 10°S – 10°N
Li et al., PNAS, 2010
Li et al., PNAS, 2010
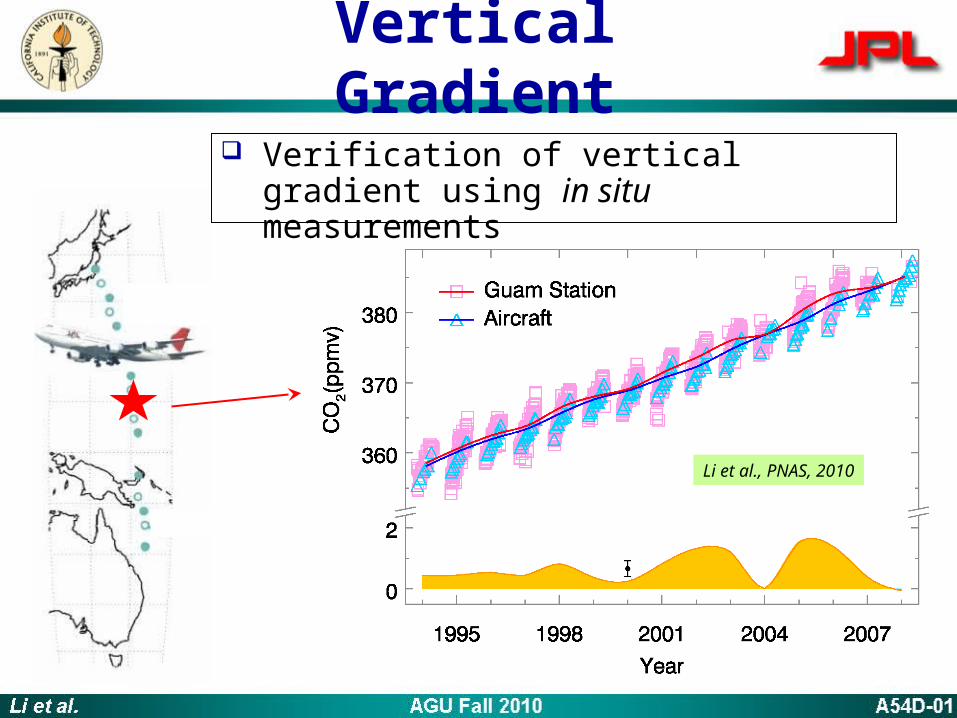
Vertical Gradient Verification of vertical gradient using
in situ measurements

First observation of intraseasonal variability in CO2
Lower-tropospheric vertical motions drive the MJO of mid-tropospheric CO2
Vertical gradients in CO2
Statistically robust > 20 MJO events and 9 millions of AIRS retrievals being used Negligible effects due to H2O
Average MJO amplitude ~1.5 ppmv = 0.5% Critical for determining surface CO2 sources and sinks [Rayner
& O’Brien, 2001]
Not seen in ECMWF’s GMES-MACC assimilated CO2 [provided by Dr. Bechtold] Relationship between tropical dynamics and CO2 not well unde
rstood
Summary

Li et al. AGU Fall 2010 A54D-01
Thank you!